Article

Design and Experimental Testing of a Control System for a Solid-Fertilizer-Dissolving Device Based on Fuzzy PID

Research Center of Fluid Machinery and Technology, Jiangsu University, Zhenjiang 212013, China
*
Author to whom correspondence should be addressed.
Agriculture 2022, 12(9), 1382; https://doi.org/10.3390/agriculture12091382
Submission received: 14 August 2022 / Revised: 28 August 2022 / Accepted: 1 September 2022 / Published: 3 September 2022
(This article belongs to the Special Issue Advances in Agricultural Engineering Technologies and Application)

Abstract

:
To overcome the problem of poor uniformity of solid-fertilizer-dissolving devices due to lag of fertilizer dissolution, a closed-loop control system based on fuzzy proportional-integral-derivative (PID) was designed and tested. A fertilizer concentration regulation model was then established according to the results. In this system, the control core was an STM32 used to feed back the fertilization concentration by detecting the electrical conductivity. For real-time adjustment of the fertilizer flow rate and water flow rate, a fuzzy PID control algorithm was utilized to compare the detected concentrations with the set concentrations. The linear relationships between quantities such as the fertilizer rate and PWM frequency, water flow rate and PWM duty ratio of the direct-current pump, and fertilizer concentration and electrical conductivity were all established to calibrate the system. The influence of the fertilizer flow rate and water flow rate on fertilizer concentration was determined by the control variable test method. The results showed a positive linear relationship between fertilizer concentration and fertilizer flow rate, while a reverse linear relationship was established between fertilizer concentration and water flow rate. After the introduction of the control system into the self-developed solid-fertilizer-dissolving device, the fertilizer concentration fluctuated near the set concentration in a range of no more than 1 g/L. After the disturbance of the fertilization device, the control system fine-tuned the device with a steady-state error of about 0.55 g/L after the system reached stability. The control system designed in this study was shown to run normally with good stability, speed, and accuracy, and with improved fertilization uniformity of the solid-fertilizer-dissolving device. This study lays the foundation for further study of fertilization control systems. It also provides a reference for the development of precise and intelligent fertigation.

1. Introduction

Fertigation is a planting technology combining irrigation with fertilization to achieve precise irrigation and uniform fertilization according to the soil conditions, water requirements, fertilizer requirements, and nutrient contents of different crops [1,2,3]. The fertigation technology can greatly improve the conservation of water and fertilizer, as well as enhancing the quality and yield of crops [4,5]. With the continuous development of modern agriculture, fertigation is developing towards low energy consumption and intelligence [6].
In recent years, various fertigation equipment and control systems have been developed based on many technologies [7]. For instance, Leedy et al. [8] designed a fertilizer distribution device for a sprinkler irrigation system to achieve fertigation. However, their system required prior mixing of water and fertilizer in the device. Zhang et al. [9] designed a control system to detect the temperature, humidity, illumination, and substrate moisture content of crops in a greenhouse with real-time feedback. Using multi-information data fusion modeling, the authors then designed a device that could dynamically control irrigation and fertilization and achieve accurate control of the ratio of liquid fertilizer and water. Yang et al. [10] proposed a fertilization device combining allocation algorithm estimation and a precision fertilization control model to ensure an optimal control process. Anthony et al. [11] designed a liquid fertilizer fully mixed with water injected into the pipeline of the spraying system to achieve uniform distribution of the fertilizer in water flow.
In terms of fertigation control systems, Wang et al. [12] adopted a segmented control strategy to solve problems, such as lag and instability of EC values in the detection of water and fertilizer mixtures during vegetable production to effectively overcome overshoot. Bi et al. [13] integrated fuzzy PID based on grey prediction to control the fertigation process and achieve precision irrigation of water and fertilizer. Wang et al. [14] developed a remote automatic irrigation control system for strawberries based on PLC and configuration software. Zhang et al. [15] proposed an adaptive nonlinear model identification control algorithm for the integrated irrigation of water, fertilizer, and medicine in a greenhouse. Peng et al. [16] designed an intelligent fertigation system using the Internet of Things, big data, and other technologies to combine expert experience and agricultural technology for providing the optimal irrigation scheme according to the collected information and experience. Sun et al. [17] designed an integrated control system for water and fertilizer based on neural network prediction and fuzzy control.
The traditional water and fertilizer control system is often suitable for small lags. However, the stability of the control system greatly affects control systems with severe lags [18]. PID control has defects that are greatly influenced by the external environment, and the parameter settings are often complex. However, the operation of proportional-integral-derivative (PID) control is simple and widely used [19,20]. Fuzzy control does not require the establishment of mathematical models, but needs control rules to be set according to control experience. However, since no integral part exists, the steady-state error is often difficult to eliminate [21,22]. Therefore, PID control and fuzzy control can be combined to obtain an accurate water and fertilizer control system [23].
Current research dealing with fertigation control systems and equipment uses liquid fertilizer or dissolves the solid fertilizer ahead of the application. In the present work, a control system for the dissolution of solid fertilizer was designed using a fuzzy PID algorithm to solve the lag of solid fertilizer dissolution. The control system was applied to the self-developed solid-fertilizer-dissolving device to adjust the working parameters in real time according to the set concentration. The results showed that the fertilizer concentration could be stabilized around the set value, solving the problem of poor fertilizer uniformity caused by the lag of solid fertilizer dissolution.

2. Design of the Solid-Fertilizer-Dissolving Control System

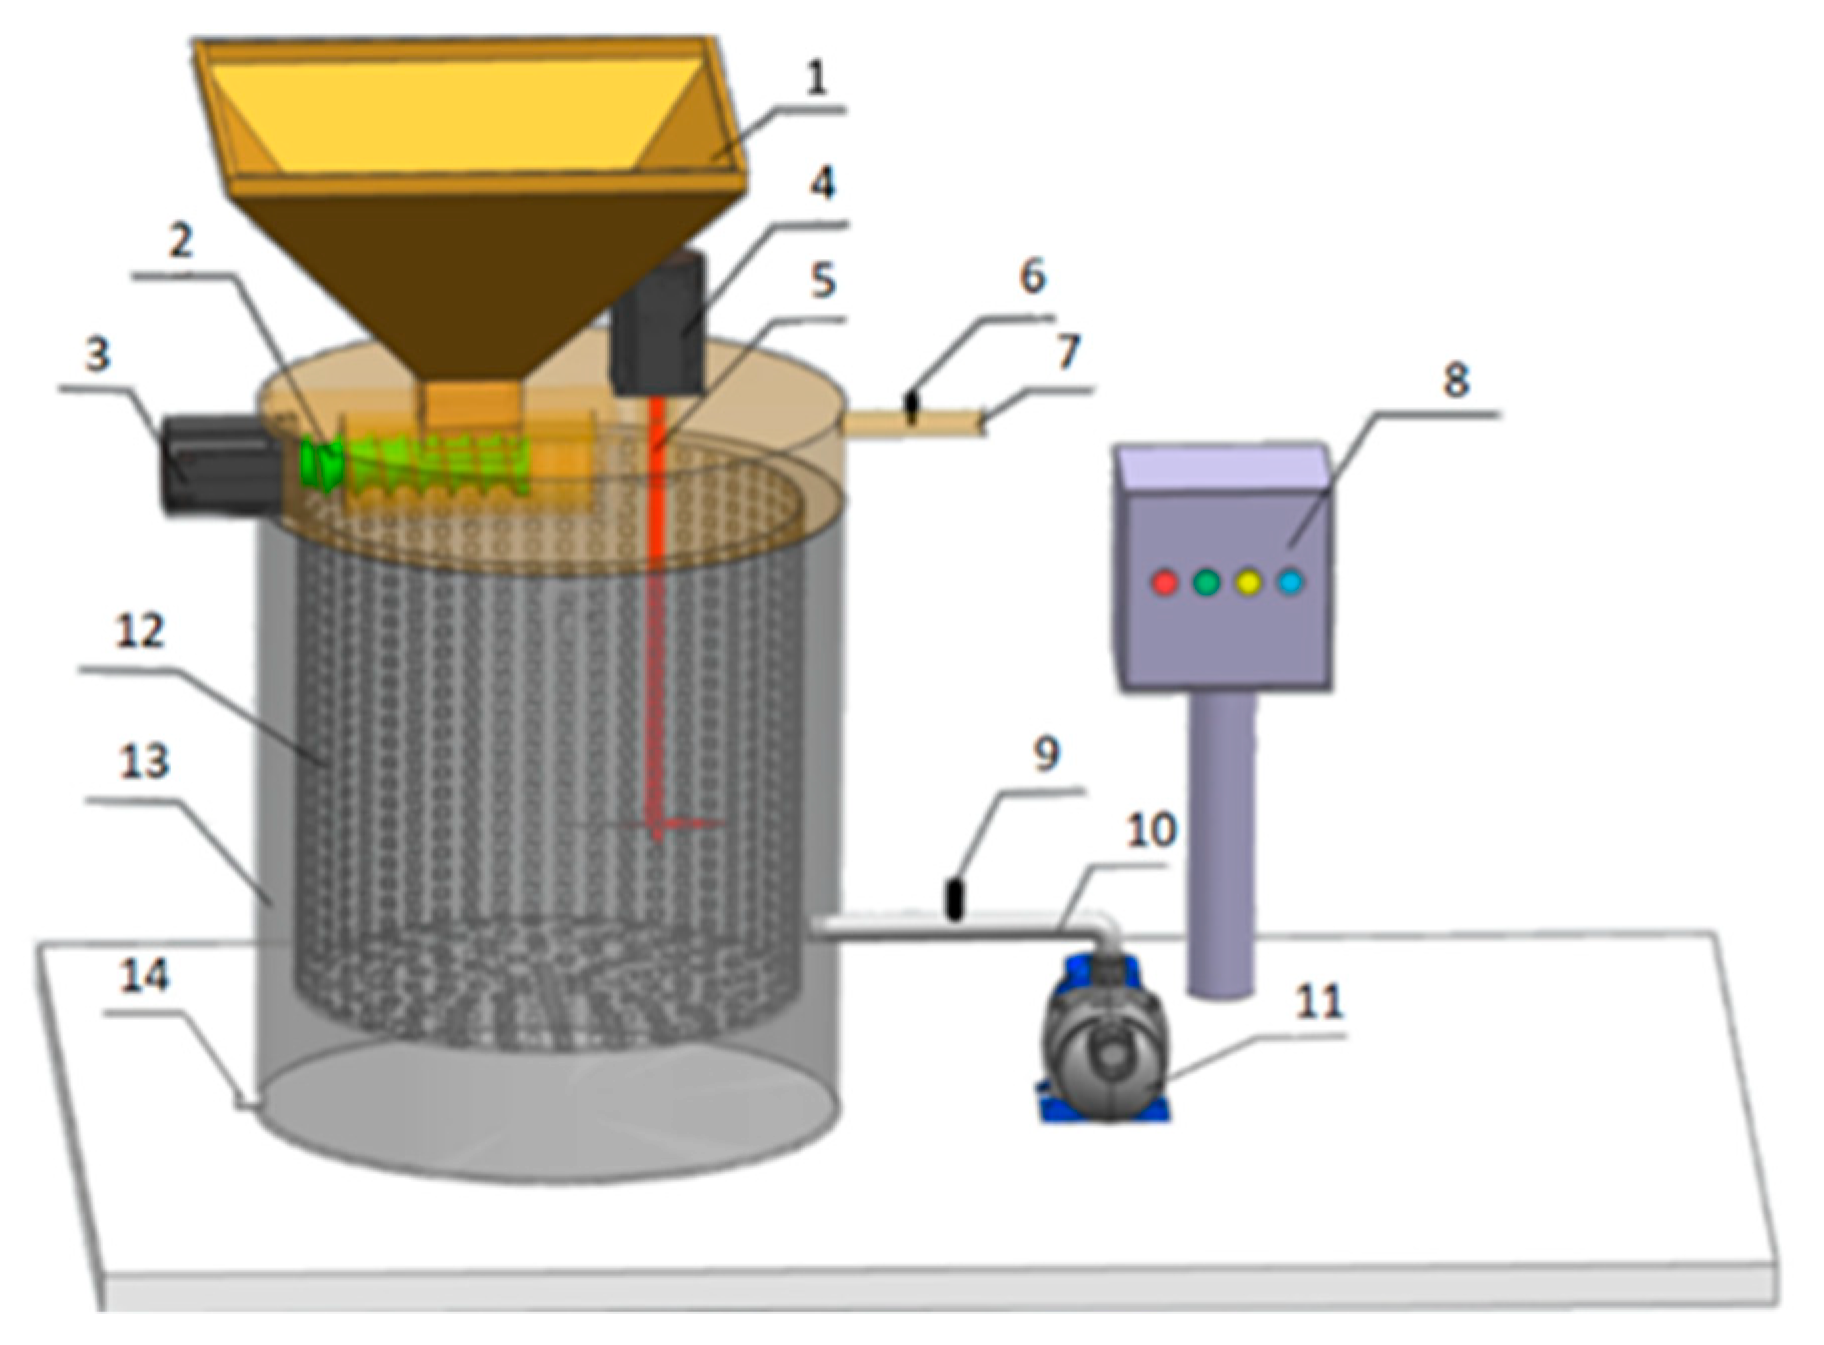
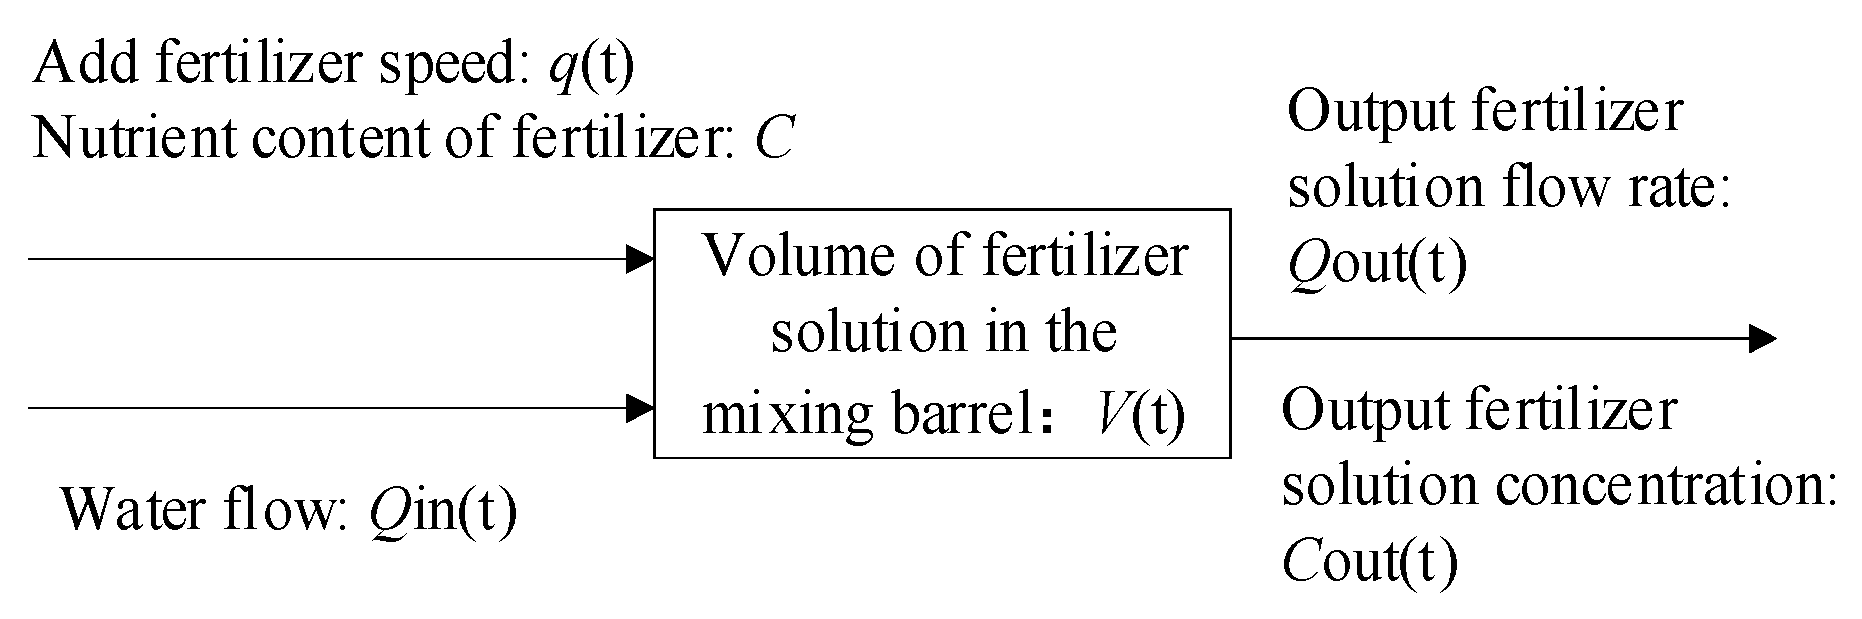
2.1. Structure and Working Principle of the Solid-Fertilizer-Dissolving Device

The structure of the dissolving device is shown in Figure 1. The system mainly consists of the fertilizer-adding part, mixing part, and control part. The fertilizer-adding part is mainly composed of a hopper, screw rod, and stepping motor, allowing the addition of solid fertilizer according to the set rate. The mixing part consists of a direct-current motor, a mixer, a filter, a mixing barrel, and a direct-current pump, all used to fully mix the water and solid fertilizer. The filter is installed in the stirring drum and used to screen the water-insoluble impurities in the solid fertilizer. The control part consists of a flow sensor, EC sensor, and circuit board installed in the control cabinet. Meanwhile, the circuit board in the control cabinet is used to control the stepping motor, direct-current motor, and direct-current pump, as well as to process the signals collected by the flow sensor and the conductivity sensor. Additionally, the water inlet pipe extends to the outer wall of the filter through the mixing barrel. In this way, the water inlet pipe impacts the solid fertilizer accumulated at the bottom to accelerate the dissolution of the fertilizer. On the other hand, the fertilizer solution outlet pipe also extends to the outer wall of the filter through the mixing barrel. The EC sensor is installed on the fertilizer solution outlet pipe to measure the fertilizer solution’s concentration at the device outlet. Finally, a sewage outlet pipe is used to discharge excess residual fertilizer solution.

2.2. Design of the Control System

2.2.1. Design of the Hardware System

The main controller of the solid fertilizer dissolution control system was an STM32, used for processing and sending signals [24]. The hardware design of the control system included three parts: (i) fertilizer flow rate control, (ii) water flow rate control, and (iii) fertilizer solution concentration detection. The fertilizer flow rate control was achieved by changing the speed of the stepping motor. In other words, faster speeds of the stepping motor would yield faster fertilizer flow rates. The stepping motor turned the electric pulse signal into angular displacement through the driver. Therefore, a PWM wave with a duty ratio of 50% and adjustable frequency was set as a pulse signal input to the front end of the stepping motor’s drive circuit, and the output of multiple pulse numbers was determined through interrupt counting. In addition, a timer function was used to stop and start the stepping motor.
The adjustment of the water flow rate was achieved by changing the motor speed of the direct-current pump. To solve the problem of insufficient driving ability of the single-chip microcomputer’s output signal, a full-bridge driving circuit was employed to control the speed of the direct-current motor, which then controlled the direct-current water pump [25]. The flow of the direct-current water pump was regulated by a PWM wave with different duty cycles given by the single-chip microcomputer. After completing the water supply, the timer was turned off to stop the operation of the direct-current water pump. An input-level sensor was also used in this design for real-time monitoring of the height of the fertilizer solution present in the bucket [26]. When the liquid level in the fertilizer barrel exceeded the preset dangerous liquid level, the power supply of the device was cut off automatically to prevent the fertilizer from overflowing. This design indirectly detects the concentration of the fertilizer solution by estimating the EC value of the fertilizer solution exported by the device. The EC value of the fertilizer solution was measured by the conductance electrode. The detection circuit was mainly composed of an RC oscillator, Schmidt trigger, and binary divider.

2.2.2. System Software Design

In the second part, reserved for adding the fertilizer, a stepping motor was used to adjust the amount of fertilizer in real time to achieve precise fertilizer allocation. The stepping motor drive flowchart is provided in Figure 2.
The stepping motor drive functioned as a timer. Firstly, the timer was initialized, and the count started after assigning the initial value. The output pulse wave drove the motor to rotate, and the encoder fed back the motor speed. The control system then fine-tuned the stepping motor according to the relationship between the stepping motor speed and amount of added fertilizer to control the fertilizer flow rate. At relatively fast speeds of the stepping motor, the pulse frequency was reduced; otherwise, it increased. After complete addition of the fertilizer, the timer was turned off, and the stepping motor stopped running.
The direct-current water pump in the water supply section was adjusted by PWM and enabled the signal given by the single-chip microcomputer. The current signal was generated upon water flowing through the flow sensor, while the voltage signal was obtained through the I/U conversion circuit. The single-chip microcomputer was used to measure the average voltage after sampling several times, followed by converting the water flow rate according to the relationship between voltage and flow rate. This would adjust the PWM duty cycle, thereby controlling the water flow rate.
To produce signal acquisition conductance electrodes through the design of a signal conditioning circuit and a stable output voltage signal, the ADC was sampled many times by the single-chip microcomputer to calculate the average voltage. To reduce the error, the EC value of the fertilizer solution was calculated according to the numerical relationship between the voltage and the electrode range. Finally, the fertilizer solution concentration was converted according to the functional relationship between the fertilizer solution concentration and the electrical conductivity calibrated experimentally. The program flowchart of fertilizer solution concentration detection is depicted in Figure 3.

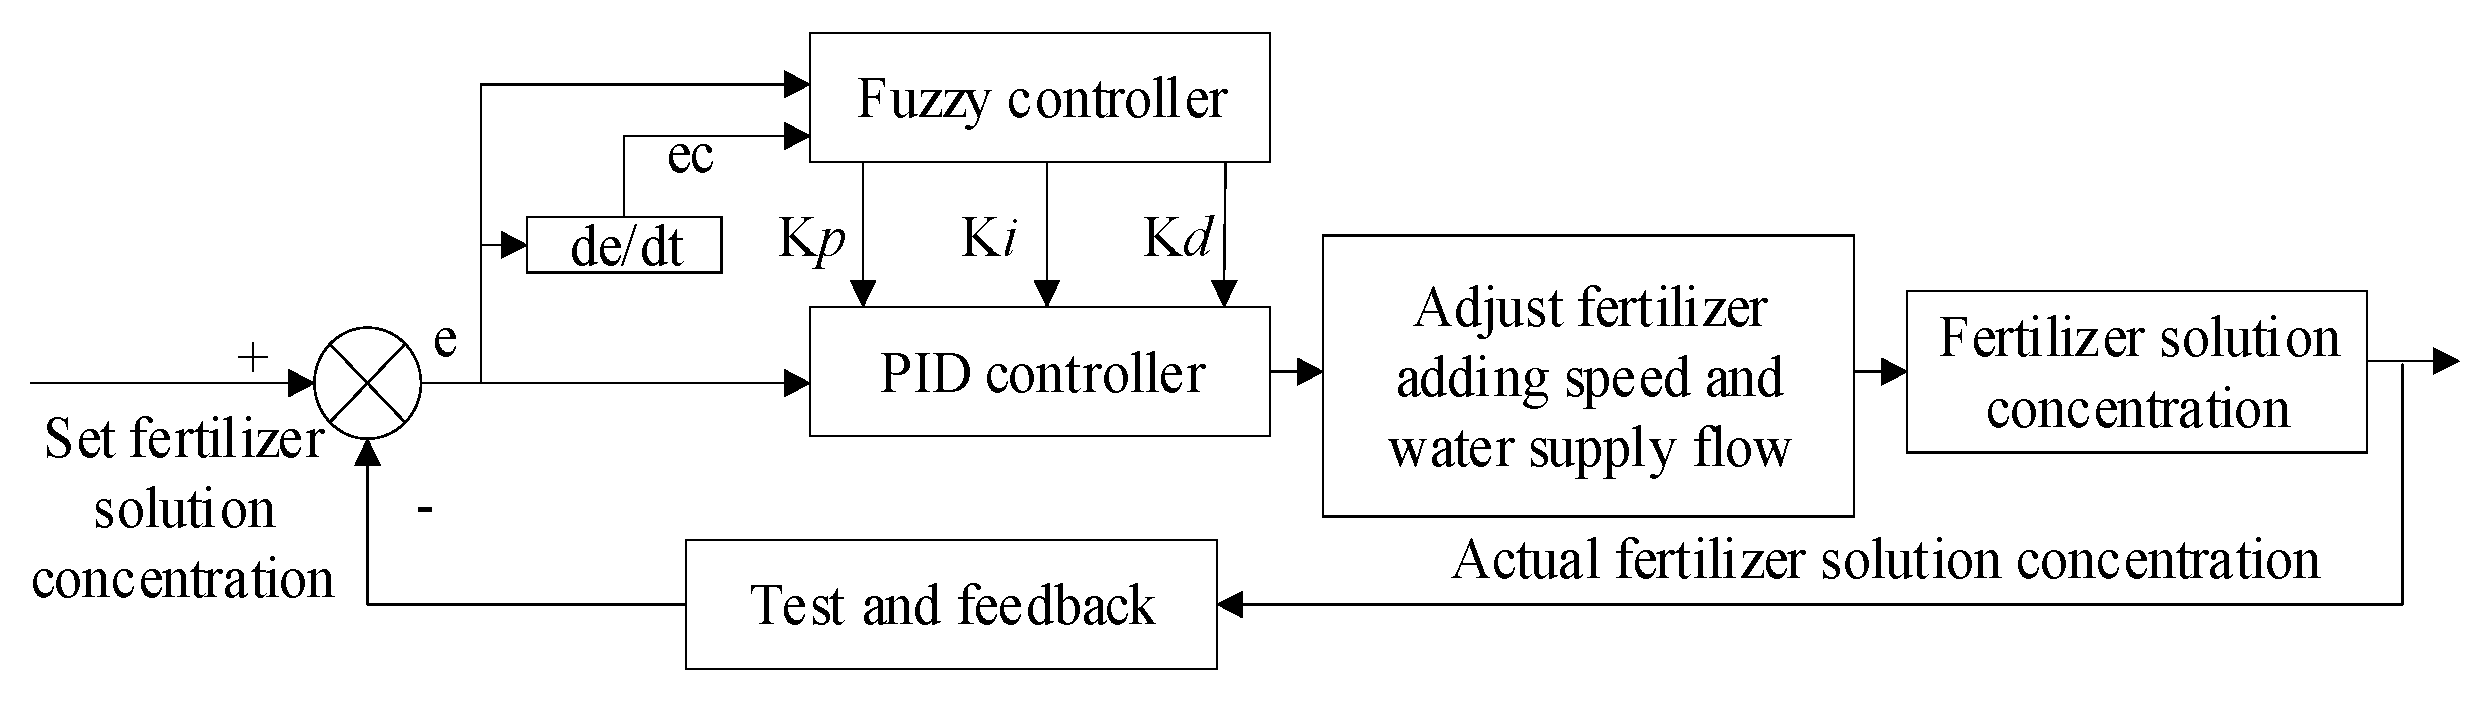
2.2.3. Design of the Closed-Loop Feedback System Based on Fuzzy PID

Since the dissolution and application of water and fertilizer occurred in real time, great uncertainty should be expected. To obtain better control of the water and fertilizer dissolution, a simplified dynamic model of dissolution was thus established to analyze the changing characteristics of the dissolution process by ignoring other interfering factors and assuming mixed fertilizer barrels with an unchanged liquid level. Moreover, the liquid fertilizer product remained the same, and the input of the whole fertilizer mixing process for solid fertilizer and water supply after the solid fertilizer and water were mixed adequately yielded a uniform fertilizer solution concentration. The latter was used as the output for the solution of mixed fertilizer. The dynamic model of the composting process established in this paper is illustrated in Figure 4.
According to the principle of fertilizer balance, Equation (1) can be obtained when the system reaches dynamic equilibrium. This can be accomplished by following the conservation of fertilizer quantity. Furthermore, Equation (2) can be obtained by following the conservation of fertilizer solution volume in the fertilizer mixing barrel.
d [ V ( t ) C o u t ( t + τ ) ] d t = C q ( t ) Q o u t ( t ) C o u t ( t + τ )
d V ( t ) d t = Q i n ( t ) + q ( t ) Q o u t ( t )
Equation (3) consists of the following hypothetical condition:
Q i n ( t ) + q ( t ) = Q o u t ( t )
After substituting Equations (2) and (3) into Equation (1), the dynamic expression of the fertilizer mixing process can be obtained:
V ( t ) d C o u t ( t + τ ) d t + Q o u t ( t ) C o u t ( t + τ ) = C q ( t )
where Qin(t) is the water flow rate (m3/h), Q(t) represents the fertilizer addition rate (kg/min), C is the nutrient content of the fertilizer, Qout(t) denotes the flow rate of the output fertilizer solution (m3/h), Cout(t) is the concentration of the output fertilizer solution (g/L), and V(t) refers to the volume of the fertilizer solution in the fertilizer mixing barrel (L).
Equation (4) is a simplified dynamic model of solid fertilizer dissolution and the application process integrating water and fertilizer. Based on this model, PID control and fuzzy control were further adopted in this study to set the control parameters of both fertilizer flow rate and water flow rate in the software program, so as to accurately adjust the fertilizer concentration at the outlet of the mixing equipment. Fuzzy control includes three processes: (i) fuzzy, (ii) fuzzy control rules, and (iii) defuzzification [27]. Such a design achieves several features: The first consists of fertilizer solution concentration values as input variables in the system. The second concerns the preliminary test data as the fuzzy rules to detect the fertilizer solution concentration as the feedback variable system. The third deals with input variables after variable feedback by defuzzification to adjust the fertilizer solution concentration until meeting the preset fertilizer solution density. According to the deviation e(t) between the given value r(t) of the system and the output response c(t), the PID controller uses the PID algorithm to calculate the control quantity and adjust the concentration of the fertilizer solution. The control law can be expressed as follows:
U ( t ) = K p { e ( t ) + 1 T i 0 t e ( t ) d t + T d d e ( t ) d t }
among the following quantities:
e ( t ) = r ( t ) c ( t )
where Kp is the proportional gain, Ti represents the integral time constant, Td is the differential time constant, e(t) refers to the control deviation (g/L), r(t) is the set fertilizer solution concentration (g/L), and c(t) denotes the actual fertilizer solution concentration (g/L).
In the actual control process, sampling the concentration of the fertilizer solution at different times was necessary to calculate the deviation in the concentration of the fertilizer solution, as well as to calculate the control quantity to necessary achieve good control of the system. Therefore, the above continuous formulae required discretization. The discretized PID consisted of two forms: (i) position, and (ii) incremental [28].
  • Position PID control algorithm
    At extremely small sampling periods, multiple sampling time points kT were set to replace the continuous time t. The sum of the deviation of all time points was replaced by integration, and the deviation increment of adjacent time points was replaced by differentiation. The results can be obtained using Equations (7) and (8):
    0 t e ( t ) d t = i = 0 k T e ( i )
    d e ( t ) d t = e ( k ) e ( k 1 ) T
    where T is the sampling period and k represents the sampling serial number.
    Substituting Equations (7) and (8) into Equation (5) yields the position PID control algorithm formula:
    U ( k ) = K p { e ( k ) + T T i i = 0 k e ( i ) + T d T [ e ( k ) e ( k 1 ) }
  • Incremental PID control algorithm
    The incremental PID only outputs the incremental ∆U(k) of the control quantity. The output expression of (k − 1) times can be obtained from Equation (9):
    U ( k 1 ) = K p { e ( k 1 ) + T T i i = 0 k e ( i ) + T d T [ e ( k 1 ) e ( k 2 ) }
The incremental PID control algorithm formula can be obtained by subtracting Equations (9) and (10):
Δ U ( k ) = K p [ e ( k ) e ( k 1 ) ] + K i e ( k ) + K d [ e ( k ) 2 e ( k 1 ) + e ( k 2 ) ]
where Kp is the proportional gain, Ki represents the integral coefficient, and Kd is the differential coefficient.
According to Equation (11), only e(k), e(k − 1), and e(k − 2) would affect the output of delta ∆U(k) to reduce the influence of calculation error on the output control quantity. The control quantity U(k) in the position algorithm corresponds to the state of the controlled object. Upon disturbance of the control quantity and distortion of the signal, the controlled object produces a large error. Therefore, the incremental PID control algorithm was adopted in this paper. Fat-soluble solid fertilizer equipment, through the sensor detection and feedback of fertilizer solution concentration information, was used to determine the current time from the combination of fertilizer solution density deviation e and error change ec as inputs. This was set according to the fuzzy controller to meet the requirements of different PID parameter self-tuning times, real-time adjustment of the fertilizer flow rate, and real-time control of the water flow rate. The actual fertilizer solution concentration was then adjusted close to the preset value. The block diagram of the fuzzy PID control system is shown in Figure 5.

3. Test Scheme and Methods

The control system studied in this paper was designed to adjust the stepping motor speed by changing the PWM frequency. By varying the duty ratio of the PWM wave to adjust the water flow rate, the fertilizer solution concentration was determined by measuring the electrical conductivity. To precisely control and detect the solid fertilizer dissolution and application device using the control system, calibration of the relationships between the above parameters through experiments was necessary to establish the relationship of the control program. Furthermore, a dissolution and application device equipped with the control system was taken as the research object to analyze the control performance of the system. As shown in Figure 6b, a device performance test rig was built. A schematic diagram of the device performance test is shown in Figure 6a.
The experiments were carried out in the Sprinkler Irrigation Laboratory of the Fluid Mechanical Engineering Technology Research Center of Jiangsu University. To facilitate the observation, both the outlet pump and the inlet pump used direct-current water pumping. The white plastic bucket on the left-hand side stored the water for supply. The solid fertilizer was then added to the funnel of fertilizer inlet, followed by installing the sensors and control components, as well as other equipment. Next, the device was checked to ensure that it was in good condition, and then tested to confirm the relevant operation state.

3.1. Calibration Testing of the Fertilizer Addition Rate

In a previous study [29], the following formula was proposed to calculate the fertilizer rate:
q = 0.304 π ρ 1.036 ( D 2 d 2 ) 0.932 n 0.948 L 0.964 × 10 9
where q is the fertilizer flow rate (kg/min), ρ represents the fertilizer bulk density (kg/m3), n is the motor speed (r/min), D is the outer diameter of the screw (mm), d is the internal meridian of the screw (mm), and L denotes the screw pitch (mm).
In Figure 6b, the outer diameter, inner diameter, and pitch of the screw in the test bed are set to 25 mm, 12 mm, and 18 mm, respectively. As a result, the fertilizer flow rate in the testing bed can be calculated as follows:
q = 4.43 × 10 6 ρ 1.036 n 0.948
For the same fertilizer, the fertilizer flow rate was only related to the speed of the stepping motor, which can be adjusted through frequency. Therefore, calibration tests were carried out on the relationship between the speed of the stepping motor and the frequency. Here, the single-chip microcomputer sent PWM waves with frequencies of 120, 180, 240, 300, 360, 420, 480, 540, and 600 Hz. The number of turns driven by the motor to rotate the screw within 2 min was tested.

3.2. Calibration Testing of the Water Flow Rate

The water source bucket was filled with water. Moreover, the direct-current pump’s control duty ratio was adjusted to 15%, 20%, 25%, 50%, 75%, and 100%. The time taken for the water in the water source bucket to be pumped out was tested under different duty ratios. Finally, the time was converted into water flow rate and analyzed as a function of the duty ratio.

3.3. Calibration Testing of the Relationship between the Concentration and Conductivity of the Fertilizer Solution

In this experiment, two different kinds of fertilizer were tested to calibrate the test of the fertilizer solution concentration: the first consisted of potassium chloride (total nutrient: K2O ≥ 60%; average particle size: 0.60 cm), and the second was a compound fertilizer (N-P2O5-K2O: 17-5-7, total nutrient ≥ 24%, average particle size: 0.45 cm). Their saturated solubility at 20 °C was 0.230 and 0.922 g/cm3, respectively. Briefly, 1 L of water was put into the bucket, and 10 g of each fertilizer was poured in sequence and left to dissolve in the water. After even mixing, the EC value of the fertilizer solution was recorded after each dissolution. According to the scattered points of the recorded test data, the relationship between the concentration of fertilizer solution and the EC value was fitted through regression.

3.4. Effects of the Fertilizer Flow Rate and Water Flow Rate on the Fertilizer Solution Concentration

The changes in the fertilizer solution concentration under different fertilizer flow rates and water flow rates were investigated. Additionally, the variations in the fertilizer solution concentration after adding the control system were compared. According to Equation (13), stepping motor speeds of 60, 30, and 15 r/min led to corresponding fertilizer addition rates of 0.26, 0.13, and 0.07 kg/min, respectively. The respective water flow rates were 1.5, 1.0, and 0.5 m3/h. The fertilizer flow rate and water flow rate were tested in pairs, and the results are listed in Table 1.
The mean deviation was used to measure the dispersion degree of a set of data, but the stability of the fertilizer solution’s concentration required evaluation in this study [30]. Hence, Equation (14) was developed in this paper to calculate the fertilization uniformity coefficient of this system:
D S * = ( 1 A . D . C ¯ ) × 100 %
where DS* is the uniformity coefficient of fertilization (%), A.D. represents the average deviation of the concentration data (g/L), and C ¯ is the arithmetic mean value of the data (g/L).
To determine the long-term working state of the device, the dissolution and application time of each combination test was extended to 110 min. The fertilizer was then continuously added for the first 90 min and stopped for the last 20 min. After obtaining a stable test bed, the control variable test method was used for testing, and data under combined tests were obtained.

3.5. Control System Performance Testing

In practical applications, the fertilizer would take some time to dissolve completely. Thus, the control system developed in this study fine-tuned the fertilizer flow rate and water flow rate through fuzzy PID control to yield a stable concentration of fertilizer solution in the fertilizer application device. For this reason, the control performance of the control system was tested on the test platform (Figure 6b). Potassium chloride was employed as the test fertilizer; the initial water flow rate was set to 2 m3/h, and the fertilizer flow rate was 0.5 kg/min. The concentrations of the fertilizer solution were fixed at 2, 4, 6, 8, and 10 g/L. The electrical conductivity in the mixing barrel of the device equipped with a control system was converted into concentration. After completion of the setting, the test stand was started, and fertilizer was supplemented to the hopper at all times. The data were measured every 1 min from the start of the process, and the experiment lasted 90 min. The change in the fertilizer solution’s concentration in the mixed fertilizer barrel over time was plotted for analysis. The control system was evaluated in terms of three performance indicators (i.e., stability, rapidity, and accuracy) to analyze its performance. The three indicators of the control system were represented by specific parameters: Stability consisted of the time taken by the control system to return to the set value after adjusting the concentration of the fertilizer solution when interference was recorded as the adjustment time. Rapidity represented the time required for the fertilizer solution’s concentration to reach the set value from the beginning, denoted as the response time. Accuracy was the absolute value of the difference between the output value and the set value when the concentration of the fertilizer solution became stable, denoted as the steady-state error (Equation (6)).

4. Results and Analysis

4.1. Relationship between Fertilizer Flow Rate and PWM Wave Frequency

The relationship between speed and PWM wave frequency after testing is shown in Figure 7. An obvious linear relationship between motor speed and PWM wave frequency was observed. After fitting, the relationship between motor speed and PWM wave frequency can be expressed by Equation (15):
n = f / 4
where n is the stepping motor speed (r/min) and f represents the pulse frequency (Hz).
Substituting Equation (15) into Equation (13) yields the relationship between fertilizer flow rate and frequency:
q = 1.19 × 10 6 ρ 1.036 f 0.948

4.2. Relationship between Water Flow Rate and PWM Duty Cycle

The relationship between water flow rate and PWM wave duty cycle after testing is shown in Figure 8. After fitting, the relationship between the flow rate and PWM duty cycle can be expressed as follows:
q = 0.014 D C 0.05
where q is the water flow rate (m3/h) and DC refers to the duty ratio.
The experimental results showed a linear relationship between the water flow rate and PWM duty cycle.

4.3. Relationship between the Concentration of Fertilizer Solution and Electrical Conductivity

The experimental relationship between the concentrations of the potash fertilizer and compound fertilizer solution and the EC values is illustrated in Table 2. After fitting, an obvious linear relationship between the concentration of the fertilizer solution and the EC value was observed [31]. The relationship between the concentration of the fertilizer solution and the conductivity of the two fertilizers can be further obtained by Equations (18) and (19):
CK = 0.48EC − 2.5
CF = 0.92EC − 0.92
where CK represents the concentration of the potash fertilizer solution (g/L), CF is the concentration of the compound fertilizer solution (g/L), and EC is the conductivity value of the fertilizer solutions (mS/cm).
After fitting, the correlation coefficients of the potash fertilizer solution concentration, compound fertilizer solution concentration, and EC value were estimated to be 0.999, 0.96, and 0.97, respectively. The linear relationship between the concentration of the potash fertilizer solution and the EC value was the best. Therefore, the potash fertilizer was used as the test fertilizer in subsequent experiments to improve the control accuracy of the fertilizer solution concentration. The control system of the designed fertilizer solution concentration detection process only required conversion of the EC value of the fertilizer solution to yield the concentration of the fertilizer solution.

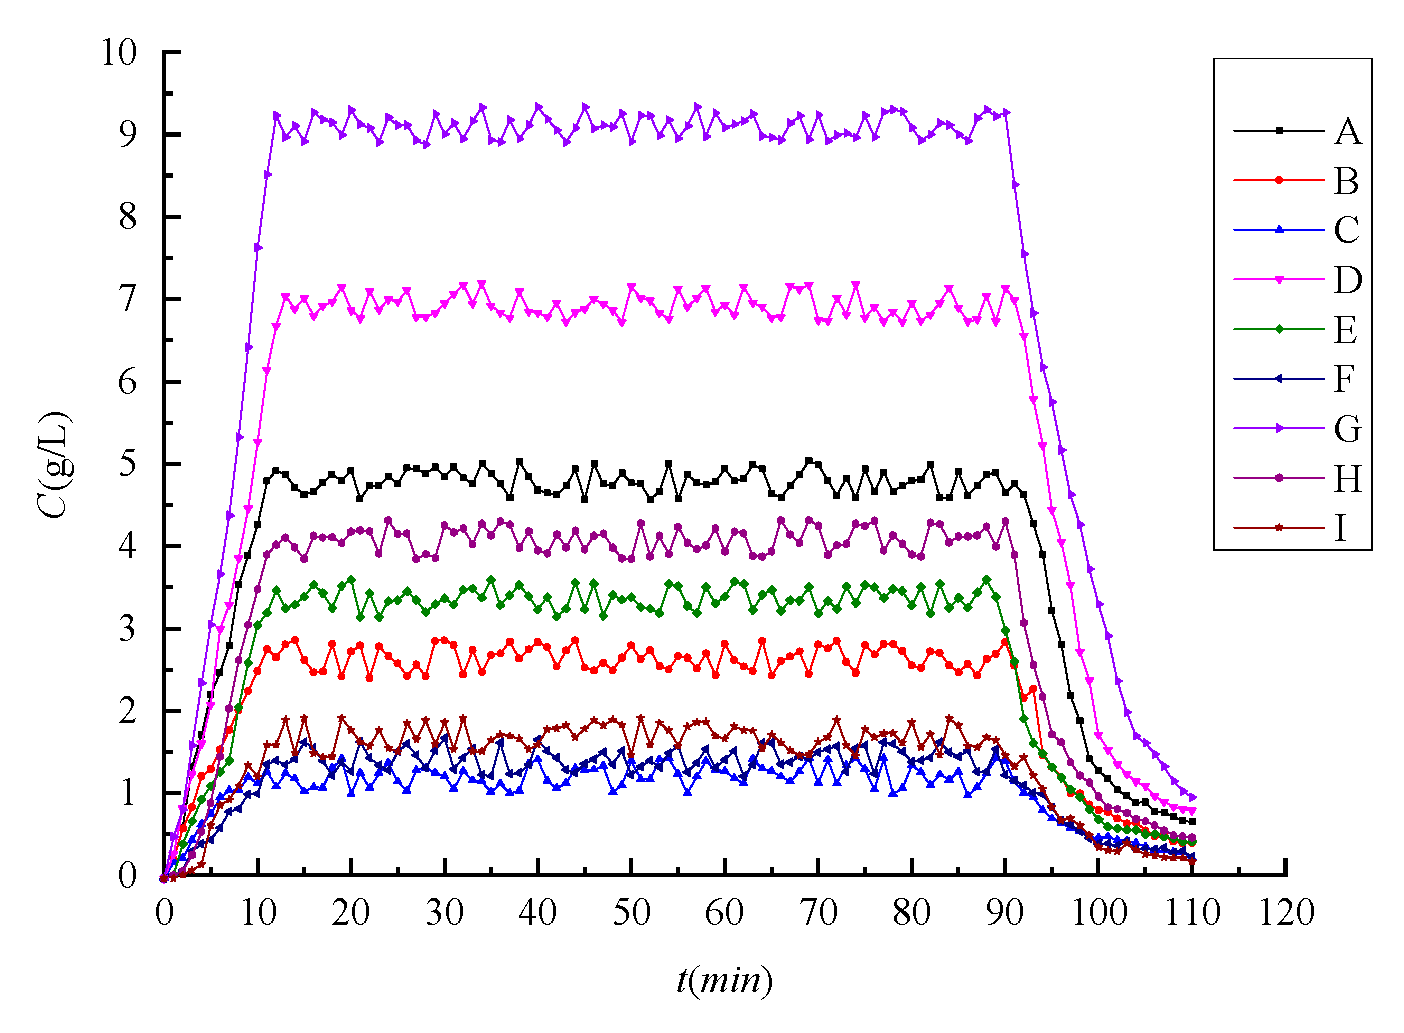
4.4. Influence of the Control System on Fertilizer Solution Concentration

The variation curves of fertilizer concentration over time, with or without a control system, in different modes, are depicted in Figure 9 and Figure 10. In different modes and after some time, the concentration of the solution reached a stable value. When the concentration of the fertilizer solution changed greatly, the control system adjusted to ensure the stability of the concentration of the fertilizer solution. Comparing Figure 9 and Figure 10, it can be seen that the uniformity and stability of the fertilizer solution’s concentration were significantly improved using the control system.
Based on Equation (14), the fertilization performance parameters of the dissolution and application device were obtained when the control system was adjusted (Table 3). According to the uniformity coefficient of fertilization, the stability of the fertilizer solution’s concentration was significantly improved when the fertilizer was regulated by the control system. The uniformity coefficient of fertilization in each mode reached more than 65%, with an average of 69.16% and a maximum of 74.58%. Using the control variable method, A-B-C, D-E-F, and G-H-I were divided into three groups. When the water flow rate was constant, the concentration of the fertilizer solution increased with the fertilizer flow rate until reaching a stable value, with an approximately positive linear relationship. A-D-G, B-E-H, and C-F-I were divided into three groups. When the rate of fertilizer addition was constant, the change trend of the fertilizer solution’s concentration was similar, while the stable value appeared different. The fertilizer solution concentration increased as a function of the decrease in the water flow rate until reaching a stable value, with a negative linear relationship.

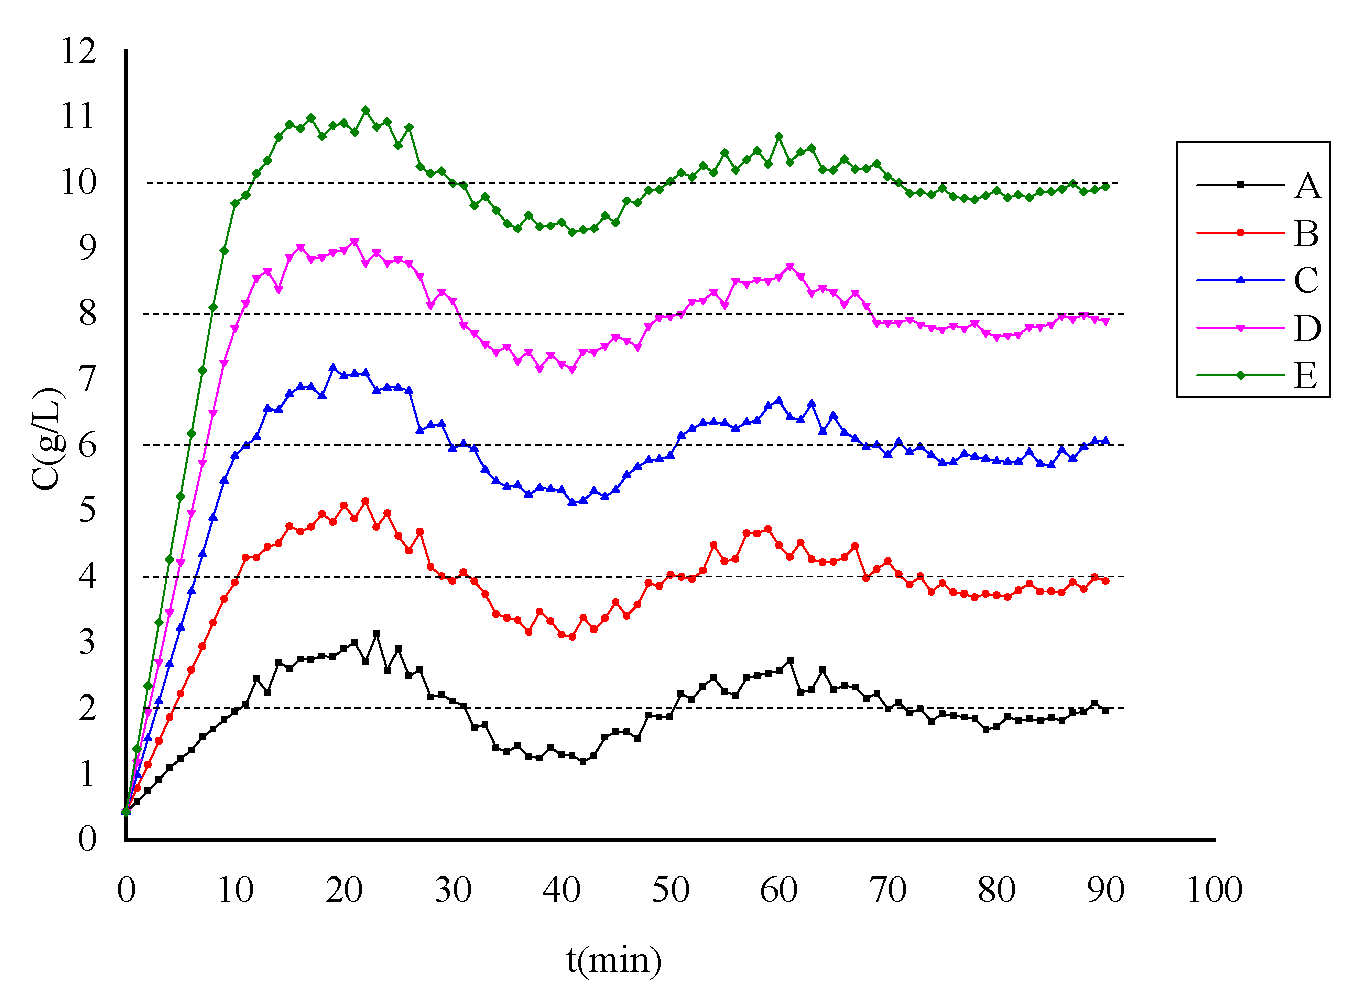
4.5. Control System Performance

After setting the target fertilizer concentration at the outlet of the fertilizer mixing barrel, the actual fertilizer concentration was measured, and the change curve of fertilizer concentration was obtained. In Figure 11, A, B, C, D, and E represent the fertilizer solution concentration change curves with the set values of 2, 4, 6, 8, and 10 g/L, respectively. It can be seen that the export of fertilizer solution concentration reached a set value after a certain time to prevent any further rise in the fertilizer solution concentration, which would yield excessive overshoot. Thus, the software program limited the range within ±1 g/L, so that the fertilizer solution concentration under the adjustment of the control system slowly became close to the set value. Over time, the concentration of the fertilizer solution fluctuated less from the the set concentration.
The related performance indices of the control system are shown in Table 4. The concentration of the fertilizer solution changed stably after controlling the solution application device with the automatic control system and fuzzy PID control algorithm. After setting the target concentration of the fertilizer solution, the control system quickly responded to the target value, with a response time of about 10 min. After reaching the target value, the fluctuation range of the fertilizer solution’s concentration did not exceed 1 g/L, leading to a time of about 10 min from the addition of the fertilizer to its complete dissolution. After interference, the system was fine-tuned. The adjustment time from the beginning to the dissolution and stabilization of the fertilizer solution was 20 min, with a steady-state error of about 0.55 g/L. After about 1.5 h, the concentration of the fertilizer solution became consistent with the set value. Overall, the design of the control system showed good stability, speed, and accuracy.

5. Discussion

In order to solve the problem of poor fertilization uniformity caused by the decomposition hysteresis of solid fertilizer, a system combining fuzzy PID control with a fertilization device was proposed, and achieved continuous and stable output of the fertilizer solution, which was verified by tests to have good fertilization uniformity. This paper explores the relationship between fertilizer flow rate and pulse-width-modulated wave frequency. The results were consistent with those of Mirzakhaninafchi et al. [32], who used a PWM valve to change the speed of a hydraulic motor and then adjust the feeding amount. The relationship between the concentration of fertilizer solution and the electrical conductivity was also investigated. Saiful et al. [33] tested the relationship between the volume of liquid fertilizer and the EC value, and obtained the same linear fitting relationship as in this study. The control system was evaluated in terms of stability, speed, and accuracy, and its superiority was verified. This study lays the foundation for further study of fertilization control systems. It provides a reference for the development of precise and intelligent fertigation. In future research, it will be possible to develop more intelligent and widely applicable systems. For example, the control system of the Internet of Things could be applied in fertigation, enabling greater efficiency.

6. Conclusions

In this study, a solid fertilizer dissolution and application control system based on a fuzzy PID algorithm was designed and tested as a self-developed fertigation device. The control system consisted of the control of fertilizer flow rate and water flow rate, and the detection of fertilizer concentration. The precise adjustments of fertilizer flow rate and water flow rate were achieved. The fertilizer flow rate and water flow rate were changed in real time to ensure the uniform and adjustable concentration of the fertilizer solution at the outlet of the mixing equipment.
The relationship between fertilizer flow rate and PWM wave frequency, water flow rate, and PWM wave duty ratio, as well as the relationship between the concentration of the fertilizer solution and the electrical conductivity of two common solid fertilizers, was determined to provide theoretical guidance for the improvement of the control system program.
Using the control system, the uniformity of fertilization reached more than 65%, with a maximum of 74.58%. The dissolving device with the control system quickly responded to the target value, and the fertilizer concentration fluctuated within the range of the set value (at most ±1 g/L). The response time from the beginning of the system to the complete dissolution of fertilizer was about 10 min, and the adjustment time from the fine-tuning of the system to the stabilization was around 20 min. The steady-state error was estimated to be about 0.55 g/L, showing good stability, speed, and accuracy. After verifying the regulation using the control system, the device had better fertilization uniformity, solving the problem of solid fertilizer dissolution hysteresis.

Author Contributions

Conceptualization, X.S. and H.L.; methodology, X.S., C.C., H.X. and Z.Z.; validation, X.S.; formal analysis, X.S., C.C. and P.T.; investigation, X.S., C.C. and P.T.; data curation, X.S.; writing—original draft preparation, X.S.; writing—review and editing, P.T. and C.C.; visualization, X.S.; supervision, P.T. and C.C.; project administration, H.L. All authors have read and agreed to the published version of the manuscript.

Funding

This work was supported by the National Natural Science Foundation of China (grant number 51939005); the Key Research and Development Program of Jiangsu Province (grant number BE2021340, BE2021379); and Demonstration and Promotion Project of Modern Agricultural Machinery, Equipment, and Technology of Jiangsu Province (NJ2021-24).

Institutional Review Board Statement

Not applicable.

Informed Consent Statement

Not applicable.

Data Availability Statement

Not applicable.

Conflicts of Interest

The authors declare no conflict of interest.

References

  1. Tang, P.; Li, H.; Issaka, Z.; Chen, C. Effect of manifold layout and fertilizer solution concentration on fertilization and flushing times and uniformity of drip irrigation systems. Agric. Water Manag. 2018, 200, 71–79. [Google Scholar] [CrossRef]
  2. Sharmasarkar, F.C.; Sharmasarkar, S.; Miller, S.D.; Vance, G.F.; Zhang, R. Assessment of drip and flood irrigation on water and fertilizer use efficiencies for sugarbeets. Agric. Water Manag. 2001, 46, 241–251. [Google Scholar] [CrossRef]
  3. Wu, H.; Yue, Q.; Guo, P.; Xu, X.; Huang, X. Improving the AquaCrop model to achieve direct simulation of evapotranspiration under nitrogen stress and joint simulation-optimization of irrigation and fertilizer schedules. Agric. Water Manag. 2022, 266, 107599. [Google Scholar] [CrossRef]
  4. Jovarauskas, D.; Steponavičius, D.; Kemzūraitė, A.; Zinkevičius, R.; Venslauskas, K. Comparative analysis of the environmental impact of conventional and precision spring wheat fertilization under various meteorological conditions. J. Environ. Manag. 2021, 296, 113150. [Google Scholar] [CrossRef]
  5. Kumar, M.; Kumar, R. Hydraulics of water and nutrient application through drip irrigation-A review. J. Soil Water Conserv. 2018, 17, 65. [Google Scholar] [CrossRef]
  6. Silva, S.; Duarte, D.; Valente, A.; Soares, S.; Soares, J.; Pinto, F.C. Augmented Intelligent Distributed Sensing System Model for Precision Agriculture. In Proceedings of the 2021 Telecoms Conference (ConfTELE)., Leiria, Portugal, 11–12 February 2021. [Google Scholar]
  7. Nesthad, N.; Kurien, E.K.; Varughese, A.; Mathew, E.K. Evaluation of different fertigation equipments and the hydraulic performance of the drip fertigation system. J. Agric. Sci. 2013, 1, 12–17. [Google Scholar]
  8. Leedy, C.T.; Leedy, M.L. Fertilizer Mixing Device for Sprinkler Systems. U.S. Patent US20020145057A1, 10 October 2002. [Google Scholar]
  9. Zhang, X.; Mao, H.; Gao, H.; Zuo, Z.; Zhang, Y. Multi-Scale Habitat Information-Based Method and Device for Detecting and Controlling Water and Fertilizer for Crops in Seedling Stage. U.S. Patent US20210289692A1, 23 September 2021. [Google Scholar]
  10. Yang, L.; Wu, G.; Wu, Z.; Li, T.; Mao, C. Fertilization Precision Control Method for Water and Fertilizer Integrated Equipment and Control System Thereof. U.S. Patent US10918014B2, 17 January 2019. [Google Scholar]
  11. Anthony, B.C.; Johnson, D.N.; Igancio, C. A Device for Injecting and Mixing Liquid Fertilizer with Water Flow in a Sprinkler System Pipeline. WO WO2007021512A2, 22 February 2007. [Google Scholar]
  12. Wang, H.; Fu, Q.; Meng, F.; Mei, S.; Wang, J.; Li, L. Optimal design and experiment of fertilizer EC regulation based on subsection control algorithm of fuzzy and PI. Trans. Chin. Soc. Agric. Eng. 2016, 32, 110–116. [Google Scholar]
  13. Bi, P.; Zheng, J. Study on Application of Grey Prediction Fuzzy PID Control in Water and Fertilizer Precision Irrigation. In Proceedings of the IEEE International Conference on Computer & Information Technology, Xi’an, China, 11–13 September 2014; pp. 789–791. [Google Scholar]
  14. Wang, J.; Wang, S.; Chen, J.; Liu, H.; Xu, D. Research on Automatic Irrigation Algorithm of Strawberry Greenhouse Based on PLC. In Proceedings of the International Conference on Computer and Computing Technologies in Agriculture, Beijing, China, 18–20 September 2013. [Google Scholar]
  15. Zhang, J.; Zhang, W.; Zhang, F.; Zhang, J.; Zhang, J. Research of adaptive nonlinear model by integrated irrigation of water and soils in greenhouse for environment and ecological balance. IOP Conf. Ser. Earth Environ. Sci. 2021, 804, 042087. [Google Scholar] [CrossRef]
  16. Zhang, P.; Zhang, Q.; Liu, F.; Li, J.; Cao, N.; Song, C. The Construction of the Integration of Water and Fertilizer Smart Water Saving Irrigation System Based on Big Data. In Proceedings of the 2017 IEEE International Conference on Computational Science and Engineering (CSE) and IEEE International Conference on Embedded and Ubiquitous Computing (EUC), Guangzhou, China, 21–24 July 2017. [Google Scholar]
  17. Sun, F.; Ma, W.; Li, H.; Wang, S. Research on Water-Fertilizer Integrated Technology Based On Neural Network Prediction and Fuzzy Control. IOP Conf. Ser. Earth Environ. Sci. 2018, 170, 032168. [Google Scholar] [CrossRef]
  18. Aguilar, J.V.; Langarita, P.; Rodellar, J.; Linares, L.; Horvath, K. Predictive control of irrigation canals—Robust design and real-time implementation. Water Resour. Manag. 2016, 30, 3829–3843. [Google Scholar] [CrossRef]
  19. Lacasta, A.; Morales-Hernández, M.; Brufau, P.; García-Navarro, P. Simulation of PID Control Applied to Irrigation Channels. Procedia Eng. 2014, 70, 978–987. [Google Scholar] [CrossRef]
  20. Fernández-Ramos, J.; Narvarte, L.; López-Soria, R.; Almeida, R.H.; Carrêlo, I.B. An assessment of the proportional-integral control tuning rules applied to Photovoltaic Irrigation Systems based on Standard Frequency Converters. Sol. Energy 2019, 191, 468–480. [Google Scholar] [CrossRef]
  21. Jaiswal, S.; Ballal, M.S. Fuzzy inference based irrigation controller for agricultural demand side management. Comput. Electron. Agric. 2020, 175, 105537. [Google Scholar] [CrossRef]
  22. Benyezza, H.; Bouhedda, M.; Rebouh, S. Zoning irrigation smart system based on fuzzy control technology and IoT for water and energy saving. J. Clean. Prod. 2021, 302, 127001. [Google Scholar] [CrossRef]
  23. Shan, Y.; Zhang, L.; Ma, X.; Hu, X.; Hu, Z.; Li, H.; Du, C.; Meng, Z. Application of the Modified Fuzzy-PID-Smith Predictive Compensation Algorithm in a pH-Controlled Liquid Fertilizer System. Processes 2021, 9, 1506. [Google Scholar] [CrossRef]
  24. Qu, X.; Liu, S.; Fu, S.; He, H.; Hu, Y.; Xiao, L. Design and Implementation of Wireless Environment Monitoring System Based on STM32. Sci. Program. 2021, 2021, 6070664. [Google Scholar]
  25. Abebe, R.; Vakil, G.; Lo Calzo, G.; Cox, T.; Lambert, S.; Johnson, M.; Gerada, C.; Mecrow, B. Integrated motor drives: State of the art and future trends. IET Electr. Power Appl. 2016, 10, 757–771. [Google Scholar] [CrossRef]
  26. Alonso-Hernández, O.; Ramos-Fernández, J.C.; Márquez-Vera, M.A.; López-Morales, V.; Ruiz-Vanoye, J.A.; Suárez-Cansino, J.; Trejo-Macotela, F.R. Fuzzy infrared sensor for liquid level measurement: A multi-model approach. Flow Meas. Instrum. 2020, 72, 101696. [Google Scholar] [CrossRef]
  27. Magzoub, M.A.; Alquthami, T. Optimal Design of Automatic Generation Control Based on Simulated Annealing in Interconnected Two-Area Power System Using Hybrid PID—Fuzzy Control. Energies 2022, 15, 1540. [Google Scholar] [CrossRef]
  28. Carlucho, I.; De Paula, M.; Villar, S.A.; Acosta, G.G. Incremental Q-learning strategy for adaptive PID control of mobile robots. Expert Syst. Appl. 2017, 80, 183–199. [Google Scholar] [CrossRef]
  29. Zhang, Z.; Chen, C.; Li, H.; Xia, H. Design, Development, and Performance Evaluation of a Fertigation Device for Distributing Solid Fertilizer. Water 2020, 12, 2621. [Google Scholar] [CrossRef]
  30. McGaghie, W.C.; Crandall, S. Data analysis and statistics. Acad. Med. 2001, 76, 936–938. [Google Scholar] [CrossRef]
  31. Saoudi, O.; Ghaouar, N.; Othman, T. Conductivity measurements of laccase for various concentrations, pH and ionic liquid solutions. Fluid Phase Equilibria 2017, 433, 184–192. [Google Scholar] [CrossRef]
  32. Mirzakhaninafchi, H.; Singh, M.; Bector, V.; Gupta, O.P.; Singh, R. Design and Development of a Variable Rate Applicator for Real-Time Application of Fertilizer. Sustainability 2021, 13, 8694. [Google Scholar] [CrossRef]
  33. Joseph, C.; Thirunavuakkarasu, I.; Bhaskar, A.; Penujuru, A. Automated fertigation system for efficient utilization of fertilizer and water. In Proceedings of the 2017 9th International Conference on Information Technology and Electrical Engineering (ICITEE), Phuket, Thailand, 12–13 October 2017. [Google Scholar]
Figure 1. Schematic diagram of the solid-fertilizer-dissolving and -applying device: (1) hopper; (2) screw rod; (3) stepping motor; (4) direct-current motor; (5) mixer; (6) EC sensor; (7) fertilizer solution outlet pipe; (8) control cabinet; (9) flow sensor; (10) water inlet pipe; (11) direct-current pump; (12) filter; (13) mixing barrel; (14) sewage outlet pipe.
Agriculture 12 01382 g001
Figure 2. Stepping motor drive control process flowchart.
Agriculture 12 01382 g002
Figure 3. Flowchart of fertilizer concentration detection.
Agriculture 12 01382 g003
Figure 4. Dynamic model of the composting process.
Agriculture 12 01382 g004
Figure 5. Fuzzy PID control system program diagram.
Agriculture 12 01382 g005
Figure 6. (a) Schematic diagram of the performance test of the dissolving device: (1) source of water; (2) water pump; (3) flowmeter; (4) mixed fertilizer bucket; (5) fertilizer inlet; (6) stirrer; (7) stepping motor; (8) water pump; (9) flowmeter; (10) fertilizer solution export; (11) control panel; (12) filter. (b) Performance test bench of the solution applicator equipped with the control system.
Agriculture 12 01382 g006
Figure 7. The relationship between the fertilizer flow rate and the frequency of PWM waves.
Agriculture 12 01382 g007
Figure 8. The relationship between the water flow rate and PWM duty ratio.
Agriculture 12 01382 g008
Figure 9. Diagram showing changes over time without a control system.
Agriculture 12 01382 g009
Figure 10. Diagram showing changes over time with a control system.
Agriculture 12 01382 g010
Figure 11. Variations of fertilizer concentration at different set values.
Agriculture 12 01382 g011
Table 1. Combined experiments of different fertilizer flow rates and water flow rates.
PatternABCDEFGHI
Water flow rate/m3 h−11.51.51.51.01.01.00.50.50.5
Fertilizer flow rate/kg min−10.260.130.070.260.130.070.260.130.07
Table 2. Test data sheet of the relationship between the concentration of fertilizer and the conductivity.
Fertilizer Solution Concentration (g/L)0102030405060708090100
EC of K2O (mS/cm)0.634.4246.6768.2790.12111.3131.02151.18171.7189.49207.2
EC of N-P2O5-K2O (mS/cm)0.5814.1425.1335.3443.162.8359.168.0677.6195.78115.89
Table 3. Fertilizer performance parameters of the solution application device under different fertilizer flow rates and water flow rates.
Different PatternsABCDEFGHI
Fertilizer solution concentration at stabilization/(g/L)4.782.641.216.893.361.419.084.071.68
The average concentration of the fertilizer solution/(g/L)4.012.211.035.702.711.177.533.301.37
Coefficient of evenness of fertilization/(%)71.1071.3674.5868.6665.1369.1869.7265.7166.96
Table 4. Performance indices of the mixed application control system.
Different PatternsABCDE
The set value/(g⋅L−1)246810
Average fertilizer solution concentration/(g⋅L−1)1.923.825.727.639.52
Stability: adjust the time/min20.1620.2320.3120.4620.57
Speed: the response time/min10.6310.7110.8910.9110.98
Accuracy: the steady-state error/(g⋅L−1)0.550.530.570.540.56
Publisher’s Note: MDPI stays neutral with regard to jurisdictional claims in published maps and institutional affiliations.

