Abstract
Since ancient times, honey has been appreciated not only for its sensorial traits, but also for the observed effects in rejuvenation and treatment against several bad health conditions, when used externally or internally, along with other beehive products, such as pollen, propolis and royal jelly. Today, it is known that such effects are generated by compounds bearing antimicrobial, anti-inflammatory, and antioxidative features (enzymes, polyphenolic molecules). The purpose of this study was to assess the total phenolic and flavonoid contents of 28 samples of Romanian raw monofloral honey (acacia; linden; rapeseed, sunflower and mint), and to establish their correlations with several qualitative parameters. Pearson’s test revealed a strong positive correlation between total phenolic content and total flavonoids (r = 0.76) and color intensity (r = 0.72). For total flavonoid content, correlations were strongly positive with color intensity (r = 0.81), ash content (r = 0.76) and electrical conductivity (r = 0.73). The relevant levels of polyphenols and flavonoids identified in the analyzed honey types demonstrate its antioxidant potential, with essential nutritional and sanogenic features in human nutrition.
1. Introduction
The Romanian beekeeping sector has developed throughout the last few years. Both conventional and organic honey production has increased because Romania has large areas of melliferous plants [1]. The variety of melliferous flora in Romania provides the possibility of producing many types of honey: monofloral, multifloral and honeydew honey [2]. The chemical composition of honey consists mainly of sugars, about 80%, mainly glucose and fructose, 15–17% water, 0.1–0.4% protein and 0.2% ash, while other components contained in small quantities provide some special properties [3]. The quality of honey is closely related to its properties (sensorial, physical, chemical, nutritional and sanogenic traits) that, in turn, are largely influenced by the type of melliferous flora, geographical and environmental factors of the region, by the final operations (processing, packaging, storage place and time) and manipulations [4,5,6]. The price and purchase frequency of honey depends on some traits that consumers seek in perceiving the quality of honey, such as: color, texture, clarity and flavor. Maintaining health through an appropriate diet led, in the last few years, to a change in preferences in honey consumption, namely, consumers are interested in the nutritional properties of this unique natural food [7]. The antimicrobial, anti-inflammatory and antioxidative activities of honey are properties that have been recognized for their beneficial effects on the human body. Many studies have shown that the composition and antioxidant activity of honey depends on several factors that can directly or indirectly affect its quality [8,9]. Honey’s antioxidant capacity has been correlated with the levels of certain molecules: enzymes, polyphenolic compounds (phenolic acids, phenolic acid derivates, flavonoids), proteins, amino acids and other compounds. Flavonoids belong to a larger group of vegetal phenolic compounds. These bioactive molecules, originating in plants, are brought together with the collected nectar, and they have been used in other studies as floral markers to identify the geographical and botanical origin of honey [6,10,11]. In the literature, there are reports of correlations between certain physicochemical parameters: electrical conductivity and total ash content [12,13,14], pH and moisture, pH and acidity, acidity and ash [15,16]. Sant’ana et al., observed that darker honey has a higher content of phenolic compounds (flavonoids) and minerals [16]; other correlations, such as total phenolic content and total flavonoid content with color have also been studied [17,18,19]. In the present work, the therapeutic qualities of honey issued from different geographic regions, and, in particular, their antioxidant features, were studied (especially the polyphenolic and flavonoids compounds). Within this conjuncture, our study brings forth new data on the total phenolic and total flavonoid contents, as well as their correlations with several qualitative parameters of raw honey collected from eastern parts of Romania throughout 2019.
2. Materials and Methods
2.1. Honey Samples
In 2019, the following 28 samples of raw monofloral honey types were collected directly from beekeepers: acacia (A), eight samples; linden (L), seven samples; rapeseed (R), five samples; sunflower (SF), five samples; and mint (M), three samples. The honey bee samples were issued from the Eastern and Southeastern Romanian sites of Iasi County (A1, A2, A3, A4, L1, L2, R1, R2, SF1, SF2), Vaslui County (A5, A6, L3, L4, L5, R3, R4, SF3), Botosani County (A7, A8, L6, L7, R5, SF4, SF5) and Tulcea County (M1, M2, M3) (Figure 1). Each analytical sample was taken from fully filled and sealed individual jars of 400 mL capacity (honey content of 0.5 kg/jar). The botanical origin was declared by the beekeepers based on the naturally occurring floral species or on cultivated crops that the bees had harvested during the flowering period of the year. Thereafter, the company that purchased the honey from the beekeepers applied melissopalynological methods in order to certify the floral origin, prior to its processing and marketing. The raw honey samples were kept at 20 ± 3 °C in the dark. The preparation stage of the raw honey for analysis consisted in liquefying the crystallized samples at 40 °C in a water bath (manufacturer: Memmert GMBH—Schwabach, Germany). They were subsequently homogenized and filtered through a gauze.
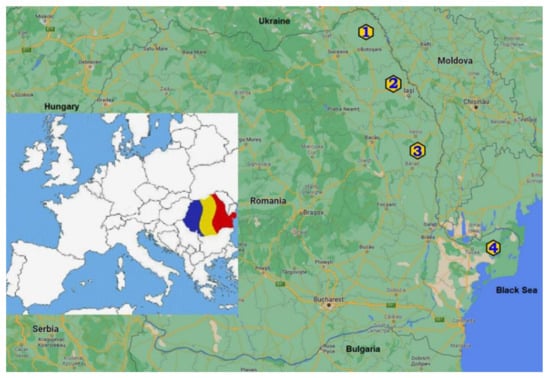
Figure 1.
Geographic regions of collected honey samples (1—Botosani County; 2—Iasi County; 3—Vaslui County; 4—Tulcea County).
2.2. Color
The color of the honey samples was determined using the Shimadzu UV-1700 Pharma Spec instrument (manufacturer: Shimadzu Corporation, Analytical Instruments Division, Kyoto, Japan). Aqueous honey solutions of 50% (w/v) were centrifuged at 3200 rpm for 5 min in a Universal 320 Hettich centrifuge (manufacturer: Hettich GMBH—Tuttlingen, Germany) [20]. The absorbance units, measured at 635 nm wavelength, were converted into mm Pfund using the following calculation:
where Pfund = the honey color value on the Pfund scale (mm); Abs = the value of the absorbance read at the wavelength 635 nm.
Pfund (mm) = −38.7 + 371.39 × Abs
2.3. Water-Insoluble Solids
Ten grams of honey sample weighed on the PI-214 Denver analytical balance (manufacturer: Denver Instrument GMBH—Gottingen, Germany) were dissolved in distilled water, filtered through filter paper with constant weight, and washed several times. After being dried in an ESAC 100 oven at 105 °C (manufacturer: SC Electronic April Aparatura Electronica Speciala S.R.L.—Cluj-Napoca, Romania), the content of water-insoluble solids was calculated by the difference between the filter paper with water-insoluble solids weight and filter paper weight, and the result are expressed as percentages [21].
2.4. Refractive Index, Moisture and Solid Substances
The refractive index (RI) of samples was determined using the Abbé Kruss AR 2008 refractometer (manufacturer: Kruss Scientific GMBH, Hamburg, Germany), then, moisture content (M) was taken from the table of correspondence between the water content and the refractive index at 20 °C [21]. Solid substance content (SS), expressed as a percentage, was calculated as the difference between 100 and moisture content.
2.5. Total Soluble Solids and Specific Gravity
The total soluble solids (TSS) represented by soluble sugars, expressed as Brix degrees, were obtained from the table of correspondence between the refractive index at 20 °C and the Brix degrees [22].
Specific gravity was assessed by a gravimetric method, using the pycnometer device. The results are expressed in g/cm3 [5].
2.6. pH and Free Acidity
Using the Multi 3320 multiparameter (manufacturer: WTW GMBH, Weilheim, Germany), the pH values were measured in an aqueous honey solution (10 g of honey in 75 mL of distilled water). In the same solution, free acidity was measured by titration with 0.1 N NaOH (Chemical Company, Iasi, Romania) solution using phenolphthalein (Chimreactiv, Bucharest, Romania) as a color indicator [21,23,24].
2.7. Ash and Electrical Conductivity
Assessment of ash content was carried out using a gravimetric method after honey samples were calcinated in the Nabertherm B180 furnace (manufacturer: Nabertherm GMBH, Lilienthal, Germany); the results are expressed in g/100 g. Electrical conductivity was measured with the Multi 3320 multiparameter (manufacturer: WTW GMBH, Weilheim, Germany). The 20% solution (the weighted honey was calculated as dry matter) was formed with ultrapure water produced by the Barnstead Easy Pure II system (manufacturer: Thermo Fisher Scientific Co. Ltd., North Liberty, IA, USA); the results are expressed in µS cm−1 [21,23].
2.8. Total Phenolic Content and Total Flavonoid Content
Total phenolic content and total flavonoid content were determined according to the Folin–Ciocalteu method with minor modification.
For total phenolic content, a 10% honey-based alcoholic solution (solution 1:1 of methanol (Merck KGaA, Darmstadt, Germany) with acidified water (deionized water at pH = 2 with HCl (Merck KGaA, Darmstadt, Germany)) was homogenized and filtered through filter paper. An aliquot of honey solution was mixed with 0.2 mL of Folin–Ciocalteu’s phenol reagent (Merck KGaA, Darmstadt, Germany) for 5 min, and to it was added 75g/L Na2CO3 (Merck KGaA, Darmstadt, Germany) until the volume was 10 mL. The solution was kept in the dark, at room temperature, for 30 min prior to measuring it at 742 nm wavelength, against a blank sample using the Shimadzu UV-1700 Pharma Spec instrument (manufacturer: Shimadzu Corporation, Analytical Instruments Division, Kyoto, Japan). To obtain the calibration curve with five calibration points (concentration range of 2–12 mg L−1; y = 0.089x + 0.1147; R2 = 0.9972), gallic acid (Merck KGaA, Darmstadt, Germany) was used as the standard. The maximum absorption was recorded at 742 nm for a spectrum range of 700–800 nm. The results are expressed in mg of gallic acid equivalents (GAE)/100 g [24,25].
The same honey-based alcoholic solution was used to assess the total flavonoid content. The same volume of 2% AlCl3 (Merck KGaA, Darmstadt, Germany) was added to this honey solution. After 10 min, absorbance was read at 430 nm. To obtain the calibration curve with six calibration points (concentration range of 0.5–5 mg L−1; y = 0.1331x + 0.0112; R2 = 0.9997), quercetin (Sigma-Aldrich, St. Louis, MO, USA) was used as the standard. The maximum absorption was recorded at 430 nm for a spectrum range of 400–500 nm. The results are expressed in mg of quercetin equivalents (QE)/100 g [17,25].
2.9. Statistical Analyses
All analyses were conducted in triplicate. The analytical data were statistically processed for main descriptors and analysis of variance—one-way ANOVA—via GraphPad Prism 9.4.0 (673) software. Correlations between physicochemical parameters were tested using Pearson’s correlation coefficient (r) between total phenolic and total flavonoid content and the other investigated parameters. These r values were grouped using OriginPro 2022 software and presented as a heatmap. Graphics were built, and circular hierarchical cluster analysis (HCA) was performed, using the same software.
3. Results
3.1. Physicochemical Analyses
The results of some studied parameters (color, water-insoluble solids, refractive index, moisture, solid substance content, total soluble solids, specific gravity) are presented in Table 1.

Table 1.
Parameter (color, water-insoluble solids, refractive index, moisture, solid substances, total soluble solids, specific gravity) values of honey samples.
The results of some parameters (pH, free acidity, ash, electrical conductivity, total phenolic content, total flavonoid content) are presented in Table 2.

Table 2.
Parameter (pH, free acidity, ash, electrical conductivity, total phenolic content, total flavonoid content) values of honey samples.
Figure 2 and Figure 3 present the mean content, standard error and mean line values of selected parameters of five floral honey samples.
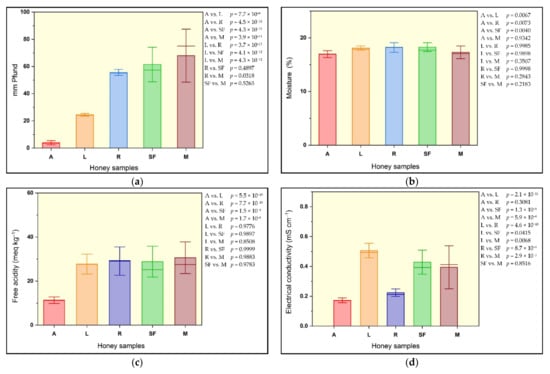
Figure 2.
Mean content, standard error and mean line values of selected honey sample parameters: (a) mm Pfund; (b) moisture; (c) free acidity; (d) electrical conductivity.
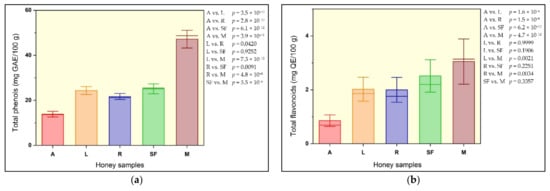
Figure 3.
Mean content, standard error and mean line values of some honey sample parameters: (a) total phenols; (b) total flavonoids.
3.2. Correlations between Physicochemical Parameters
The correlations between all studied parameters are presented on a heatmap; these results were determined using Pearson’s correlation coefficient (Figure 4).
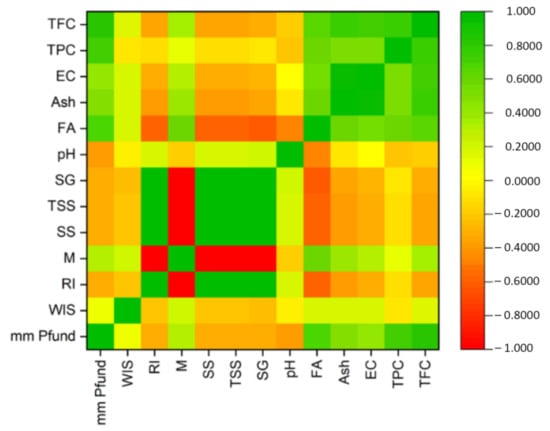
Figure 4.
Pearson’s correlation coefficient results presented on a heatmap.
The correlation between ash and electrical conductivity is presented in Figure 5.
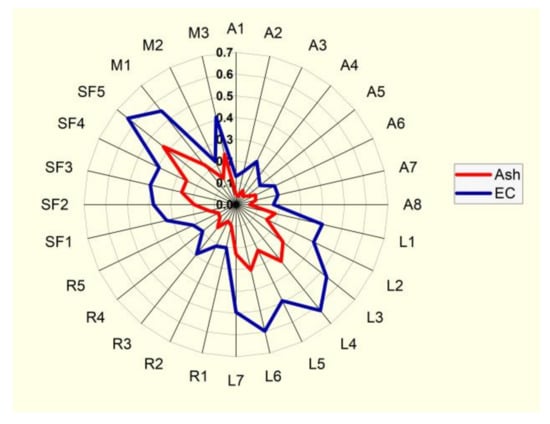
Figure 5.
Radial graph of correlation between two parameters: ash content (%) and electrical conductivity (EC) (mS cm−1).
The relationship between the flavonoid content and honey color is shown in a visual graph; data are expressed as % of total studied honey samples (Figure 6).
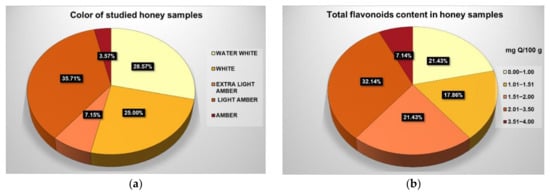
Figure 6.
Visual presentation of correlation between (a) color and (b) total flavonoid content of honey samples.
In Figure 7, five colored clusters are distinguished, highlighting the connections between the parameters of the honey samples.
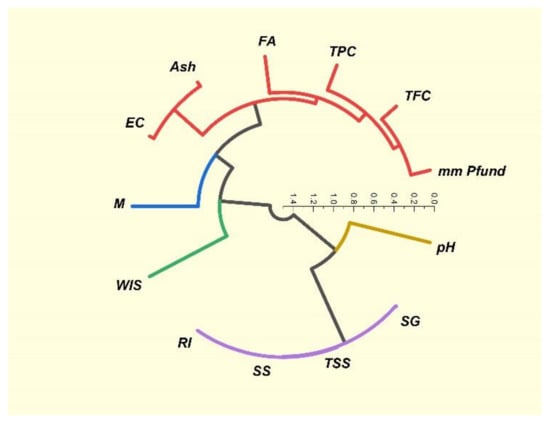
Figure 7.
Circular hierarchical cluster analysis (HCA) of studied honey sample parameters.
4. Discussion
4.1. Water-Insoluble Solids (WIS)
In honey, materials such as wax particles, pollen, bee parts, plant material pieces and other foreign elements that contaminate the honey, represent water-insoluble solids (WIS) [26]. An increased amount of WIS causes not only a lower quality of honey, but also an increased opportunity for the development of yeasts, which can create favorable conditions for the fermentation process, leading to further decreasing of honey quality. Beekeepers perform centrifugal and filtering operations on their bees’ honey, but most of them do not sell it directly on the market; therefore, raw honey may have a higher content of WIS. In our studied honey samples, water-insoluble solids varied from 0.035% in acacia honey, to 0.114% in sunflower honey. Seven samples of raw monofloral honey (two acacia, two linden, two rapeseed, one sunflower) had WIS contents between 0.101% and 0.114%, which are above the threshold level (0.1%) established by the legislation [27].
4.2. Color
The color of honey has an important visual impact on the consumers. In different parts of the world, honey is consumed primarily because of its color hue: some consumers prefer light-colored honey, others dark-colored. This honey color palette depends on certain factors, such as the botanical origin, the composition of the nectar, the amount of pigments, the extraction operations, temperature, storage conditions and time [3,28]. The color of the studied honey samples varied from water-white (0.2 mm Pfund) in acacia honey samples to amber (86.1 mm Pfund) in mint honey samples. The average color intensity increased as follows: acacia honey < linden honey < rapeseed honey < sunflower honey < mint honey (Figure 2a). The color of the studied acacia honey samples was similar to the color of acacia honey from Croatia [29]; various studies show that for the same botanical origin, honey samples from different regions exhibit various colors; for example, sunflower honey color intensity varied from 33.66 mm Pfund to 114.00 mm Pfund (Table 3).

Table 3.
Color intensity of different types of floral honey in our study and from literature sources.
Previous studies of honey parameters revealed correlations between the color intensity and the quantity of minerals (lowest content found in light-colored honey samples) [36] with phenolic or flavonoid content (color intensity increased as phenolic content grew higher) [16]. Chiş and Purcărea, showed that the colors of three Romanian sunflower honey samples became darker, i.e., the mm Pfund increased, over time (2 years) from 70.5 mm Pfund, 88.7 mm Pfund and 61.3 mm Pfund to 73.4 mm Pfund, 101.4 mm Pfund and to 68.5 mm Pfund, respectively [30].
4.3. Refractive Index, Moisture and Solid Substance Content, Total Soluble Solids and Specific Gravity
The refractive index (RI), as read from the refractometer, ranged from 1.486 in rapeseed honey samples to 1.498 in acacia honey samples. The range in moisture content (M) was between 15.41% (acacia) and 20.07% (rapeseed), while the highest average moisture content (18.27%) was registered in sunflower honey (Figure 2b). Solid substance contents (SS) were between 79.93% (rapeseed) and 84.59% (acacia) (Table 1). Of the 28 honey samples, only one had a moisture content above the 20% (water content) value, recommended for honey, according to Romanian standards and international regulations [21,27]. The moisture content of honey samples studied in other research publications [2,29,37,38,39] ranged between 14.45% and 22.8%; there were some honey samples reported with moisture contents exceeding the value of 20% established by the legislation (Table 4). A low content of moisture provides quality assurance for a long time period; high moisture content is a favorable condition for the occurrence of the fermentation phenomenon, thus leading to changes in both sensory and physicochemical properties, and thus, to the decrease in the quality of the bee product [12,34].

Table 4.
Some physicochemical properties of the five different types of floral honey in our study and from literature sources.
Minimum/maximum values of total soluble solids of 78.28 °Brix/83.06 °Brix were found in rapeseed/acacia honey samples. Minimum/maximum values of specific gravity (1.410 g/cm3/1.448 g/cm3) were also found in rapeseed/acacia samples.
4.4. pH and Free Acidity
The values of pH were found to be within a 3.25–5.03 range, while the free acidity ranged between 6.8 meq kg−1 in acacia honey, and 47.0 meq kg−1 in sunflower honey; all free acidity values were situated below the threshold (50 meq kg−1) value established by the legislation [27]. The lowest average free acidity value was found in acacia samples, 11.3 meq kg−1 (Figure 2c). Honey pH and acidity are correlated with the internal amount of microorganisms, enzymatic activity and the presence of organic acids. A low pH indicates a good environment that inhibits microorganism growth, while the free acidity level is a biochemical marker for honey samples freshness [34,51]. Similar values of free acidity were found among Serbian acacia honey samples [47]; these were the lowest values when compared to other types of honey (Table 4). The data on the free acidity of sunflower honey varied greatly, between 21.6 meq kg−1 and 47.0 meq kg−1. In their study, Pauliuc and Oroian, found even wider variation limits of free acidity for other Romanian sunflower honey types, from 15.94 meq kg−1 to 47.32 meq kg−1 [2]. The values of pH and free acidity, obtained in other studies from different countries are presented in Table 4.
4.5. Ash and Electrical Conductivity
The highest average ash content was found in sunflower samples (0.251%), while the lowest (0.066%) was measured in acacia samples. The electrical conductivity ranged between 0.130 mS cm−1 in acacia samples and 0.637 mS cm−1 in sunflower samples. The lowest average electrical conductivity value was registered in acacia honey samples (0.173 mS cm−1) (Figure 2d). All values were measured below the maximal threshold of 0.8 mS cm−1, specified by Directive 2001/110/EC of the European Union [3,27] for blossom honey. Electrical conductivity has become an increasingly common analysis; its value is related to the quantity of minerals, organic acids and proteins. Additionally, the assessment of electrical conductivity is useful in certifying honey authenticity/adulteration, as it facilitates discriminating between blossom honey types and honeydew [3,20,51]. Highly similar results were obtained from investigations carried out on the same floral type of honey, with values also below 0.8 mS cm−1 (Table 4).
4.6. Total Phenolic Content and Total Flavonoid Content
Throughout the year, from spring to late autumn, bees mix the nectars of flowers or secretions of other plants with their fluids to produce blossom honey or honeydew. The composition of honey, the amount of nutrients, especially the antioxidant compounds (phenols, flavonoids, flavones), are influenced by the botanical family, the richness of flora diversity, and/or by the geographical area [28,45]. Honey can be considered a healing food due to the antioxidant role conferred mainly by phenolic compounds, such as phenolic acids and flavonoids. The amount of antioxidant compounds depends mainly on the floral source and on the geographical origin [34,35]. The highest amplitude of variation for the phenolic content was found in the linden honey (8.99 mg GAE/100 g of phenolic content between the analytical limits). The minimal individual sample value of phenols (11.10 mg GAE/100 g) was found in acacia honey, while the maximal value (50.82 mg GAE/100 g) was measured in mint honey. The lowest average value of phenolic content was calculated in acacia honey samples (13.88 mg GAE/100 g), followed ascendingly by rapeseed (21.72 mg GAE/100 g), linden (24.37 mg GAE/100 g) and sunflower (25.12 mg GAE/100 g); thus, the richest content was found in mint honey samples (47.20 mg GAE/100 g) (Figure 3a). The values of total phenol content obtained by Milosavljević et al. in Serbian acacia honey were much higher in comparison to our findings (58.17 to 142.61 mg GAE/100 g) [47]. The total phenol content assessed in honey bee samples from several European countries have been reported, ranging from 1 mg GAE/100 g in Turkish acacia honey [38] to 142.61 mg GAE/100 g in Serbian acacia honey [47] (Table 4). Honey is considered to be a food that, when kept under optimal conditions, can maintain its nutritional qualities for a long time. However, the antioxidant content is influenced negatively as storage time extends. In their study, Chiş and Purcărea found that the total phenolic content of three sunflower honey samples decreased over time (2 years) from 68.3 mg GAE/100 g to 60.3 mg GAE/100 g, from 132.5 mg GAE/100 g to 98.2 mg GAE/100 g, and from 48.6 mg GAE/100 g to 40.5 mg GAE/100 g, respectively [30]. In our findings, total flavonoid content ranged between the limits of 0.44 mg QE/100 g in acacia honey and 3.97 mg QE/100 g in mint honey (Table 2). The highest average content was recorded in mint samples (3.05 mg QE/100 g) followed, in descending order, by sunflower honey (2.52 mg QE/100 g), and linden and rapeseed honey (2.02–2.00 mg QE/100 g); thus, the lowest average flavonoid content was calculated in acacia honey (0.86 mg QE/100 g) (Figure 3b). Table 4 shows the results obtained in other studies related to flavonoid content in the same floral types of honey. As can be seen, the data vary considerably from one type of honey to another, and from one country to another country, within the same honey variety. The presence of phenols and flavonoids reaffirms the antioxidant properties of honey.
4.7. Correlations between Honey Parameters
Correlations between the physicochemical parameters of the studied honey samples were revealed using the Pearson correlation coefficient r value; these results are arranged and presented as a heatmap in Figure 4. Moisture (M) content had a strong negative correlation with four parameters: refractive index (RI) (r = −1.0), solid substances (SS) (r = −1.0), total soluble substances (TSS) (r = −1.0) and specific gravity (SG) (r = −0.99). There were some strong positive linear correlations (r = +1) between three parameters: refractive index (RI), solid substances (SS) (r = +1) and total soluble solids (TSS); strong positive linear correlations (r = +0.99) were also noticed between specific gravity (SG) and refractive index (RI), solid substances (SS) and total soluble solids (TSS). Another strong positive correlation (r = +0.95) stood out between ash (Ash) and electrical conductivity (EC) (Figure 5). Phenolic compounds exhibit a close positive relationship with color, thus explaining the Pearson coefficient of +0.72 determined between total phenol content (TPC) and color (mm Pfund), and +0.81 between total flavonoid content (TFC) and color (mm Pfund) (Figure 6). There was also a close positive relationship between these two compounds and antioxidant properties, the Pearson coefficient having a high value of +0.76. Total phenol content (TPC) exhibited moderate positive correlations with free acidity (FA) (r = +0.57), electrical conductivity (EC) (r = +0.53) and with ash (Ash) (r = +0.51). Total flavonoid content (TFC) had strong positive correlations with ash (Ash) (r = +0.76) and electrical conductivity (EC) (r = +0.73), and a moderate positive correlation with free acidity (FA) (r = +0.65). Moderate positive correlations were also found between free acidity (FA) and color (mm Pfund) (r = +0.68) and moisture (M) (r = +0.59). There are many other studies exploring the correlations between honey parameters. Pontis et al. [17] reported strong correlations between total phenolic content and color (r = +0.967), total flavonoid content and color (r = +0.924) of Brazilian honey. Al Farsi et al. found strong correlations for color vs. flavonoids (+0.999) and color vs. phenols (+0.974) in honey samples of Apis mellifera honeybees from regions within the Sultanate of Oman [18], with higher Pearson coefficient values compared to those obtained in our study. Total flavonoid content was significantly correlated with color (r = +0.82) in Brazilian honey samples, as reported by De Almeida et al. [53]. Cimpoiu et al. obtained a strong linear correlation of +0.86 between total phenolic content and the color intensity in Romanian honey [19]. It is known that pigments provide the color hue of honey, specifically those pigments with antioxidant properties, such as carotenoids. Many studies have shown strong correlations between color intensity and antioxidant compounds: Kavanagh et al. in Irish honey (color/TPC, r = +0.6) [54]; Ciappini et al., in Argentinian honey (flavonoid content and color, r = +0.93) [55]; Moniruzzaman et al. [56] in Bangladesh honey samples (color with phenolic acids, r = +0.943 and flavonoids r = 0.926); Aazza et al. [32] in Portuguese honey (color/TPC, r = +0.685; color/TFC, r = 0.843); Živković et al. [35] in Serbian honey (color/TPC, r = +0.815; color/TFC, r = 0.771); Flanjak et al. [29] in Croatian honey (color/TPC, r = +0.925). The correlations between the total phenol (TPC) and total flavonoid (TFC) contents were also confirmed in a study on monofloral honey from Sicily (Italy) (r = +0.919), a higher value than that found in our research [43]. Al Farsi et al. found strong positive correlations between flavonoids and phenolics (r = +0.977) [18], as did Živković et al., who observed a correlation of +0.967 between TPC and TFC in Serbian honey samples [35]. Aazza et al., on commercial Portuguese honey, found strong correlation between TPC and TFC (r = +0.861) [32], while in Romanian honey, correlation reached a level of 0.7512 [8]. Flanjak et al., found a strong statistically significant positive correlation between honey EC and TPC (r = +0.837) [29], while in another study, this correlation had a lower value (r = +0.55) [54]. In sunflower honey samples from Serbia, Živkov Baloš et al. found a moderate correlation between electrical conductivity and ash mass fraction (r = +0.611) [51]. To compare similarities between studied parameters, we used a color circular hierarchical cluster analysis (HCA). Figure 7 shows the formation of five clusters, with the following parameters in the first cluster: refractive index (RI), solid substances (SS), total soluble substances (TSS) and specific gravity (SG). These parameters exhibited strong positive linear correlations. The second cluster also consisted of parameters with strong relationships: total flavonoid content (TFC), color (mm Pfund), free acidity (FA), electrical conductivity (EC) and ash (Ash). The parameters forming other clusters were moisture content (M), water-insoluble solids (WIS) and pH.
5. Conclusions
The results of this study show many strong positive correlations, especially between antioxidant compound levels and color. Dark-colored honey samples had higher phenolic and flavonoid contents, in comparison with light-color honey samples.
The relevant levels of polyphenols and flavonoids identified in the analyzed honey demonstrate its antioxidant potential, as well as its essential nutritional and sanogenic features in human nutrition.
Author Contributions
Conceptualization, A.A. and D.S.; methodology, A.A. and R.-M.R.-R.; software, A.A. and R.-M.R.-R.; validation, A.A. and D.S.; formal analysis, A.A., R.-M.R.-R., C.-G.R.-R. and I.M.P.; investigation, A.A., R.-M.R.-R., C.-G.R.-R. and I.M.P.; data curation, A.A. and D.S.; writing—original draft preparation, A.A., R.-M.R.-R.; writing—review and editing, A.A., R.-M.R.-R. and D.S.; supervision, A.A. All authors have read and agreed to the published version of the manuscript.
Funding
This research received no external funding.
Institutional Review Board Statement
Not applicable.
Informed Consent Statement
Not applicable.
Data Availability Statement
The data present in this study are available on request from the corresponding author.
Conflicts of Interest
The authors declare no conflict of interest.
References
- Pocol, C.B.; Šedík, P.; Brumă, I.S.; Amuza, A.; Chirsanova, A. Organic Beekeeping Practices in Romania: Status and Perspectives towards a Sustainable Development. Agriculture 2021, 11, 281. [Google Scholar] [CrossRef]
- Pauliuc, D.; Oroian, M. Organic Acids and Physico-Chemical Parameters of Romanian Sunflower Honey. Food Environ. Saf. J. 2020, 19, 148–155. [Google Scholar]
- Pauliuc, D.; Dranca, F.; Oroian, M. Antioxidant Activity, Total Phenolic Content, Individual Phenolics and Physicochemical Parameters Suitability for Romanian Honey Authentication. Foods 2020, 9, 306. [Google Scholar] [CrossRef]
- Al, M.L.; Daniel, D.; Moise, A.; Bobis, O.; Laslo, L.; Bogdanov, S. Physico-chemical and bioactive properties of different floral origin honeys from Romania. Food Chem. 2009, 112, 863–867. [Google Scholar] [CrossRef]
- Popescu, N.; Meica, S. Bee products and their chemical analysis. In Produsele Apicole si Analiza lor Chimica; Diacon Coresi: Bucuresti, RO, USA, 1997. [Google Scholar]
- Da Silva, P.M.; Gauche, C.; Gonzaga, L.V.; Costa, A.C.O.; Fett, R. Honey: Chemical composition, stability and authenticity. Food Chem. 2016, 196, 309–323. [Google Scholar] [CrossRef]
- Testa, R.; Asciuto, A.; Schifani, G.; Schimmenti, E.; Migliore, G. Quality Determinants and Effect of Therapeutic Properties in Honey Consumption. An Exploratory Study on Italian Consumers. Agriculture 2019, 9, 174. [Google Scholar] [CrossRef]
- Ciucure, C.T.; Geană, E.-I. Phenolic compounds profile and biochemical properties of honeys in relationship to the honey floral sources. Phytochem. Anal. 2019, 30, 481–492. [Google Scholar] [CrossRef] [PubMed]
- Geana, E.I.; Ciucure, C.T. Establishing authenticity of honey via comprehensive Romanian honey analysis. Food Chem. 2020, 306, 125595. [Google Scholar] [CrossRef]
- Ciulu, M.; Spano, N.; Pilo, M.I.; Sanna, G. Recent Advances in the Analysis of Phenolic Compounds in Unifloral Honeys. Molecules 2016, 21, 451. [Google Scholar] [CrossRef] [PubMed]
- De-Melo, A.A.M.; de Almeida-Muradian, L.B.; Sancho, M.T.; Pascual-Maté, A. Composition and properties of Apis mellifera honey: A review. J. Apic. Res. 2017, 57, 5–37. [Google Scholar] [CrossRef]
- Ahmida, N.H.; Elagori, M.; Agha, A.; Elwerfali, S.; Ahmida, M.H. Physicochemical, heavy metals and phenolic compounds analysis of Libyan honey samples collected from Benghazi during 2009–2010. Food Nutr. Sci. 2013, 4, 33–40. [Google Scholar] [CrossRef]
- El Sohaimy, S.A.; Masry, S.H.D.; Shehata, M.G. Physicochemical characteristics of honey from different origins. Ann. Agric. Sci. 2015, 60, 279–287. [Google Scholar] [CrossRef]
- Majewska, E.; Druzynska, B.; Wołosiak, R. Determination of the botanical origin of honeybee honeys based on the analysis oftheir selected physicochemical parameters coupled with chemometric assays. Food Sci. Biotechnol. 2019, 28, 1307–1314. [Google Scholar] [CrossRef]
- Krishnasree, V.; Ukkuru, P.M. Quality Analysis of Bee Honeys. Int. J. Curr. Microbiol. Appl. Sci. 2017, 6, 626–636. [Google Scholar] [CrossRef][Green Version]
- Sant’Ana, L.D.; Ferreira, A.B.; Lorenzon, M.C.A.; Berbara, R.L.L.; Castro, R.N. Correlation of total phenolic and flavonoid contents of Brazilian honeys with color and antioxidant capacity. Int. J. Food Prop. 2014, 17, 65–76. [Google Scholar]
- Pontis, J.A.; Costa, L.A.M.A.D.; Silva, S.J.R.D.; Flach, A. Color, phenolic and flavonoid content, and antioxidant activity of honey from Roraima, Brazil. Food Sci. Technol. 2014, 34, 69–73. [Google Scholar] [CrossRef]
- Al-Farsi, M.; Al-Amri, A.; Al-Hadhrami, A.; Al-Belushi, S. Color, flavonoids, phenolics and antioxidants of Omani honey. Heliyon 2018, 4, e00874. [Google Scholar] [CrossRef] [PubMed]
- Cimpoiu, C.; Hosu, A.; Miclaus, V.; Puscas, A. Determination of the floral origin of some Romanian honeys on the basis of physical and biochemical properties. Spectrochim. Acta Part A Mol. Biomol. Spectrosc. 2013, 100, 149–154. [Google Scholar] [CrossRef] [PubMed]
- Ratiu, I.A.; Al-Suod, H.; Bukowska, M.; Ligor, M.; Buszewski, B. Correlation study of honey regarding their physicochemical properties and sugars and cyclitols content. Molecules 2020, 25, 34. [Google Scholar] [CrossRef] [PubMed]
- Romanian Standards Association. SR (Romanian Standard) 784-3:2009: Honey Bee. Part 3: Analytical Methods. Available online: https://e-standard.eu/en/standard/174480 (accessed on 16 April 2018).
- USDA. Extracted Honey Grading Manual, United States Department of Agriculture. Standards for Honey Grading; USDA: Washington DC, USA, 1985. Available online: https://www.ams.usda.gov/sites/default/files/media/Extracted_Honey_Inspection_Instructions%5B1%5D.pdf (accessed on 10 December 2018).
- Bogdanov, S. Harmonized Methods of the International Honey Commission. 2009. Available online: https://www.ihc-platform.net/ihcmethods2009.pdf (accessed on 30 May 2018).
- Sereia, M.J.; Março, P.H.; Perdoncini, M.R.G.; Parpinelli, R.S.; de Lima, E.G.; Anjo, F.A. Chapter 9: Techniques for the Evaluationof Physicochemical Quality and Bioactive Compounds in Honey. In Honey Analysis; INTECH: London, UK, 2017; pp. 194–214. [Google Scholar]
- Bobis, O.; Marghitas, L.; Rindt, I.K.; Niculae, M.; Dezmirean, D. Honeydew honey: Correlations between chemical composition, antioxidant capacity and antibacterial effect. Sci. Pap. Anim. Sci. Biotechnol. 2008, 41, 271–277. [Google Scholar]
- Pourtallier, J.; Taliercio, Y. Honey Control Analyses. Apiacta 1972, 1, 2–5. [Google Scholar]
- European Commission. Council Directive 2001/110/CE concerning honey. Off. J. Eu. Communities 2002, 10, 47–52. [Google Scholar]
- Becerril-Sánchez, A.L.; Quintero-Salazar, B.; Dublán-García, O.; Escalona-Buendía, H.B. Phenolic Compounds in Honey and Their Relationship with Antioxidant Activity, Botanical Origin, and Color. Antioxidants 2021, 10, 1700. [Google Scholar] [CrossRef] [PubMed]
- Flanjak, I.; Kenjerić, D.; Bubalo, D.; Primorac, L. Characterisation of Selected Croatian Honey Types Based on the Combination of Antioxidant Capacity, Quality Parameters, and Chemometrics. Eur. Food Res. Technol. 2016, 242, 467–475. [Google Scholar] [CrossRef]
- Chiş, A.M.; Purcărea, C. Storage effect on antioxidant capacities of some monofloral honey. Studia Univ. Vasile Goldiş Life Sci. Ser. 2017, 27, 91–97. [Google Scholar]
- Pauliuc, D.; Dranca, F.; Ropciuc, S.; Oroian, M. Advanced Characterization of Monofloral Honeys from Romania. Agriculture 2022, 12, 526. [Google Scholar] [CrossRef]
- Aazza, S.; Lyoussi, B.; Antunes, D.; Miguel, M.G. Physicochemical Characterization and Antioxidant Activity of Commercial Portuguese Honeys. J. Food Sci. 2013, 78, 1159–1165. [Google Scholar] [CrossRef]
- Chirsanova, A.; Capcanari, T.; Boistean, A. Quality Assessment of Honey in Three Different Geographical Areas from Republic of Moldova. Food Nutr. Sci. 2021, 12, 962–977. [Google Scholar] [CrossRef]
- Smetanska, I.; Alharthi, S.S.; Selim, K.A. Physicochemical, antioxidant capacity and color analysis of six honeys from different origin. J. King Saud Univ. Sci. 2021, 33, 101447. [Google Scholar] [CrossRef]
- Živković, J.; Sunarić, S.; Stanković, N.; Mihajilov-Krstev, T.; Spasić, A. Total phenolic and flavonoid contents, antioxidant and antibacterial activities of selected honeys against human pathogenic bacteria. Acta Pol. Pharm. Drug Res. 2019, 76, 671–681. [Google Scholar] [CrossRef]
- Kędzierska-Matysek, M.; Teter, A.; Stryjecka, M.; Skałecki, P.; Domaradzki, P.; Rudaś, M.; Florek, M. Relationships Linking the Colour and Elemental Concentrations of Blossom Honeys with Their Antioxidant Activity: A Chemometric Approach. Agriculture 2021, 11, 702. [Google Scholar] [CrossRef]
- Stihi, C.; Chelarescu, E.D.; Duliu, O.G.; Toma, L.G. Characterization of Romanian honey using physico-chemical parameters and the elemental content determined by analytical techniques. Rom. Rep. Phys. 2016, 68, 362–369. [Google Scholar]
- Akgün, N.; Çelik, Ö.F.; Kelebekli, L. Physicochemical properties, total phenolic content, and antioxidant activity of chestnut, rhododendron, acacia and multifloral honey. J. Food Meas. Charact. 2021, 15, 3501–3508. [Google Scholar] [CrossRef]
- Miłek, M.; Bocian, A.; Kleczyńska, E.; Sowa, P.; Dżugan, M. The Comparison of Physicochemical Parameters, Antioxidant Activity and Proteins for the Raw Local Polish Honeys and Imported Honey Blends. Molecules 2021, 26, 2423. [Google Scholar] [CrossRef] [PubMed]
- Atanassova, J.; Lazarova, Y.; Lazarova, M. Pollen and inorganic characteristics of Bulgarian unifloral honeys. Czech J. Food Sci. 2012, 30, 520–526. [Google Scholar] [CrossRef]
- Rostislav, H.; Petr, T.; Ćavar, Z.S. Characterisation of phenolics and other quality parameters of different types of honey. Czech J. Food Sci. 2016, 34, 244–253. [Google Scholar] [CrossRef]
- Alzahrani, H.A.; Alsabehi, R.; Boukraâ, L.; Abdellah, F.; Bellik, Y.; Bakhotmah, B.A. Antibacterial and Antioxidant Potency of Floral Honeys from Different Botanical and Geographical Origins. Molecules 2012, 17, 10540–10549. [Google Scholar] [CrossRef]
- Attanzio, A.; Tesoriere, L.; Allegra, M.; Livrea, M.A. Monofloral honeys by Sicilian black honeybee (Apis mellifera ssp. sicula) havehigh reducing power and antioxidant capacity. Heliyon 2016, 2, e00193. [Google Scholar] [CrossRef]
- Di Marco, G.; Gismondi, A.; Panzanella, L.; Canuti, L.; Impei, S.; Leonardi, D.; Canini, A. Botanical Influence on Phenolic Profile and Antioxidant Level of Italian Honeys. J. Food Sci. Technol. 2018, 55, 4042–4050. [Google Scholar] [CrossRef]
- Gośliński, M.; Nowak, D.; Szwengiel, A. Multidimensional Comparative Analysis of Bioactive Phenolic Compounds of Honeys of Various Origin. Antioxidants 2021, 10, 530. [Google Scholar] [CrossRef]
- Tomczyk, M.; Tarapatskyy, M.; Dżugan, M. The influence of geographical origin on honey composition studied by Polish and Slovak honeys. Czech J. Food Sci. 2019, 37, 232–238. [Google Scholar] [CrossRef]
- Milosavljević, S.; Jadranin, M.; Mladenović, M.; Tešević, V.; Menković, N.; Mutavdžić, D.; Krstić, G. Physicochemical parameters as indicators of the authenticity of monofloral honey from the territory of the Republic of Serbia. Maced. J. Chem. Chem. Eng. 2021, 40, 57–67. [Google Scholar] [CrossRef]
- Sakač, M.; Jovanov, P.; Marić, A.; Četojević-Simin, D.; Novaković, A.; Plavšić, D.; Škrobot, D.; Kovač, R. Antioxidative, Antibacterial and Antiproliferative Properties of Honey Types from the Western Balkans. Antioxidants 2022, 11, 1120. [Google Scholar] [CrossRef] [PubMed]
- Dżugan, M.; Tomczyk, M.; Sowa, P.; Grabek-Lejko, D. Antioxidant Activity as Biomarker of Honey Variety. Molecules 2018, 23, 2069. [Google Scholar] [CrossRef] [PubMed]
- Chiş, A.M.; Purcărea, C. The phisico-chemical caracterisation of sun flower honey from bihor county. An. Univ. Din Oradea Fasc. Ecotoxicologie Zooteh. Şi Tehnol. Ind. Aliment. 2015, 14, 107–114. [Google Scholar]
- Živkov-Baloš, M.M.; Jakšić, S.M.; Popov, N.S.; Polaček, V.A. Characterization of Serbian sunflower honeys by their physicochemical characteristics. Food Feed. Res. 2021, 48, 1–8. [Google Scholar] [CrossRef]
- Boussaid, A.; Chouaibi, M.; Rezig, L.; Hellal, R.; Donsì, F.; Ferrari, G.; Hamdi, S. Physicochemical and bioactive properties of six honey samples from various floral origins from Tunisia. Arab. J. Chem. 2018, 11, 265–274. [Google Scholar] [CrossRef]
- De Almeida, A.M.M.; Oliveira, M.B.S.; Da Costa, J.G.; Valentim, I.B.; Goulart, M.O.F. Antioxidant Capacity, Physicochemical and Floral Characterization of Honeys from the NorthEast of Brazil. Rev. Virtual Química 2016, 8, 57–77. [Google Scholar] [CrossRef]
- Kavanagh, S.; Gunnoo, J.; Passos, T.M.; Stout, J.C.; White, B. Physicochemical Properties and Phenolic Content of Honey from Different Floral Origins and from Rural versus Urban Landscapes. Food Chem. 2019, 272, 66–75. [Google Scholar] [CrossRef] [PubMed]
- Ciappini, M.; Gatti, M.; Di Vito, M. El Color Como Indicador Del Contenido de Flavonoides En Miel. Rev. Cienc. Tecnol. 2013, 15, 59–63. [Google Scholar]
- Moniruzzaman, M.; Yung, A.C.; Azlan, S.A.B.M.; Sulaiman, S.A.; Rao, P.V.; Hawlader, M.N.I.; Gan, S.H. Identification of phenolic acids and flavonoids in monofloral honey from Bangladesh by high performance liquid chromatography: Determination of antioxidant capacity. BioMed Res. Int. 2014, 2014, 737490. [Google Scholar] [CrossRef] [PubMed]
Publisher’s Note: MDPI stays neutral with regard to jurisdictional claims in published maps and institutional affiliations. |
© 2022 by the authors. Licensee MDPI, Basel, Switzerland. This article is an open access article distributed under the terms and conditions of the Creative Commons Attribution (CC BY) license (https://creativecommons.org/licenses/by/4.0/).