Article

Aerial Seeding Promotes the Restoration of Ecosystem Health in Mu Us Sandy Grasslands in China

1
Research Center of Forest Ecology, Forestry College, Guizhou University, Guiyang 550025, China
2
Ministry of Education Key Laboratory of Ecology and Resource Use of the Mongolian Plateau, School of Ecology and Environment, Inner Mongolia University, Hohhot 010021, China
3
Collaborative Innovation Center for Grassland Ecological Security (Jointly Supported by the Ministry of Education of China and Inner Mongolia Autonomous Region), Hohhot 010021, China
4
Zhejiang Tiantong Forest Ecosystem National Observation and Research Station & Research Center for Global Change and Complex Ecosystems, School of Ecological and Environmental Sciences, East China Normal University, Shanghai 200241, China
*
Author to whom correspondence should be addressed.
Agriculture 2022, 12(8), 1255; https://doi.org/10.3390/agriculture12081255
Submission received: 8 July 2022 / Revised: 7 August 2022 / Accepted: 12 August 2022 / Published: 18 August 2022
(This article belongs to the Special Issue Restoration of Degraded Grasslands and Sustainable Grazing)

Abstract

:
Grassland ecosystem health is related to global ecological problems, and large areas of grassland are threatened by degradation. Various measures, such as aerial seeding, have been applied to restore degraded grassland ecosystems. However, the effects of these measures remain unclear. In this study, based on the CVOR (condition, vitality, organization, and resilience) model, the entropy method was used to calculate the ecosystem health of aerial seeding restoration sites in the Mu Us sandy grassland, China. Then, the relationship between CVOR value, various indices in the model, and restoration time was measured using correlation analysis. The results show that (1) the vitality criterion layer has the highest weight in the CVOR model; (2) the cautionary hierarchy is the most (40.0%), and the healthy hierarchy is the opposite (10.0%) among all the restoration sites; and (3) 30-year aerial seeding can promote ecosystem health in sandy grasslands. This study demonstrates that aerial seeding is an effective method for restoring degraded grassland ecosystems and can guide future restoration measures and policies for degraded ecosystems.

1. Introduction

The grassland ecosystem is the second largest terrestrial ecosystem. Its area accounts for about 24% of the total land area, and its biomass accounts for about 36% of the global vegetation biomass [1,2]. With the rapid development of industrialization and urbanization, grassland ecosystems worldwide have been damaged to varying degrees. Grasslands are threatened by degradation, and some areas even face severe desertification [3]. Desertification damages soil quality, reduces land resources, and results in sandstorms. It further restricts local economic development and people’s lives, thereby threatening the livelihood of nearly one billion people worldwide [4]. Therefore, grassland desertification has been one of the main obstacles to global sustainable development [5].
In order to solve the degradation of the ecological environment, such as grassland desertification, many major ecological restoration policies, including the Three Norths Shelter Forest Program (TNSFP), the Combating of Desertification Program (CDP), the Natural Forest Protection Project (NFPP), and the Grain for Green Project (GGP), have been implemented in northern China since 1978 [6,7,8]. The specific implementation measures of these ecological restoration projects mainly include the following aspects [9]: seeding trees and grass aerially; afforesting; inhibiting sand movement using blockades; setting up wind barriers in dunes; building fences around grasslands; prohibiting grazing; cultivating high-quality grass species; building livestock sheds; providing feed and machinery for herders; prohibiting timber harvests; strengthening forest divisions; providing subsidies for food, living expenses, and afforestation fees to farmers who return farmland for afforestation; encouraging ecological immigration; and returning forestry (grass) ownership to farmers. In recent decades, the effects of these ecological restoration measures and whether they can promote the restoration of ecosystem health have attracted extensive attention from scholars. Therefore, reasonable assessment of the contribution of ecological restoration measures to the grassland ecosystem health has become a hotspot in current research.
The “ecosystem health” concept was proposed in the 1980s and received widespread attention [10,11]. Robert et al. [12] proposed that a healthy ecosystem has certain resistance and resilience to disturbances such as diseases and can maintain its own independence and also introduced three indicators (vitality, organization, and resilience: VOR) of ecosystem health evaluation based on the stability and resilience of ecosystems. Toman [13] defines “ecosystem health” as the stability and continuity that a system maintains. The definition suggests that with the passage of time and space, the ecosystem maintains metabolic vitality, dynamic balance, and structural stability and resists external environmental threats. Such a system state is considered to be healthy. The evaluation criteria of ecosystem health proposed by Rapport et al. [14] include eight aspects: vitality, resilience, organizational structure, maintenance of ecosystem services, management choices, reduction in inputs, harm to adjacent systems, and human health impacts. Most of the evaluation methods of ecosystem health use the index system method, which has a series of evolutions: the single-factor listing method, the single-factor composite method, the VOR evaluation method, and the CVOR (condition, vitality, organization, and resilience) evaluation method [15]. Among them, the CVOR model has been widely concerned since it was proposed [16,17], and many researchers have carried out certain tests and applications using the model [18].
The ecological transition zone of the Mu Us Desert from the Ordos Plateau to the Loess Plateau in China is characterized as an ecotone of pasture, forest, and agriculture and is considered an ecologically fragile zone. Accordingly, this area has been the focus of national policies for ecological restoration, with the land exhibiting varying degrees of land degradation and being threatened by desertification over many years [19]. Mobile dunes are the most severely degraded type in the region and are difficult to be restored naturally without human intervention. Therefore, aerial seeding was carried out for such an area. Seeds were sown in the ground for plant restoration using aerial devices such as drones, planes, or helicopters. In this study, we quantified soil nutrient indicators, aboveground biomass, species diversity, functional diversity, and phylogenetic diversity of 30 sandy grassland sequence field sites that underwent 30 years of aerial seeding restoration. Thus, the ecosystem health status of each site was obtained to evaluate whether aerial seeding could promote the Mu Us sandy grassland ecosystem health.

2. Materials and Methods
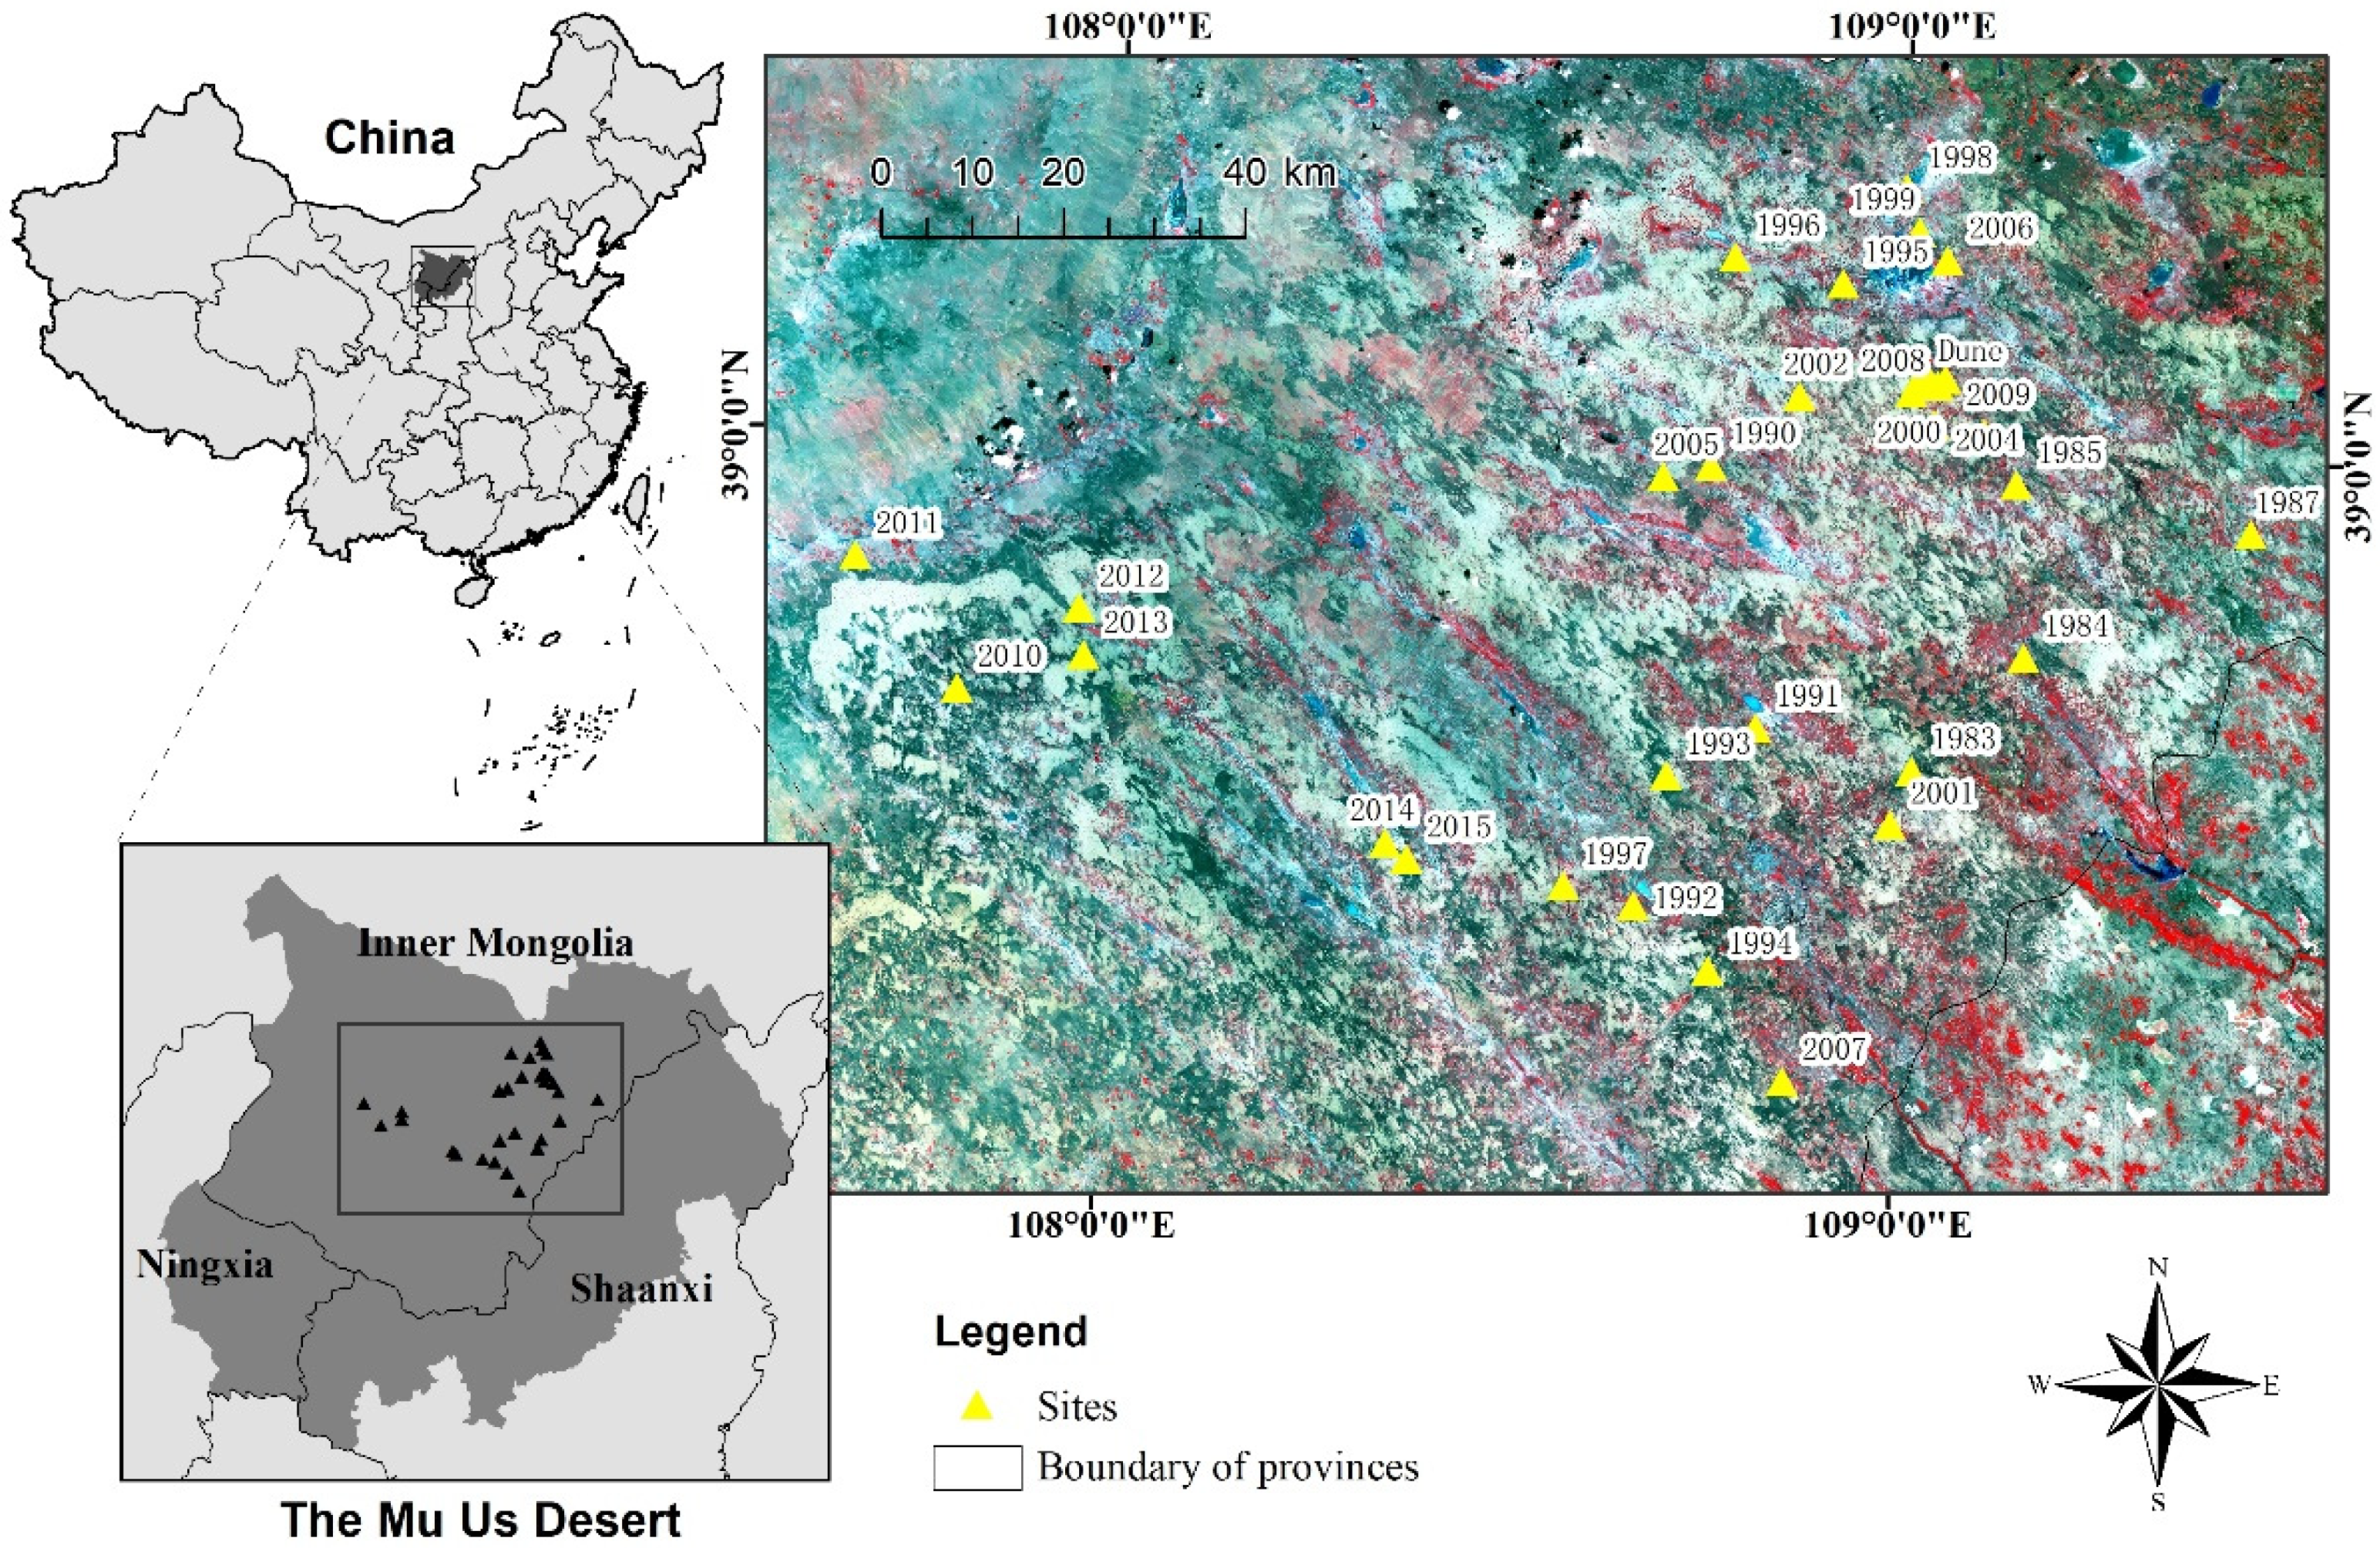
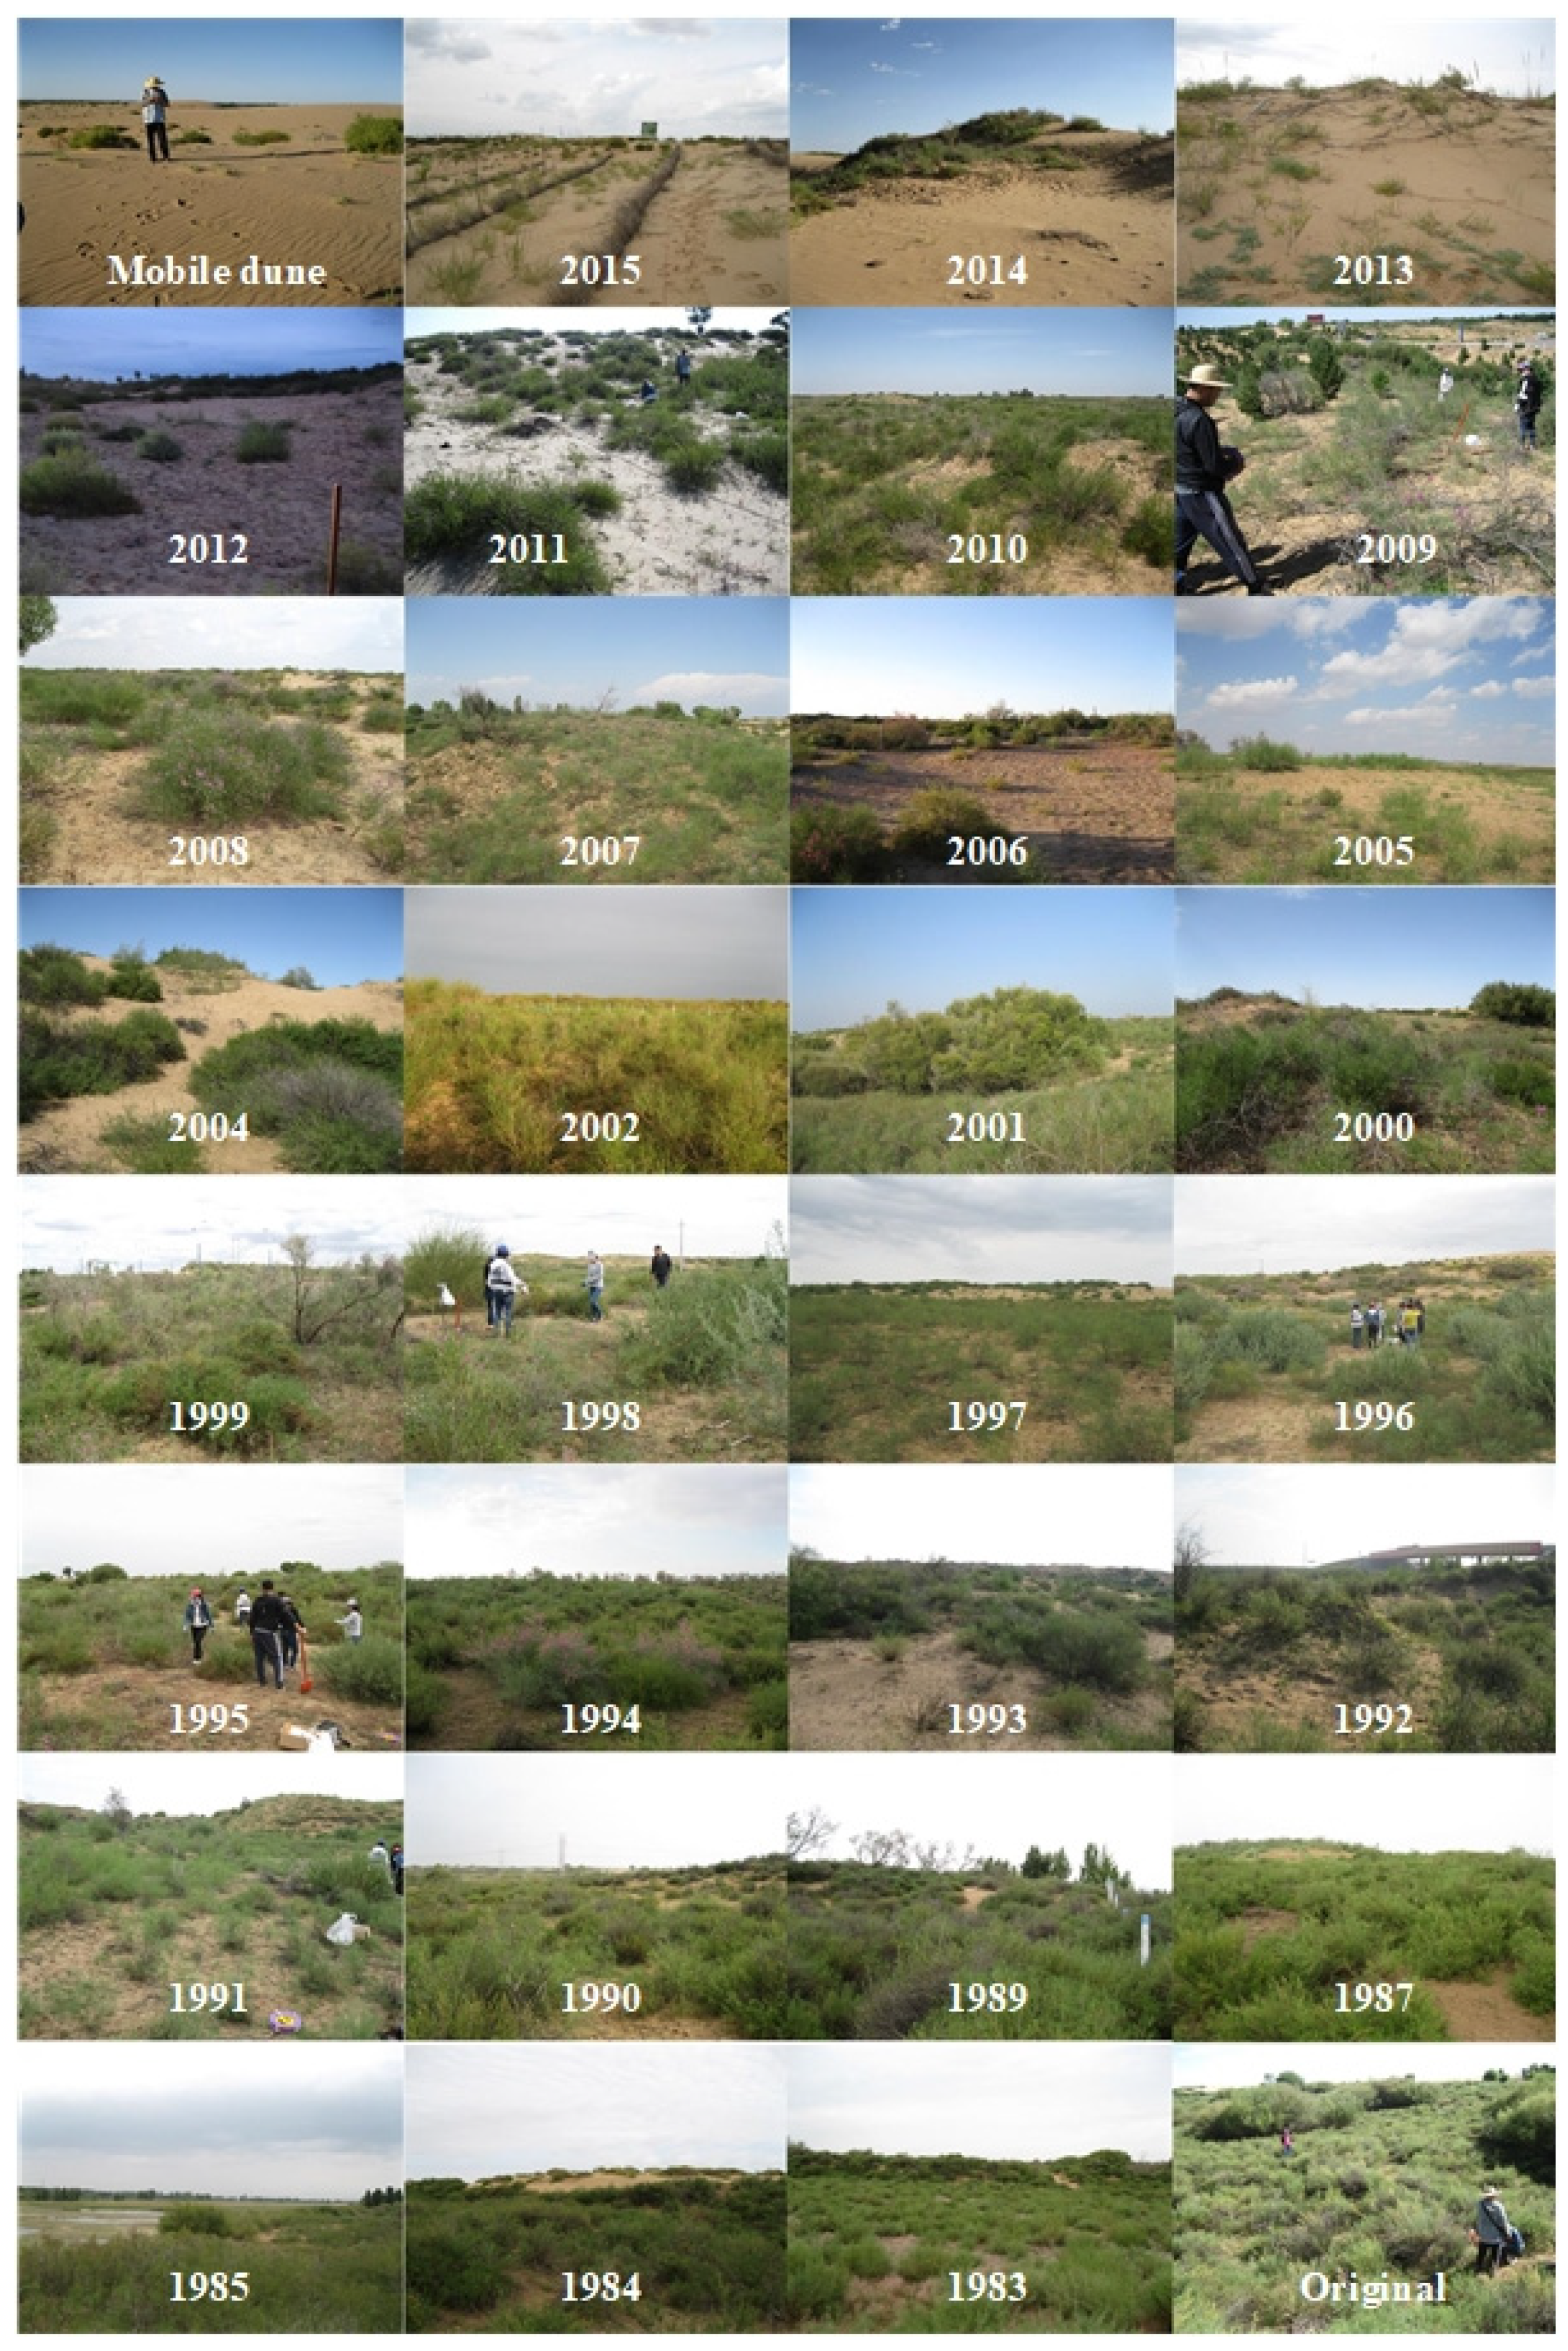
2.1. Study Area

The Mu Us Desert (106°11′–110°54′ E, 36°49′–40°12′ N) encompasses Shaanxi Province, the Ningxia Hui, and Inner Mongolia Autonomous Region. Aerial seeding is implemented by local forestry departments, with varying methods adopted in different provinces. In order to avoid the impact of different implementation methods, we selected sample sites using the same aerial seeding techniques in the core of the Mu Us Desert within the Inner Mongolia Autonomous Region (Figure 1). The area has a temperate arid to semi-arid continental monsoon climate, a mean annual temperature of 6.2 °C, mean annual precipitation of approximately 250 mm, and an elevation of approximately 1300 m. The Mu Us Desert has variable topography with various landforms, including active dunes, semi-fixed dunes, and fixed dunes. The main soil types are Kastanozems, Arenosols, Histosols, and Solonchaks. The zonal vegetation is dominated by Stipa bungeana Trin. and Thymus serpyllum L. plant communities, while sandy vegetation is dominated by Artemisia ordosica Antoine, Salix psammophila C. Wang & Chang Y. Yang, and Sabina vulgaris Antoine [20].
The aerial seeding in the study area uses planes to broadcast the grass seed suitable for the local environment on the barren hills or sandy land and carry out the enclosure and care management (e.g., grazing prohibition) until the vegetation is restored. Thus, the purpose of sand prevention and control can be achieved. Aerial seeding has been implemented since the 1980s, and due to the large area of the Mu Us Desert and there being almost no surface water source, irrigation and fertilization cannot be implemented, so aerial seeding is carried out in May to June (there is a natural sand cover process before the hot rainy season in July to August) to ensure that the seeds have sufficient water and heat to germinate and grow after they fall. According to the terrain difference, the mixed species seed sowing is about 6.0–7.0 kg/ha, and the amount of seeds in unfavorable terrain (low survival rate) such as sloping land is higher than that in good terrain such as flat land (high survival rate). On this basis, no artificial intervention measures such as irrigation and fertilization are required. The sand area must be at least 70 ha for aerial seeding; otherwise, it is not conducive to the operation of the aircraft. The main species being broadcast are Hedysarum laeve Maxim. (50%) and Hedysarum scoparium Pall. var. mongolicum (Turcz.) Turcz. ex B. Fedtsch. (50%), which are introduced alien species that are suitable for dry sandy land and will be replaced by native species in the late succession. We selected 30 sites that have been aerial seeded from 1983 to 2015 (excluding 1986, 1988, and 2003), 1 non-aerial seeding mobile dune site, and 1 original (top community and undisturbed >30 years) reference site, for a total of 32 sample sites, and we photographed the overall condition of each site (Figure 2). According to the local forestry bureau records, the aerial seeding time of the sites was determined. Since the 1980s, aerial seeding has been performed in many local plots yearly, but success is not guaranteed for all plots. The successful restoration areas were chosen as study sites. The initial state of the degraded sites before aerial seeding was mobile dunes.

2.2. Data Sources

Plant and soil samples were collected in August 2017. Sites on flat land between dunes were established to keep the topography consistent, ensuring the 32 field sites had the same resource acquisition capacity. First, a relatively homogeneous site of 10 m × 10 m was chosen in each aerial seeding area, three 1 m × 1 m plots were sampled along the diagonal at each site, and the species and number of plants per species were recorded. Then, the aboveground part of the plant was cut off before we dried it in an oven at 65 °C to a constant weight. The following traits were measured in this study: plant height (H, cm), leaf area (LA, cm2), leaf dry mass (LDM, g), specific leaf area (SLA, cm2 g−1), leaf organic carbon (LOC, %), leaf nitrogen (LN, %), and leaf phosphorus (LP, g/kg). We also used a soil auger at each plot to drill two samples of 0–60 cm soil and stored them at room temperature to determine soil nutrient content.
The phylogeny of the 43 plant species we collected in this study was constructed using Phylomatic Version 3 [21] based on a comprehensive species-level phylogeny of 31,749 angiosperm species worldwide [22]. This method can provide high-resolution phylogenetic relationships among species [23,24].
Soil nutrient indices were determined. We measured total soil carbon (TC) using the potassium dichromate (K2Cr2O7) heating oxidation method, total soil nitrogen (TN) using the selenium-cupric sulfate (CuSO4)-potassium sulfate (K2SO4)-heating digestion method, total soil phosphorus (TP) using the alkali fusion-Mo-Sb colorimetric method, soil ammonium nitrogen (NH4+) and soil nitrate nitrogen (NO3) using the Kjeldahl nitrogen determination method, and soil available phosphorus (AP) using the sodium bicarbonate (NaHCO3) leaching-Mo-Sb colorimetric method.

2.3. Data Analysis

2.3.1. The Establishment of an Evaluation Index System

The CVOR model was used to evaluate the ecosystem health of sandy grassland. This model consists of four criterion layers: condition (C), vitality (V), organization (O), and resilience (R). Each criterion layer consists of various indices (Table 1).
The calculation formula of CVOR is as follows:
CVOR = WC × C + WV × V + WO × O + WR × R
where WC, WV, WO, and WR represent the weight coefficients of C, V, O, and R, respectively.

2.3.2. Determination of Reference System

The Hobbs method [25] was adopted to select the reference system. The undamaged or lightly damaged “natural ecosystem” in or near the study area was taken as the reference system. Then, the original (top community and undisturbed > 30 years) site was taken as the reference site, which was defined as the healthiest sandy grassland ecosystem (CVOR = 1).

2.3.3. The Evaluation of Condition (C) Criterion Layers

The basal condition (C) mainly reflects the external environmental factors, such as soil nutrients, which are closely combined with vegetation [26]. We selected TC, TN, TP, NH4+, NO3, and AP as the base conditions. The calculation formula is as follows:
C i = C iTC × W TC + C iTN × W TN + C iTP × W TP + C iNH 4 + × W NH 4 + + C iNO 3 × W NO 3 + C iAP × W AP C original
where Ci represents the value of the i-th site’s condition; CiTC, CiTN, CiTP, Ci NH4+, Ci NO3-, and CiAP represent the values of TC, TN, TP, NH4+, NO3, and AP in the i-th site, respectively; Coriginal represents the value of original site’s condition; WTC, WTN, WTP, WNH4+, WNO3−, and WAP represent the weight of TC, TN, TP, NH4+, NO3-, and AP in all sites, respectively. Ci ∈ [0, 1], and if Ci > 1, Ci is taken as 1.

2.3.4. The Evaluation of Vitality (V) Criterion Layers

Vitality refers to the fixed energy of the grassland ecosystem, which can be evaluated by photosynthetic efficiency and aboveground biomass [27]. The aboveground biomass (AB) was used to represent vitality (V) in this study. The calculation formula is as follows:
V i = V iAB V original
where Vi represents the value of the i-th site’s vitality; ViAB represents the value of AB in i-th site; Voriginal represents the value of the original site’s vitality.

2.3.5. The Evaluation of Organization (O) Criterion Layers

Organization (O) means the composition of species in an ecosystem and the relationships between species and reflects the structural complexity and functional optimization ability of grassland ecosystems [27]. Species richness index (S), Shannon–Wiener index (H′), phylogenetic richness (P), functional richness (FRic), functional evenness (FEve), and functional dispersion (FDis) were used to represent organization (O) in this study. The calculation formula is as follows:
O i = O iS × W S + O iH × W H + O iP × W P + O iFRic × W FRic + O iFEve × W FEve + O iFDis × W FDis O original
where Oi represents the value of the i-th site’s organizational strength; OiS, OiH′, OiP, OiFRic, OiFEve, and OiFDis represent the value of S, H′, P, FRic, FEve, and FDis in i-th site, respectively; Ooriginal represents the value of original site’s organizational strength; WTC, WTN, WTP, WNH4+, WNO3−, and WAP represent the weight of S, H′, P, FRic, FEve, and FDis in all sites, respectively. Oi ∈ [0, 1], and if Oi > 1, Oi is taken as 1.

2.3.6. The Evaluation of Resilience (R) Criterion Layers

Resilience (R) is the resistance or rebound ability of a grassland ecosystem under stress. Plant height (H), leaf area (LA), leaf dry mass (LDM), and specific leaf area (SLA), leaf organic carbon (LOC), leaf nitrogen (LN), and leaf phosphorus (LP) were used as indicators to calculate the community-weighted mean (CWM) of traits to characterize the resilience (R) in this study. Influencing traits refer to the characteristics of plants that determine or act on ecosystem processes and can reflect the resilience of the community to a certain extent [28]:
CWM = i = 1 S P i × X i
where S represents the number of plant species, Pi represents the relative abundance of plant species i in one particular site, and Xi represents one functional trait of plant species i in one particular site.

2.3.7. Determination of Weights of Indices in the COVR Model and Each Criterion Layer

Weight is a value used to measure the influence of all indices in the COVR model and each criterion layer, indicating the status and importance of an index in the evaluation system [29]. In the multi-level evaluation system, the key to evaluation is the accuracy of each index weight and the dialectics of the index system. In this study, the entropy method was used to determine the weight value of the index in the COVR model and each criterion layer.

2.3.8. Calculation of Plant Species, Phylogenetic, and Functional Diversity

For plant species diversity, we defined species richness as the total number of species from the three plots within each site. Then, the Shannon–Wiener index (H′) for each site was calculated based on plant species abundance information:
H   =   i = 1 S p i ln p i
S represents the total number of species, and pi represents the proportion of the i-th species to the total.
The mean phylogenetic distance (P) between species in a community was calculated as the phylogenetic diversity using the ‘mpd’ function in the ‘picante’ package in R [30].
The functional diversity (including functional richness—FRic; functional evenness—FEve; functional dispersion—FDis; community weight mean of traits—CWM) was calculated based on functional traits (H, LA, SLA, LDM, LOC, LN, LP) using the ‘dbFD’ function in the ‘FD’ package in R [31].

2.3.9. Establishment of Grassland Ecosystem Health Hierarchy Standards

The natural break (Jenks) classification is used to classify the CVOR of all sites into healthy (with good vegetation growth, fertile soil, and high plant diversity), unhealthy (with bad vegetation growth, poor soil, and low plant diversity), cautionary (with extremely low vegetation cover), and collapse (almost impossible to grow plants) levels. The natural break (Jenks) classification method is based on the natural grouping in the data to identify the classification interval, which can most appropriately group similar values and maximize the differences between the various classes. Features will be divided into multiple classes, and for these classes, boundaries will be set where the data values are relatively different [20].

2.3.10. The Response of Indices in Each Criterion Layer and Grassland Ecosystem Health to the Restoration Time

We performed separate Pearson’s correlation coefficient analyses to determine the strength of the relationship between indices in each criterion layer, grassland ecosystem health (CVOR), and restoration time.

3. Results

3.1. The Weights of Indices in the COVR Model and Each Criterion Layer

In the CVOR model, the weight of the vitality criterion layer is the highest, while the weight of the resilience criterion layer is the opposite. We chose only one index in the vitality criterion layer, so the index weight value in the vitality criterion layer was not considered. In the condition criterion layer, the NH4+ has the highest weight. The weight values of FEve and FRic are the highest in the organization criterion layer, and the difference between the two is small. The CWMLP has the highest weight in the resilience criterion layer, followed by CWMH (Table 2).

3.2. The Standards of Grassland Ecosystem Health Hierarchy

The thresholds of the four grassland ecosystem health hierarchies were divided by the natural break (Jenks) classification (Table 3, Figure 3). Among them, the distribution of the collapse hierarchy is the most concentrated, followed by the unhealthy hierarchy. The healthy hierarchy is most widely distributed.

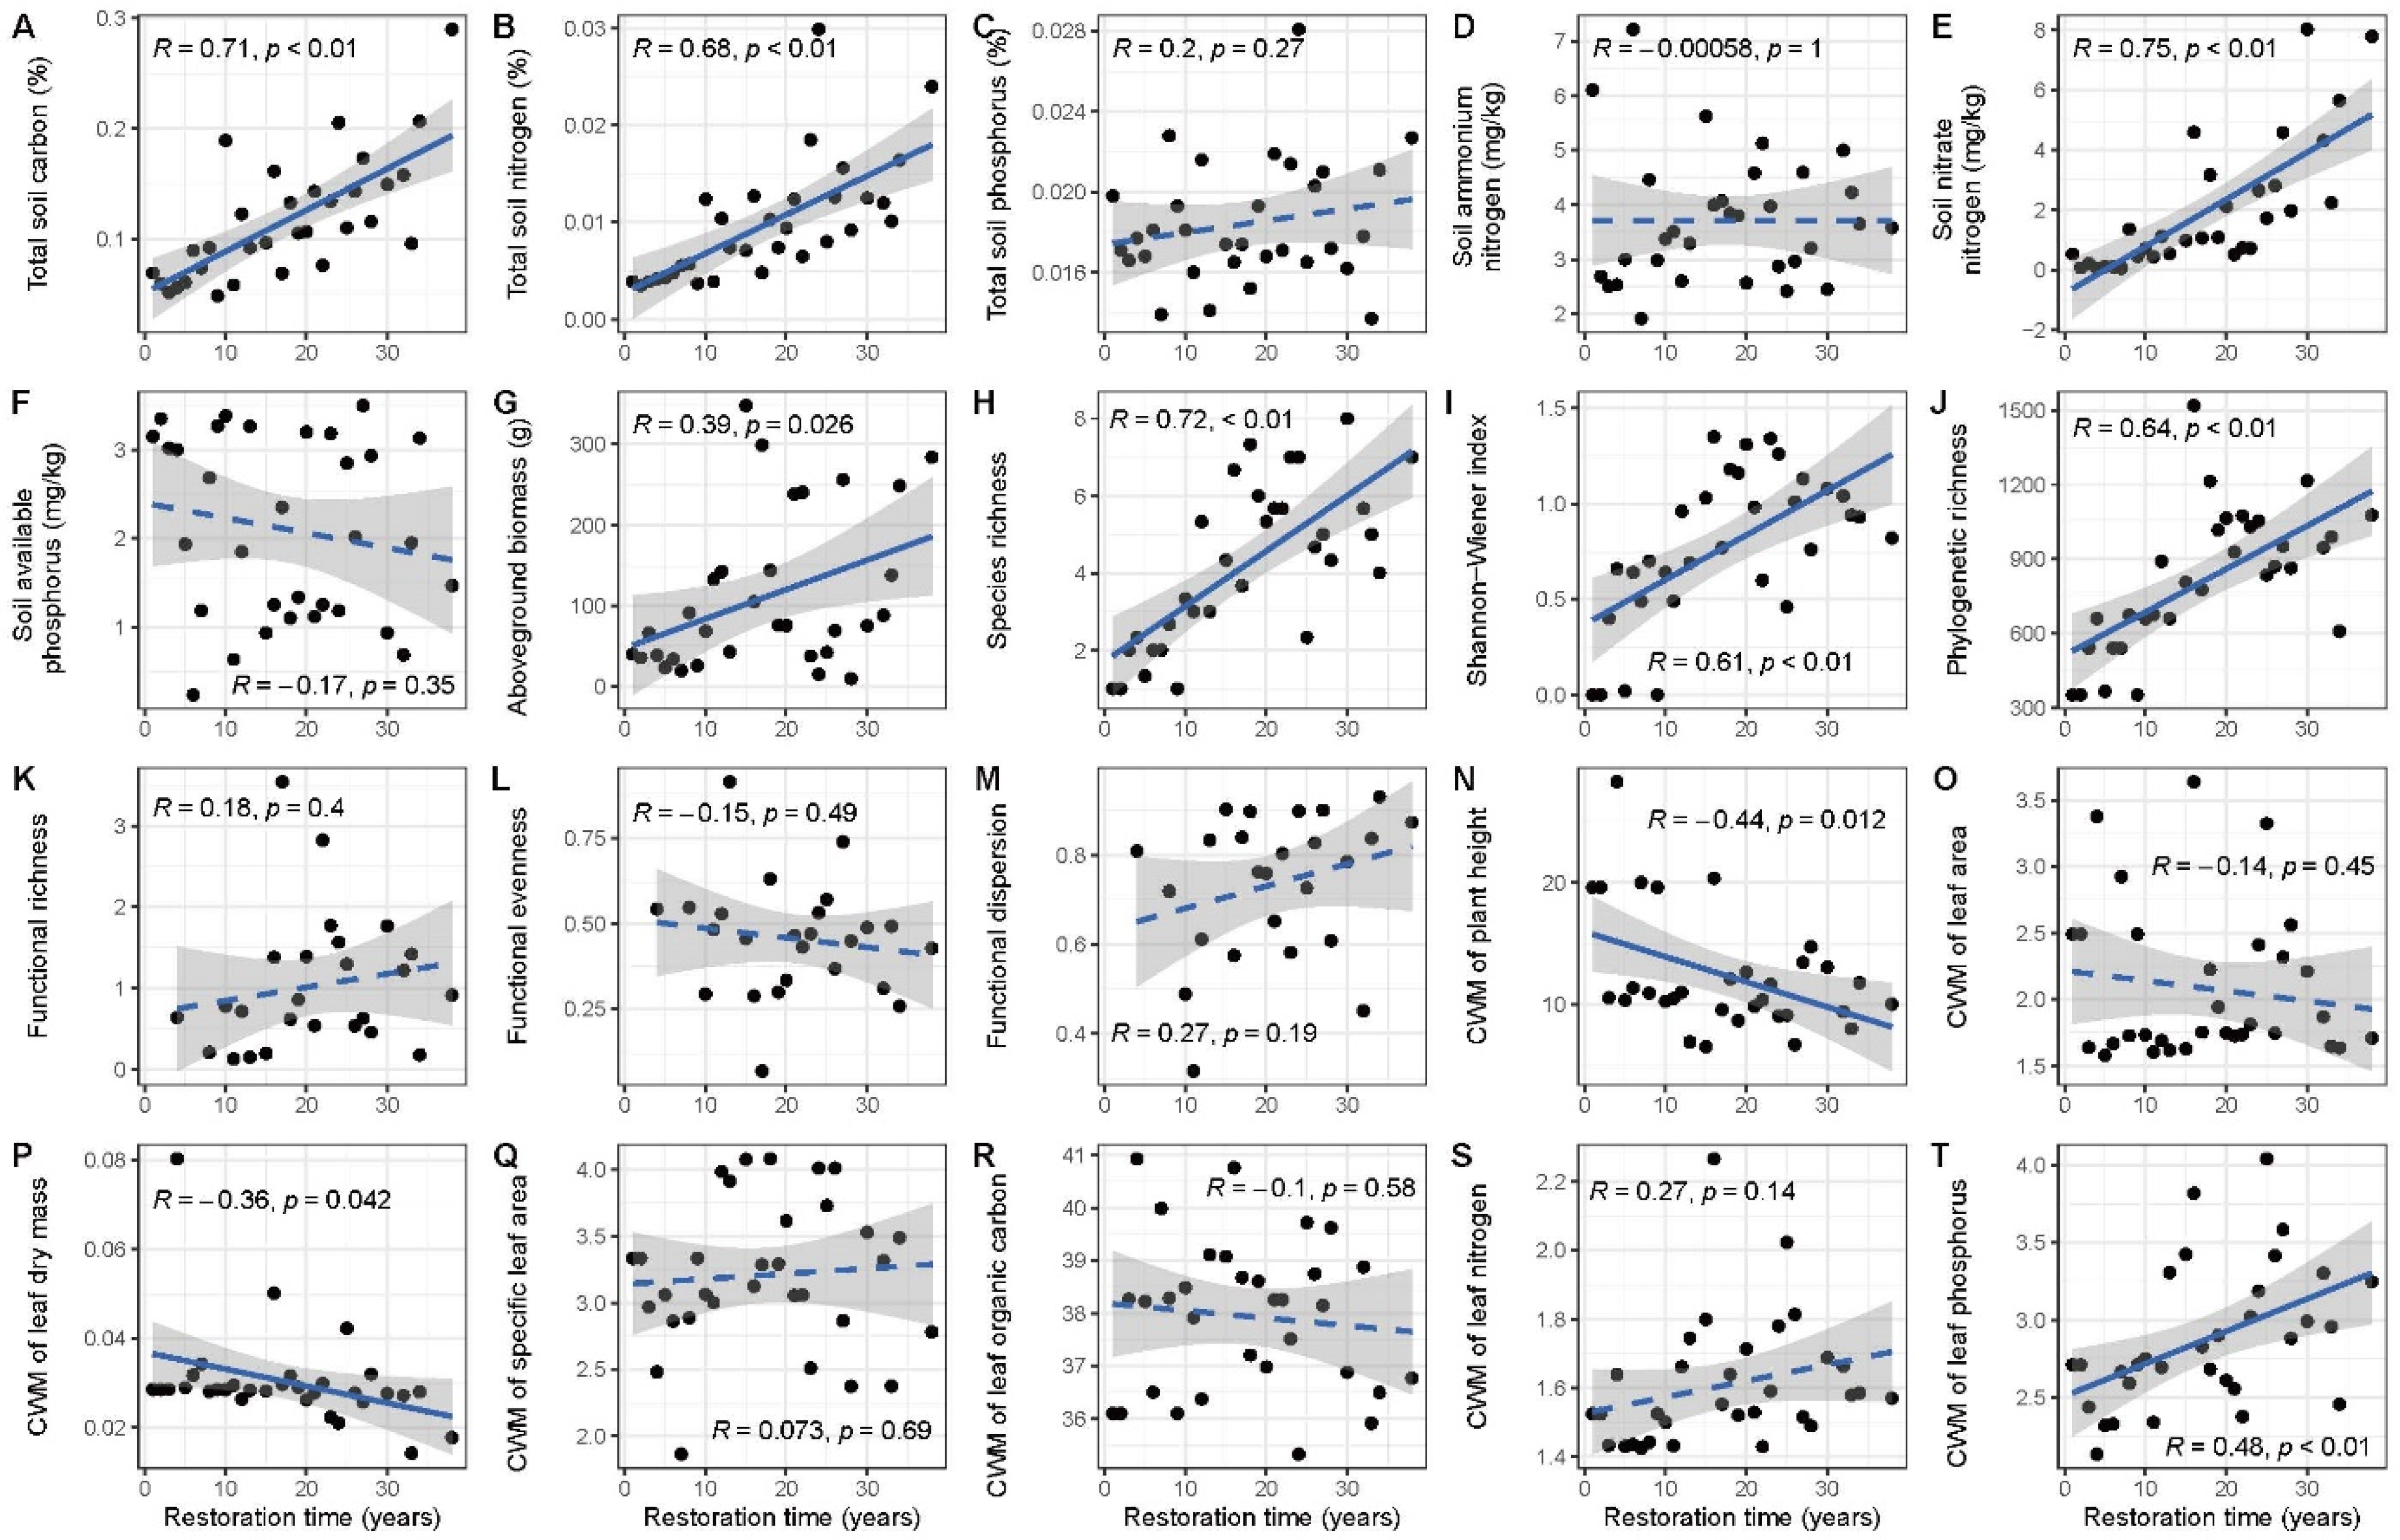
3.3. The Response of Indices in Each Criterion Layer to the Restoration Time

There are 20 indices in the CVOR model. Ten indices show a correlation with restoration time, and three indices (TC, TN, NH4+) in the condition criterion layer show a positive correlation with restoration time (Figure 3A,B,E). The aboveground biomass in the vitality criterion layer positively correlates with restoration time (Figure 3G). Three indices (S, H′, P) in the organization criterion layer show a positive correlation with restoration time (Figure 3H,I,J). Among the seven indices in the resilience criterion layer, one of them (CWMLP) is positively correlated with restoration time (Figure 3T), and two of them (CWMH and CWMLDM) are negatively correlated with recovery restoration (Figure 3N,P).

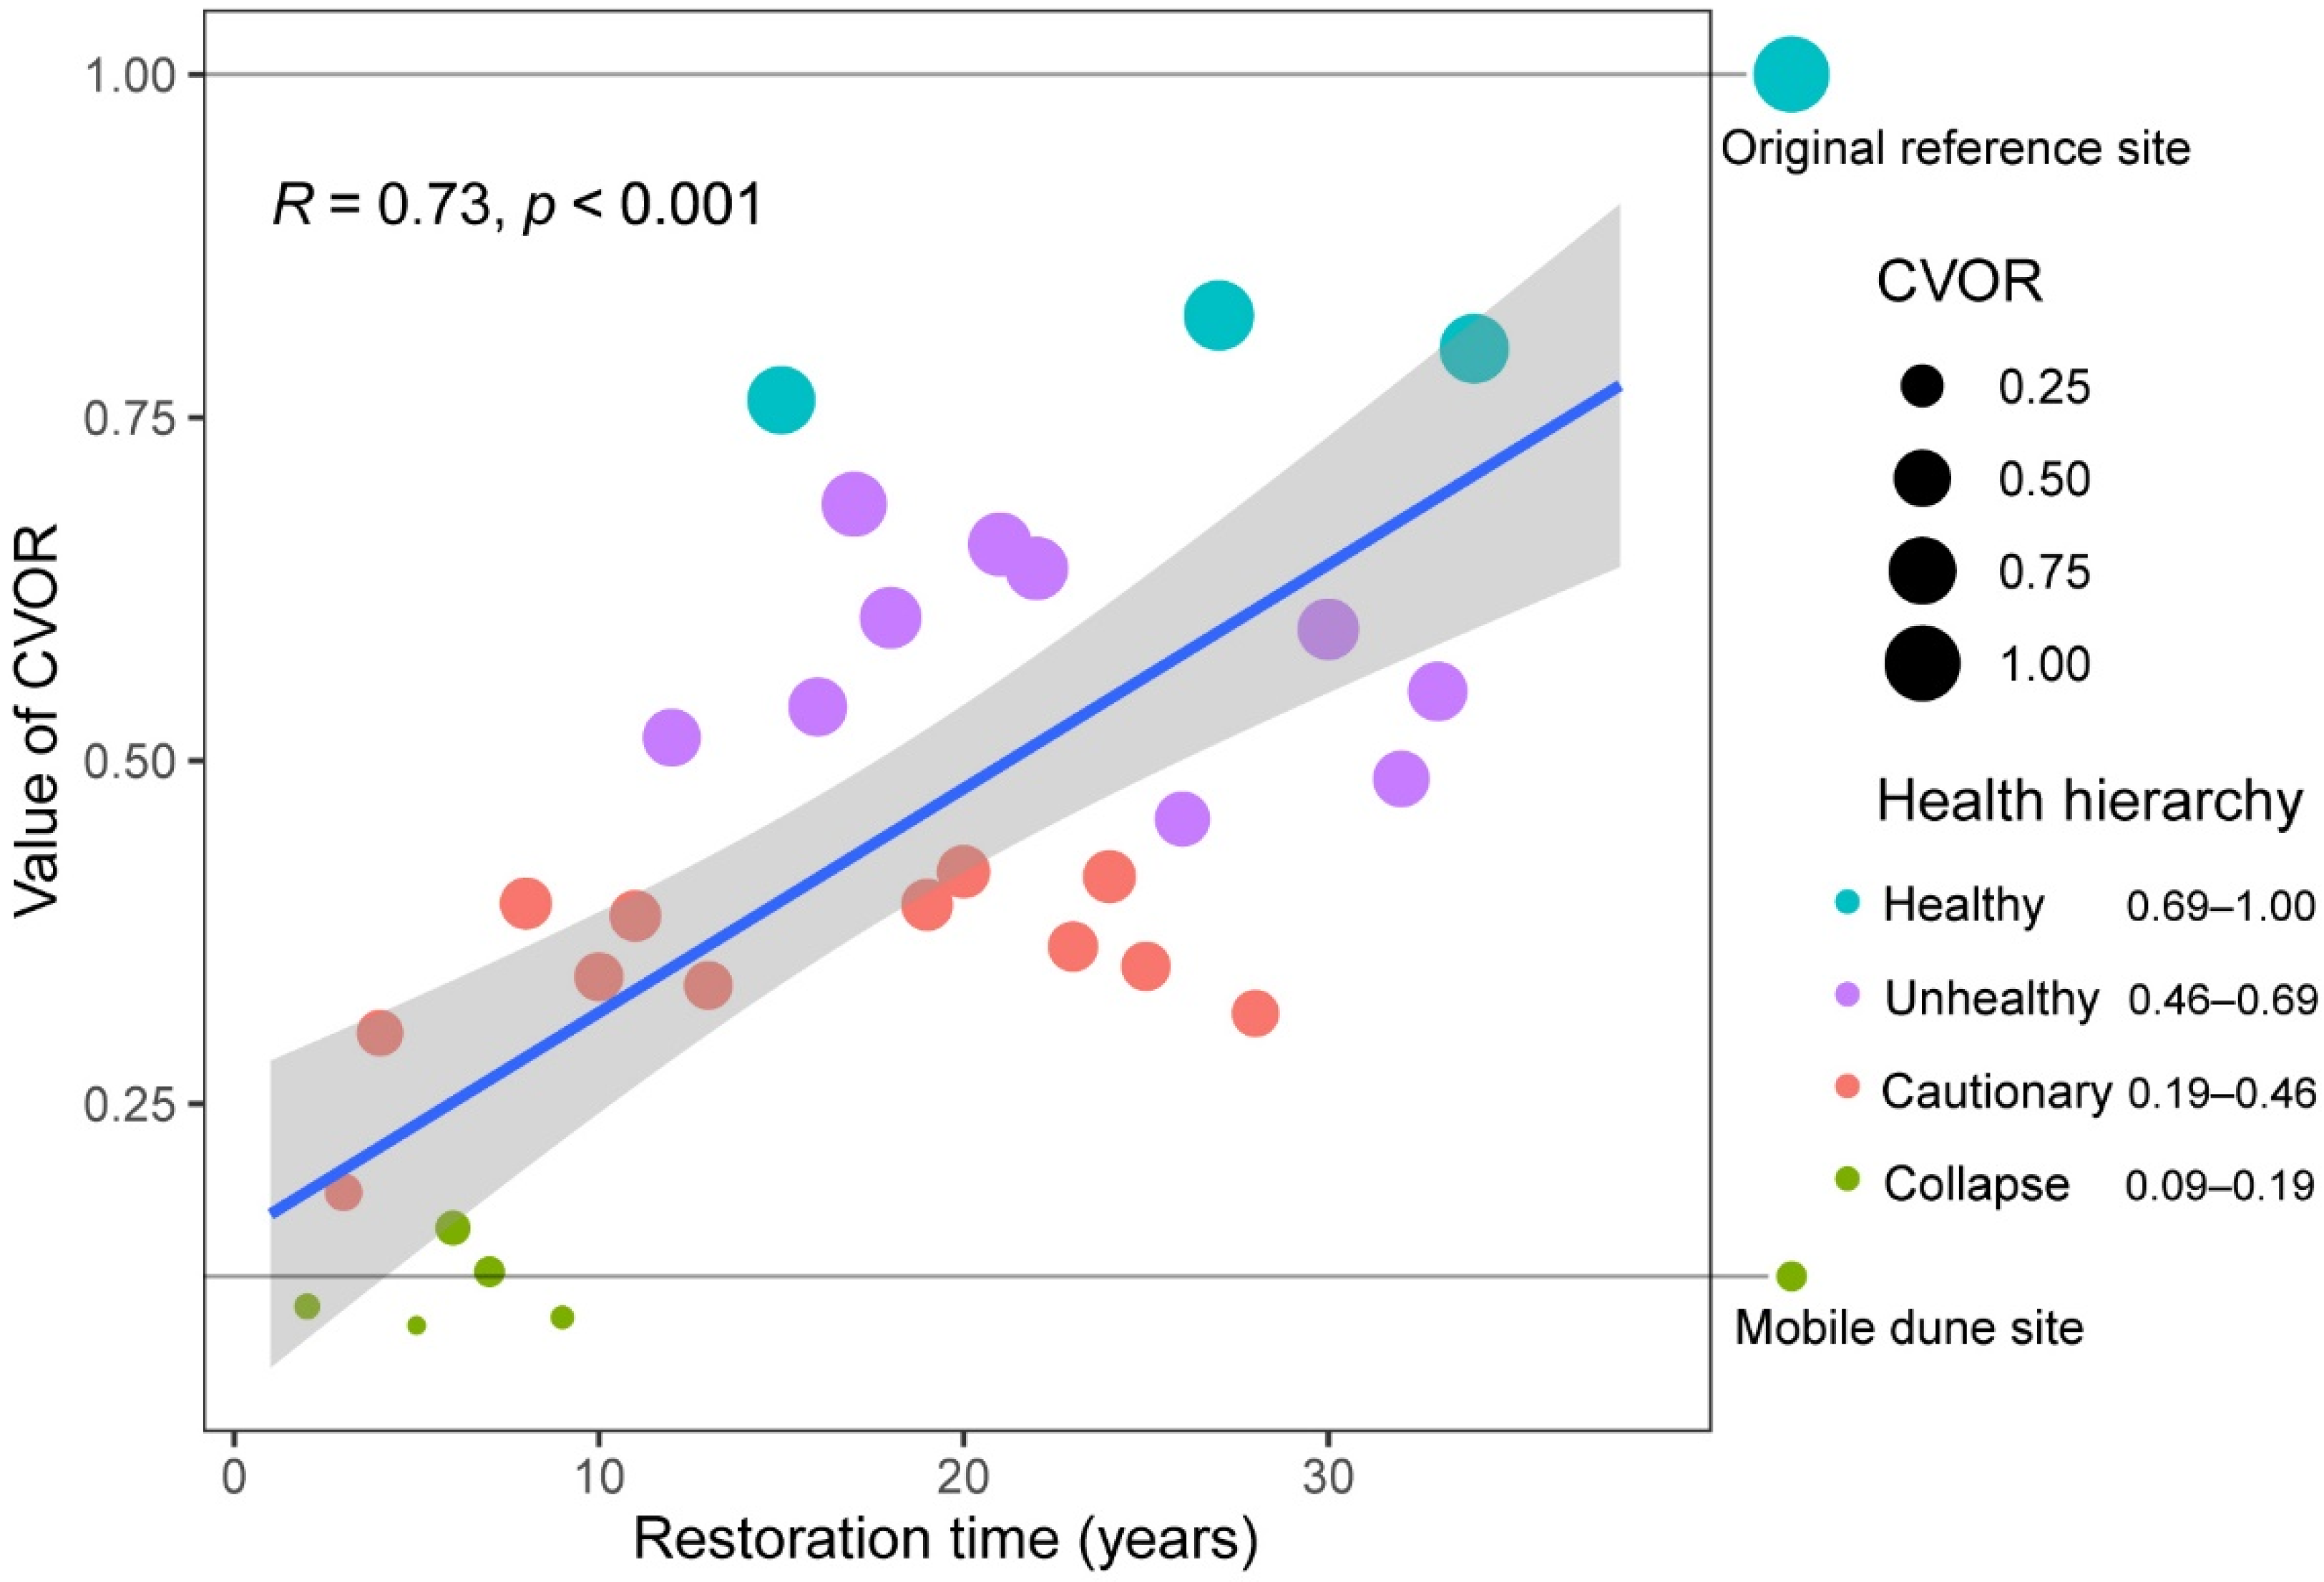
3.4. The Response of Grassland Ecosystem Health to the Restoration Time

The grassland ecosystem health (value of CVOR) shows an increasing trend with the recovery years (Figure 4). Most sites are in the cautionary hierarchy, accounting for 40.0% of all sites. Furthermore, 33.3% are in the unhealthy hierarchy, and 16.7% are in the collapse hierarchy. The smallest proportion is the healthy hierarchy, accounting for 10.0% of all sites.

4. Discussion

Various factors, including plant species, phylogenetic and functional diversity, and environmental indices such as soil nutrients, should be fully considered in evaluating grassland ecosystem health. The selection of indices and the establishment of the evaluation index system is key to accurately evaluating the health of the ecosystem [32]. We selected 20 typical indices and evaluated the ecosystem health restoration of 32 aerial seeding restoration sites in the Mu Us Sandy Grassland using the CVOR evaluation system. The weight coefficient in each criterion layer and index was determined using the entropy method, avoiding the use of subjective methods such as the average method to determine the weight and increasing the scientific logic.
The weights of condition, vitality, organization, and resilience are critical to the evaluation of the CVOR evaluation system. In this study, the vitality criterion layer has the highest weight, followed by the condition and organization criterion layers, and the resilience criterion layer has the lowest weight (Table 2). Although Shi et al. conducted a study on a larger spatial scale in the Inner Mongolia steppe, this is still consistent with their findings [33]; this may be due to having similar seed banks and soil conditions. Vitality is related to plant photosynthesis, and its operation depends on the basic structure and function of plants. It reflects the strength of physiological activities and metabolic capacity [34] and is the most direct and powerful expression of grassland growth status. This may be the reason why the vitality criterion layer receives the highest weight. The condition and organization criterion layers have similar weights. The condition criterion layer mainly reflects soil characteristics, which are related to the basic conditions of the grassland ecosystem, such as material flow, energy flow, and abiotic factors [35]. It also reflects the living environment of grassland plants, which is the premise of healthy and normal growth and development of vegetation and is the basic guarantee and essential performance of the health of grassland ecosystems. Organization can reflect the strengthening ability of structure and function, which can be understood as an optimization based on vitality [27]. Resilience is the ability of an ecosystem to maintain stability [36]. It has the lowest weight. The result is consistent with the findings of most studies [27,33], indicating that the resilience criterion layer is relatively less important than the other three criterion layers in evaluating grassland ecosystem health.
Each criterion layer has different weights in the CVOR model, and various indices have different weights in a specific criterion layer. In the condition criterion layer, the NH4+, TN, and TC have relatively high weight (Table 2), and the correlation analysis also shows that they are positively correlated with the restoration time (Figure 3A,B,E). this is different from the findings of Shi et al. [33]: in their study, TC has the highest weight in the condition criterion layer, followed by TP. This may be due to the difference between sandy soils and general soils. Nitrogen is an important nutrient for plant synthesis of organic matter [37]. It is the element that plants absorb the most from the soil and is the most easily lost through leaching or volatilization [38]. Most of the nitrogen in the soil exists in the organic state and can only be absorbed and utilized by plants after being transformed into available nitrogen through mineralization [39]. Ammonium and nitrate nitrogen are the main forms of soil available nitrogen [40], and their absorption by plants accounts for about 70% of the total absorption of anions and cations [41]. Therefore, nitrogen elements, especially NH4+, have a high weight in the base condition criterion layer. Soil organic carbon refers to the sum of humus, animal and plant residues, and microorganisms under the action of microorganisms. Its content and dynamic balance are also important indicators reflecting soil quality and grassland health, directly affecting soil fertility and grassland productivity [42]. In addition, it is often synergistic with nitrogen, so TC also has a relatively high weight. In the organization criterion layer, the weight of plant functional diversity is higher than that of species diversity and phylogenetic diversity. Functional diversity means the size and range of biological functional traits in an ecosystem [43]. Species diversity means the number and distribution of species and indicates the health of the structure and function of grassland ecosystems. Phylogenetic diversity refers to the sum of the shortest phylogenetic clade lengths among species that appear in a community. Functional diversity can reflect the complementary relationship of ecological niches between different species, thus providing strong support for the organizational criterion layer [44]. In resilience criterion layer, CWMH and CWMLP have higher weight values. Plant height can better reflect the spatial structure of plant communities and is an important support for community resilience, so it has obtained a higher weight. Phosphorus can promote photosynthesis and carbohydrate synthesis, so the phosphorus content of plant leaves also has a higher weight in the resilience criterion layer [27].
In order to curb the development of desertification, some major ecological restoration policies have been implemented in northern China. Aerial seeding is one of the most widely used means to promote the restoration of sandy grassland ecosystems. However, studies on the effect of aerial seeding are limited [20]. We found that the CVOR increased significantly with the restoration time by analyzing the correlation between CVOR value, the various indices, and the restoration time (Figure 4). In addition, it can also be found from the photographs of each site that the situation of the sandy grassland improves with the increase of the aerial seeding time (Figure 2). The result indicates that aerial seeding has been important in restoring the Mu Us sandy grassland ecosystem since the 1980s. After 30 years of aerial seeding restoration from mobile dunes, 37.5% of the sites are in the unhealthy hierarchy; 31.25% are in the cautionary hierarchy; 18.75% are in the collapse hierarchy; and only 12.5% are in the healthy hierarchy. During the first decade, most sites were still in the collapse hierarchy. Most of the sites were in an unhealthy and cautionary hierarchy for 10–30 years, but due to differences in restoration speed, the sites in the healthy hierarchy appeared from the 15th year of restoration, although the proportion was small (Figure 4). Therefore, aerial seeding is an effective measure to restore the sandy grassland ecosystem health, and sand grassland ecosystems can be achieved from collapse hierarchy to health hierarchy through a 30-year cycle. This study can guide the restoration of degraded grasslands in the future.

5. Conclusions

Based on the analysis of 30 field sites in the Mu Us Desert from 1983 to 2015, we calculated the ecosystem health status of each site based on the CVOR model using the entropy method and found that the vitality layer had the highest weight among the four criterion layers. Soil nitrogen and carbon have high weights in the base condition criterion layer and plant functional diversity has the greatest support in the organization criterion layer. The CVOR results are divided into healthy, unhealthy, cautionary, and collapse levels using the natural break (Jenks) classification. Cautionary hierarchy has the highest proportion, accounting for 40.0% of all sites. Healthy hierarchy has the smallest percentage, which is 10.0%. These results show that aerial seeding has promoted the restoration of ecosystem health in Mu Us sandy grasslands from near ecological collapse, indicating that aerial seeding is an effective restoration measure and that a 30-year cycle can transition sand grassland ecosystems from a collapse hierarchy to a healthy hierarchy. It is hoped that the successful experience of aerial seeding can be used in future restoration measures and policies of degraded ecosystems.

Author Contributions

Q.Z. and Q.L. conducted the field experiment; Y.M., S.W., K.G., Y.H., D.C., M.S., G.Z., L.Z. and Q.L. analyzed the data; Y.M. and S.W. contributed to drafting the paper; Y.M., S.W. and Q.L. contributed to the concept and design of the paper; S.W. were in charge of the final version of the paper. All authors have read and agreed to the published version of the manuscript.

Funding

This work was supported by the Guizhou Provincial Science and Technology Projects ([2019]1060, ZK[2022] General 079, ZK[2022] General 036, ZK[2022] General 098, ZK[2021] General 094, [2020]1Y124, [2019]2874), the Growth Project of Young Scientific and Technological Talents of Guizhou Provincial Department of Education (KY [2018]098), and the Talent Introduction Project of Guizhou University (2017[38]).

Data Availability Statement

The original contributions presented in the study are included in the article: further inquiries can be directed to the corresponding author.

Conflicts of Interest

The authors declare no conflict of interest.

References

  1. Greenwood, K.; MacLeod, D.; Hutchinson, K. Long-term stocking rate effects on soil physical properties. Aust. J. Exp. Agric. 1997, 37, 413–419. [Google Scholar] [CrossRef]
  2. Guarda, V.A.; Guarda, R.D.A. Brazilian tropical grassland ecosystems: Distribution and research advances. Am. J. Plant Sci. 2014, 5, 924–932. [Google Scholar] [CrossRef]
  3. Huang, X.; Yang, Y.; Chen, C.; Zhao, H.; Yao, B.; Ma, Z.; Ma, L.; Zhou, H. Quantifying and Mapping Human Appropriation of Net Primary Productivity in Qinghai Grasslands in China. Agriculture 2022, 12, 483. [Google Scholar] [CrossRef]
  4. Guo, Q.; Fu, B.; Shi, P.; Cudahy, T.; Zhang, J.; Xu, H. Satellite Monitoring the Spatial-Temporal Dynamics of Desertification in Response to Climate Change and Human Activities across the Ordos Plateau, China. Remote Sens. 2017, 9, 525. [Google Scholar] [CrossRef]
  5. UNCCD. The Ordos Declaration. UNCCD: Conference of the Parties: Thirteenth Session Ordos, China, 6–16 September 2017. 2017. Available online: http://www2.unccd.int/sites/default/files/inline-files/Ordos%20declaration.pdf (accessed on 13 July 2018).
  6. Li, M.M.; Liu, A.T.; Zou, C.J.; Xu, W.D.; Shimizu, H.; Wang, K.Y. An overview of the “Three-North” Shelterbelt project in China. For. Stud. China 2012, 14, 70–79. [Google Scholar] [CrossRef]
  7. Wu, Z.; Wu, J.; Liu, J.; He, B.; Lei, T.; Wang, Q. Increasing terrestrial vegetation activity of ecological restoration program in the Beijing–Tianjin Sand Source Region of China. Ecol. Eng. 2013, 52, 37–50. [Google Scholar] [CrossRef]
  8. Jia, X.; Fu, B.; Feng, X.; Hou, G.; Liu, Y.; Wang, X. The tradeoff and synergy between ecosystem services in the Grain-for-Green areas in Northern Shaanxi, China. Ecol. Indic. 2014, 43, 103–113. [Google Scholar] [CrossRef]
  9. Gao, X.H.; Wang, Y.M.; Wang, J.H.; Yan, C.Z.; Li, Z.F. Analysis on desertification dynamics based on remote sensing and GIS in zone along the Great Wall in northern Shaanxi province. J. Desert Res. 2005, 25, 63–67. [Google Scholar]
  10. Lee, B.J. An ecological comparison of the McHarg method with other planning initiatives in the Great Lakes Basin. Landsc. Plan. 1982, 9, 147–169. [Google Scholar] [CrossRef]
  11. Rapport, D.J. What constitutes ecosystem health? Perspect. Biol. Med. 1989, 33, 120–132. [Google Scholar] [CrossRef]
  12. Robert, C.; Bryan, G.N.; Benjamin, D.H. Ecosystem Health: New Goals for Environmental Management; Island Press: Washington, DC, USA, 1992. [Google Scholar]
  13. Toman, M. Special section: Forum on valuation of ecosystem services: Why not to calculate the value of the world’s ecosystem services and natural capital. Ecol. Econ. 1998, 25, 57–60. [Google Scholar] [CrossRef]
  14. Rapport, D.J.; Costanza, R.; McMichael, A.J. Assessing ecosystem health. Trends Ecol. Evol. 1998, 13, 397–402. [Google Scholar] [CrossRef]
  15. Hou, F.; Xu, L. History and current situation of ecosystem health research. Acta Prataculturae Sin. 2009, 18, 210–225. [Google Scholar]
  16. Ren, J.; Nan, Z.; Hao, D. The three major interfaces within pratacultural system. Acta Prataculturae Sin. 2000, 9, 1–8. [Google Scholar]
  17. Jiang, J.; Sun, B.; Pan, D.; Wang, H.; Li, X.; Wang, H.; Yu, H. VOR Index Based Health Assessment of Grassland Ecosystem in Sunan County. China Herbiv. Sci. 2020, 40, 39–43. [Google Scholar]
  18. Liu, Y.; Zhang, D.; Zhang, Y.; Shi, M.; Shang, Z.; He, L.; Zong, W.; Fu, H.; Niu, D. Evaluation of restoration effect in degraded alpine meadow under different regulation measures. Trans. Chin. Soc. Agric. Eng. 2016, 32, 268–275. [Google Scholar]
  19. Liu, Q.; Zhang, Q.; Yan, Y.; Zhang, X.; Niu, J.; Svenning, J.C. Ecological restoration is the dominant driver of the recent reversal of desertification in the Mu Us Desert (China). J. Clean. Prod. 2020, 268, 122241. [Google Scholar] [CrossRef]
  20. Liu, Q.; Zhang, Q.; Jarvie, S.; Yan, Y.; Han, P.; Liu, T.; Guo, K.; Ren, L.; Yue, K.; Wu, H.; et al. Ecosystem restoration through aerial seeding: Interacting plant–soil microbiome effects on soil multifunctionality. Land Degrad. Dev. 2021, 32, 5334–5347. [Google Scholar] [CrossRef]
  21. Webb, C.O.; Ackerly, D.D.; Kembel, S.W. Phylocom: Software for the analysis of phylogenetic community structure and trait evolution. Bioinformatics 2008, 24, 2098–2100. [Google Scholar] [CrossRef]
  22. Zanne, A.E.; Tank, D.C.; Cornwell, W.K.; Eastman, J.M.; Smith, S.A.; FitzJohn, R.G.; McGlinn, D.J.; O’Meara, B.C.; Moles, A.T.; Reich, P.B.; et al. Three keys to the radiation of angiosperms into freezing environments. Nature 2014, 506, 89–92. [Google Scholar] [CrossRef]
  23. Qian, H.; Jin, Y. An updated megaphylogeny of plants, a tool for generating plant phylogenies and an analysis of phylogenetic community structure. J. Plant Ecol. 2015, 9, 233–239. [Google Scholar] [CrossRef]
  24. Zirbel, C.R.; Grman, E.; Bassett, T.; Brudvig, L.A. Landscape context explains ecosystem multifunctionality in restored grasslands better than plant diversity. Ecology 2019, 100, e02634. [Google Scholar] [CrossRef]
  25. Hobbs, R.J.; Norton, D.A. Towards a conceptual framework for restoration ecology. Restor. Ecol. 1996, 4, 93–110. [Google Scholar] [CrossRef]
  26. Wang, L.X.; Liu, Z.L.; Liu, H.M.; Wang, W.; Liang, C.; Qiao, J.; Nobukazu, N. Assessment of typical steppe ecosystem health in Inner Mongolia. Acta Ecol. Sin. 2008, 28, 543–550. [Google Scholar]
  27. Shan, G.L.; Jiang, H.; Yan, W.H.; Liu, Z.I.; Luo, F.C.; Duan, X.H.; Chu, X.H. VOR and CVOR index for health evaluation of typical steppe in Inner Mongolia. Anim. Husb. Feed Sci. 2012, 4, 266. [Google Scholar]
  28. Sterk, M.; Gort, G.; Klimkowska, A.; Van Ruijven, J.; Van Teeffelen, A.J.; Wamelink, G.W. Assess ecosystem resilience: Linking response and effect traits to environmental variability. Ecol. Indic. 2013, 30, 21–27. [Google Scholar] [CrossRef]
  29. Zou, Z.-H.; Yi, Y.; Sun, J.-N. Entropy method for determination of weight of evaluating indicators in fuzzy synthetic evaluation for water quality assessment. J. Environ. Sci. 2006, 18, 1020–1023. [Google Scholar] [CrossRef]
  30. Kembel, S.W.; Cowan, P.D.; Helmus, M.R.; Cornwell, W.K.; Morlon, H.; Ackerly, D.D.; Blomberg, S.P.; Webb, C.O. Picante: R tools for integrating phylogenies and ecology. Bioinformatics 2010, 26, 1463–1464. [Google Scholar] [CrossRef]
  31. Laliberté, E.; Legendre, P. A distance-based framework for measuring functional diversity from multiple traits. Ecology 2010, 91, 299–305. [Google Scholar] [CrossRef]
  32. Van Niekerk, L.; Adams, J.B.; Bate, G.C.; Forbes, A.T.; Forbes, N.T.; Huizinga, P.; Lamberth, S.J.; MacKay, C.F.; Petersen, C.; Taljaard, S.; et al. Country-wide assessment of estuary health: An approach for integrating pressures and ecosystem response in a data limited environment. Estuar. Coast. Shelf Sci. 2013, 130, 239–251. [Google Scholar] [CrossRef]
  33. Shi, G.; Zhang, J.; Yao, L.; Zhao, Y.; Ding, Y.; Zhang, Q. Construction of Grassland Ecosystem Health Evaluation System in Inner Mongolia: Based on the Formation, Vegetation Subtype and Vegetation Type. J. Inn. Mong. Univ. (Nat. Sci. Ed.) 2021, 53, 55–65. [Google Scholar]
  34. Wan, S.; Xia, J.; Liu, W.; Niu, S. Photosynthetic overcompensation under nocturnal warming enhances grassland carbon sequestration. Ecology 2009, 90, 2700–2710. [Google Scholar] [CrossRef] [PubMed]
  35. Liu, X.-Y.; Mu, Y.-T. Research progress in the ecosystem services function and value of grasslands. Acta Prataculturae Sin. 2012, 21, 286. [Google Scholar]
  36. Pennekamp, F.; Pontarp, M.; Tabi, A.; Altermatt, F.; Alther, R.; Choffat, Y.; Fronhofer, E.A.; Ganesanandamoorthy, P.; Garnier, A.; Griffiths, J.I.; et al. Biodiversity increases and decreases ecosystem stability. Nature 2018, 563, 109–112. [Google Scholar] [CrossRef]
  37. Novoa, R.; Loomis, R. Nitrogen and plant production. Plant Soil 1981, 58, 177–204. [Google Scholar] [CrossRef]
  38. Torres-Olivar, V.; Villegas-Torres, O.G.; Domínguez-Patiño, M.L.; Sotelo-Nava, H.; Rodríguez-Martínez, A.; Melgoza-Alemán, R.M.; Valdez-Aguilar, L.A.; Alia-Tejacal, I. Role of nitrogen and nutrients in crop nutrition. J. Agric. Sci. Technol. B 2014, 4, 29. [Google Scholar]
  39. Ma, Q.; Xu, M.; Liu, M.; Cao, X.; Hill, P.W.; Chadwick, D.R.; Wu, L.; Jones, D.L. Organic and inorganic sulfur and nitrogen uptake by co-existing grassland plant species competing with soil microorganisms. Soil Biol. Biochem. 2022, 168, 108627. [Google Scholar] [CrossRef]
  40. Elrys, A.S.; Chen, Z.; Wang, J.; Uwiragiye, Y.; Helmy, A.M.; Desoky, E.S.; Cheng, Y.; Zhang, J.B.; Cai, Z.C.; Müller, C. Global patterns of soil gross immobilization of ammonium and nitrate in terrestrial ecosystems. Glob. Change Biol. 2022, 28, 4472–4488. [Google Scholar] [CrossRef]
  41. Hao, D.L.; Zhou, J.Y.; Yang, S.Y.; Qi, W.; Yang, K.J.; Su, Y.H. Function and regulation of ammonium transporters in plants. Int. J. Mol. Sci. 2020, 21, 3557. [Google Scholar] [CrossRef]
  42. Stockmann, U.; Adams, M.A.; Crawford, J.W.; Field, D.J.; Henakaarchchi, N.; Jenkins, M.; Minasny, B.; McBratney, A.B.; De Courcelles, V.D.; Singh, K.; et al. The knowns, known unknowns and unknowns of sequestration of soil organic carbon. Agric. Ecosyst. Environ. 2013, 164, 80–99. [Google Scholar] [CrossRef]
  43. Petchey, O.L.; Gaston, K.J. Functional diversity: Back to basics and looking forward. Ecol. Lett. 2006, 9, 741–758. [Google Scholar] [CrossRef]
  44. Valencia, E.; Maestre, F.T.; Le Bagousse-Pinguet, Y.; Quero, J.L.; Tamme, R.; Börger, L.; García-Gómez, M.; Gross, N. Functional diversity enhances the resistance of ecosystem multifunctionality to aridity in M editerranean drylands. New Phytol. 2015, 206, 660–671. [Google Scholar] [CrossRef]
Figure 1. Study area of the Mu Us Desert, China, and 32 investigated field sites from 1983 to 2015. The black and yellow triangle represent the field sites.
Agriculture 12 01255 g001
Figure 2. The photographs of 32 investigated field sites from 1983 to 2015.
Agriculture 12 01255 g002
Figure 3. The correlation relationship between indexes in each criterion layer and restoration time. (AT) Blue solid and dashed lines indicate significant and nonsignificant results of correlation, respectively, with grey shaded areas indicating the 95% confidence interval. Black filled circles are the value of the field sites. CWM indicate the Community-Weighted Mean Trait Values in (NT).
Agriculture 12 01255 g003
Figure 4. The correlation relationship between grassland ecosystem health (CVOR) and restoration time.
Agriculture 12 01255 g004
Table 1. The indices of each criterion layer in the CVOR model.
Criterion LayersIndexes
Sandy grassland ecosystem health evaluation (CVOR)Condition (C)Total soil carbon (TC)
Total soil nitrogen (TN)
Total soil phosphorus (TP)
Soil ammonium nitrogen (NH4+)
Soil nitrate nitrogen (NO3)
Soil available phosphorus (AP)
Vitality (V)Aboveground biomass (AB)
Organization (O)Species richness index (S)
Shannon–Wiener index (H′)
Phylogenetic richness (P)
Functional Richness (FRic)
Functional Evenness (FEve)
Functional Dispersion (FDis)
Resilience (R)Community-weighted mean of H (CWMH)
Community-weighted mean of LA (CWMLA)
Community-weighted mean of LDM (CWMLDM)
Community-weighted mean of SLA (CWMSLA)
Community-weighted mean of LOC (CWMLOC)
Community-weighted mean of LN (CWMLN)
Community-weighted mean of LP (CWMLP)
Table 2. The weights of each criterion layer and indices in the CVOR model.
Weights of Indices in the COVR ModelWeights of Indices in Each Criterion Layer
Condition (C)WC = 0.288Total soil carbon (TC)WTC = 0.121
Total soil nitrogen (TN)WTN = 0.180
Total soil phosphorus (TP)WTP = 0.012
Soil ammonium nitrogen (NH4+)WNH4+ = 0.631
Soil nitrate nitrogen (NO3)WNO3− = 0.015
Soil available phosphorus (AP)WAP = 0.041
Vitality (V)WV = 0.476Aboveground biomass (AB)WAB = 1.000
Organization (O)WO = 0.234Species richness index (S)WS = 0.115
Shannon–Wiener index (H′)WH′ = 0.135
Phylogenetic richness (P)WP = 0.046
Functional Richness (FRic)WFRic = 0.250
Functional Evenness (FEve)WFEve = 0.257
Functional Dispersion (FDis)WFDis = 0.197
Resilience (R)WR = 0.002Community-weighted mean of H (CWMH)WCWM-H = 0.344
Community-weighted mean of LA (CWMLA)WCWM-LA = 0.015
Community-weighted mean of LDM (CWMLDM)WCWM-LDM = 0.153
Community-weighted mean of SLA (CWMSLA)WCWM-SLA = 0.036
Community-weighted mean of LOC (CWMLOC)WCWM-LOC = 0.002
Community-weighted mean of LN (CWMLN)WCWM-LN = 0.037
Community-weighted mean of LP (CWMLP)WCWM-LP = 0.413
Table 3. The thresholds of four grassland ecosystem health hierarchies.
The Value of CVORHealth Hierarchy
0.69–1.00Healthy
0.46–0.69Unhealthy
0.19–0.46Cautionary
0.09–0.19Collapse
Publisher’s Note: MDPI stays neutral with regard to jurisdictional claims in published maps and institutional affiliations.

