Article

Poverty Reduction in China: Does the Agricultural Products Circulation Infrastructure Matter in Rural and Urban Areas?

1
College of Economics, Hunan Agricultural University, Changsha 410128, China
2
College of Business, Hunan Agricultural University, Changsha 410128, China
*
Author to whom correspondence should be addressed.
Agriculture 2022, 12(8), 1208; https://doi.org/10.3390/agriculture12081208
Submission received: 7 July 2022 / Revised: 29 July 2022 / Accepted: 9 August 2022 / Published: 12 August 2022
(This article belongs to the Section Agricultural Economics, Policies and Rural Management)

Abstract

:
Since the reform and opening-up in 1978, a remarkable achievement has been made in poverty reduction in China. Many previous studies have analyzed the poverty reduction effects of economic growth, fiscal expenditure, education levels, information technology, urbanization, foreign trade, industrial development and other factors. As a bridge between production and consumption, the agricultural products circulation industry has an important role on the income growth of rural residents. However, the construction level of China’s agricultural products circulation infrastructure lags behind, resulting in a decline in the efficiency and quality of agricultural products supply, and farmers are also facing the embarrassing situation of increasing production without increasing income. Therefore, in this study, we selected the China’s provincial panel data from 2003 to 2017 to analyze the effect of agricultural products distribution infrastructure in narrowing the income gap between urban and rural residents and poverty reduction in China. First, we review the extant literature and elaborate the poverty reduction path of agricultural products circulation industry; secondly, we build models step by step and select nine variables; lastly, we carry out regression analysis on the overall poverty reduction effect of China’s agricultural products circulation industry, the poverty reduction effect of internal factors of agricultural products circulation industry and regional spatial heterogeneity with Stata software. Our results showed that the development level of the agricultural products circulation industry and the degree of opening-up have significant positive effects on narrowing the income gap between urban and rural residents and poverty reduction varied, with different regions in China. Among all the internal factors of development of agricultural products circulation industry in poverty reduction, the core explanatory variable is the investment in agricultural products circulation infrastructure with the largest poverty reduction effect, followed by the human capital, informatization level and number of employees of the agricultural products circulation industry, and the poverty reduction effects of the four internal development factors have had significant regional differences in China. Our findings further complement the internal mechanism of agricultural product circulation infrastructure on poverty reduction in China, suggest that we should apply appropriate strategies and give priority to the internal development factor of the agricultural product circulation industry, with the largest poverty reduction effect according to local conditions in different regions, and so be better able to achieve the targeted poverty alleviation and offer insights for the rural poverty reduction in other countries, especially in the developing countries.

1. Introduction

Poverty has always been a shortcoming in a country’s social development. Since the reform and opening-up in 1978, the poverty-stricken population has been greatly reduced, and the per capita income gap between urban and rural residents has also been significantly narrowed in China [1]. While developing its economy, China has continuously introduced various policies and measures to guide the advancement of poverty alleviation during the past four decades, such as reform of the rural economy system, large-scale development-oriented poverty relief drives, comprehensive poverty alleviation, targeted poverty alleviation, and precise poverty alleviation strategies, and has made great contributions to the cause of poverty reduction in the world [1,2]. In 2018, there were 16.6 million in the poor rural population, a decrease of 753 million compared with 1978; China has firstly achieved the poverty reduction goal of the United Nations Millennium Development Goals (MDGs) for the developing countries [1]. After 2020, the poverty alleviation program achieved a phased victory in China, and extreme poverty and overall regional poverty had been eradicated. However, sustainable poverty reduction in China’s rural areas still faces new difficulties and challenges, and China still has a long way to go in the battle against poverty [2].
China has a vast territory, with long circulation distances for agricultural products, many circulation links and high costs for agricultural products. For a long time, the circulation value of agricultural products was mostly obtained by agricultural product dealers and retailers, with farmers benefiting little, and often have had to bear the risks of products being “difficult to sell, cheap to sell”. The production of thousands of households in China has not yet formed an effective connection with the ever-changing market. The lack of infrastructure for the circulation of agricultural products is still a shortcoming of China’s rural poverty reduction and Rural Revitalization. For quite some time, we have been emphasizing production, neglecting circulation, neglecting services and the problem of “who will build and how to build”; some agricultural product circulation infrastructure has not been developed, resulting in the relatively weak agricultural products circulation infrastructure. Those issues are unfavourable for reducing the circulation cost of agricultural products, improving the supply quality of agricultural products, promoting farmers’ income, and even less conducive to the construction of a modern agricultural system.
As a bridge between production and consumption, the circulation of agricultural products has an important influence on the income growth of rural residents engaged in agriculture [3]. Circulation of agricultural products refers to an economic activity in which the commodity part of agricultural products is transferred from the agricultural production field to the consumption field through trading. The circulation of agricultural products includes a series of links such as the purchase, transportation, storage and sales of agricultural products. Agricultural products is meant in a broad sense, including agricultural (planting), forestry, animal husbandry, fishery and sideline products; agricultural products in the narrow sense only include the products of the planting industry, such as grain, cotton, oil, hemp, silk, tea, sugar, vegetables, tobacco, fruits, medicine, miscellaneous products, etc. This paper adopts the broad category of agricultural products [4]. Agricultural products are the necessities of people’s life, and the demand elasticity is small, which drives the production and circulation of agricultural products. The specific performance is as follows: (1) the perishability, seasonality and raw materials of agricultural products make the fresh-keeping, storage, processing and other links in the circulation of agricultural products important and highly productive. (2) The dispersity and seasonality of agricultural production make the circulation of agricultural products risky. (3) The contradiction between “small production” and “big market” of agricultural products determines that the circulation process of agricultural products presents the basic characteristics of moving from dispersion to concentration, and then from concentration to dispersion. (4) As a commodity with social and political meanings, agricultural products cause governments of various countries intervene in the production and circulation of agricultural products to varying degrees [5].
Agricultural products circulation infrastructure includes road transportation facilities, communication network facilities, cold chain logistics facilities, trading place facilities, etc. The specific mechanisms are as follows: (1) the improvement of road transportation infrastructure can promote the convenient transportation of agricultural products, improve the commercialization rate and circulation speed of agricultural products, reduce logistics costs, and smooth the sales channel of agricultural products; (2) The improvement of communication network infrastructure will improve information accessibility, reduce information costs, reduce information asymmetry in the agricultural product market, promote the effective connection between supply and demand of agricultural products, guide efficient agricultural production, and make agricultural products “marketable”; (3) The improvement of cold chain logistics infrastructure can improve the cold chain storage and transportation capacity of agricultural products, realize the functions of keeping agricultural products fresh, regulating market surplus and shortage, and enhancing commodity turnover, and also avoid the risk of sharp price declines caused by the centralized listing of agricultural products [6]; (4) The improvement of agricultural product trading facilities can provide a better trading place for agricultural products to enter the commodity market, improve the trading efficiency of agricultural products market, and also provide a place and way for farmers to directly participate in the sale of agricultural products and obtain circulation value-added profits. Through the above mechanism, the circulation infrastructure of agricultural products can promote the increase of farmers’ income, so as to narrow the income gap between urban and rural residents and reduce poverty [7]. Previous research has shown that the transportation infrastructure can obviously increase farmers’ income. Using the C-D production function model, Liu et al. found that transportation infrastructure can positively promote rural economic growth and increase the income of rural residents, while there are regional differences in the promotion effects [8]. Additionally, comprehensive transportation infrastructure has a significant spatial spillover effect on China regional economic growth, of which the contribution rate of transportation investment reaches 37% [9]. There is also a positive correlation between rural transportation infrastructure construction and poverty reduction effects [10,11]. Based on factor flow mechanism analyses, it is shown that the effect of transportation infrastructure in narrowing the urban-rural income gap is mainly due to the promotion of the flow of labor and the transfer of technical capital among production factors [12,13,14]. The effect value of the improvement of transportation infrastructure on narrowing the urban-rural income gap will change with the mobility of production factors [15]. It does not always maintain a positive impact but has a critical value [16]. Additionally, some studies had showed that transportation infrastructure has a significant positive impact on the reduction of the income gap between urban and rural residents in various provinces in China, including direct effects and spillover effects, and has obvious spatial autocorrelation [17,18,19,20]. Countries with relatively complete rural infrastructure (e.g., rural electricity, transportation and communications) have a better development of non-agricultural employment. Farmers from these countries have more non-agricultural employment channels and thus obtain higher incomes, which has a significant impact on alleviating poverty in rural areas [21,22,23]. However, due to the spatial differences in the level of rural infrastructure construction among provinces or regions in China, the construction of rural infrastructure in one region brings spillover- or competition-effect, which promotes or reduces the income of farmers in neighboring regions, respectively [24,25]. In addition, research has shown that the development of circulation industry has a significant positive effect on poverty reduction, and informatization has the greatest impact, followed by labor and transportation investment, and that there is regional spatial heterogeneity in the poverty reduction effect of the circulation industry [26,27,28]. Among the circulation industry, the carriers of commercial circulation (e.g., number of commodity trading markets, number of commodity trading booths) have a significant effect on poverty reduction [29].
Although there are some studies on the poverty reduction effects of infrastructure, there is still lack of analysis on the poverty reduction effects of agricultural product circulation infrastructure. Most of the existing studies start from the overall perspective, such as improving the development level of agricultural products circulation system, the degree of marketization, the level of institutional innovation, and the efficiency of agricultural products circulation, which will help farmers increase income and reduce poverty [7,30,31,32,33]. Therefore, we build an empirical model based on the poverty reduction path of agricultural products circulation industry to explore the overall poverty reduction effect of China’s agricultural products circulation infrastructure and agricultural products circulation industry. In this study, we selected China’s provincial panel data from 2003 to 2017 to analyze the effect of agricultural products circulation infrastructure on narrowing the income gap between urban and rural residents and poverty reduction in China. Our results showed that the development level of agricultural products circulation industry and degree of opening-up have significant positive effects on poverty reduction, creatingregional effects in China. Among all the internal factors of development of the agricultural products circulation industry on poverty reduction, the core explanatory variable is the investment in agricultural products circulation infrastructure, which has the largest poverty reduction effect, followed by the human capital and informatization level. However, the employment of the agricultural products circulation industry has no significant effect on poverty reduction. Our findings further complement the research of the effect sof agricultural products circulation infrastructure on poverty reduction and offer insights for the rural poverty reduction in other developing countries.

2. Materials and Methods

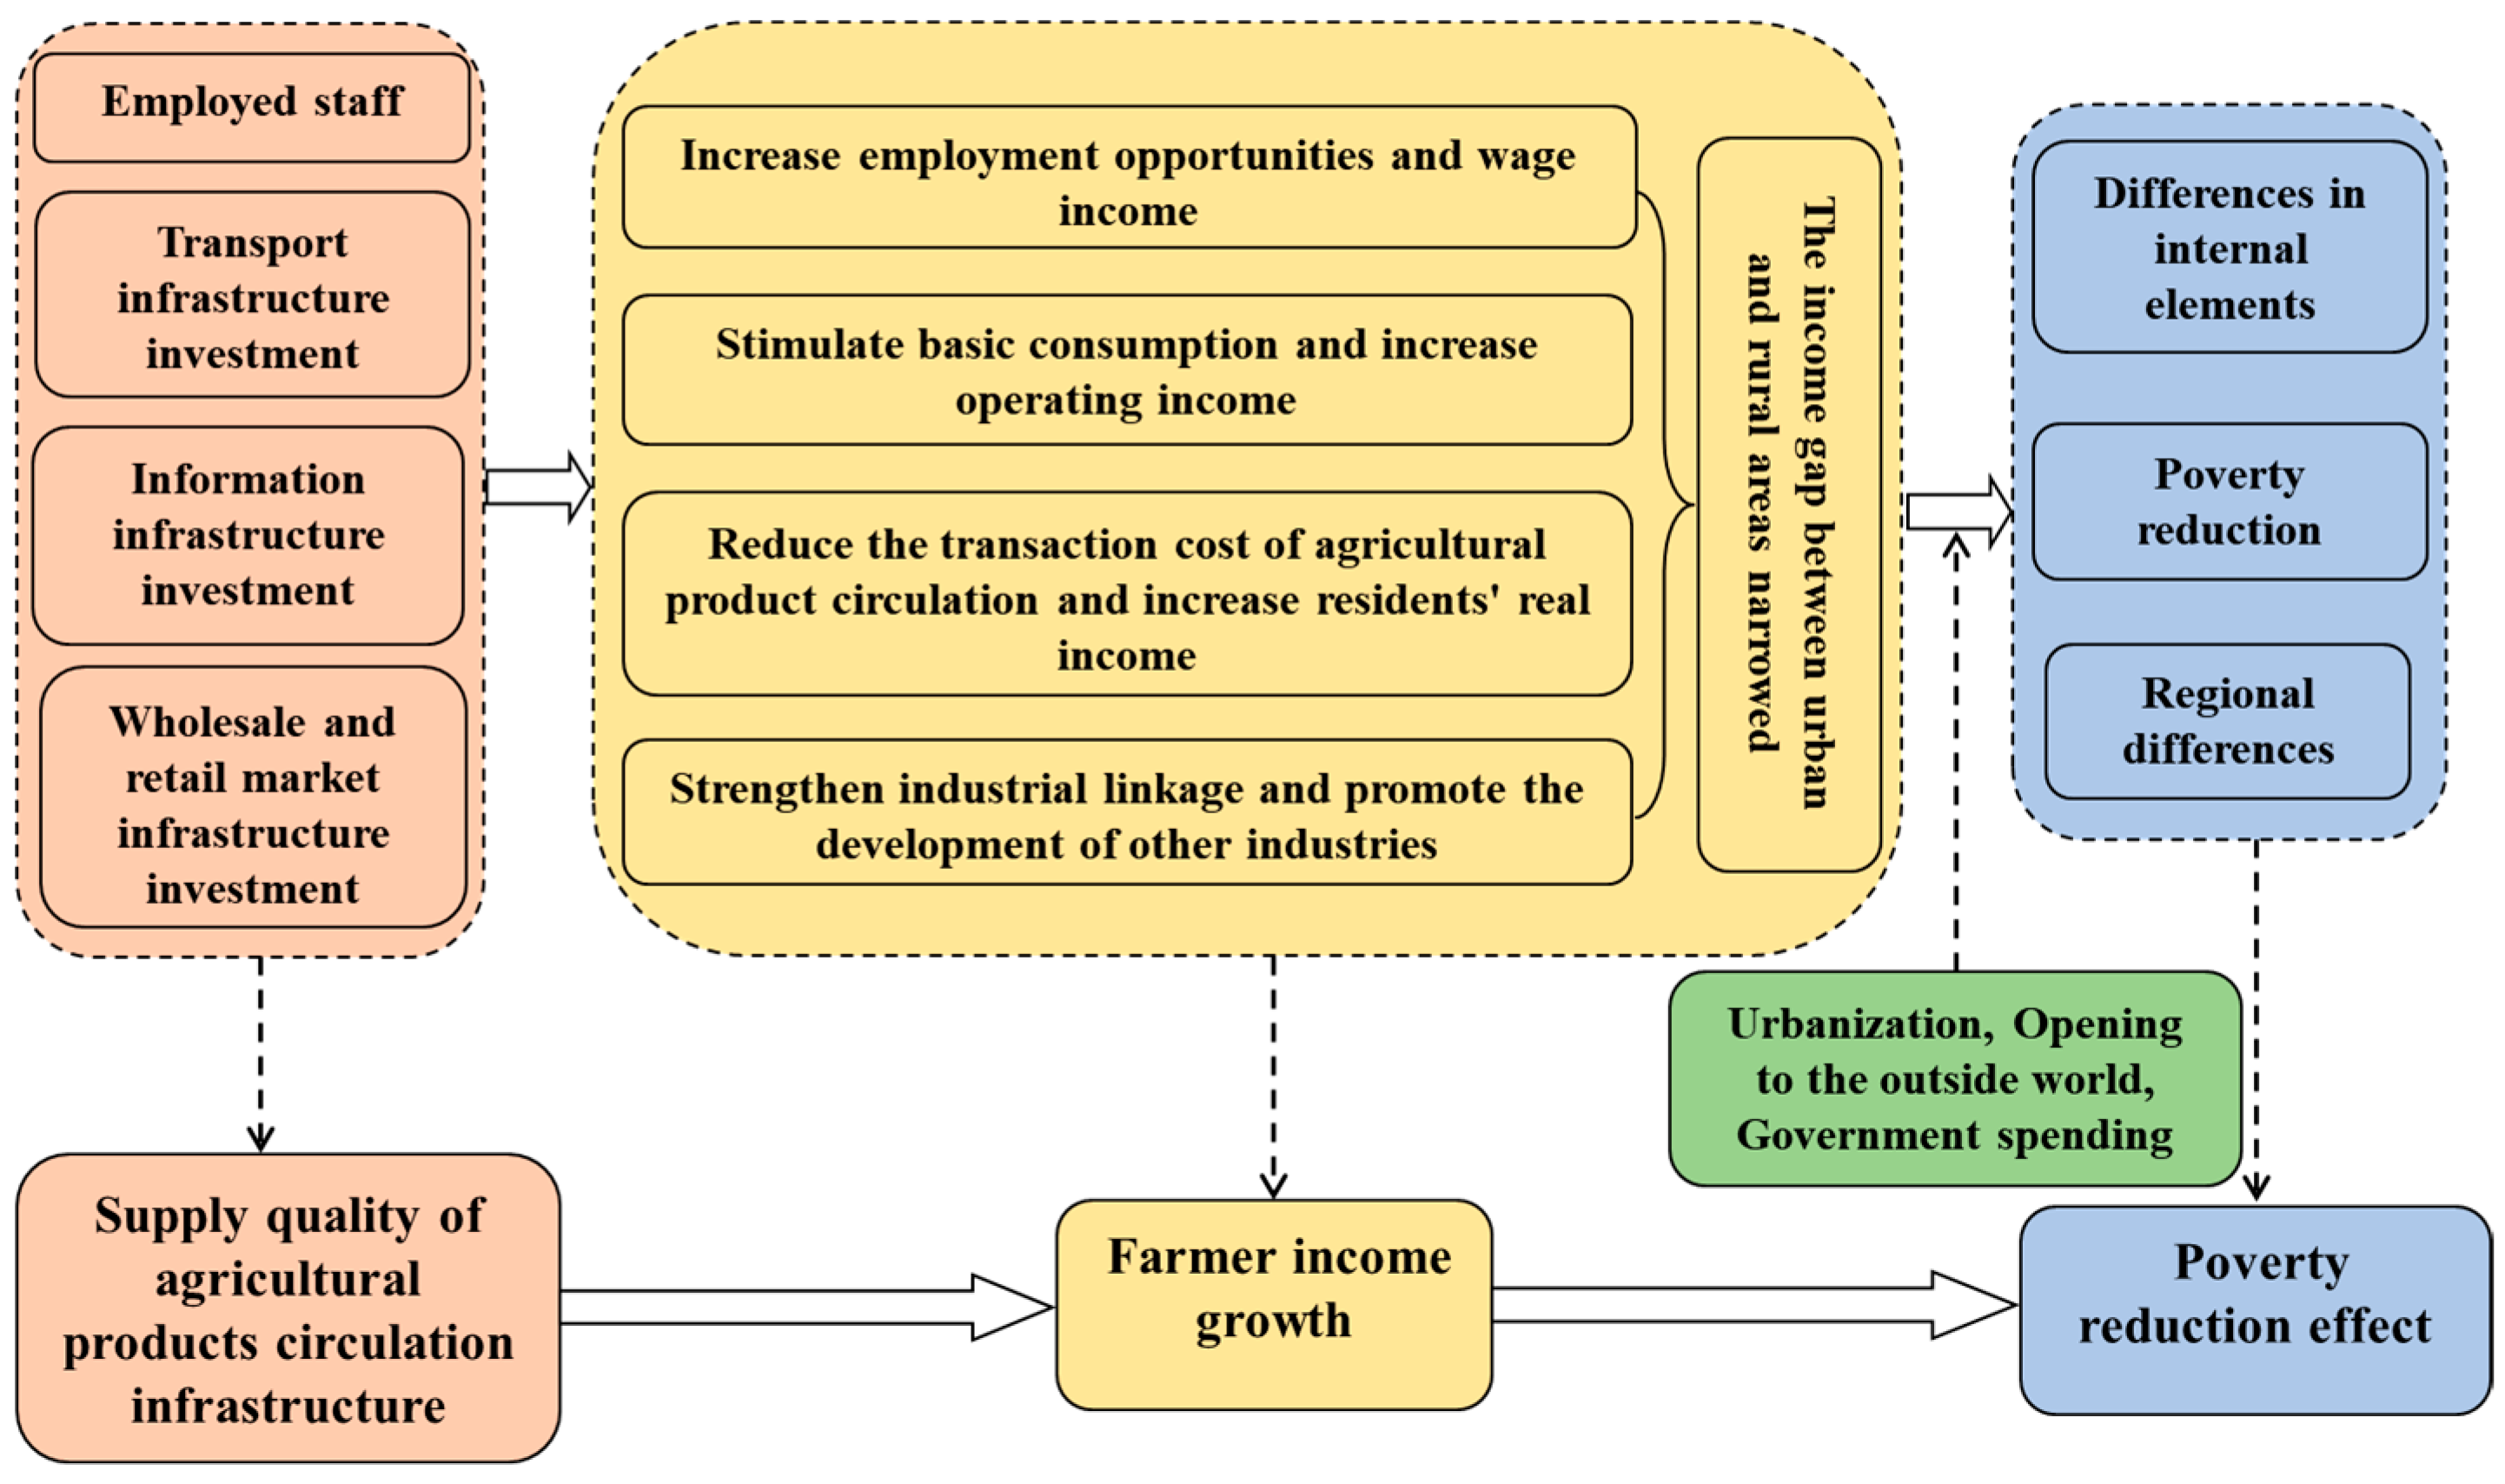
2.1. Theoretical Framework

In this study, we analyze the internal logical relationship between thendevelopment of agricultural product circulation infrastructure and poverty reduction in China by drawing on the Pattern of Growth Hypothesis (PGH) proposed by Montalvo [34]: the sectoral and/or geographic composition of economic activity affects the aggregate rate of poverty reduction independently of the aggregate rate of growth. By evolving the industrial composition of economic growth into the tertiary industry and agricultural product distribution industry, we built a “development of agricultural products distribution industry (the supply quality of agricultural products distribution infrastructure)–income growth of farmers–narrowing of income gap between urban and rural residents (poverty reduction)” theoretical framework to research the internal logical relationship between the supply quality of agricultural products circulation infrastructure and poverty reduction. The theoretical framework is shown as Figure 1. Drawing on the endogenous economic growth model (CD model) and combining it with Figure 1, we can deduce that the increase of employed staff, investment of transportation and information infrastructure, wholesale and retail market infrastructure would improve the technological progress and industrial development of the agricultural products circulation industry, and thereby promote economic growth, increase income, finally realize the expected poverty reduction.

2.2. Variables

The selection of variables is the premise and foundation of empirical analysis, and it is also the key to the credibility of empirical results. In order to explore the poverty reduction effect of agricultural products circulation infrastructure, the selected variables should meet the following criteria: (i) data availability. In order to ensure the objectivity and accuracy of the research results, this paper pays more attention to availability when selecting variables, selects quantifiable indicators as far as possible, and ensures the data can be obtained from open channels; (ii) the selected variables should be proved by previous studies on the circulation infrastructure of agricultural products; (iii) the comprehensiveness of variable indicators. We should not only pay attention to the poverty reduction effect of agricultural products circulation infrastructure, but also pay attention to the overall poverty reduction effect of agricultural products circulation industry; (iv) The pertinence of variable selection. The variables are required to reflect the research content pertinently. In the regression model of this paper, in addition to the main explanatory variables and explained variables, several indicators are selected as control variables to ensure the accuracy and robustness of the empirical analysis results.
Due to the different emphases of previous studies, the difficulty of obtaining the relevant data of variable indicators is also different. There are great differences in the variables selected by different scholars, and the research methods are also different. Based on the existing research and combined with the research perspective of this paper, we mainly construct the index system from three aspects: the explained variable, explanatory variables and controlled variables. (i) The explained variable is poverty reduction effect; (ii) the explanatory variables include the total output value of agricultural products circulation industry, the investment in agricultural products circulation infrastructure, the number of employed people in agricultural products circulation industry, human capital, and the level of informatization; (iii) the control variables include the degree of opening to the outside world, local government fiscal expenditure, and the level of urbanization. The detailed description of variables is as follows and shown in Table 1.

2.2.1. GAPit: Poverty Reduction Effect

At present, alternative indicators of poverty reduction effect are the FGT index, poverty incidence, poverty gap index and urban-rural per capita disposable income gap. In this paper, the urban-rural per capita disposable income gap was selected to measure the poverty reduction effect.

2.2.2. Yit: Gross Output Value of Agricultural Products Circulation Industry

Referring to previous research, the current ratio of the added value of China agricultural products circulation industry to GDP was set at 10% in this study.

2.2.3. Lit: Number of Employees in Agricultural Product Circulation Industry

The number of employees reflects the economic development level of agricultural products circulation industry. This indicator is measured by the number of urban unit employment in the agricultural product circulation industry of each province at the end of the year in this study.

2.2.4. Kit: The Investment in Agricultural Product Circulation Infrastructure

The increase of investment in agricultural product circulation infrastructure can strengthen exchange and collaboration between provinces, especially between remote rural areas peripheral areas and the outside world, and improve the level of economic development. This indicator is measured by the data of fixed asset investment in agricultural product circulation infrastructure in this study.

2.2.5. HCit: Human Capital

The increasement of human capital can improve labor productivity and promote economic growth. This indicator is measured by the number of regional people with colleges degree or above in this study.

2.2.6. Tit: Information Level

Under the current “Internet +” background, the agricultural product circulation industry is also affected by information level. This indicator is measured by the regional informatization development index from China Information Almanac (https://data.cnki.net/Yearbook/Single/N2019070069, accessed on 1 July 2022) to evaluate the informatization level of the region in this study.

2.2.7. Tradeit: Degree of Opening to the Outside World

With the acceleration of economic globalization and the background of the “One Belt, One Road” initiative, the agricultural product circulation industry is becoming more and more international. This indicator is measured by the proportion of total volume of imports and exports to the GDP of each province in this study. Data are obtained from http://www.drcnet.com.cn/www/int, accessed on 1 July 2022.

2.2.8. Local Fiscalit: Local Government Fiscal Expenditure

The increasement of investment in infrastructure construction in local government fiscal expenditures will bring great convenience to the circulation of agricultural products in the input area and other commercial and trade flows. This indicator is measured by total local government fiscal expenditure in this study.

2.2.9. Urbanit: Urbanization Level

Urban development can provide a good economic foundation and business network for the development of the agricultural product circulation industry, which broadens the circulation channels of agricultural products and affects the effect of poverty reduction. This indicator is measured by the proportion of urban population to total population of each province at the end of the year in this study.
Table 1. Description of selected variables and sources for assessing poverty reduction.
Selected VariablesDescription of VariablesScalingSources
GAPitpoverty reduction effectratio of urban per capita disposable income to rural per capita disposable income[26,35]
Yitgross output value of agricultural product circulation industry10% of gross domestic product[14,36]
Litthe number of employed persons in the agricultural product circulation industrythe number of urban units employed in each province’s agricultural product circulation industry at the end of the year[37,38,39]
Kitthe investment in agricultural product circulation infrastructurethe data on fixed asset investment in agricultural product circulation infrastructure[6,40]
HCithuman capitalthe number of regional colleges and above[12,41]
Titinformation levelthe regional informatization development index[42,43,44,45,46]
Tradeitdegree of opening to the outside worldthe proportion of the total import and export trade of each province[20,47,48]
Local fiscalitLocal government fiscal expenditurethe proportion of total fiscal expenditure[49,50]
UrbanitUrbanization levelthe proportion of urban population to total population at the end of each province[16,51,52,53]

2.3. Data Source

Based on the availability of data, this paper sets the research object as the inter-provincial panel data of 30 provinces, autonomous regions and municipalities of China, except Hong Kong, Macau, Taiwan and Tibet. The data of 2004–2018 are collected from 2003–2017 Annual Data of National Bureau of Statistics of China (data of GAPit, Yit, Lit, HCit, Local fiscalit, Urbanit (http://www.stats.gov.cn/tjsj/ndsj/, accessed on 1 July 2022), China Information Almanac (data of Tit) (https://data.cnki.net/Yearbook/Single/N2019070069, accessed on 1 July 2022), DRCNET database (data of Tradeit) (http://www.drcnet.com.cn/www/int/, accessed on 1 July 2022) etc. According to the regional division standards of the National Bureau of Statistics of China, China is divided into eastern regions, central regions, western regions and northeastern regions (Figure 2). In order to reduce the heteroscedasticity of the regression model, all variables to be estimated in the regression analysis model are logarithmic, and the corresponding regression coefficient is the elastic coefficient.
In order to reduce the heteroscedasticity of the regression model, all the variables to be estimated in the regression model need logarithmic transformation, and the corresponding regression coefficients are regarded as the elastic coefficients. The processed variable indicators and VIF values are shown in Table 2.

2.4. Empirical Model

Based on the analytical framework of economic growth and poverty reduction, we constructed a univariate linear equation for validating the role of agricultural products circulation infrastructure in poverty reduction:
G A P i t = α i t + β Y i t + γ X + ε i t
In this equation, the explained variable GAPit represents the urban-rural per capita disposable income gap of province i in year t to measure the poverty reduction effect; Yit represents the growth of the total output value of the agricultural product circulation industry in province i in year t to measure the development level of the agricultural product circulation industry; X indicates the impact factors related to poverty reduction, including core explanatory variables (subdivisional types of agricultural product distribution infrastructure: transportation, warehousing and postal infrastructure, wholesale and retail infrastructure, information transmission and service infrastructure, leasing and business service infrastructure) and control variables (number of employees in the agricultural product circulation industry, level of urbanization, the degree of opening to the outside world, government expenditure, etc). α represents an unobserved factor, ε is the error interference term, β is the degree of impact of the growth of the total output value of the agricultural product circulation industry on poverty reduction, γ indicates the degree of impact of factors such as agricultural product circulation infrastructure, agricultural product circulation industry employment, human capital, informatization level, urbanization level, degree of opening to the outside world, and government expenditure on poverty reduction.
The endogenous economic growth model can be expressed as:
Y = λ L α K β A 1 α β
After taking a logarithm of both sides of the above formula, the model is adjusted as:
L n Y = λ + α L n L + β L n K + η L n A + ε
In the Formula (3), η = 1 - α - β , L refers to labor input, K refers to capital investment, A refers to technology progress expressed as the level of informatization and human capital.
After logarithmic processing of Formula (1), we get:
L n G A P i t = α i t + β L n Y i t + γ X + ε i t
Substitute Formula (3) into Formula (4) to get:
L n G A P i t = α i t + β 1 L n L + β 1 L n K + β 1 L n H C + β 1 L n T + γ X + ε i t
In Formula (5), LnGAPit indicates poverty reduction effect; LnL, LnK, LnHC, LnT represent the four explanatory variables of the number of employees in the agricultural product circulation industry, the agricultural product circulation infrastructure, human capital, and the level of informatization, respectively. Among them, agricultural product circulation infrastructure is the core explanatory variable. β1, β2, β3 and β4 represent the elastic coefficients of the urban-rural per capita disposable income gap on the number of employees in the agricultural product distribution industry, the investment in agricultural product distribution infrastructure, human capital, and the level of informatization, respectively. X represents control variables, including the degree of opening to the outside world, local government fiscal expenditure, and urbanization level.

3. Results

3.1. Analysis of the Overall Poverty Reduction Effect of Agricultural Products Circulation Industry

Through a regression analysis of Formula (4) using STATA15.1, the Hausman test results show that the null hypothesis is rejected (Table 3), so the fixed effect model is selected. As shown in Table 3, the regression coefficient of the core explanatory variable LnYit is −0.198, which is significant at a 95% confidence level, and every 1% gross output value increase in agricultural product circulation industry results in a 0.198% decrease in income gap between urban and rural residents, indicating that the agricultural product circulation industry has a significant positive effect on poverty reduction indeed. The regression coefficients of the control variable urbanization level Urbanit, the degree of opening to the outside world Tradeit, and local government fiscal expenditure Local fiscalit 0.04, −0.053, and 0.088, respectively. The same as the gross output value of agricultural products circulation industry, the degree of opening to the outside world also has a significant positive effect on poverty reduction, indicating that the circulation of agricultural products and the opening up of international market helps to reduce poverty. Unexpectedly, the urbanization level and local government fiscal expenditure have negative effects on poverty reduction. The possible explanation is that imbalance of investment and policy inclination has affected the balanced development of urbanization in China. At the same time, there are also regional imbalances in local government fiscal expenditures, and imbalances in the efficiency of financial input to support agriculture, which also results the widening gap between urban and rural residents.

3.2. Analysis of the Poverty Reduction Effect of Internal Development Factors of Agricultural Products Circulation Industry

In order to investigate whether or not there is any difference in the effect of internal development factors of agricultural product circulation industry in narrowing the income gap between urban and rural residents, we performed an empirical analysis on Formula (5) using STATA15.1. As shown in Table 4, Hausman test results indicated that the fixed effect model should be selected. Further analysis showed that there is a significant effect of the agricultural product circulation industry on narrowing the income gap between urban and rural residents, no matter with or without the control variable urbanization level Urbanit, degree of opening to the outside world Tradeit, and local government fiscal expenditure Local fiscalit, with the R2 0.7304 and 0.6676, respectively (Table 4). This indicates that there is a strong correlation among the effects of internal factors of the agricultural product circulation industry on poverty reduction. As the core explanatory variable, agricultural product circulation infrastructure investment (the supply quantity of agricultural product circulation infrastructure) Kit has the highest poverty reduction effect coefficient (−0.119), with a significant 95% confidence level (Table 4), indicating that the supply quantity of agricultural product circulation infrastructure has a significant positive effect on poverty reduction indeed. Furthermore, the regression coefficients of human capital HCit, the number of employees in the agricultural product distribution industry Lit, and the level of informatization Tit are −0.047, −0.018, and −0.008, respectively (Table 4). Somewhat unexpectedly, unlike human capital and informatization level, the poverty reduction effect from employee numbers in the agricultural product circulation industry is not significant with those three control variables. In China, due to the imbalance of urbanization level, degree of opening to the outside world and local government fiscal expenditure, there are many self-employed farmers or people from other non-urban units in the employment of the agricultural product circulation industry, and were not included in the analysis system, which results that the poverty reduction effect of number of employees in the agricultural product circulation industry is not significant. To sum up, our results indicate that all those internal development factors of agricultural product circulation industry can narrow the income gap between urban and rural residents and promote poverty reduction with different effects.

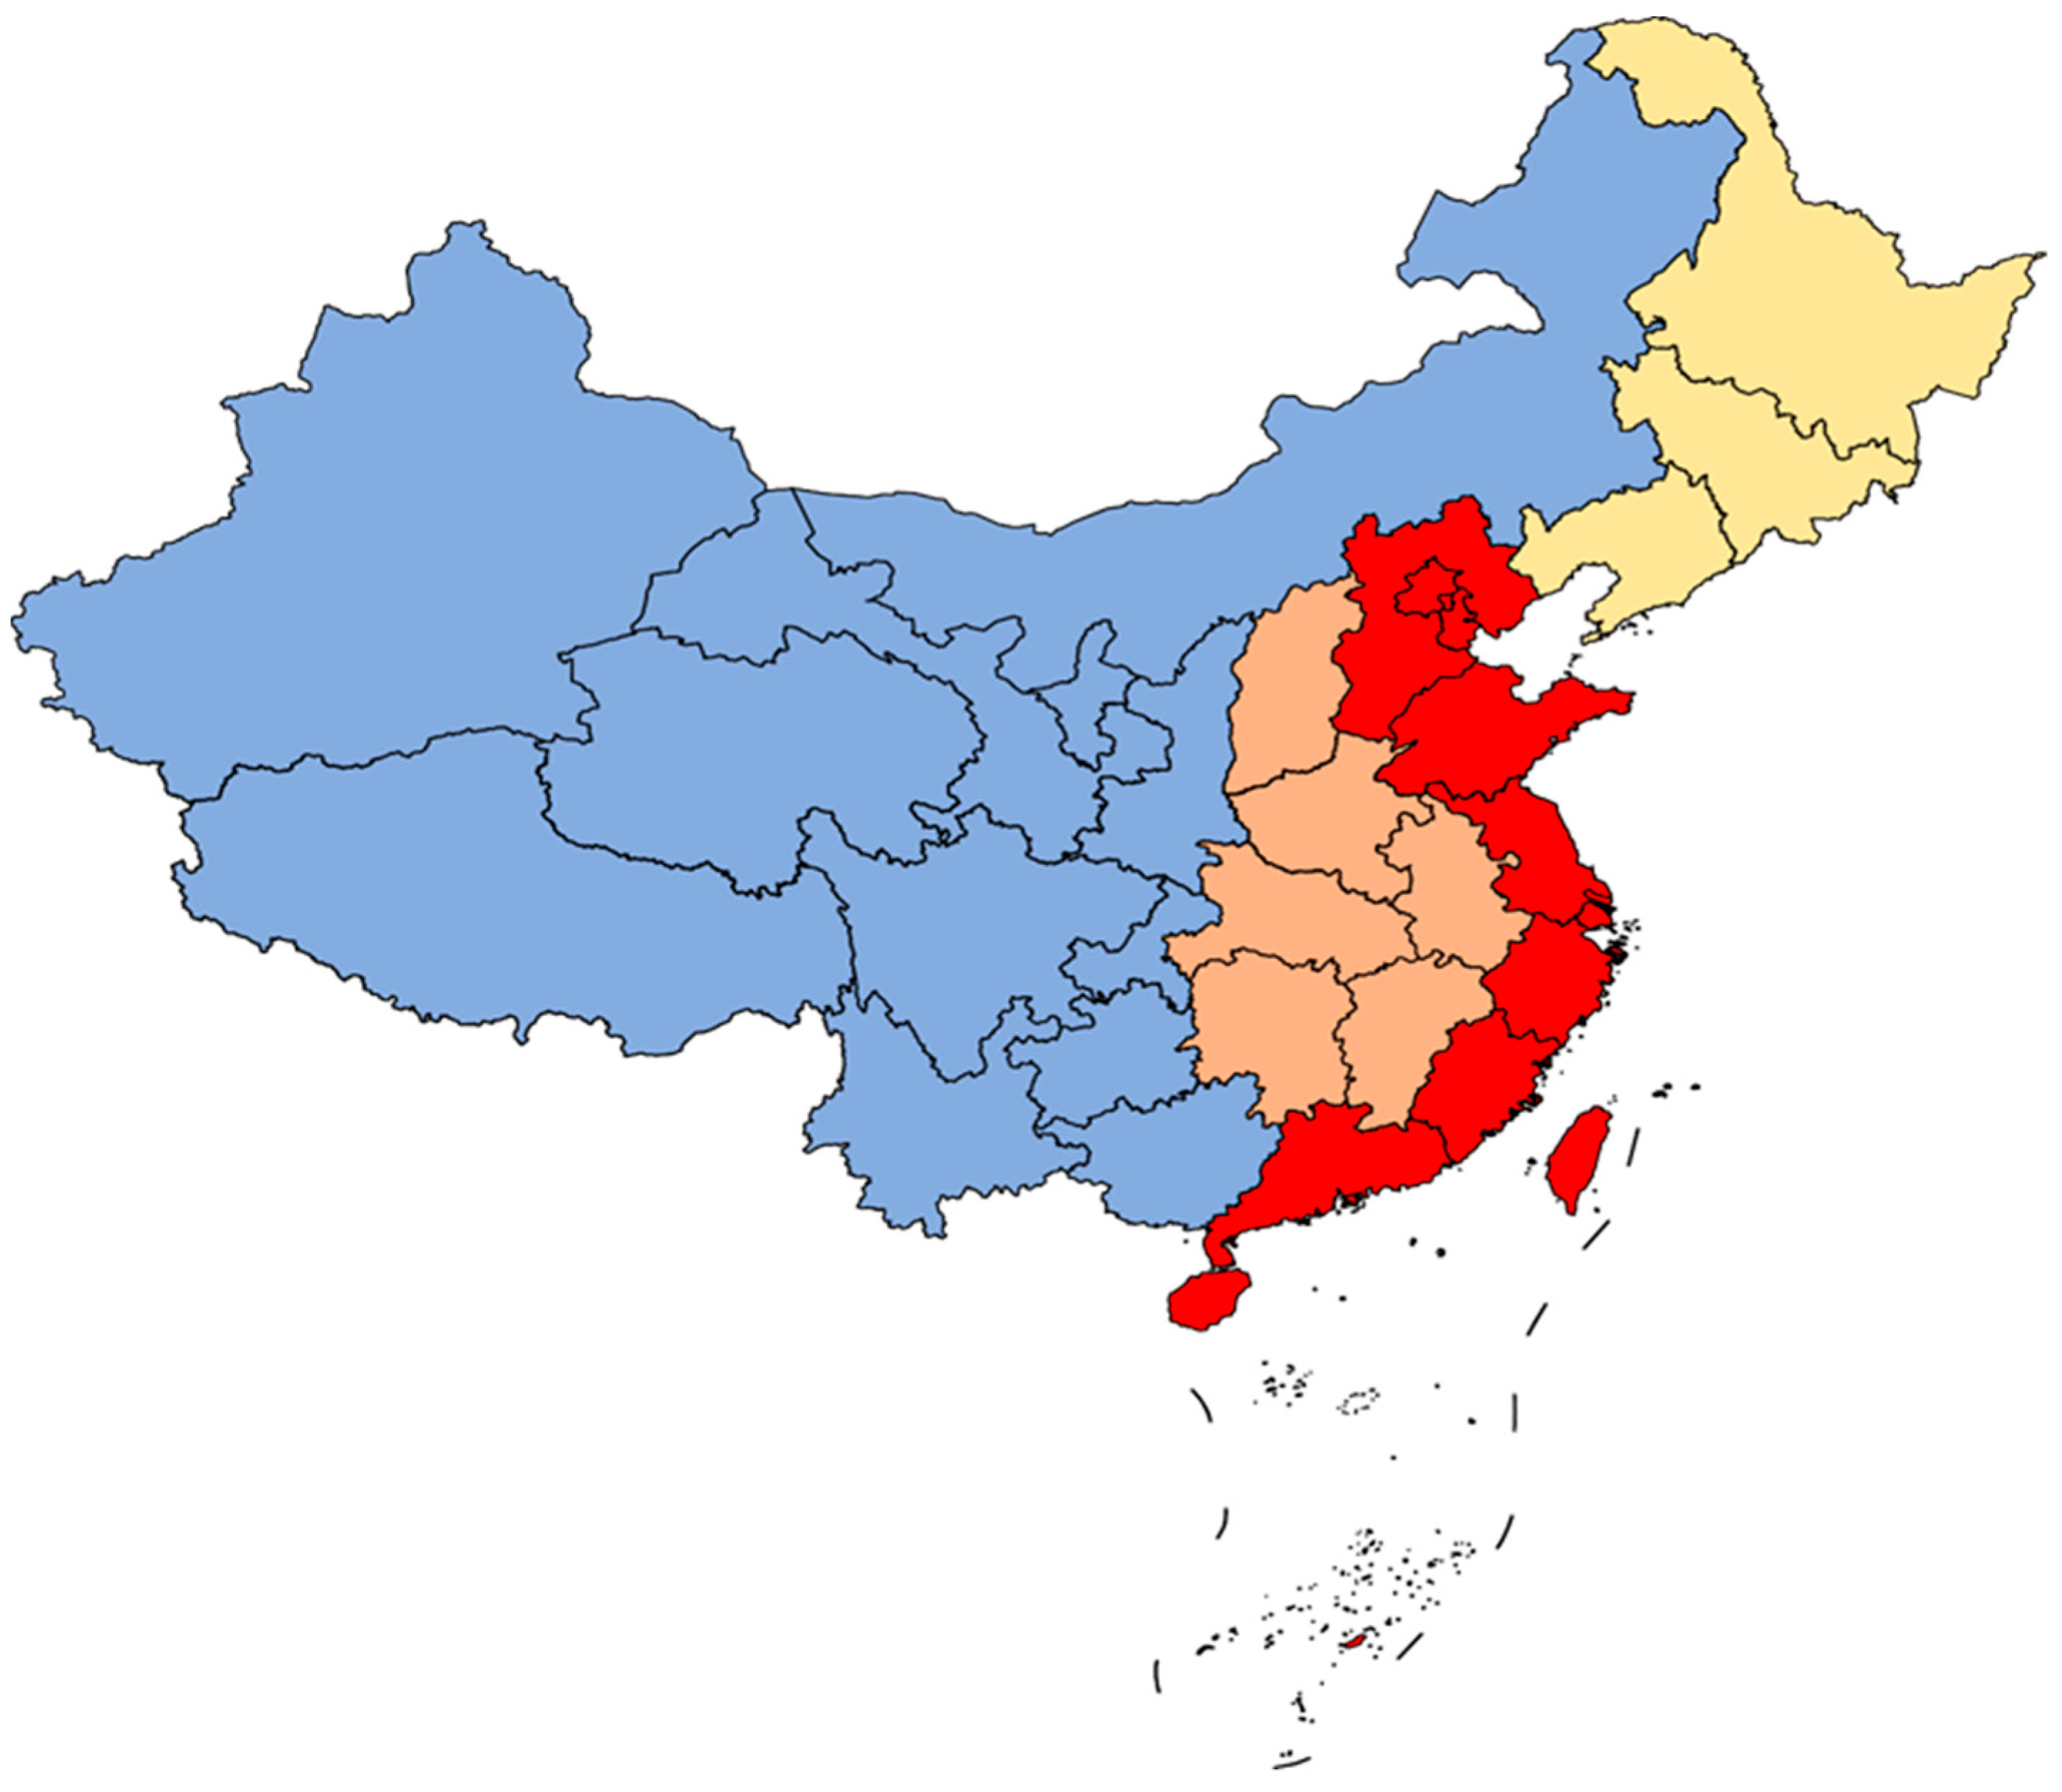
3.3. Regional Difference Analysis of the Poverty Reduction Effect of Agricultural Products Circulation Industry and Its Internal Development Factors

Due to the differences in geographical location, economic development levels, and infrastructure development levels among the four major regions (East, Middle, West and Northeast) in China, there may be significant regional differences in the overall development level of the agricultural product circulation industry and its internal iterations among the four regions in China. In order to confirm the above inference, all the sample data in this paper were divided into four sub-samples according to the regionalism of China, and named East, Central, West and Northeast regions. Using Formulas (4) and (5), regression analysis of the four sub-samples was carried out, and the empirical results are shown in Table 5. The poverty reduction effect of the agricultural product distribution industry in the four regions from the highest to the lowest were Western (0.226), Eastern (0.205), Central (0.200), and Northeast region (0.195) (Table 5). From the perspective of the internal development factors of agricultural product distribution industry, the core explanatory variable investment in agricultural product distribution infrastructure Kit has a significant poverty reduction effect in all the four regions. The order for poverty reduction effect was Northeast (0.182), Eastern (0.127), Western (0.120), and Central region (0.089) from high to low (Table 5). The poverty reduction effects of human capital in agricultural product distribution infrastructure in the four regions from the highest to the lowest were as follows: the Northeast (0.080), Central (0.058), Eastern (0.051), and Western region (0.043) (Table 5). Unlike investment and human capital in agricultural product distribution infrastructure, employee number and informatization level in agricultural product circulation industry in Eastern, Central and Western region have significant positive effect on poverty reduction but have a significant negative effect on poverty reduction in Northeast region. That is why, despite the poverty reduction effect of investment in agricultural product distribution infrastructure Kit in Northeast region was highest among those four regions, the poverty reduction effect of agricultural product distribution industry in Northeast region was lowest among those four regions in China. It is worthwhile to note that the positive effect on poverty reduction of employee number in agricultural product circulation industry in China, Central region was significantly higher than that of other three internal development factors of agricultural product circulation industry, while the best poverty reduction effect in Northeast, Eastern and Western region of internal development factor all was the investment in agricultural product distribution infrastructure. Among the three control variables, the degree of opening to the outside world has a significant positive poverty reduction effect on all four regions, while the local government fiscal expenditure and urbanization level have negative poverty reduction effect. All the results indicated that there is no significant regional difference in the positive poverty reduction effects of agricultural products circulation industry in China, but the poverty reduction effects of its four internal factors have significant regional differences. This suggests that we should apply appropriate strategies and give priority to the internal development factor of agricultural product circulation industry with the biggest poverty reduction effect according to local conditions in different regions and so better able to achieve the targeted poverty alleviation in China.

4. Discussion and Conclusions

Poverty has always been a shortcoming in a country’s social development. Since the reform and opening-up in 1978, the poverty-stricken population has been greatly reduced, and the per capita income gap between urban and rural residents has also been significantly narrowed in China [1]. After 2020, poverty alleviation programs have achieved a phased victory in China, and the extreme poverty and overall regional poverty had been eradicated. However, with sustainable poverty reduction in China’s rural areas still facing new difficulties and challenges, China still has a long way to go in the battle against poverty [2]. In this study, our results showed that: (1) No matter with or without the control variable urbanization level, degree of opening to the outside world and local government fiscal expenditure, the development of the agricultural product distribution industry has a significant positive effect on narrowing the income gap between urban and rural residents and poverty reduction with no significant regional difference among the four regions in China, and which was consistent with the result of previous studies [40,47,54]. (2) Among the four internal development factors of the agricultural product circulation industry, investment in agricultural product circulation infrastructure has the highest poverty reduction effect, and the poverty reduction effects of the four internal development factors have significant regional differences in China, and these were consistent with the result of previous studies [49]. (3) Among the three control variables, the degree of opening to the outside world has a significant positive effect on poverty reduction, but urbanization level and local government fiscal expenditure have negative effects on poverty reduction in China, which was consistent with the result of previous studies [55,56].
Based on the above findings, this paper put forward a number of policy implications for the targeted poverty alleviation in China. First, guided by the “industrial poverty alleviation” policy of China, we should vigorously develop the agricultural products circulation industry, so as to narrow the income gap between urban and rural residents and reduce the poverty rate. As a large agricultural country, China has one of the biggest agricultural transaction markets in the world. The development of the agricultural products circulation industry can further energize the agricultural transaction markets and reduce the poverty rate in China. Second, we should be further opened to the outside world. Under the supporting of the favorable policies of the “One Belt, One Road” initiative, new markets for Chinese agricultural products are emerging and enlarging rapidly. Further opening to the outside world will expand the channels for the Chinese agricultural products to foreign markets and reduce the poverty rate in China. Third, we should further strengthen government policy guidance and support, and optimize and improve the agricultural products circulation infrastructure system. Due to the local, regional and public welfare characteristics of the agricultural product circulation infrastructure, it is necessary to use a cooperative mode between the government and the market system to supply the improvement and optimization of agricultural products circulation infrastructure system. Through the guidance and support of governmental fiscal policy, attracting more social capital to be brought into the agricultural products circulation infrastructure system, it can upgrade agricultural product circulation infrastructure system more effectively. Fourth, we should accelerate the construction of information network environments to provide solid information support for agricultural product circulation. Under the background of “Internet +”, moving up the informatization level of agricultural product circulation infrastructure is required. At present, the infrastructure construction (e.g., roads, electricity and water conservancy) in rural areas in China has been basically completed, but the information network system needs to be improved, and the “last mile” of agricultural products circulation in rural logistics needs to be completed as soon as possible. Fifth, we should vigorously cultivate skilled farmers in the agricultural products circulation industry with “Internet +” quality. Specifically, governments should increase expenditure on education, science and technology, so as to improve the knowledge level and technical level of farmers in poverty-stricken zones. Additionally, more financial and technical support are needed to be provided for farmers to participate in e-commerce training. Finally, due to the significant regional differences of the poverty reduction effect of internal development factors of agricultural product circulation industry in China, we should apply appropriate strategies and give priority to the internal development factor of agricultural product circulation industry with the biggest poverty reduction effect according to local conditions in different regions and so better able to achieve the targeted poverty alleviation in China.
The circulation infrastructure of agricultural products has the effect of poverty reduction, with consolidating and enhancing the cornerstone and driving force of the development of the circulation system of agricultural products, so as to promote the development of the circulation industry of agricultural products, affect farmers’ income, and then achieve poverty reduction. In recent years, many regions attach great importance to the construction of agricultural products circulation infrastructures and even the development of agricultural products circulation industry, but in the process of implementing policies and measures, there are situations where blindly following the trend, without taking into account regional differences, combined with a lack of targeted policies, result in a poor poverty reduction effect. For this study, due to the limitations of index selection and data, the research on the spatial difference on poverty reduction effects of agricultural products circulation infrastructure is not comprehensive, and the poverty reduction effect of different types of agricultural products circulation infrastructure has not been explored, which is also the direction of in-depth research in the future. In addition, we are also to use micro level data (such as family or community or farmer data) and classified variable data (education level, age, gender, etc.) to carry out more comprehensive research in future. Our findings further complement the internal mechanism of agricultural products circulation infrastructure on poverty reduction in China and offer insights for the rural poverty reduction in other countries, especially in the developing countries.

Author Contributions

X.L., Conceptualization, methodology, software, validation, formal analysis, resources, data curation, writing—original draft preparation, writing—review and editing, project administration, funding acquisition; F.Z., writing—review and editing, supervision. All authors have read and agreed to the published version of the manuscript.

Funding

This research was funded by Philosophy and Social Science Foundation of Hunan Province of China (grant number: 17YBQ057).

Institutional Review Board Statement

Ethical review and approval were waived for this study because it uses second-hand data collected from an open access database.

Informed Consent Statement

Consent was waived for this study because it uses second-hand data collected from an open access database.

Data Availability Statement

Data supporting reported results can be found at the open access database of Annual Data of National Bureau of Statistics of China (http://www.stats.gov.cn/tjsj/ndsj/, accessed on 1 July 2022), China Information Almanac (https://data.cnki.net/Yearbook/Single/N2019070069, accessed on 1 July 2022), DRCNET database (http://www.drcnet.com.cn/www/int/, accessed on 1 July 2022).

Conflicts of Interest

The authors declare no conflict of interest.

References

  1. Li, C.; Tan, Y. Research on poverty alleviation in China: Current situation, problems and strategic transformation. Globalization 2021, 1, 73–81, 135–136. [Google Scholar]
  2. Huang, Z.; Gao, G.; Teng, F.; Pan, B.; Song, J.; Li, A. Where Is the Way for China to Reduce Poverty for a Long Time? Prospects for Poverty Reduction Strategies After the Completion of Poverty Alleviation in 2020. Chin. Rural. Econ. 2019, 9, 2–14. [Google Scholar]
  3. Sun, W.; Zhang, P.; Zhao, D. The Difficulties and Countermeasures of Supply-Side Structural Reform of Agricultural Products Circulation Industry. Econ. Rev. J. 2018, 6, 99–104. [Google Scholar]
  4. He, S. Dictionary of Finance and Economics; China Finance and Economics Press: Beijing, China, 1990; p. 12. [Google Scholar]
  5. Li, D.; Luo, B. Some Theoretical Issues on Circulation of Agricultural Products. South China Rural Area 2002, 1, 30–32. [Google Scholar]
  6. Li, S. Analysis on the Relationship between Public Investment in Agricultural Products Circulation and Farmers’ Income. J. Commer. Econ. 2014, 9, 4–5. [Google Scholar]
  7. Sun, W.; Xu, M. Mechanism and Empirical Research on the Impact of Agricultural Products Circulation System on Farmers’ Income. J. Commer. Econ. 2021, 11, 126–129. [Google Scholar]
  8. Liu, Z.; Zhang, Y. Translation Infrastructure and Rural Economic Growth in China. Theory Pract. Financ. Econ. 2013, 34, 98–102. [Google Scholar]
  9. Qi, R.; Qi, M. Spillover effects of transportation infrastructure on China’s regional economic growth based on multidimensional factors. Adv. Transp. Stud. 2017, 2, 107–116. [Google Scholar]
  10. Li, H.; Xu, Y. Transport Infrastructure, Industrial Structure and Effect of Reducing Poverty: Based on the Panel VAR Model. J. Tech. Econ. Manag. 2016, 6, 25–30. [Google Scholar]
  11. Kang, J.; Guo, M.; Fu, Y. To get rich, build roads first? An empirical study on transportation infrastructure construction, transportation industry development and poverty reduction. Inq. Into Econ. Issues 2014, 9, 41–46. [Google Scholar]
  12. Fan, X.; Cui, Y. Heterogeneous human capital, infrastructure and urban-rural income gap: Theoretical analysis and empirical test based on the perspective of new economic geography. J. Southwest Minzu Univ. 2018, 39, 106–116. [Google Scholar]
  13. Yang, X.; Shi, D. Transportation Infrastructure, Factors Mobility and Urban-rural Income Gap. South China J. Econ. 2019, 9, 35–50. [Google Scholar]
  14. Hearn, D.H.; Halbrendt, C.K.; Gempesaw, C.M., II; Webb, S.-E.H. An Analysis of Transport Improvements in China’s Corn Sector: A Hybrid Spatial Equilibrium Approach. J. Transp. Res. Forum 1990, 31, 154–166. [Google Scholar]
  15. Ren, X.; Zhang, Z. Transportation Infrastructure, Factor Mobility and Urban-Rural Income Gap. Manag. Rev. 2013, 25, 51–59. [Google Scholar]
  16. Li, Y.; Wang, Y. The Structural Bias of Public Goods Supply and Urban-Rural Income Distribution under the Background of Urbanization. Soc. Sci. Guangdong 2014, 6, 33–39. [Google Scholar]
  17. Shao, Y.; Wang, X. Spatial spillover effects of China’s transportation infrastructure on the urban-rural income gap. J. Technol. Econ. 2015, 34, 100–108. [Google Scholar]
  18. Tong, G.; Li, X. Research on the Impact of Transportation Infrastructure on Urban-Rural Income Gap: Based on the Perspective of Spatial Spillover Effect. J. Quant. Econ. 2014, 5, 82–95. [Google Scholar]
  19. Luo, N.; Peng, Y. Transport Infrastructure Construction and Urban-Rural Income Equality: An Empirical Test Based on Provincial Panel Data. Ind. Econ. Res. 2016, 4, 100–110. [Google Scholar]
  20. Li, H.; Liang, B.; Long, Y. Research on the Spatial Spillover Effect of Opening-up on Urban-Rural Income Gap. East China Econ. Manag. 2019, 33, 86–93. [Google Scholar]
  21. Winters, P.; Davis, B.; Carletto, G.; Covarrubias, K.; Quinones, E.J.; Zezza, A.; Azzarri, C.; Stamoulis, K. Assets, Activities and Rural Income Generation: Evidence from a Multicountry Analysis. World Dev. 2009, 37, 1435–1452. [Google Scholar] [CrossRef]
  22. Gibson, J.; Olivia, S. The Effect of Infrastructure Access and Quality on Non-Farm Enterprises in Rural Indonesia. World Dev. 2010, 38, 717–726. [Google Scholar] [CrossRef]
  23. Haggblade, S.; Hazell, P.; Reardon, T. The Rural Non-farm Economy: Prospects for Growth and Poverty Reduction. World Dev. 2010, 38, 1429–1441. [Google Scholar] [CrossRef]
  24. Luo, Y. Economic Effect Analysis of China’s Urban-Rural Infrastructure Gap: Based on Spatial Panel Econometric Model. Chin. Rural. Econ. 2010, 3, 60–72, 86. [Google Scholar]
  25. Luo, Y.; Fan, L. Spatial Characteristics of Income-Increasing Effects of China’s Rural Infrastructure: An Empirical Study Based on Spatial Correlation and Spatial Heterogeneity. Manag. World 2012, 5, 71–87. [Google Scholar]
  26. Yang, S.; Wang, L. The Poverty Reduction Effect Research of the Development of Circulation Industry: Evidence Based on Chinese Provincial-Level Panel Data from 2000 to 2015. Theory Pract. Financ. Econ. 2018, 39, 101–108. [Google Scholar]
  27. Guo, S. Research on the Poverty Reduction Effect of Commercial Circulation Economic Development. J. Commer. Econ. 2016, 19, 3. [Google Scholar]
  28. Fan, B. Research on the Poverty Reduction Effect of the Development of China’s Circulation Industry. J. Commer. Econ. 2017, 9, 10–12. [Google Scholar]
  29. Li, D.; Wang, Q.; Lu, Y. Empirical Analysis of the Poverty Reduction Effect of the Development of Circulation Industry: Taking the Wuling Mountain Area of Hunan as an Example. J. Commer. Econ. 2018, 21, 142–146. [Google Scholar]
  30. Guo, S.; Tang, C.; Zhang, H. The Level of Agriculture Product Market and Agricultural Income Growth: The Theory and Positive Analysis. China Bus. Mark. 2011, 25, 107–112. [Google Scholar]
  31. Xia, C.; Xu, J.; Xue, J. The Influence of the Market Structure and Conduct of Agriculture Product on Farmer’s Income: An Case Study Based on SCP Model. Bus. Manag. J. 2009, 31, 25–29. [Google Scholar]
  32. Huang, Z.; Liu, D. China’s Logistics System for Agricultural Products: Their Development and Institutional Aspects. Issues Agric. Econ. 2005, 4, 49–53, 80. [Google Scholar]
  33. Fang, H. Research on the impact of agricultural product circulation efficiency on Farmers’ income. Shanxi Agric. Econ. 2022, 2, 96–98, 102. [Google Scholar]
  34. Montalvo, J.G.; Ravallion, M. The pattern of growth and poverty reduction in China. J. Comp. Econ. 2010, 38, 2–16. [Google Scholar] [CrossRef]
  35. Yang, B.; Wang, Z. A Change in the Ratio of Distribution Sector Value Added to GDP: An Empirical Study with Province-Level Panel Data and a Theoretical Explanation. J. Bus. Econ. 2011, 1, 19–25. [Google Scholar]
  36. Tu, H.; Li, C.; Sun, J. Empirical Research on Agricultural Products Circulation Modernization in China: Based on Provincial Data in 2009. J. Beijing Technol. Bus. Univ. (Soc. Sci.) 2013, 28, 20–27, 43. [Google Scholar]
  37. Lou, Y.; Yan, Z. Poverty Alleviation through Employment Promotion in Extreme Poverty-Stricken Areas in Western China: A Case Study of Targeted Poverty Alleviation through Employment Promotion in Awang Town, Dongchuan District. Asian Agric. Res. 2019, 11, 55–62. [Google Scholar]
  38. Taylor, J.E.; Rozelle, S.; de Brauw, A. Migration and Incomes in Source Communities: A New Economics of Migration Perspective from China. Econ. Dev. Cult. Change 2003, 52, 75–101. [Google Scholar] [CrossRef]
  39. Wouterse, F.S. Migration and Technical Efficiency in Cereal Production: Evidence from Burkina Faso. Agric. Econ. 2010, 41, 385–395. [Google Scholar] [CrossRef]
  40. Li, B.; Luo, J. An Empirical Study on the Impact of Rural Labor Mobility on Multidimensional Poverty of Rural Households. Stat. Decis. 2022, 38, 22–26. [Google Scholar]
  41. Zhang, L. Scientific and Technological Progress, Human Capital and the Western Region of Rural Poverty Reduction: An Empirical Study Based on Provincial Panel Data. Sci. Sci. S.& T. 2015, 36, 172–180. [Google Scholar]
  42. Zhang, C.; Chang, Q.; Huo, X. Impact of informatization on regional poverty management. China Popul. Resour. Environ. 2021, 31, 124–134. [Google Scholar]
  43. Xin, D.; Wu, C. Rural Poverty Alleviation Effect of Informationization and Regional Differences: An Empirical Study based on Data of 273 Prefectural-level Cities in China. Commer. Res. 2020, 10, 127–133. [Google Scholar]
  44. Colecchia, A.; Schreyer, P. ICT Investment and Economic Growth in the 1990s: Is the United States a Unique Case? A Comparative Study of Nine OECD Countries. Rev. Econ. Dyn. 2002, 5, 408–442. [Google Scholar] [CrossRef]
  45. Niebel, T. ICT and Economic Growth: Comparing Developing, Emerging and Developed Countries. World Dev. 2014, 104, 197–211. [Google Scholar] [CrossRef]
  46. Cheng, C.Y.; Chien, M.S.; Lee, C.C. ICT Diffusion, Financial Development, and Economic Growth: An International Cross-Country Analysis. Econ. Model. 2021, 94, 662–671. [Google Scholar] [CrossRef]
  47. Cheng, M.; Jin, Y.; Gai, Q.; Shi, Q. Focusing on Education or Health Improvement for Anti-poverty in Rural China: Evidence from National Household Panel Data. Econ. Res. J. 2014, 49, 130–144. [Google Scholar]
  48. McCulloch, N.; Winters, L.A.; Cirera, X. Trade Liberalization and Poverty: A Handbook; Centre for Economic Policy Research: London, UK, 2001. [Google Scholar]
  49. Lu, H.; Du, Y. Measurement of China’s Fiscal Redistribution and Poverty Reduction Effects. Econ. Res. J. 2019, 54, 4–20. [Google Scholar]
  50. Hu, S. Analysis of the Impact of Fiscal Investment on Rural Anti-Poverty in China. Rural. Econ. 2009, 4, 85–88. [Google Scholar]
  51. Zeng, H.; Xie, S. Research on the Relationship between Urbanization, Circulation Efficiency of Agricultural products and Farmers’ Income Growth. J. Commer. Econ. 2014, 36, 44–45. [Google Scholar]
  52. Song, Y.; Xiao, W. An Analysis of Dynamic Econometric Relationship Between Development of Urbanization and Income Growth of Rural Residents in China. J. Quant. Tech. Econ. 2005, 9, 30–39. [Google Scholar]
  53. Shahbaz, M.; Aamir, N. Urbanization and Poverty Reduction: A case study of Pakistan. J. Infrastruct. 2018, 8, 23–37. [Google Scholar]
  54. Wu, J.; Wang, H.; Wang, W. Is Agricultural Trade Opening to reduce Rural Poverty?—From the Perspective of Spatial Spillover Effect. China Soft Sci. 2021, 4, 22–31. [Google Scholar]
  55. Cui, W.; He, C. Rural Poverty Reduction Effect of Urbanization: Theory Mechanism and Empirical Test. Econ. Sci. 2018, 4, 89–102. [Google Scholar]
  56. Zhang, C. Economic Growth and Poverty Reduction: Analysis from the Perspective of Industry Composition. J. Quant. Tech. Econ. 2011, 28, 51–63. [Google Scholar]
Figure 1. The internal logical relationship between the supply quality of agricultural products circulation infrastructure and poverty reduction.
Agriculture 12 01208 g001
Figure 2. Regional division of East (Marked in red), Central (Marked in light brown), West (Marked in light blue) and Northeast (Marked in light yellow) in China. According to the division standard on National Bureau of Statistics of China, China is divided into four regions: the East, the Central, the West and the northeast. The eastern region includes Beijing, Tianjin, Hebei, Shanghai, Jiangsu, Zhejiang, Fujian, Shandong, Guangdong, Hainan and Taiwan; The Central region includes Shanxi, Anhui, Jiangxi, Henan, Hubei and Hunan; The western region includes inner Mongolia, Guangxi, Chongqing, Sichuan, Guizhou, Yunnan, Shaanxi, Gansu, Ningxia, Qinghai, Xinjiang and Tibet. Northeast China includes Liaoning, Jilin and Heilongjiang. Due to the lack of data, Tibet and Taiwan Province were not included in the analysis.
Agriculture 12 01208 g002
Table 2. Definition and descriptive analysis of variable indicators.
VariablesDefinitionMeanS.D.MinimumMaximumVIF1VIF2
L n G A P i t Urban-rural per capita disposable income gap (%)1.0521240.18839110.61518561.633154
L n Y i t Gross output value of agricultural product circulation industry (100 million yuan)6.8837371.0351053.6640749.1016991.55
L n K i t Agricultural product circulation infrastructure investment (100 million yuan)7.9007771.0099235.03963610.05371 7.57
L n L i t Number of employees in agricultural product circulation industry (10,000 people)3.7833980.98343680.37156365.742843 1.83
L n H C i t Human capital (10,000 people)5.6032680.81315553.0726937.55479 5.68
L n T i t Information level (%)4.3404181.1114653.4992318.942853 1.07
L n U r b a n i t urbanization level (%)3.8699320.32641862.7459884.4953552.072.36
L n T r a d e i t degree of openness (%)2.9123620.9879660.5278885.1483562.572.59
L n L o c a l   f i s c a l i t local government spending (%)2.0429830.58010950.1664092.9426641.812.32
Table 3. Analysis of the overall poverty reduction effect.
VariablesOLSREFE
L n Y i t −0.052−0.163 ***
(0.011)
−0.198 ***
(0.012)
L n U r b a n i t −0.305−0.017
(0.025)
0.040
(0.025)
L n T r a d e i t −0.011−0.037 ***
(0.010)
−0.053 ***
(0.011)
L n L o c a l   f i s c a l i t 0.0360.072 ***
(0.010)
0.088 ***
(0.010)
_cons2.5522.202 ***
(0.067)
2.233 ***
(0.066)
F statistic139.13 ***708.97 ***63.85 ***
Hausman chi2(8) = 110.53 ***
R-sq0.55170.64680.6533
Note: *** is represented as p < 0.01; Standard errors are in brackets.
Table 4. Analysis of the poverty reduction effect of internal development factors of agricultural products circulation industry.
VariablesOLSREFEOLSREFE
L n K i t −0.046 ***
(0.014)
−0.064 ***
(0.006)
−0.064 ***
(0.006)
0.007
(0.016)
−0.111 ***
(0.010)
−0.119 ***
(0.009)
L n L i t −0.044 ***
(0.009)
−0.039 ***
(0.015)
−0.041 **
(0.017)
−0.023 ***
(0.008)
−0.011
(0.014)
−0.018
(0.015)
L n H C i t −0.033 *
(0.018)
−0.054 ***
(0.011)
−0.056 ***
(0.011)
−0.053 ***
(0.017)
−0.043 ***
(0.010)
−0.047 ***
(0.010)
L n T i t −0.020 ***
(0.007)
−0.009 ***
(0.002)
−0.009 ***
(0.002)
−0.009 *
(0.005)
−0.008 ***
(0.002)
−0.008 ***
(0.002)
L n U r b a n i t −0.317 ***
(0.028)
0.010
(0.022)
0.038 *
(0.022)
L n T r a d e i t −0.010
(0.010)
−0.060 ***
(0.010)
−0.069 ***
(0.010)
L n L o c a l   f i s c a l i t 0.010
(0.015)
0.051 ***
(0.009)
0.054 ***
(0.008)
_cons1.851 ***
(0.062)
2.048 ***
(0.049)
2.061 ***
(0.045)
2.658 ***
(0.081)
2.281 ***
(0.066)
2.301 ***
(0.066)
F statistic53.36 *** 208.93 ***83.86 *** F = 159.81 ***
Chi2 826.42 *** 1042.25 ***
Hausman chi2(5) = 13.24 *** chi2(8) = 40.32 ***
R-sq0.32410.66760.66770.57050.72860.7304
Note: *, ** and *** are represented as p < 0.1, p < 0.05, and p < 0.01, respectively; Standard errors are in brackets.
Table 5. Regional difference analysis—the poverty reduction effects of the agricultural products circulation industry and its internal development factors.
VariablesEast RegionCentral RegionWestern RegionNortheast Region
FEFEFEFEFEFEFEFE
L n Y i t −0.205 ***
(0.013)
−0.200 ***
(0.021)
−0.226 ***
(0.018)
−0.195 ***
(0.041)
L n K i t −0.127 ***
(0.010)
−0.089 ***
(0.020)
−0.120 ***
(0.016)
−0.182 ***
(0.031)
L n L i t −0.011
(0.017)
−0.103 ***
(0.040)
−0.076 ***
(0.030)
0.169 ***
(0.030)
L n H C i t −0.051 ***
(0.010)
−0.058 ***
(0.015)
−0.043 ***
(0.015)
−0.080 ***
(0.028)
L n T i t −0.008 ***
(0.002)
−0.011 ***
(0.003)
−0.011 ***
(0.004)
0.001 ***
(0.006)
L n U r b a n i t −0.047
(0.038)
0.084 ***
(0.033)
0.067
(0.048)
0.026
(0.039)
0.021
(0.039)
0.026
(0.036)
0.527 ***
(0.163)
0.713
(0.136)
L n T r a d e i t −0.057 ***
(0.012)
−0.075 ***
(0.011)
−0.034
(0.023)
−0.055 ***
(0.019)
−0.057 ***
(0.014)
−0.036 ***
(0.013)
−0.072 ***
(0.033)
−0.148 ***
(0.033)
L n L o c a l   f i s c a l i t 0.091 ***
(0.010)
0.056 ***
(0.008)
0.087 ***
(0.019)
0.030 ***
(0.014)
0.102 ***
(0.016)
0.043 ***
(0.012)
−0.007
(0.030)
0.053
(0.032)
_cons2.270 ***
(0.100)
2.198 ***
(0.092)
2.099 ***
(0.101)
2.525 ***
(0.125)
2.473 ***
(0.086)
2.512 ***
(0.089)
0.342
(0.537)
−0.436 ***
(0.543)
R-sq0.64160.72380.76580.88850.77570.83780.68370.8102
Note: *** is represented as p < 0.01; Standard errors are in brackets.
Publisher’s Note: MDPI stays neutral with regard to jurisdictional claims in published maps and institutional affiliations.

