Article

Coordinate Inheritance of Seed Isoflavone and Protein in Soybean

1
Root Biology Center, College of Resources and Environment, Fujian Agriculture and Forestry University, Fuzhou 350002, China
2
Hebei Laboratory of Crop Genetics and Breeding, National Soybean Improvement Center Shijiazhuang Sub-Center, Huang-Huai-Hai Key Laboratory of Biology and Genetic Improvement of Soybean, Ministry of Agriculture and Rural Affairs, Institute of Cereal and Oil Crops, Hebei Academy of Agricultural and Forestry Sciences, Shijiazhuang 050035, China
*
Authors to whom correspondence should be addressed.
Agriculture 2022, 12(8), 1178; https://doi.org/10.3390/agriculture12081178
Submission received: 20 June 2022 / Revised: 21 July 2022 / Accepted: 3 August 2022 / Published: 8 August 2022
(This article belongs to the Section Genotype Evaluation and Breeding)

Abstract

:
Soybean (Glycine max (L.) Merr.) is an important nutritional crop, not only as a rich source of protein and oil, but also for the production of isoflavones. There is a demand to breed soybean cultivars bearing consistently high protein, oil and isoflavone yields, yet this requires a clear heritable genetic relationship among isoflavone, protein and oil production. Here, two soybean genotypes contrasting in terms of protein, oil and isoflavone contents and their 185 F8:10 recombinant inbred lines (RILs) were employed to characterize seed protein, oil and isoflavone contents over two years of field trials. In this population, protein, but not oil, was significantly correlated with isoflavone content. A high-density genetic linkage map containing 3943 SNP markers identified through genotyping-by-sequencing (GBS) technology was constructed for further genetic analysis, whereby a total of 25 integrated isoflavone loci were identified, including qISO1, qISO 6.1, qISO 6.3 and qISO 6.4, which are newly identified QTLs. Two major QTLs identified in this study, qISO5 and qISO6.2, were fine-mapped for production of daidzein and genistein derivatives, as well as for glycitein derivatives, in the sequences between nucleotide positions 41042159 and 42098680 on chromosome 5 and between 18449510 and 19395795 on chromosome 6, which, respectively, explain 9.3–20.4% and 7.8–24.8% of the phenotypic variation in these traits. Further combination of qISO5 and qISO6.2 resulted in additive impacts on isoflavone production. Among the 13 QTLs linked with seed protein content in this study, three also colocated with QTLs for isoflavone content, indicating that seed isoflavone and protein content may be coordinately inherited. These results contribute to understanding the relationships between isoflavone and protein or oil content in soybean seeds. This knowledge could be valuable for soybean breeding programs aiming to combine consistently high isoflavone production with high protein or oil content.

1. Introduction

Soybean (Glycine max L. Merr.) is a nutritional crop yielding seeds rich in protein and oil which, in 2020, accounted for about 70% of the protein meals and 28% of the vegetable oil consumed by humans and livestock [1,2]. In recent years, with increasing demands for food and feed, the planting area and production of soybean have increased dramatically. In 2020, soybean was planted in over 127 million hectares of land, primarily in Brazil, the United States, Argentina and China (data from FAO), while global soybean production reached 399 million metric tons [1]. This makes soybean the fourth most widely cultivated crop globally based on planting area and production, after wheat, maize and rice. Therefore, the release of elite soybean cultivars rich in protein and/or oil will remain a critically relevant target for soybean breeders globally for the foreseeable future.
Along with protein and oil, soybean is also capable of producing significant quantities of isoflavones, compounds useful in soybean adaptions to diverse environments [3,4,5] as well as in the maintenance of human health and well-being. For example, recent studies have shown that isoflavones may reduce the risk of cancer [6,7] and help prevent the onset of a number of chronic diseases [8,9]. Therefore, there are practical and pressing demands to breed soybean cultivars rich in isoflavones that are capable of producing high protein or oil content to meet the different needs of consumers. Although soybean seeds may contain high concentrations of isoflavones, wide ranging variation in this trait exists among soybean germplasms. For example, it was found that variation in isoflavone concentrations among 1168 soybean varieties ranged from approximately 700 μg·g−1 to 5000 μg·g−1 [10], while other studies have also discovered relatively high heritability in isoflavone concentrations among soybean varieties [11,12]. On the whole, previous results suggest that efforts to breed or genetically engineer soybean varieties that consistently produce high concentrations of isoflavones have a reasonable chance of success.
Due to the fact that isoflavones are synthesized through an amino acid (phenylpropanoid) pathway [13], potential relationships between the production of isoflavones and proteins or oils have been investigated, though released reports have generated uncertainty through significant disagreements in results. One group of researchers found that isoflavone synthesis is negatively correlated with protein production and positively correlated with oil content [14]. Others found that isoflavone contents were negatively correlated with protein levels and not significantly correlated with oil production [15,16]. In other work, decreases in protein content were associated with increases in isoflavone production in LOX near isogenic lines of soybean [17], which suggests that isoflavone and protein synthesis pathways might share common genes or that these pathways include genes with pleiotropic impacts. In short, all previous reports have consistently found correlations between protein and isoflavone production and unclear associations between isoflavone and oil synthesis, though the genetic components of protein, oil and isoflavone production that might be involved remain yet to be determined.
Quantitative trait localization is a method for studying the genetic basis of quantitative traits using a linkage map constructed of molecular markers that is widely applied in studies of cereal crops, such as rice [18,19], maize [20,21] and wheat [22,23], as well as legumes [24,25]. Isoflavone, protein and oil content are complex quantitative traits that are expected to be controlled by multiple loci exhibiting highly flexible responses to environmental conditions [14,16,26]. Previous studies have exerted tremendous efforts to locate markers for protein and oil production. To date, 238 QTLs associated with protein synthesis and 305 QTLs associated with oil production have been detected in soybean through experimentation on contrasting bi-parental populations [27]. The first report of soybean QTLs being associated with protein and oil content was published in 1992 [28], while efforts to confirm and identify more loci involved in protein or oil production have continued through to the recent report of the cloning of an important protein production QTL, cqSeed protein-003, from chromosome 20 [29,30].
Studies aiming to locate genetic regions of soybean involved in isoflavone production have commenced later than those investigating proteins and oils yet have still produced informative results. The first QTLs associated with isoflavone synthesis were originally reported in 1999 [31], and, up to the present, 87 QTLs associated with isoflavone production have been detected in bi-parental populations of soybean [27]. A number of major and stable QTLs associated with isoflavone production have been identified and verified in different soybean populations [15,32,33,34,35,36], while several candidate isoflavone pathway genes have also been characterized [32,33].
Despite this abundance of relevant results, few studies have investigated the potential genetic colocalization of protein or oil production markers with isoflavone synthesis markers. Several protein and isoflavone synthesis markers have been colocalized, though the common fragment was not given [15]. Other researchers have located protein and oil markers, along with those for isoflavone production, but colocation was not detected, likely due to the low-density linkage map employed [16]. In the current study, we aimed to analyze the genetic basis of isoflavone, protein and oil production in soybean using a high-density genetic linkage map composed of 3943 SNP markers identified using genotyping-by-sequencing (GBS) technology on 185 F8:10 RILs. The colocalization of isoflavone markers with protein or oil markers is likely to be identified at this density of markers, and verification of colocalized markers may be useful for breeding elite soybean varieties rich in both isoflavones and proteins or oils.

2. Materials and Methods

2.1. Plant Materials and Growth Conditions

In this study, the cultivated soybean variety JD12 (ZDD23040), which produces relatively low amounts of isoflavones and proteins, was crossed with the wild soybean accession Y9 (ZYD02739), which produces isoflavones and proteins in relative abundance, to construct a contrasting population comprised of 185 F8-derived recombinant inbred lines (RILs) using the single seed descent (SSD) method. The parents and population were planted in a randomized complete block design (RCBD), with three replications in 2020 and 2021 at the Dishang Experiment Farm (114.48° E, 38.03° N) of the Institute of Cereal and Oil Crops, Hebei Academy of Agricultural and Forestry Sciences, Shijiazhuang City, China. The soil of the site is a Fluventic Ustochrept type of soil. The average temperature in the soybean growing season is traditionally about 22 degrees, and the average rainfall is about 500 mL. The physical and chemical properties of the surface 25 cm of soil are as follows: pH is 8.3; organic matter is 19.9 g·kg−1; available N, P (Olsen-P) and K are 109.2 mg·kg−1, 21.6 mg·kg−1 and 193.4 mg·kg−1, respectively. Randomized complete block designs were employed in these field trials. Parental genotypes were planted in six replications and RILs in three replications. Each plot contained three 2 m-long rows spaced 0.5 m apart. Six plants were grown in each row. Seeds were harvested upon maturity from each plot and dried at ambient temperatures for later isoflavone, protein and oil determinations.

2.2. Isoflavone Extraction and Quantification

About 10 g of dried soybean seeds from each plot were selected and inspected to ensure that they were pest-free and disease-free. Then, they were ground by a cyclone mill (CT 293 Cyclotec™, FOSS, Shanghai agency, Denmark) and sifted through 80 mesh filters. Isoflavones were extracted using previously described methods [37], with slight modifications. Subsequently, 20 mg (±0.01 mg) of soybean powder was dissolved in 1 mL 70% (v/v) ethanol and 0.1% (v/v) acetic acid in a 1.5 mL plastic tube. The mixture was shaken on an incubated shaker (INNOVA 42, Eppendorf, Shanghai agency, Germany) at 28 °C and 200 rpm for 12 h. Mixture tubes were then centrifuged at 12,000× g rpm for 10 min, with the supernatants (0.7 mL) being filtered through 0.45 μm nylon syringe filters (JINTENG, Tianjin, China). Filtered samples were refrigerated at 4 °C prior to isoflavone analysis.
High-performance liquid chromatography (HPLC) was used to identify and quantify isoflavones according to published methods [37]. Chromatography was run on an Agilent 1260 HPLC system (Agilent, Santa Clara, CA, USA), with a 20μL injection volume run through at a solvent rate of 1.0 mL·min−1 using a 70 min linear gradient of 13–35% acetonitrile (v/v) held at 35 °C. The column utilized was a YMC-Pack ODS-AM-303 column (250 mm × 4.6 mm I.D., S-5 μm, 120Å, YMC Co. Kyoto, Japan), with the mobile phases A and B consisting of 0.1% acetic acid in distilled water and acetonitrile, respectively. Isoflavones were detected by UV absorption at 260 nm.
Twelve isoflavone standards were provided by Dr. Zhang (Chinese Academy of Agricultural Sciences). These isoflavones included daidzein (DE), daidzin (D), malonyldaidzin (MD), acetyldaidzin (AD), genistein (GE), genistin (G), malonylgenistin (MG), acetylgenistin (AG), glycitein (GLE), glycitin (GL), malonylglycitin (MGL) and acetylglycitin (AGL). Isoflavones were classified according to the aglycones they contained [10], as follows: daidzein derivatives (Ds) were defined as the sum of De, D, MD and AD; genistein derivatives (Gs) were defined as the sum of GE, G, MG and AG; glycitein derivatives (GLs) was defined as the sum of GLE, GL, MGL and AGL; while total isoflavone (TIF) was defined as the sum of all individual isoflavone contents. The concentration of isoflavones was determined according to the return time and peak area. Peak area data were extracted in the R software package shiny_HPLC v1.0 [38].

2.3. Protein and Oil Determination

Protein and oil content were measured with a near-infrared spectrometer (NIS) using a constructed model [39]. About 10 g of disease-free dry mature soybean seeds were placed in a measuring cup and then scanned with an NIS Analyzer (MATRIX-I, BRUKER, Shanghai Agency, Germany) [40]. Reflection spectrum information was computationally converted into log values for storage. These data were then analyzed in WINISI 1.02 software (InfraSoft International LLC, State College, PA, USA) [41], which finally outputted the protein and oil contents of soybean seeds.

2.4. Genotyping by Sequencing and SNP Calling

DNA was isolated from soybean seedling leaf tissue using the cetyl trimethylammonium bromide (CTAB) method [42]. Collected DNA samples were randomly cut into lengths of about 350 bp using a Covaris crusher. The library was constructed using a TruSeq Library Construction Kit (Novogene, Beijing, China) and was sequenced on an Illumina HiSeq platform. Sequencing data were compared with the reference genome (G. max Wm82.a2) using BWA software [43], with the following parameters: mem -t 4 -k 32 -M. Format conversion and SNP detections were conducted using the software SAMtools [44], with the minimum SNP length set to 4 bp and the minimum quality value (MQ) set to 20.

2.5. Map Construction and QTL Detection

To improve the quality of the constructed maps, SNP data were analyzed in chi-square tests, with a p-value threshold set at 0.05 for including SNPs in further steps. Redundant markers were then removed using the bin function in the software QTL IciMapping 4.1 run with default parameters [45]. A genetic map was constructed in MSTmap (Linux version) [46]. The parameters utilized were as follows: cut-off p-value was set to 10−20, on-map-dist was set to 15, no-map-size was set to 2, estimation-before-clustering was set to yes, other values were default values. To detect QTLs associated with protein, oil and isoflavone content, MapQTL6.0 [47] with the multiple model (MQM) method and QTL Cartographer V2.5_011 [48] with the CIM method was run. The logarithm of odds (LOD) threshold was set to 2.5 to verify the presence of QTLs.

2.6. QTL Integration

Colocalized segments of isoflavone and protein or oil production identified in this study were compared with previously published QTLs associated with the same traits. A composite genetic map was constructed with all downloaded QTLs, all molecular markers present on the consensus genetic map and all coordinates for the consensus map markers using the G. max Wm82.a2 genome version present on the soybase website [27]. Significant QTLs associated with target traits and nearby markers on colocated segments were assessed for physical distances separating relevant features. Genetic and consensus maps were constructed in MapChart 2.32 software [49].

2.7. Statistical Analysis

A total of 14 traits were analyzed, including 12 isoflavone traits, along with protein and oil traits. Due to minimal detection of DE, GE, GLE and AG in the observed population, these compounds were excluded from further analysis. The significance of parents was analyzed using the Student’s t-test in the base R package [50]. Population genetic variation was analyzed using the R package psych [51]. Broad-sense heritability (h2b) was calculated using the R package lme4 [52] according to the formula: h2b = VG/(VG + VE), where VG is the variance between RILs and VE is the variance within RILs. Correlation analysis was performed using the R package PerformanceAnalytics [53].

3. Results

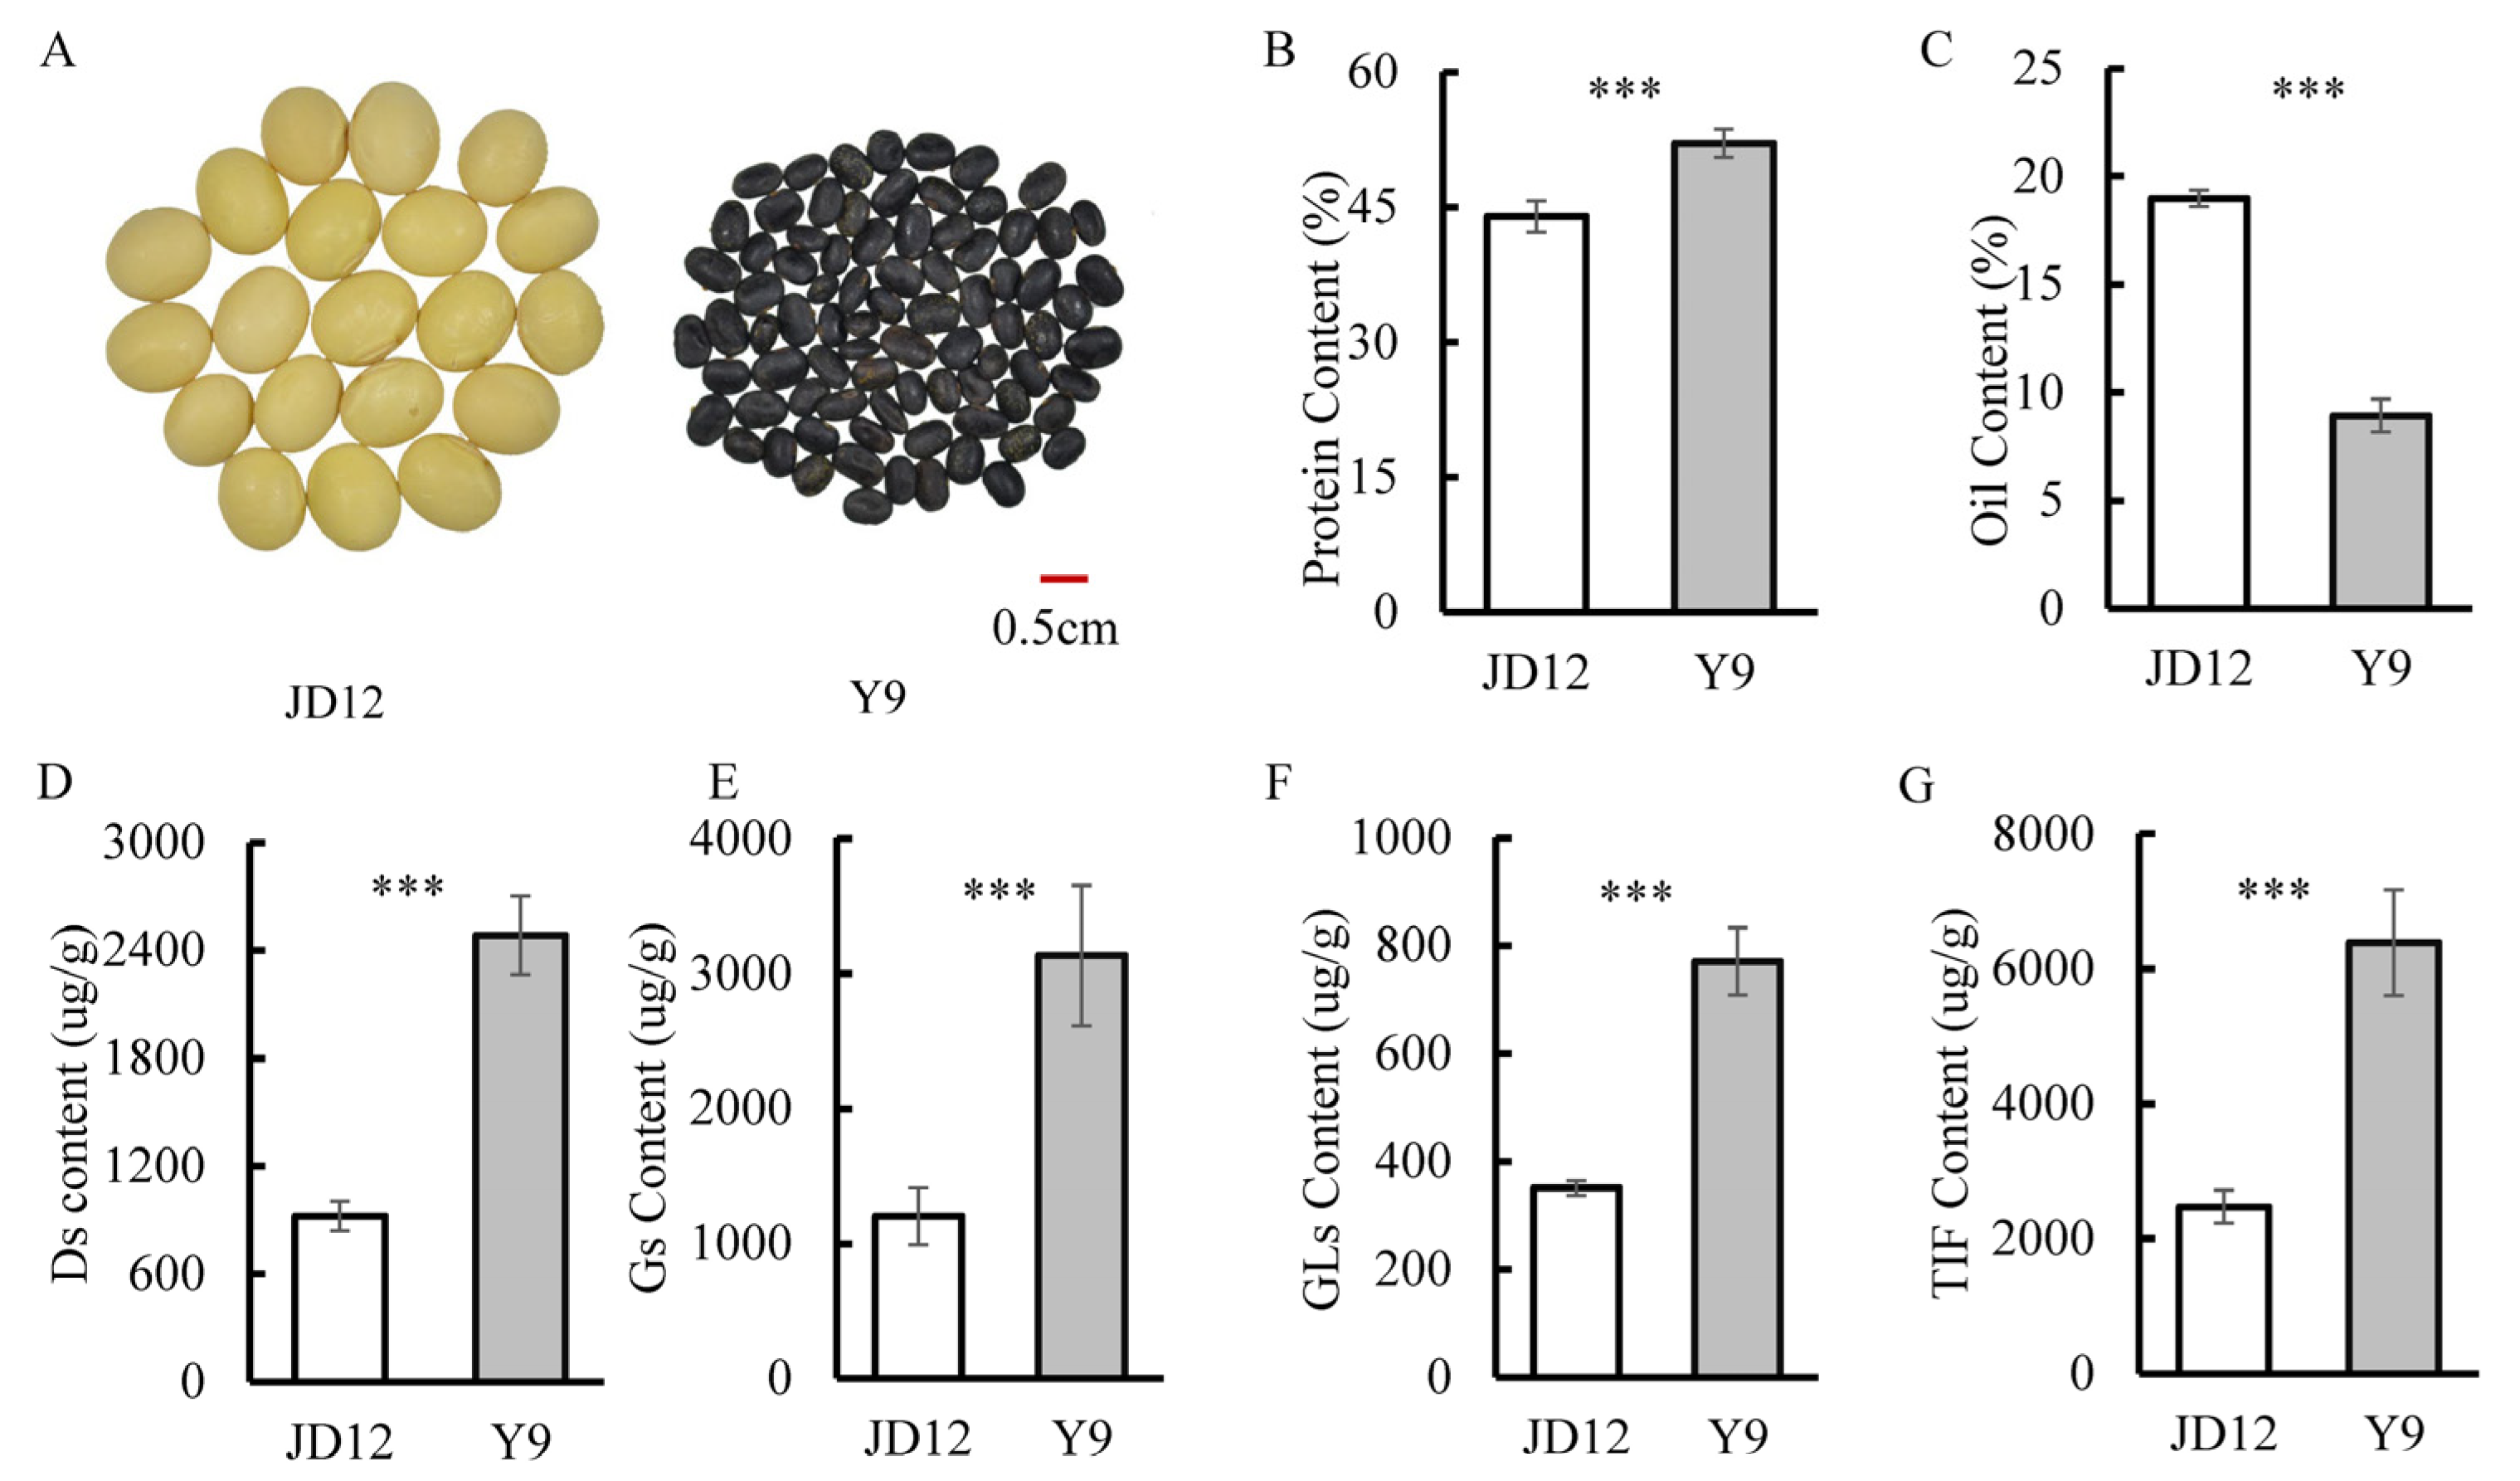
3.1. Comparison of Isoflavone, Protein and Oil Contents among Parents

The parents used in this study included the representative soybean cultivar JD12 (ZDD23040) and the wild soybean accession Y9 (ZYD02739). There were significant differences between the two parental genotypes with respect to seed traits, such as seed size and seed color (Figure 1A), and, more importantly, significant variation existed in the contents of isoflavones, proteins and oils (Figure 1). The wild soybean parent, Y9, had much higher total isoflavone and protein contents, but lower oil content than the cultivated parent, JD12 (Figure 1). This suggests that the genetics are more favorable for isoflavone and protein production in Y9, while the genetics of JD12 are more favorable for oil synthesis. Categorizing the aglycones in isoflavones into three groups allowed for separately analyzing Ds, Gs and GLs in the two parents. Here, we found that content of Ds, Gs and GLs was significantly higher in Y9 than in JD12, as indicated by the respective 169%, 161% and 119% greater concentrations in Y9 than in JD12 (Figure 1D–F).

3.2. Genetic and Phenotypic Variation within the RIL Population

To further study the genetic basis of isoflavone production in soybean seeds, a total of 12 isoflavone traits, as well as protein and oil contents, were evaluated over two years of seed harvests in field trials of JD12 and Y9 and 185 of their F8:10 progeny recombinant inbred lines (RILs). Aglycones of DE, GE, GLE and the acetylglycoside of AG were not detected in this study, in accordance with previous results [10]. Beyond that, great genetic variation was detected among the parents and RILs in the contents of the other isoflavones, as well as in both protein and oil contents (Table 1). Due to the small differences in protein content between parents (43.9% and 52.1% for JD12 and Y9, respectively), the average CV of protein content was small (6.58% in 2020 and 7.37% in 2021). However, the average CVs of isoflavone, oil and protein contents over the two years of observation were 34.44%, 13.12% and 6.90%, respectively, which shows a greater genetic variation in isoflavone production than in protein or oil production. Extensive transgressive heritability among the 185 RILs was observed for each of the observed traits, except oil. Population mean values for most traits fell between parent values, while maximum and minimum values lay beyond parental bounds, suggesting that both parents might contribute to phenotypic variation (Table 1). According to kurtosis and skew values present in trait histograms, detected isoflavones, proteins and oils all followed continuous distributions in content throughout the population, indicating that these traits are inherited as multiple loci (Table 1 and Figure 1). In addition, the broad sense heritability of the observed traits ranged from 0.72 to 0.87 over the two years of trials (Table 1), indicating that phenotypic variation mainly arose from genetic variation rather than environmental variation. Therefore, locating trait loci was feasible. The heritability of protein and oil content were 0.81 and 0.87, respectively, which were higher than isoflavone heritability, implying that isoflavone production is more sensitive to environmental fluctuations than protein or oil synthesis.

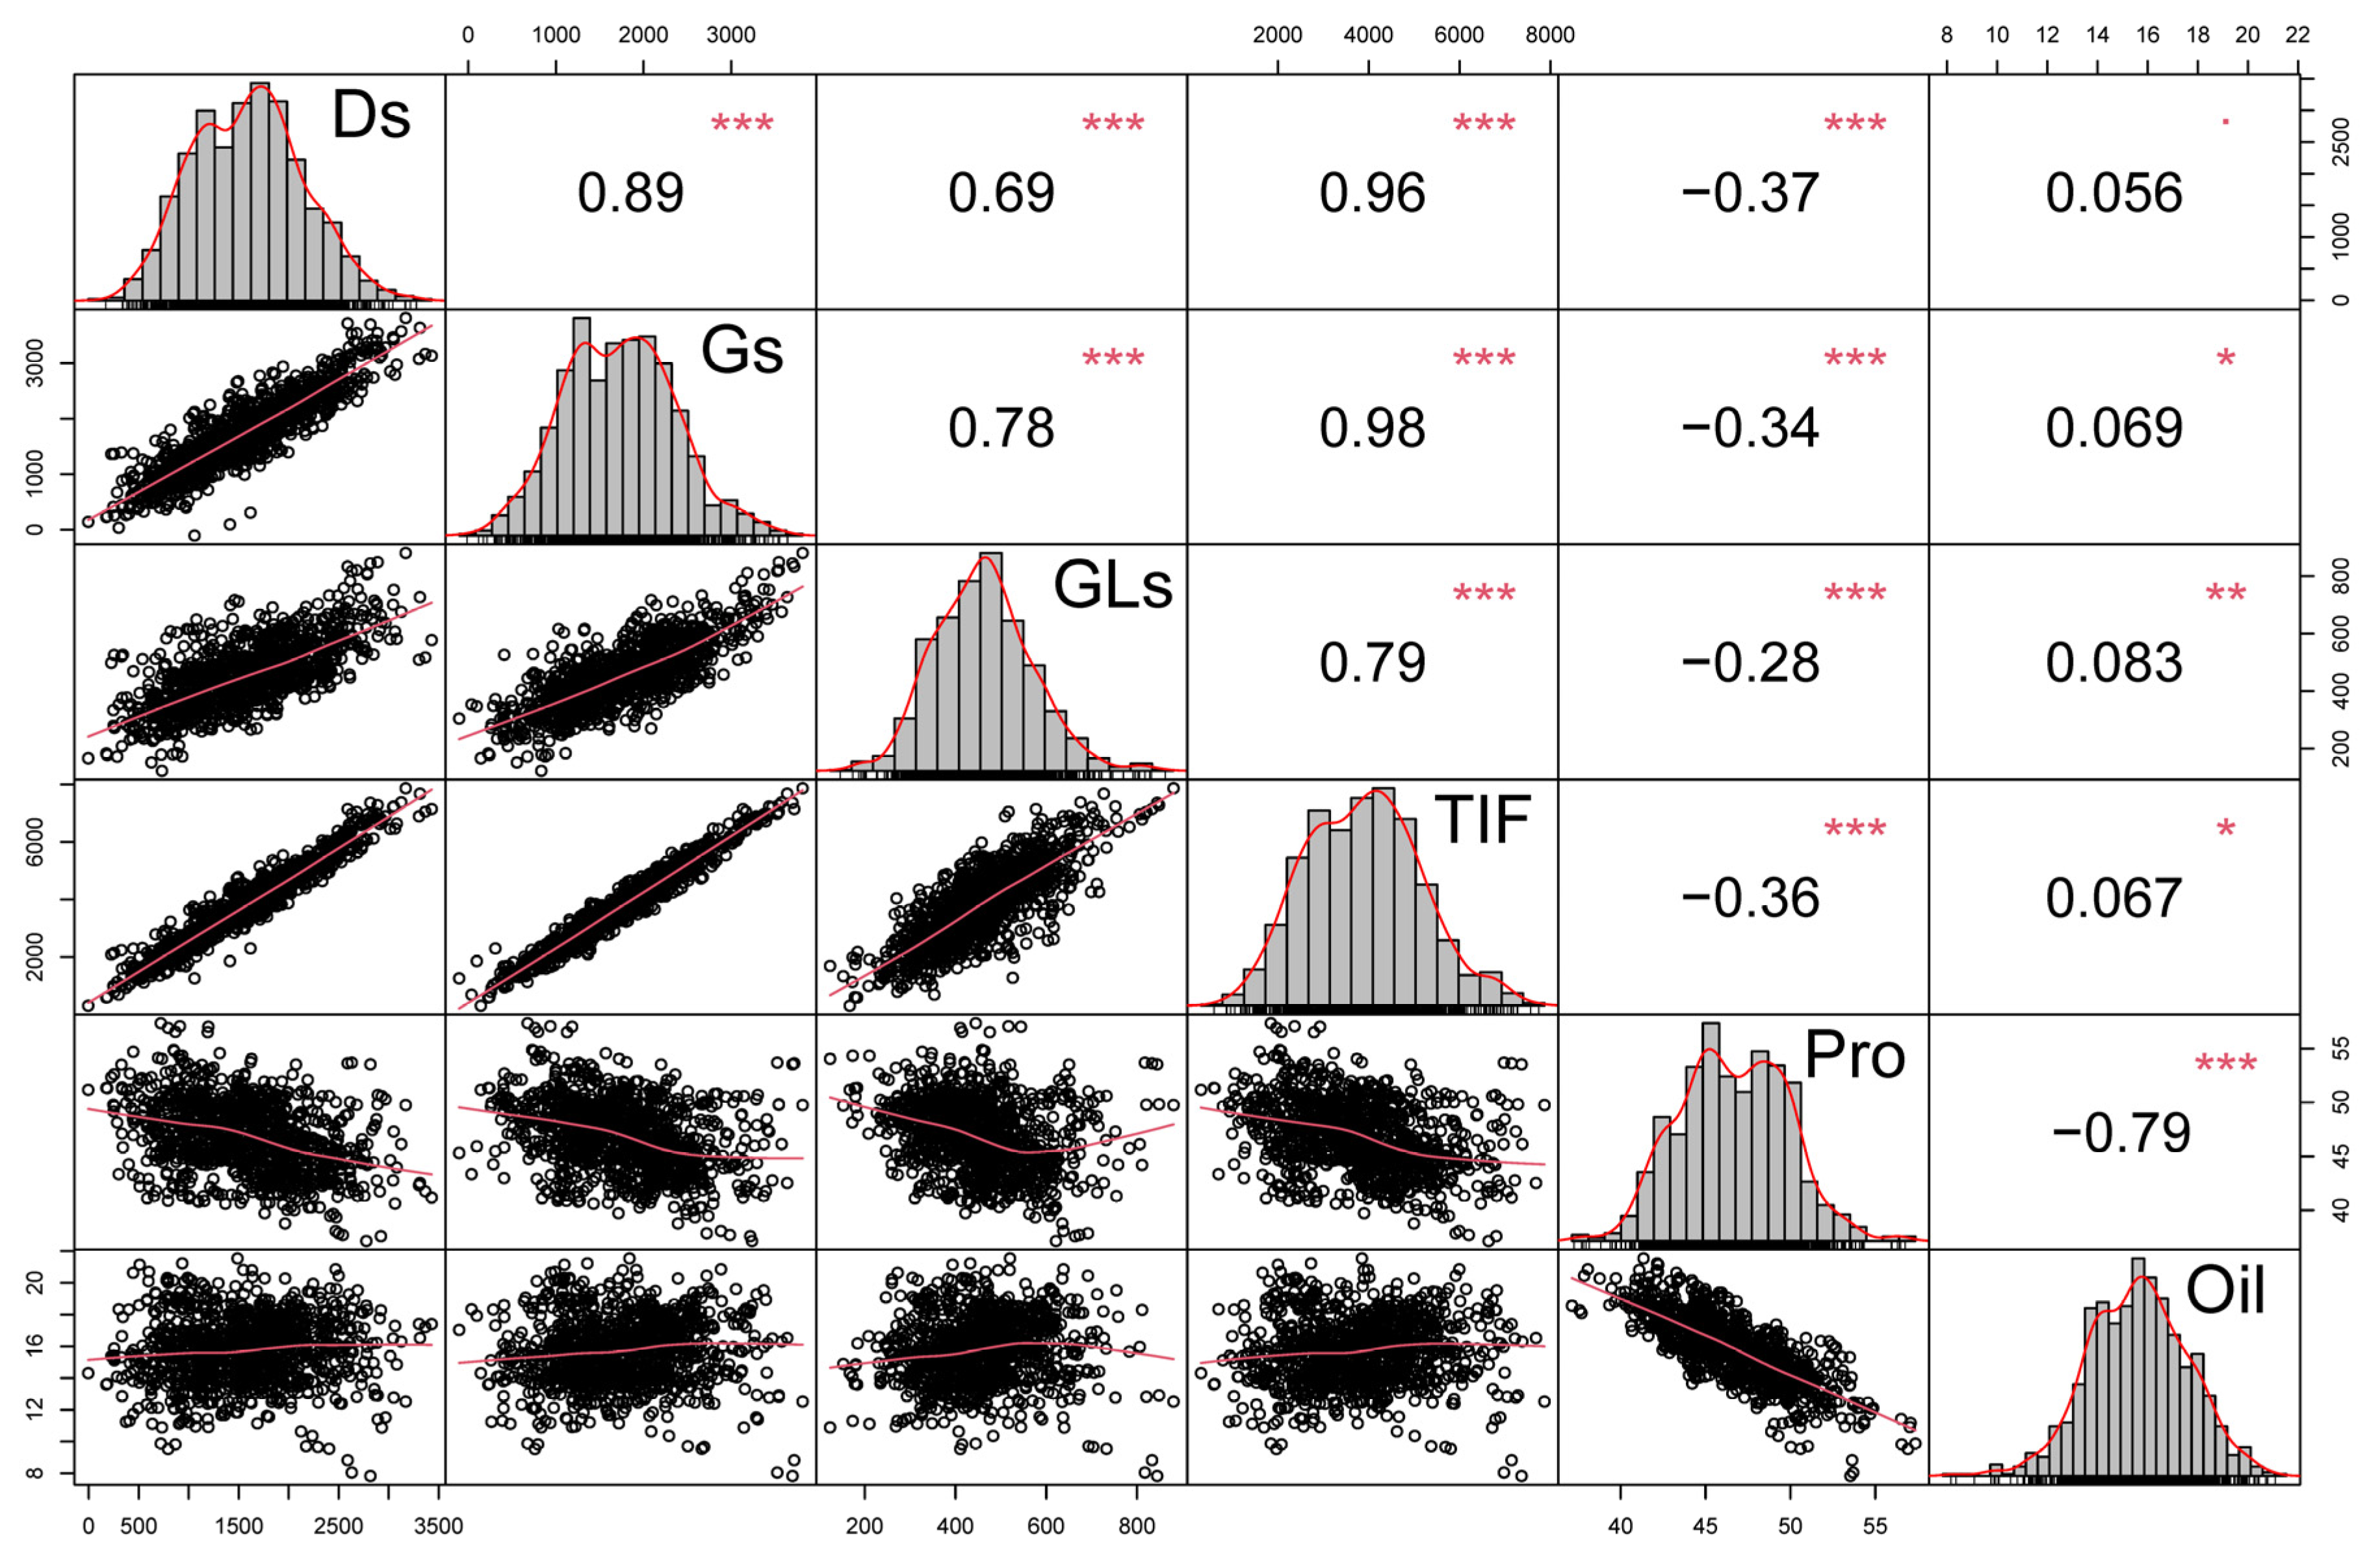
3.3. Correlation Analysis of Isoflavone, Protein and Oil Contents in Soybean Seeds

To study potential relationships between the observed traits, a correlation analysis was performed using the data from two years, with the correlation coefficients, histograms and scatter diagrams for isoflavone, protein and oil content summarized in Figure 2. There was a consistent negative correlation between protein and oil content (r = −0.79 ***), and a positive correlation of TIF with Ds, Gs, and GLs in soybean seeds harvested over two years of trials (Figure 2). Total isoflavone content was highly correlated with content of Ds (r = 0.96 ***) and Gs (r = 0.98 ***), which is consistent with additionally observed correlations of TIF with D, MD, G and MG (Figure S3). Meanwhile, TIF had a relatively low correlation with GLs (r = 0.79 ***), indicating that Ds and Gs are likely the main contributors to soybean TIF (Figure 2). Isoflavones were significantly correlated with both protein and oil content, as reflected in a negative correlation between TIF and protein content (r = −0.36 ***), along with a weak positive correlation between TIF and oil (r = 0.067 *) (Figure 2). Similar results were observed when results from 2020 and 2021 were analyzed separately, with annual TIF content having respective correlations with protein content of −0.42 *** and −0.34 ***, and respective correlations with oil content of 0.09 * and 0.005 (Figures S1 and S2). These results suggest that isoflavone and protein traits might be coordinately inherited, while oil production appears to occur more independently.

3.4. Map Construction and Verification

Chromosomal locations of loci impacting isoflavone, protein and oil content were evaluated using 226186 SNPs identified between the parents through GBS analysis. Assuming that markers separate in a 1:1 ratio, 6072 (2.68%) SNP markers remained after chi-square testing, and 4075 (1.8%) markers remained after removing redundant markers falling into common bins in the QTL software IciMapping 4.1 run with default parameters (Meng et al., 2015). These filtered SNP markers produced a high-density linkage map containing 3943 SNP markers spanning approximately 938 Mb of the 1.1 Gb soybean genome and covering 6307 cM, with an average distance of 1.6 cM between adjacent SNP markers. The average number of SNPs in each linkage group was 197, with the most in linkage group 13 (314 SNPs) and the least in linkage group 2 (138 SNPs) (Figure S6 and Table S1). To verify the accuracy of the map, the seed coat color trait was located on the constructed map, with the predominant QTL falling between 8.2–8.4 Mb of chromosome 8 having a high LOD value of 39.87, which is consistent with previously published GWAS data [54]. The constructed high-density and -quality linkage map was, therefore, considered suitable for use in further studies.

3.5. Identification of QTLs for Soybean Seed Isoflavone, Protein and Oil Content

With a suitable high-density linkage map in hand, the QTLs underlying isoflavone content were identified separately for each year. A total of 176 QTLs surpassed the LOD thresholds, which could then be integrated into 25 loci based on genetic and physical distances (Table 2 and Table S2). LOD values of isoflavone loci ranged from 2.52 to 11.34, and PVE values ranged from 6.1% to 24.8%, with mostly negative ADD values indicating that alleles from the male contributed to increasing isoflavone content, which was consistent with the high isoflavone content in Y9. On the other hand, several favorable loci for isoflavone production were found in JD12 on chromosomes 8, 9 and 20. Over two years of trials, fourteen stable loci, accounting for 56% of total isoflavone variation, were consistently detected (qISO1, qISO5, qISO6.1, qISO6.2, qISO6.3, qISO6.4, qISO8.1, qISO10.3, qISO11, qISO12, qISO14, qISO17, qISO19.2 and qISO19.3). These loci are located on chromosomes 1, 5, 6, 8, 9, 10, 11, 12, 14, 17 and 19 (Table 2).
Two major and stable loci with average PEV values exceeding 15% were localized to narrow genomic segments (Table 3). Locus qISO5 was localized to a physical section of 1.05 MB (41042159–42098680) and identified as a strong major isoflavone locus for TIF, DS, GS, GLS, D, MD, G, MG, GL and MGL. The LOD and PVE values for qISO5 ranged from 3.1 to 11.11 and 7.5 to 24.4%, respectively, across trials. Furthermore, within the qISO5 locus, the individual QTLs of qDs5, qTIF5 and qGs5 each produced relatively high LOD values (11.11, 9.94 and 7.12, respectively) and PEV values (24.4%, 22.1% and 16.4%, respectively), indicating that these loci might be primary controllers of the synthesis of Ds, TIF and Gs (Table 3). The other locus strongly associated with TIF, GL and MGL production, qISO6.2, was localized to a narrow physical distance of 0.95 Mb (18449150–19395795) and harbored LOD and PVE values across trials ranging from 2.94 to 10.15 and 7.1% to 24.8%, respectively. The mean LOD and PVE values for the combined qGLs6.2 and qMGL6.2 section within qISO6.2 were 10.59% and 23.4%, respectively, which indicates that this locus is a primary controller of the synthesis of GLs (Table 3). Among them, Glyma.05g237900 and Glyma.05g244100 on chromosome 5 and Glyma.06g202200 and Glyma.06g208000 on chromosome 6 were highly expressed in seeds and might be candidate genes for isoflavone content (Figure 3).
A total of 13 protein QTLs and 15 oil QTLs were detected. The LOD values ranged from 2.51 to 10.30 and the PVE values ranged from 6.10% to 22.80% (Table 4). Seven stable protein QTLs were significant over both years, including qPC6.1, qPC8, qPC9, qPC15, qPC20.1, qPC20.2 and qPC20.3. Each locus, except for qPC6.1, produced QTL LOD values greater than 5. Locus qPC20.2 (22632082 bp) returned the maximum protein LOD value of 9.41 and the maximum PVE value of 21.10%. Eight oil QTLs could be detected each year, including qOC6.1, qOC8, qOC13.1, qOC15.1, qOC20.1, qOC20.3, qOC20.4 and qOC20.5. Each locus, except for qOC6.1, qOC13 and qOC20.5, returned LOD values greater than 5. Locus qOC20.1 (5834525 bp-6101553 bp) had the maximum mean LOD value of 10.13 and the maximum mean PEV of 22.55%. For protein production, all QTLs, except for those on chromosome 6, returned negative ADD values, indicating that, except for loci on chromosome 6, favorable protein genetics were contributed by Y9. In contrast, favorable alleles for oil production were donated by JD12, except for those on chromosome 6. Combined protein and oil loci could be integrated into 15 quality loci according to genetic and physical distances. These 10 loci contained both protein QTLs and oil QTLs (Table 4). This is consistent with previous results in which protein production exhibits a strong negative correlation with oil production in soybean (Figure 2). Overall, several stable major QTLs associated with isoflavone, protein and oil content were detected in the observed RIL population.

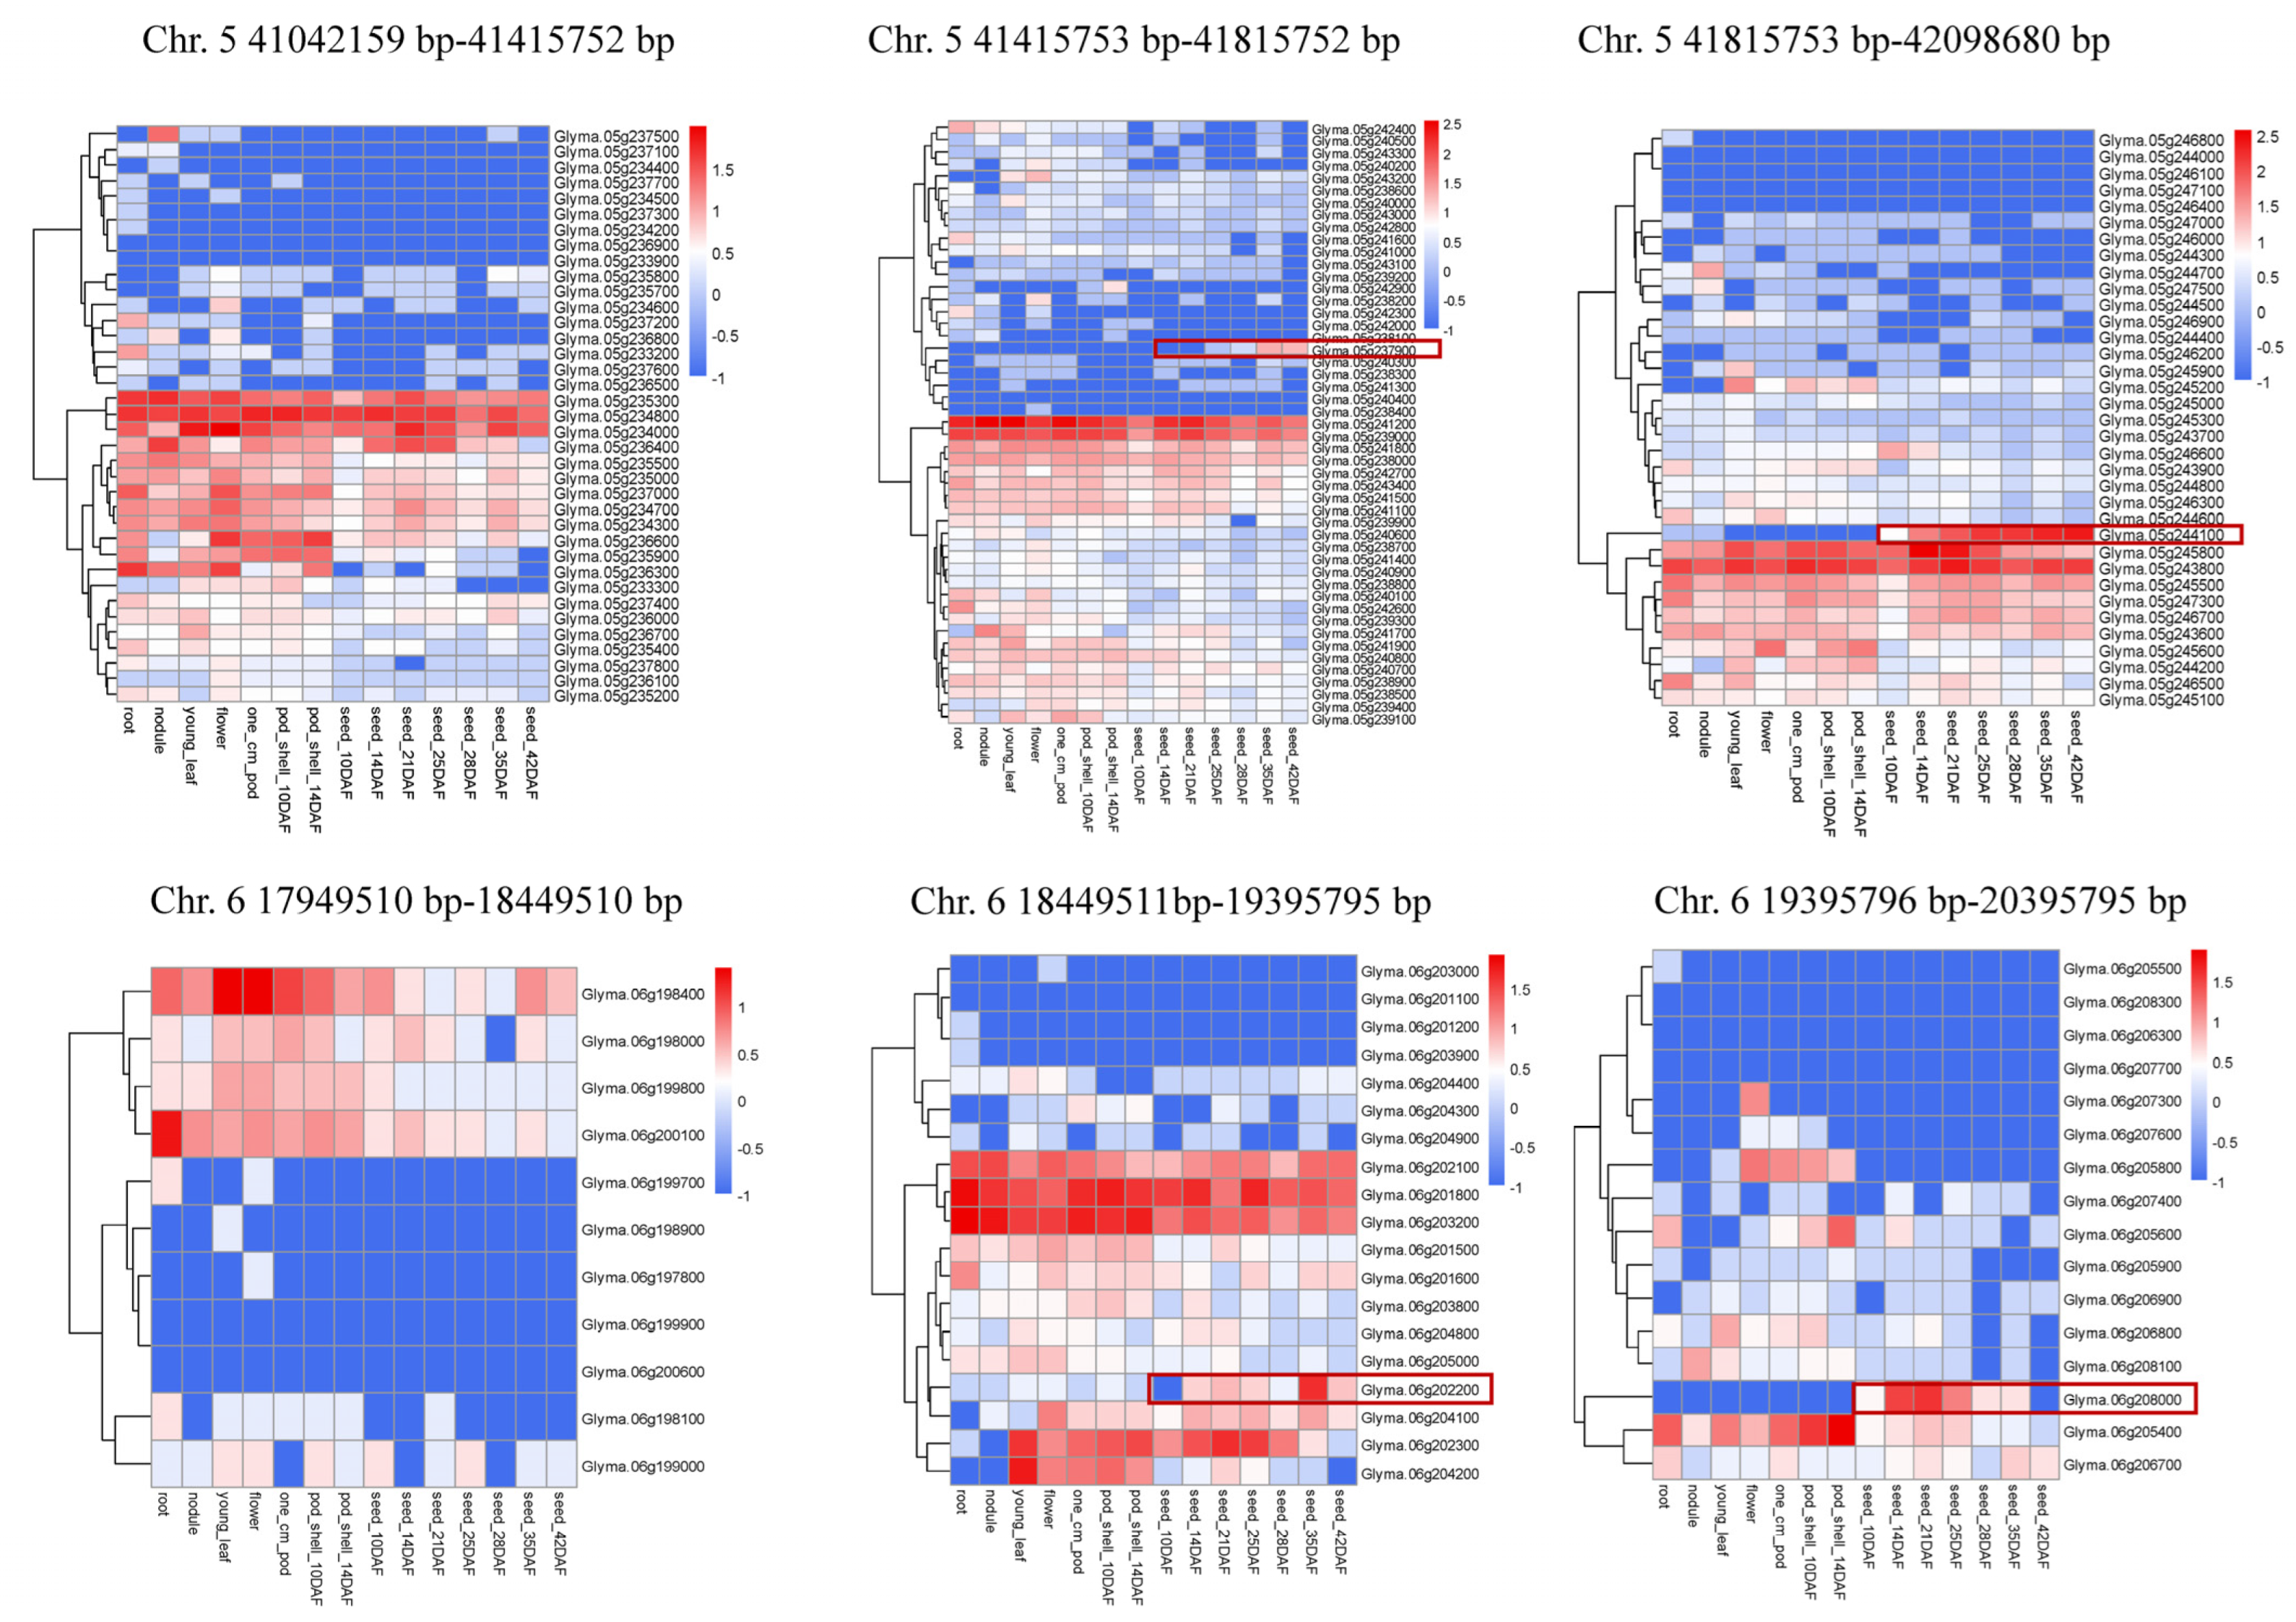
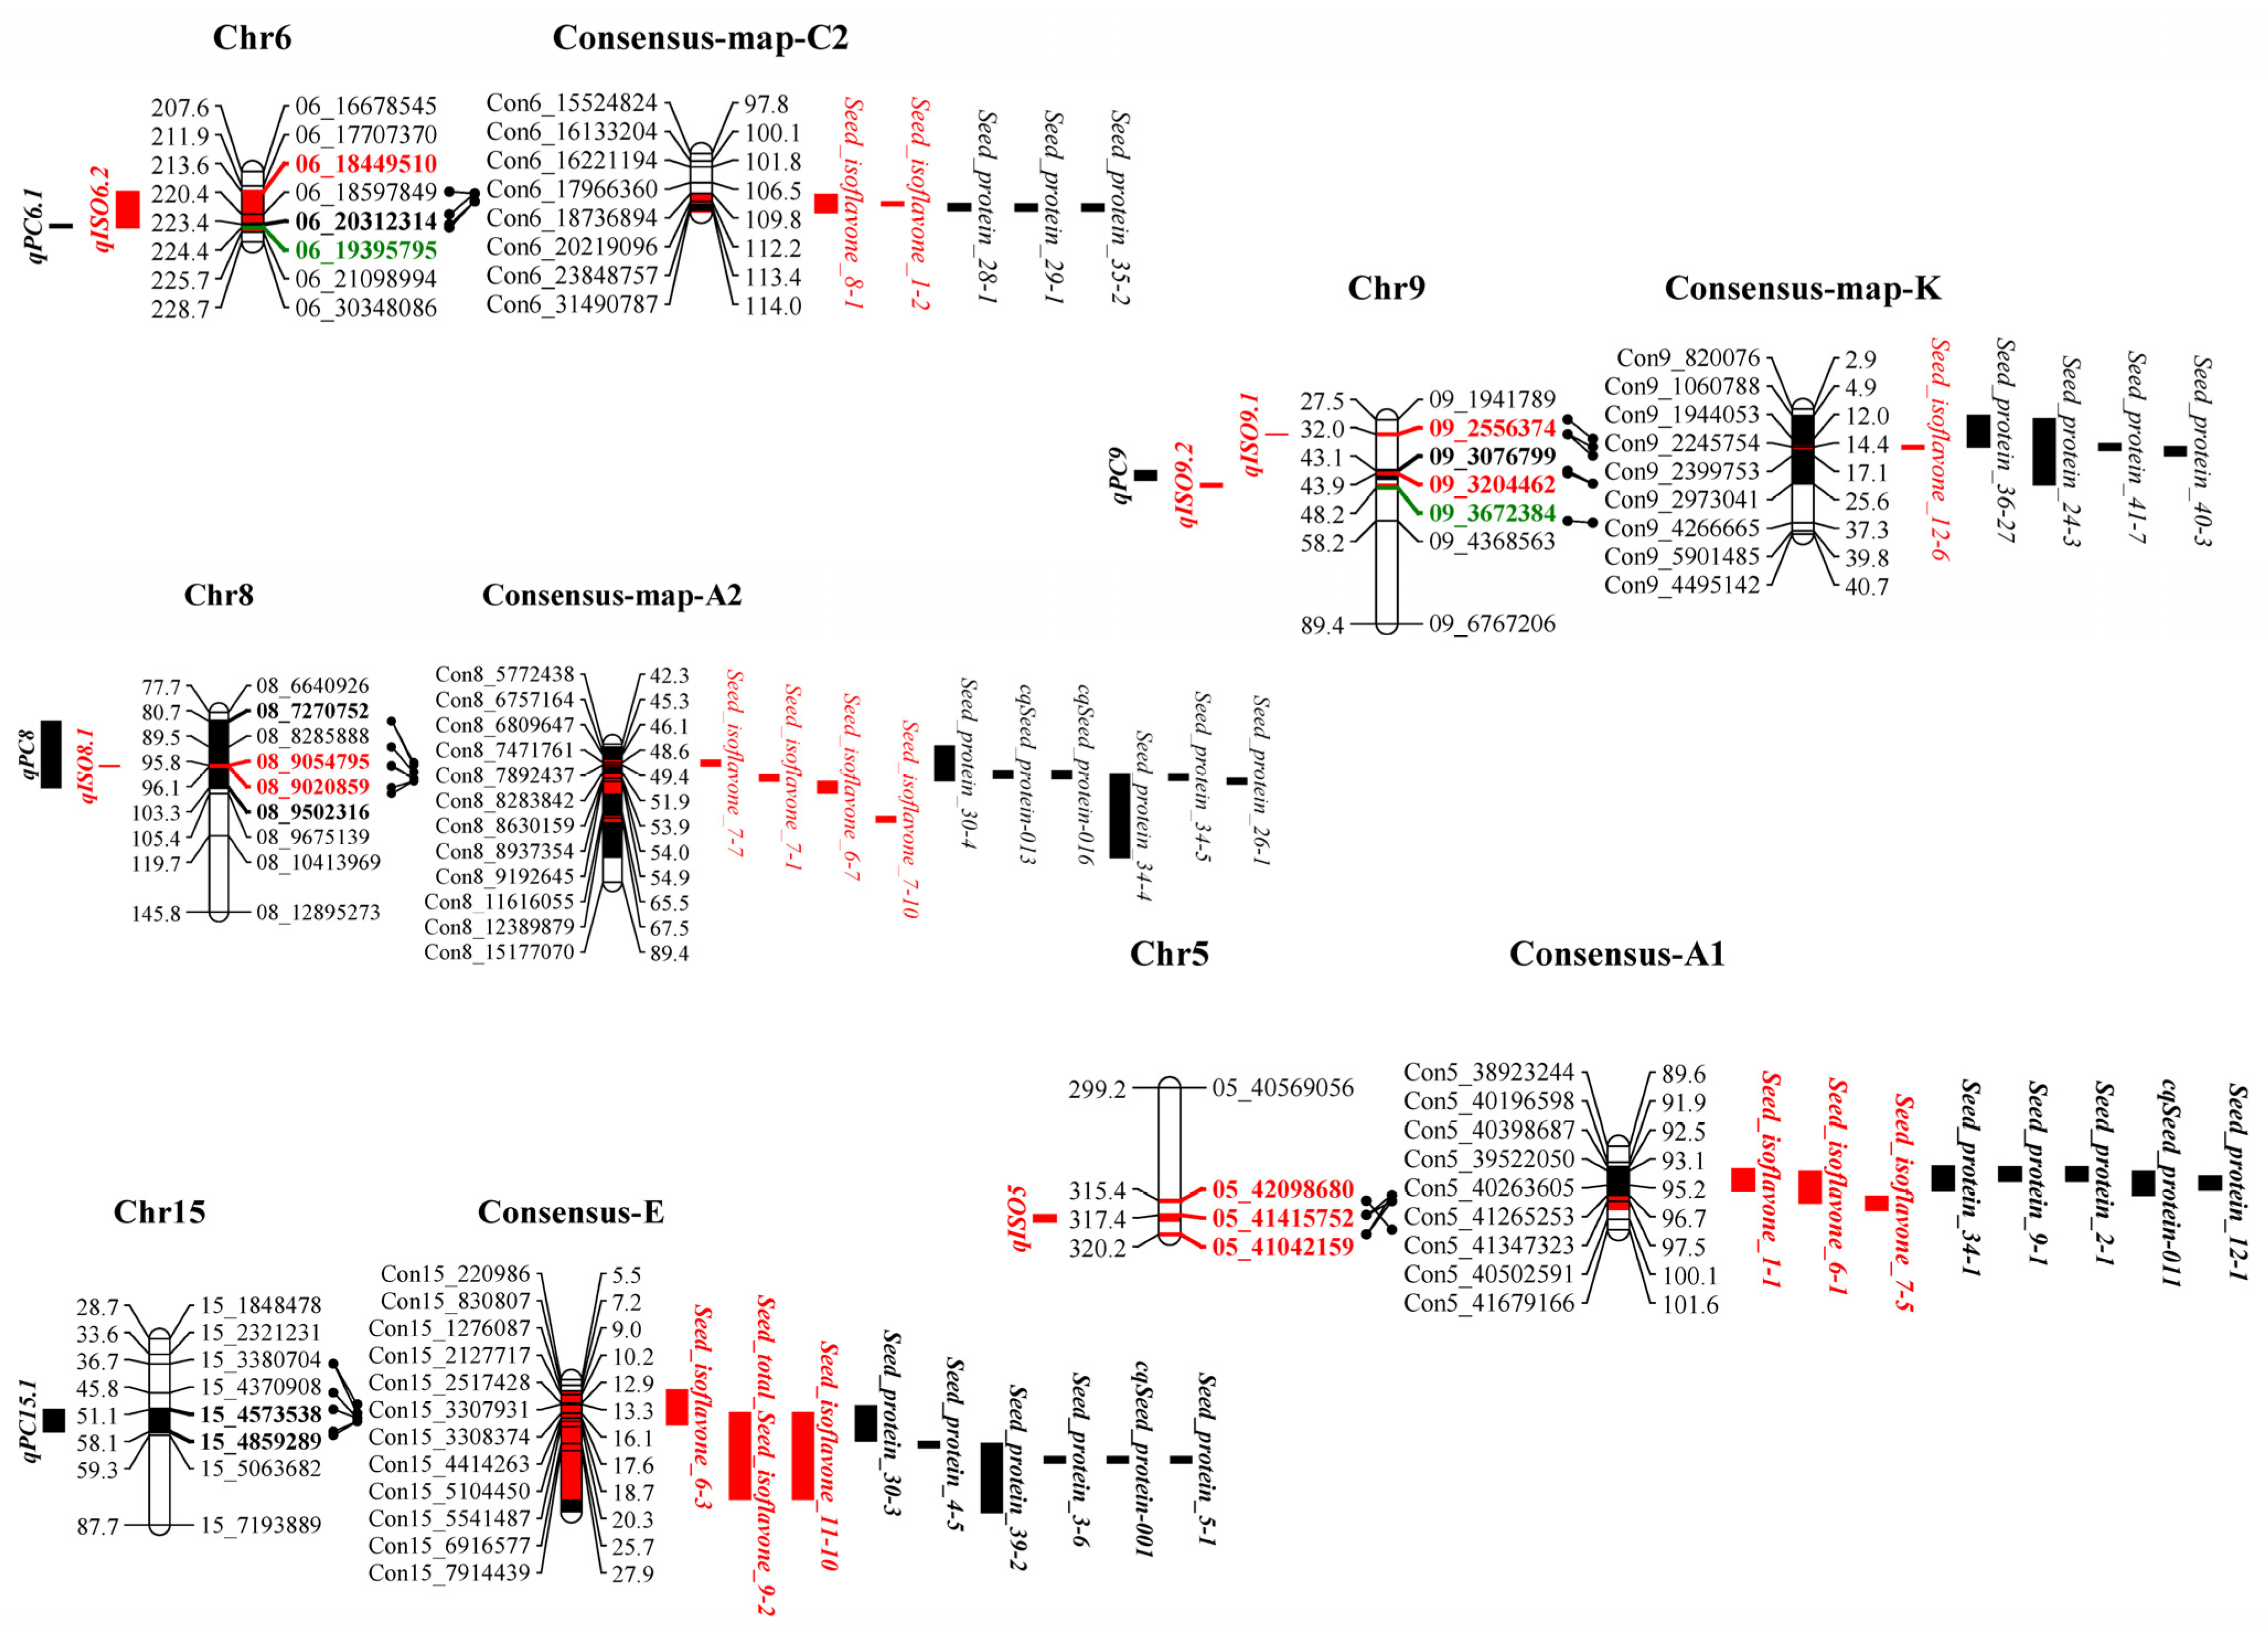
3.6. Colocalization of Isoflavone, Protein and Oil Seed Content Loci in Soybean

In this study, three overlapping regions of colocalizing protein and isoflavone QTLs were found on chromosomes 6, 8 and 9. Among them, qISO6.2 colocated with qPC6.1 and qISO8.1 colocated with qPC8, while both qISO9.1 and qISO9.2 colocated with qPC9 (Figure 4). JD12 provided alleles for increasing protein and decreasing isoflavone contents on colocalized fragments of chromosome 6, along with alleles for decreasing protein and increasing isoflavone contents on colocalized fragments of chromosomes 8 and 9 (Table 2 and Table 4). This was consistent with the overall negative correlation between isoflavone and protein contents observed throughout this study (Figure 2).
Unsurprisingly, within colocalized segments in this study, markers of previously reported protein and isoflavone QTLs were found. On chromosome 6, the region of colocalizing isoflavone and protein loci identified in this study was also near to the previously identified isoflavone loci Seed isoflavone 1-2 [15] and Seed isoflavone 8-1 [35], as well as the protein loci Seed protein 28-1 [16], Seed protein 29-1 [57] and Seed protein 35-2 [59]. On chromosome 8, the colocalization region found in this study was close to the previously reported isoflavone loci Seed isoflavone 7-1, Seed isoflavone 7-7, Seed isoflavone 7-10 [36] and Seed isoflavone 6-7 [11], along with the protein loci Seed protein 30-4 [63], cqSeed protein 013, cqSeed protein 016 [64], Seed protein 34-4, Seed protein34-5 [65] and Seed protein 26-1 [58]. On chromosome 9, the region of colocalization defined in this study was near to the previously identified isoflavone locus Seed isoflavone 12-6 [32] and the previously identified protein loci Seed protein 36-27 [66], Seed protein 24-3 [62], Seed protein 41-7 [68] and Seed protein 40-3 [67] (Figure 3, Table S4). We also conducted a joint QTL mapping analysis (multi-trait analysis) for seed protein and isoflavone content using Cartographer software. The peaks of the red and black curves overlapped on chromosomes 6 and 8 in 2020 and 2021 and overlapped on chromosome 9 in 2020 (Figure 5), which is consistent with the results shown in Figure 4.
More interestingly, previously identified isoflavone and protein loci colocalized in the vicinity of the main isoflavone and protein loci identified in this study. Proximal to qISO5 lay the previously identified isoflavone loci Seed isoflavone 1-1 [15], Seed isoflavone 6-1 [11] and Seed isoflavone7-5 [36], as well as the previously identified protein loci Seed protein 34-1 [65], Seed protein 9-1 [82], Seed protein 2-1 [83], cqSeed protein 011 [64] and Seed protein 12-1 [80]. Meanwhile, the region near qPC15.1 contains the previously identified isoflavone loci Seed isoflavone 6-3 [11], Seed isoflavone 9-2 [55] and Seed isoflavone11-10 [14], along with the protein loci Seed protein 30-3 [63], Seed protein 4-5 [73], Seed protein 39-2 [74], Seed protein 3-6, cqSeed protein 001 [64] and Seed protein 5-1 [73] (Figure 4). Consensus markers and corresponding physical distances are shown in Table S4. All of the results taken together demonstrate clearly that soybean isoflavone and protein production are coordinately inherited, which could be useful for efficiently improving soybean isoflavone content in conjunction with protein or oil content.

3.7. Effect of Combination of Isoflavone Loci on Isoflavone and Protein/Oil Content

Two major favorable loci, including qISO5 mainly for Ds and Gs and qISO6.2 mainly for GLs, were selected for further analysis concerning the effects of combining isoflavone loci on isoflavone, protein and oil content. The progeny without favorable loci (N group) had significantly lower isoflavone contents than the progeny with favorable loci, and qISO5 (q5 group) had more additive effects than qISO6.2 (q6.2 group). Progeny carrying both qISO5 and qISO6.2 (q5q6.2 group) had the highest isoflavone concentrations, suggesting that the two loci had cumulative effects on isoflavone content. More progeny with high protein contents (pink dots) were scattered among N and q5 group members, while more lines with high oil contents (round dots) were scattered in the q6.2 and q5q6.2 groups. This leads to speculation that breeding soybeans for high isoflavone and high oil content might be simpler than breeding soybeans for high isoflavone and high protein content, which is consistent with the rest of the results presented here, according to which isoflavone content is negatively correlated with protein content and weakly positively correlated with oil content (Figure 2). We also found that some lines rich in protein were scattered among other members in the q5q6.2 group, implying that it may be possible to breed high isoflavone and high protein contents in targeted soybean breeding efforts (Figure 6).

4. Discussion

Increasing requirements for healthy nutrition driven by improvements in living standards have resulted in increasing demands for agricultural products from crops such as soybean to provide combinations of optimal protein and oil content. Furthermore, soybean seeds may also contain high isoflavone contents, which compounds are associated with various health-beneficial functions, such as decreasing risks for cancer and several chronic diseases [6,7,8,9]. Therefore, there are current and pressing needs to develop elite soybean cultivars yielding high isoflavone contents in combination with high protein or oil contents in modern soybean breeding programs.
The importance of optimizing protein, oil and isoflavone content in soybean has long been recognized and studied using quantitative trait locus methods. However, understanding the relationships between isoflavone, protein and oil production in soybean remains limited. Here, relationships between seed isoflavone, protein and oil contents were studied using QTLs associated with the production of isoflavones, proteins and oils over two years of field trials. The h2b of isoflavone content in these trials was 0.81 (Table 1), corresponding to high heritability, as previously reported [11,12]. While genetic variation in isoflavone production exists in soybean, environmental impacts are also known to affect seed isoflavone concentrations [84,85,86]. Thus, it is not surprising that 11 out of 25 loci, including 5 previously reported loci [11,32,34,36], were only detected in one year, while 6 novel loci were also identified and named qISO2.2, qISO3, qISO10.1, qISO10.2, qISO19.1 and qISO20 (Table 2). On the other hand, 14 out of 25 loci, including 10 previously reported loci [11,14,15,32,35,36,55], were detected in both years of trials (Table 2), leaving 4 significant loci named qISO1, qISO6.1, qISO6.3 and qISO6.4 that are not yet registered in the corresponding composite map on www.soybase.org. Interestingly, we found that the gene Glyma.01g172900 on chromosome 1 (51020047–51025420) near qISO1 (51600690–54799844) (Table 2) is predicted as an isoflavone reductase-like protein, which might be the gene on the qISO1 locus controlling isoflavone content. Reconfirming QTLs in multiple trials suggests that not only are the regions associated with isoflavone production detected in this study reliable, but also that novel stable QTLs might be detected in different populations.
Previously, a major QTL at the lower end of chromosome 5 was detected in five different populations [11,15,32,33,36,84], which was narrowed down to a 611.4 kb fragment on chromosome 5 located between bp positions 38434171 and 39045620 in the G. max Wm82.a1 reference genome [32]. In this study, we also detected a major QTL labelled qTIF5 in a 373.6 kb fragment on chromosome 5 between bp positions 41042159 and 41415752 that explains 16.1 %−22.1% of the variation in isoflavone content observed over the two years of the field trials. Near this fragment, the QTLs qD5, qMD5, qDs5, qG5, qMG5, qGs5, qGL5, qMGL5 and qGLs5 have also been found, suggesting that this region might control production of multiple individual isoflavones (Table 4), which is consistent with previous reports [11,32,84].
Glycitein derivative isoflavones had relatively low correlation coefficients with other isoflavones in this study, which is consistent with previous reports [10,13,15] and suggests that Ds and Gs might be produced via similar metabolic pathways that share metabolic enzymes, while GLs might be produced via another, more isolated metabolic pathway that shares few metabolic enzymes with the other isoflavone pathways [87]. This implies that GL production might involve novel genes or loci.
In this study, we fine-mapped the locus labelled qISO6.2, which is located in a 946.3 kb fragment on chromosome 6 between bp positions 18449510 and 19395795. In this region, higher PVE (average value: 23.4% versus 9.5%) and LOD (average value: 10.59 versus 3.4) values were observed in the qGLs6.2 and qMGL6.2 fragments than in qTIF6.2, suggesting that qISO6.2 mainly controls the content of GLs. A locus was found to be related to GL production with an associated LOD value of 4.2 near BARC-031337-07051 (physical position: 16679945) on chromosome 6 using 480 SNP markers [35]. In our study, the loci detected on chromosome 6 had higher LOD values than those reported in previous studies, which is more conducive to cloning genes and marker assistant selection (MAS).
A total of 15 integrated QTLs of protein and oil were detected, all of them detected in both years of trials and largely consistent with those identified in previous studies (Table 4). The major locus qPC20.3 fell between 32.38 Mb and 33.29 Mb on chromosome 20, which is near the previously cloned gene Glyma.20g085100 that is present at the physical location of 31.77 Mb on chromosome 20 [29]. In addition, the major locus qOC15.1 was found to lie between 2.32 Mb and 4.37 Mb on chromosome 15, which is near GmSWEET39 (Glyma.15g049200), at about 3.87 Mb on chromosome 15 [88]. These results indicate that the high-density map produced herein accurately localized associated genes in the regions of significant QTLs (Table 4 and Table S3).
Three out of thirteen loci associated with protein content colocalized with isoflavone loci in three linkage groups (chromosomes 6, 8, and 9) were analyzed using MapQTL and QTL Cartographer software (Figure 4 and Figure 5). In these colocalized segments, the additive effects on isoflavone and protein content appeared to act in opposition. For example, the additive effects of qISO6.2 on protein content were negative, with a minimum ADD value of −515.976, while the qPC6.1 locus located in the same segment made a positive contribution, with a maximum ADD value of 1.13 (Tables S2 and S3). This may be the reason that soybean isoflavone contents are significantly and negatively correlated with protein contents (−0.36 ***), which is also consistent with previous reports [14,15,16].
The phenotypic correlation between traits may be due to the proximity of genes in linkage groups or gene pleiotropy [89]. To verify that the observed phenotypic correlation was caused by colocalization, the 2020 data were analyzed for the effects of eliminating three colocalized segments. In this permutation, the correlation between protein and isoflavone content decreased (−0.12) and became insignificant (Figure S7), further demonstrating that the observed correlations are due to colocalization. Furthermore, previously mapped isoflavone and protein loci were found in all three eliminated segments (Figure 4). Although only one major isoflavone locus (qISO5) was located on chromosome 5 in this study, both isoflavone and protein loci have been found on the same fragment in previous studies (Figure 4). Furthermore, it was found that the additive effects of this fragment on isoflavone content were the opposite of those on protein content [15]. Similarly, while only one major protein locus was detected on chromosome 15 in this study, both protein and isoflavone loci have been previously mapped to the same region (Figure 4). These results strongly imply that isoflavone and protein content in seeds may be coordinately inherited through colocalization of impactful loci in the soybean genome.
Isoflavone production may be inversely correlated with protein content largely due to colocalization of protein and isoflavone loci. However, some loci, such as qPC15.1 and qISO5, are thought to control only protein or isoflavone content, so it might yet be possible to breed soybean cultivars rich in both isoflavones and proteins or oils. No favorable isoflavone loci were found to aggregate with high-protein loci in this study (Figure 6), though there was sufficient segregation to imply that it might be possible to breed soybean for both high levels of isoflavones and protein. For example, when qISO5 and qISO6.2 were combined, some progeny lines contained high levels of both isoflavones and protein. In contrast, in certain situations, such as in providing infant nutrition, there may be a requirement for low-isoflavone cultivars [90,91]. In this study, we clarified the genetic foundation underlying protein, oil and isoflavone production, which can be further explored for combinations that produce optimal contents of isoflavones, proteins and oils for a variety of uses.
In summary, the studies conducted and presented herein identified and localized stable and major QTLs for soybean isoflavone, protein and oil production in a high-density genetic map. Some of the loci were consistent with previous studies, while other novel isoflavone-related loci were first described here. Consistency with previous results, significant correlations and the impacts of eliminating significant loci from analysis all demonstrate the accuracy and novelty of the results. Additionally, loci for isoflavone and protein production were mapped to colocalized regions, which further demonstrated that correlations observed between isoflavone and protein contents in soybean seeds were likely produced through coordinated inheritance of linked loci rather than gene pleiotropy. On the whole, these results provide a theoretical basis for coordinated improvement of both isoflavone and protein quality in future soybean breeding efforts.

Supplementary Materials

The following supporting information can be downloaded at: https://www.mdpi.com/article/10.3390/agriculture12081178/s1, Figure S1: Correlation analysis among isoflavone, protein and oil traits in 2020; Figure S2: Correlation analysis among isoflavone, protein and oil traits in 2021; Figure S3: Correlation analysis among individual isoflavones and protein/oil traits; Figure S4: Correlation analysis among individual isoflavones and protein/oil traits in 2020; Figure S5: Correlation analysis among individual isoflavones and quality traits in 2021; Figure S6: Twenty linkage of the soybean high-density genetic map; Figuer S7: Correlation analysis among isoflavone, protein and oil traits eliminated the effect of co-location fragment on chromosome 6, 8 and 9 on them in 2020; Table S1: Profile of linkage map constructed by SNPs in RILs population; Table S2: Putative QTLs for soybean isoflavone traits detected in a population of contrasting soybean parents and 185 RILs reared under field conditions; Table S3: Putative QTLs for soybean protein and oil content detected in a population of contrasting soybean parents and 185 RILs; Table S4: QTLs of Seed protein and isoflavone and markers near them with physical location from Gm-composite map on soybase which co-localized with identified QTLs for seed isoflavone and seed protein in this study.

Author Contributions

Conceptualization, Q.Z. and H.L.; methodology, Y.L.; software, Q.Z.; validation, X.L., H.L. and M.Z.; formal analysis, Q.Z. and J.Q.; investigation, B.L., Q.Y., S.L., X.Z. and N.M.; resources, L.Y. and C.Y.; data curation, J.Q., B.L. and S.L.; writing—original draft preparation, Q.Z.; writing—review and editing, X.L., M.Z. and H.L.; visualization, Q.Z.; supervision, H.L.; project administration, C.Y.; funding acquisition, Q.Z., C.Y., H.L. and L.Y. All authors have read and agreed to the published version of the manuscript.

Funding

This work was jointly supported by the National Natural Science Foundation of China: 31830083, 31871652; the China Agriculture Research System of MOF and MARA: CARS-04-PS06; the Ministry of Science and Technology of China: 2021YFD1201605; and Innovative Research Groups of the Natural Science Foundation of Hebei Province: C2020301020.

Data Availability Statement

The raw data supporting the conclusions of this article will be made available by the authors without undue reservation.

Acknowledgments

We would like to acknowledge Baofeng Cui and Gaoming Lin of the Root Biology Center, Fujian Agriculture and Forestry University, for pretreatment of soybean samples; staff members at the Institute of Cereal and Oil Crops, Hebei Academy of Agricultural and Forestry Sciences, for planting and harvesting of RILs; Xiaodong Tang for HPLC support and debugging; Shengrui Zhang of the Chinese Academy of Agricultural Sciences for providing the isoflavone standards; and Thomas Walk of Golden Fidelity LLC for critically reviewing the manuscript.

Conflicts of Interest

The authors declare no conflict of interest.

References

  1. American Soybean Association. 2021 SoyStats. 2021. Available online: https://soygrowers.com/wp-content/uploads/2021/07/2021-Soy-Stats-WEB.pdf. (accessed on 10 May 2022).
  2. Li, X.H.; Shao, Z.Q.; Tian, R.; Zhang, H.; Du, H.; Kong, Y.B.; Li, W.L.; Zhang, C.Y. Mining QTLs and candidate genes for seed protein and oil contents across multiple environments and backgrounds in soybean. Mol. Breed. 2019, 39, 139. [Google Scholar] [CrossRef]
  3. Subramanian, S.; Graham, M.Y.; Yu, O.; Graham, T.L. RNA interference of soybean isoflavone synthase genes leads to silencing in tissues distal to the transformation site and to enhanced susceptibility to Phytophthora sojae. Plant. Physiol. 2005, 137, 1345–1353. [Google Scholar] [CrossRef] [Green Version]
  4. Wu, D.P.; Li, D.M.; Zhao, X.; Zhan, Y.H.; Teng, W.L.; Qiu, L.J.; Zheng, H.K.; Li, W.B.; Han, Y.P. Identification of a candidate gene associated with isoflavone content in soybean seeds using genome-wide association and linkage mapping. Plant J. 2020, 104, 950–963. [Google Scholar] [CrossRef] [PubMed]
  5. Carter, A.; Tenuta, A.; Rajcan, I.; Welacky, T.; Woodrow, L.; Eskandari, M. Identification of quantitative trait loci for seed isoflavone concentration in soybean (Glycine max) against soybean cyst nematode stress. Plant. Breed. 2018, 137, 721–729. [Google Scholar] [CrossRef]
  6. Ferrari, S.M.; Antonelli, A.; Guidi, P.; Bernardeschi, M.; Scarcelli, V.; Fallahi, P.; Frenzilli, G. Genotoxicity evaluation of the soybean isoflavone genistein in human papillary thyroid cancer cells. Study of its potential use in thyroid cancer therapy. Nutr. Cancer 2019, 71, 1335–1344. [Google Scholar] [CrossRef] [PubMed]
  7. Gleason, C.E.; Fischer, B.L.; Dowling, N.M.; Setchell, K.D.; Atwood, C.S.; Carlsson, C.M.; Asthana, S. Cognitive effects of soy isoflavones in patients with Alzheimer’s disease. J. Alzheimer’s Dis. 2015, 47, 1009–1019. [Google Scholar] [CrossRef] [PubMed] [Green Version]
  8. Yoshikata, R.; Myint, K.Z.; Ohta, H. Relationship between equol producer status and metabolic parameters in 743 Japanese women: Equol producer status is associated with antiatherosclerotic conditions in women around menopause and early postmenopause. Menopause 2017, 24, 216–224. [Google Scholar] [CrossRef] [PubMed]
  9. Gonzalez, N.; Garrido, A.; Acevedo, I.; Valladares, L. In vitro effect of soy isoflavone and equol on soluble CD40L release stimulated by ristocetin in platelets from postmenopause women. J. Biomed. Sci. Eng. 2015, 8, 24. [Google Scholar] [CrossRef] [Green Version]
  10. Azam, M.; Zhang, S.R.; Abdelghany, A.M.; Shaibu, A.S.; Feng, Y.; Li, Y.F.; Tian, Y.; Hong, H.L.; Li, B.; Sun, J.M. Seed isoflavone profiling of 1168 soybean accessions from major growing ecoregions in China. Food Res. Int. 2020, 130, 108957. [Google Scholar] [CrossRef]
  11. Gutierrez-Gonzalez, J.J.; Wu, X.L.; Zhang, J.; Lee, J.D.; Ellersieck, M.; Shannon, J.G.; Yu, O.; Nguyen, H.T.; Sleper, D.A. Genetic control of soybean seed isoflavone content: Importance of statistical model and epistasis in complex traits. Theor. Appl. Genet. 2009, 119, 1069–1083. [Google Scholar] [CrossRef] [Green Version]
  12. Pei, R.L.; Zhang, J.Y.; Tian, L.; Zhang, S.R.; Han, F.X.; Yan, S.R.; Wang, L.Z.; Li, B.; Sun, J.M. Identification of novel QTL associated with soybean isoflavone content. Crop. J. 2018, 6, 244–252. [Google Scholar] [CrossRef]
  13. Knizia, D.; Yuan, J.; Bellaloui, N.; Vuong, T.; Usovsky, M.; Song, Q.; Betts, F.; Register, T.; Williams, E.; Lakhssassi, N. The soybean high density ‘forrest’ by ‘williams 82’ snp-based genetic linkage map identifies QTL and candidate genes for seed isoflavone content. Plants 2021, 10, 2029. [Google Scholar] [CrossRef] [PubMed]
  14. Han, Y.P.; Teng, W.L.; Wang, Y.; Zhao, X.; Wu, L.; Li, D.M.; Li, W.B. Unconditional and conditional QTL underlying the genetic interrelationships between soybean seed isoflavone, and protein or oil contents. Plant. Breed. 2015, 134, 300–309. [Google Scholar] [CrossRef]
  15. Primomo, V.S.; Poysa, V.; Ablett, G.R.; Jackson, C.J.; Gijzen, M.; Rajcan, I. Mapping QTL for individual and total isoflavone content in soybean seeds. Crop. Sci. 2005, 45, 2454–2464. [Google Scholar] [CrossRef]
  16. Liang, H.Z.; Yu, Y.L.; Wang, S.F.; Lian, Y.; Wang, T.F.; Wei, Y.L.; Gong, P.T.; Liu, X.Y.; Fang, X.J.; Zhang, M.C. QTL mapping of isoflavone, oil and protein contents in soybean (Glycine max L. Merr.). Agric. Sci. China 2010, 9, 1108–1116. [Google Scholar] [CrossRef]
  17. Oliveira, M.I.P.; Piovesan, N.D.; Jose, I.C.; Barros, E.G.; Moreira, M.A.; Oliveira, L.O. Protein, oil, and isoflavone contents in lipoxygenase- and kunitz trypsin inhibitor-deficient soybean seeds. Chromatographia 2007, 66, 521–527. [Google Scholar] [CrossRef]
  18. Wan, X.Y.; Wan, J.M.; Jiang, L.; Wang, J.K.; Zhai, H.Q.; Weng, J.F.; Wang, H.L.; Lei, C.L.; Wang, J.L.; Zhang, X. QTL analysis for rice grain length and fine mapping of an identified QTL with stable and major effects. Theor. Appl. Genet. 2006, 112, 1258–1270. [Google Scholar] [CrossRef]
  19. Zhao, D.D.; Park, J.R.; Jang, Y.H.; Kim, E.G.; Du, X.X.; Farooq, M.; Yun, B.J.; Kim, K.M. Identification of one major QTL and a novel gene OsIAA17q5 associated with tiller number in rice using QTl analysis. Plants 2022, 11, 538. [Google Scholar] [CrossRef]
  20. Palanichamy, D.; Smith, M. QTL mapping and colocalization analysis reveal novel candidate genes for multiple disease resistance in maize. Crop. Sci. 2022, 62, 624–636. [Google Scholar] [CrossRef]
  21. Li, P.; Zhang, Y.; Yin, S.; Zhu, P.; Pan, T.; Xu, Y.; Wang, J.; Hao, D.; Fang, H.; Xu, C. QTL-by-environment interaction in the response of maize root and shoot traits to different water regimes. Front. Plant. Sci. 2018, 9, 229. [Google Scholar] [CrossRef] [Green Version]
  22. Alahmad, S.; El Hassouni, K.; Bassi, F.M.; Dinglasan, E.; Youssef, C.; Quarry, G.; Aksoy, A.; Mazzucotelli, E.; Juhasz, A.; Able, J.A.; et al. A major root architecture QTL responding to water limitation in durum wheat. Front. Plant. Sci. 2019, 10, 436. [Google Scholar] [CrossRef] [Green Version]
  23. Hu, J.M.; Wang, X.Q.; Zhang, G.X.; Jiang, P.; Chen, W.Y.; Hao, Y.C.; Ma, X.; Xu, S.S.; Jia, J.Z.; Kong, L.R. QTL mapping for yield-related traits in wheat based on four RIL populations. Theor. Appl. Genet. 2020, 133, 917–933. [Google Scholar] [CrossRef]
  24. Dachapak, S.; Tomooka, N.; Somta, P.; Naito, K.; Kaga, A.; Srinives, P. QTL analysis of domestication syndrome in zombi pea (vigna vexillata), an underutilized legume crop. PLoS ONE 2018, 13, e0200116. [Google Scholar] [CrossRef] [Green Version]
  25. Jha, U.C.; Kole, P.C.; Singh, N.P. QTL mapping for heat stress tolerance in chickpea (Cicer arietinum L.). Legume Res. 2021, 44, 382–387. [Google Scholar] [CrossRef] [Green Version]
  26. Murphy, S.E.; Lee, E.A.; Woodrow, L.; Seguin, P.; Ablett, G.R. Genotype × environment interaction and stability for isoflavone content in soybean. Crop. Sci. 2009, 49, 1313–1321. [Google Scholar] [CrossRef]
  27. Soybase. Available online: https://www.soybase.org/ (accessed on 20 June 2022).
  28. Diers, B.W.; Keim, P.; Fehr, W.; Shoemaker, R. RFLP analysis of soybean seed protein and oil content. Theor. Appl. Genet. 1992, 83, 608–612. [Google Scholar] [CrossRef]
  29. Fliege, C.E.; Ward, R.A.; Vogel, P.; Nguyen, H.; Quach, T.; Guo, M.; Viana, J.P.G.; Santos, L.B.; Specht, J.E.; Clemente, T.E.; et al. Fine mapping and cloning of the major seed protein quantitative trait loci on soybean chromosome 20. Plant J. 2022, 110, 114–128. [Google Scholar] [CrossRef]
  30. Goettel, W.; Zhang, H.; Li, Y.; Qiao, Z.; Jiang, H.; Hou, D.; Song, Q.; Pantalone, V.R.; Song, B.-H.; Yu, D.; et al. POWR1 is a domestication gene pleiotropically regulating seed quality and yield in soybean. Nat. Commun. 2022, 13, 3051. [Google Scholar] [CrossRef]
  31. Njiti, V.N.; Meksem, K.; Yuan, J.; Lightfoot, D.A.; Banz, W.J.; Winters, T.A. DNA markers associated with loci underlying seed phytoestrogen content in soybeans. J. Med. Food 1999, 2, 185–187. [Google Scholar] [CrossRef]
  32. Cai, Z.D.; Cheng, Y.B.; Ma, Z.W.; Liu, X.G.; Ma, Q.B.; Xia, Q.J.; Zhang, G.Y.; Mu, Y.H.; Nian, H. Fine-mapping of QTLs for individual and total isoflavone content in soybean (Glycine max L.) using a high-density genetic map. Theor. Appl. Genet. 2017, 131, 555–568. [Google Scholar] [CrossRef]
  33. Li, X.H.; Kamala, S.; Tian, R.; Du, H.; Li, W.L.; Kong, Y.B.; Zhang, C.Y. Identification and validation of quantitative trait loci controlling seed isoflavone content across multiple environments and backgrounds in soybean. Mol. Breed. 2018, 38, 8. [Google Scholar] [CrossRef]
  34. Gutierrez-Gonzalez, J.J.; Vuong, T.D.; Zhong, R.; Yu, O.; Lee, J.D.; Shannon, G.; Ellersieck, M.; Nguyen, H.T.; Sleper, D.A. Major locus and other novel additive and epistatic loci involved in modulation of isoflavone concentration in soybean seeds. Theor. Appl. Genet. 2011, 123, 1375–1385. [Google Scholar] [CrossRef] [PubMed]
  35. Smallwood, C.J. Detection of Quantitative Trait Loci for Marker-Assisted Selection of Soybean Isoflavone Genistein; The University of Tennessee: Knoxville, TN, USA, 2012. [Google Scholar]
  36. Yoshikawa, T.; Okumoto, Y.; Ogata, D.; Sayama, T.; Teraishi, M.; Terai, M.; Toda, T.; Yamada, K.; Yagasaki, K.; Yamada, N.; et al. Transgressive segregation of isoflavone contents under the control of four QTLs in a cross between distantly related soybean varieties. Breed. Sci. 2010, 60, 243–254. [Google Scholar] [CrossRef] [Green Version]
  37. Sun, J.M.; Sun, B.L.; Han, F.X.; Yan, S.R.; Yang, H.; Akio, K. Rapid HPLC method for determination of 12 isoflavone components in soybean seeds. Agric. Sci. China 2011, 10, 70–77. [Google Scholar] [CrossRef]
  38. Shiny_HPLC v1.0. Available online: https://github.com/zhaoqingsonga/shiny_HPLC (accessed on 10 May 2022).
  39. Yan, L.; Jiang, C.; Yu, X.; Yang, C.; Zhang, M. Development and reliability of near infrared spectroscopy(NIS) models of protein and oil content in soybean. Soybean Sci. 2008, 27, 5. [Google Scholar]
  40. Jiang, C.Z.; Pei, C.J.; Jing, H.X.; Zhang, M.C.; Wang, T.; Di, R.; Liu, B.Q.; Yan, L. QTL analysis of soybean quality and yield related characters. Acta Agric. Boreali-Sin. 2011, 26, 127–130. [Google Scholar]
  41. Chodak, M.; Niklińska, M.; Beese, F. The Use of near Infrared Spectroscopy to Quantify Lignite-Derived Carbon in Humus-Lignite Mixtures. J. Near Infrared Spectrosc. 2017, 15, 195–200. [Google Scholar] [CrossRef]
  42. Allen, G.C.; Flores-Vergara, M.A.; Krasynanski, S.; Kumar, S.; Thompson, W.F. A modified protocol for rapid DNA isolation from plant tissues using cetyltrimethylammonium bromide. Nat. Protoc. 2006, 1, 2320–2325. [Google Scholar] [CrossRef] [PubMed]
  43. Li, H.; Richard, D. Fast and accurate short read alignment with Burrows–Wheeler transform. Bioinformatics 2009, 25, 1754–1760. [Google Scholar] [CrossRef] [Green Version]
  44. Li, H.; Handsaker, B.; Wysoker, A.; Fennell, T.; Ruan, J.; Homer, N.; Marth, G.; Abecasis, G.; Durbin, R. The sequence alignment/map format and samtools. Bioinformatics 2009, 25, 2078–2079. [Google Scholar] [CrossRef] [Green Version]
  45. Meng, L.; Li, H.H.; Zhang, L.Y.; Wang, J.K. QTL IciMapping: Integrated software for genetic linkage map construction and quantitative trait locus mapping in biparental populations. Crop. J. 2015, 3, 269–283. [Google Scholar] [CrossRef] [Green Version]
  46. Wu, Y.H.; Bhat, P.R.; Close, T.J.; Lonardi, S. Efficient and accurate construction of genetic linkage maps from the minimum spanning tree of a graph. PLoS Genet. 2008, 4, e1000212. [Google Scholar] [CrossRef]
  47. MapQTL6.0. Available online: https://www.kyazma.nl/index.php/MapQTL/ (accessed on 10 May 2022).
  48. QTL Cartographer V2.5_011. Available online: https://brcwebportal.cos.ncsu.edu/qtlcart/WQTLCart.htm (accessed on 10 May 2022).
  49. Voorrips, R. MapChart: Software for the graphical presentation of linkage maps and QTLs. J. Hered. 2002, 93, 77–78. [Google Scholar] [CrossRef] [Green Version]
  50. Ihaka, R.; Gentleman, R. R: A language for data analysis and graphics. J. Comput. Graph. Stat. 1996, 5, 299–314. [Google Scholar]
  51. Revelle, W.; Revelle, M.W. psych: Procedures for personality and psychological research. Compr. R Arch. Netw. 2015, 337, 338. [Google Scholar]
  52. R Package lme4. Available online: https://github.com/lme4 (accessed on 10 May 2022).
  53. Peterson, B.G.; Carl, P.; Boudt, K.; Bennett, R.; Ulrich, J.; Zivot, E.; Cornilly, D.; Hung, E.; Lestel, M.; Balkissoon, K. Package ‘performanceanalytics’. R. Team Coop. 2018, 3, 13–14. [Google Scholar]
  54. Zhou, Z.K.; Jiang, Y.; Wang, Z.; Gou, Z.H.; Lyu, J.; Li, W.I.; Yu, Y.J.; Shu, L.P.; Zhao, Y.J.; Ma, Y.M.; et al. Resequencing 302 wild and cultivated accessions identifies genes related to domestication and improvement in soybean. Nat. Biotechnol. 2015, 33, 408–414. [Google Scholar] [CrossRef] [Green Version]
  55. Wang, Y.; Han, Y.P.; Zhao, X.; Li, Y.G.; Teng, W.L.; Li, D.M.; Zhan, Y.; Li, W.B. Mapping isoflavone QTL with main, epistatic and QTL X environment effects in recombinant inbred lines of soybean. PLoS ONE 2015, 10, e0118447. [Google Scholar] [CrossRef]
  56. Zhang, W.K.; Wang, Y.J.; Luo, G.Z.; Zhang, J.S.; He, C.Y.; Wu, X.L.; Gai, J.Y.; Chen, S.Y. QTL mapping of ten agronomic traits on the soybean (Glycine max L. Merr.) genetic map and their association with EST markers. Theor. Appl. Genet. 2004, 108, 1131–1139. [Google Scholar] [CrossRef]
  57. Palomeque, L.; Liu, L.J.; Li, W.; Hedges, B.; Cober, E.R.; Rajcan, I. QTL in mega-environments: II. Agronomic trait QTL co-localized with seed yield QTL detected in a population derived from a cross of high-yielding adapted × high-yielding exotic soybean lines. Theor. Appl. Genet. 2009, 119, 429–436. [Google Scholar] [CrossRef]
  58. Reinprecht, Y.; Poysa, V.W.; Yu, K.F.; Rajcan, I.; Ablett, G.R.; Pauls, K.P. Seed and agronomic QTL in low linolenic acid, lipoxygenase-free soybean (Glycine max (L.) Merrill) germplasm. Genome 2006, 49, 1510–1527. [Google Scholar] [CrossRef]
  59. Rossi, M.E.; Orf, J.H.; Liu, L.J.; Dong, Z.; Rajcan, I. Genetic basis of soybean adaptation to North American vs. Asian mega-environments in two independent populations from Canadian × Chinese crosses. Theor. Appl. Genet. 2013, 126, 1809–1823. [Google Scholar] [CrossRef]
  60. Qi, Z.M.; Han, X.; Sun, Y.N.; Wu, Q.; Shan, D.P.; Du, X.Y.; Liu, C.Y.; Jiang, H.W.; Hu, G.H.; Chen, Q.S. An integrated quantitative trait locus map of oil content in soybean, Glycine max (L.) Merr., generated using a meta-analysis method for mining genes. Agric. Sci. China 2011, 10, 1681–1692. [Google Scholar] [CrossRef]
  61. Qi, Z.M.; Wu, Q.; Han, X.; Sun, Y.N.; Du, X.Y.; Liu, C.Y.; Jiang, H.W.; Hu, G.H.; Chen, Q.S. Soybean oil content QTL mapping and integrating with meta-analysis method for mining genes. Euphytica 2011, 179, 499–514. [Google Scholar] [CrossRef]
  62. Hyten, D.L.; Pantalone, V.R.; Sams, C.E.; Saxton, A.M.; Landau-Ellis, D.; Stefaniak, T.R.; Schmidt, M.E. Seed quality QTL in a prominent soybean population. Theor. Appl. Genet. 2004, 109, 552–561. [Google Scholar] [CrossRef]
  63. Teuku, T.; Satoshi, W.; Naoki, Y.; Kyuya, H. Analysis of quantitative trait loci for protein and lipid contents in soybean seeds using recombinant inbred lines. Breed. Sci. (Jpn.) 2003, 53, 133–140. [Google Scholar]
  64. Pathan, S.M.; Vuong, T.; Clark, K.; Lee, J.D.; Shannon, J.G.; Roberts, C.A.; Ellersieck, M.R.; Burton, J.W.; Cregan, P.B.; Hyten, D.L.; et al. Genetic mapping and confirmation of quantitative trait loci for seed protein and oil contents and seed weight in soybean. Crop. Sci. 2013, 53, 765–774. [Google Scholar] [CrossRef] [Green Version]
  65. Lu, W.; Wen, Z.; Li, H.; Yuan, D.; Li, J.; Zhang, H.; Huang, Z.; Cui, S.; Du, W. Identification of the quantitative trait loci (QTL) underlying water soluble protein content in soybean. Theor. Appl. Genet. 2013, 126, 425–433. [Google Scholar] [CrossRef]
  66. Mao, T.T.; Jiang, Z.F.; Han, Y.P.; Teng, W.L.; Zhao, X.; Li, W.B. Identification of quantitative trait loci underlying seed protein and oil contents of soybean across multi-genetic backgrounds and environments. Plant. Breed. 2013, 132, 630–641. [Google Scholar] [CrossRef]
  67. Qi, Z.M.; Hou, M.; Han, X.; Liu, C.Y.; Jiang, H.W.; Xin, D.W.; Hu, G.H.; Chen, Q.S.; Singh, R. Identification of quantitative trait loci (QTLs) for seed protein concentration in soybean and analysis for additive effects and epistatic effects of QTLs under multiple environments. Plant. Breed. 2014, 133, 499–507. [Google Scholar] [CrossRef]
  68. Jun, T.H.; Van, K.; Kim, M.Y.; Lee, S.H.; Walker, D.R. Association analysis using SSR markers to find QTL for seed protein content in soybean. Euphytica 2007, 162, 179–191. [Google Scholar] [CrossRef]
  69. Gai, J.Y.; Wang, Y.J.; Wu, X.L.; Chen, S.Y. A comparative study on segregation analysis and QTL mapping of quantitative traits in plants-with a case in soybean. Front. Agric. China 2007, 1, 1–7. [Google Scholar] [CrossRef]
  70. Wang, X.Z.; Jiang, G.L.; Green, M.; Scott, R.A.; Hyten, D.L.; Cregan, P.B. Quantitative trait locus analysis of saturated fatty acids in a population of recombinant inbred lines of soybean. Mol. Breed. 2012, 30, 1163–1179. [Google Scholar] [CrossRef] [Green Version]
  71. Shibata, M.; Takayama, K.; Ujiie, A.; Yamada, T.; Abe, J.; Kitamura, K. Genetic relationship between lipid content and linolenic acid concentration in soybean seeds. Breed. Sci. 2008, 58, 361–366. [Google Scholar] [CrossRef] [Green Version]
  72. Fasoula, V.A.; Harris, D.K.; Roger, B.H. Validation and designation of quantitative trait loci for seed protein, seed oil, and seed weight from two soybean populations. Crop. Sci. 2004, 44, 1218–1225. [Google Scholar] [CrossRef]
  73. Lee, S.H.; Bailey, M.A.; Mian, M.A.R.; Carter, T.E.; Shipe, E.R.; Ashley, D.A.; Parrott, W.A.; Hussey, R.S.; Boerma, H.R. RFLP loci associated with soybean seed protein and oil content across populations and locations. Theor. Appl. Genet. 1996, 93, 649–657. [Google Scholar] [CrossRef]
  74. Warrington, C.V.; Abdel-Haleem, H.; Hyten, D.L.; Cregan, P.B.; Orf, J.H.; Killam, A.S.; Bajjalieh, N.; Li, Z.; Boerma, H.R. QTL for seed protein and amino acids in the Benning × Danbaekkong soybean population. Theor. Appl. Genet. 2015, 128, 839–850. [Google Scholar] [CrossRef] [Green Version]
  75. Brummer, E.C.; Graef, G.L.; Orf, J.; Wilcox, J.R.; Shoemaker, R.C. Mapping QTL for seed protein and oil content in eight soybean populations. Crop. Sci. 1997, 37, 370–378. [Google Scholar] [CrossRef]
  76. Sebolt, A.M.; Shoemaker, R.C.; Diers, B.W. Analysis of a Quantitative Trait Locus Allele from Wild Soybean That Increases Seed Protein Concentration in Soybean. Crop. Sci. 2000, 40, 1438–1444. [Google Scholar] [CrossRef]
  77. Pandurangan, S.; Pajak, A.; Molnar, S.J.; Cober, E.R.; Dhaubhadel, S.; Hernández-Sebastià, C.; Kaiser, W.M.; Nelson, R.L.; Huber, S.C.; Marsolais, F. Relationship between asparagine metabolism and protein concentration in soybean seed. J. Exp. Bot. 2012, 63, 3173–3184. [Google Scholar] [CrossRef]
  78. Nichols, D.M.; Glover, K.D.; Carlson, S.R.; Specht, J.E.; Diers, B.W. Fine mapping of a seed protein QTL on soybean linkage group I and its correlated effects on agronomic traits. Crop. Sci. 2006, 46, 834–839. [Google Scholar] [CrossRef]
  79. Wang, X.Z.; Jiang, G.L.; Green, M.; Scott, R.A.; Song, Q.; Hyten, D.L.; Cregan, P.B. Identification and validation of quantitative trait loci for seed yield, oil and protein contents in two recombinant inbred line populations of soybean. Mol. Genet. Genom. 2014, 289, 935–949. [Google Scholar] [CrossRef] [PubMed] [Green Version]
  80. Specht, J.E.; Chase, K.; Macrander, M.; Graef, G.L.; Chung, J.; Markwell, J.P.; Germann, M.; Orf, J.H.; Lark, K.G. Soybean response to water: A QTL analysis of drought tolerance. Crop. Sci. 2001, 41, 493–509. [Google Scholar] [CrossRef]
  81. Chung, J.; Babka, H.L.; Graef, G.L.; Staswick, P.E.; Lee, D.J.; Cregan, P.B.; Shoemaker, R.C.; Specht, J.E. The seed protein, oil, and yield QTL on soybean linkage group I. Crop. Sci. 2003, 43, 1053–1067. [Google Scholar] [CrossRef] [Green Version]
  82. Orf, J.H.; Chase, K.; Jarvik, T.; Mansur, L.M.; Lark, K.G. Genetics of soybean agronomic traits: I. Comparison of three related recombinant inbred populations. Crop. Sci. 1999, 39, 1642–1651. [Google Scholar] [CrossRef] [Green Version]
  83. Mansur, L.M.; Orf, J.H.; Chase, K.; Jarvik, T.; Cregan, P.B.; Lark, K.G. Genetic mapping of agronomic traits using recombinant inbred lines of soybean. Crop. Sci. 1996, 36, 1327–1336. [Google Scholar] [CrossRef]
  84. Yang, K.; Moon, J.K.; Jeong, N.; Chun, H.K.; Kang, S.T.; Back, K.; Jeong, S.C. Novel major quantitative trait loci regulating the content of isoflavone in soybean seeds. Genes Genom. 2011, 33, 685–692. [Google Scholar] [CrossRef]
  85. Zhang, H.J.; Li, J.W.; Liu, Y.J.; Jiang, W.Z.; Du, X.L.; Li, L.; Li, X.W.; Su, L.T.; Wang, Q.Y.; Wang, Y. Quantitative trait loci analysis of individual and total isoflavone contents in soybean seeds. J. Genet. 2014, 93, 331–338. [Google Scholar] [CrossRef]
  86. Zeng, G.L.; Li, D.M.; Han, Y.P.; Teng, W.L.; Wang, J.; Qiu, L.Q.; Li, W.B. Identification of QTL underlying isoflavone contents in soybean seeds among multiple environments. Theor. Appl. Genet. 2009, 118, 1455–1463. [Google Scholar] [CrossRef]
  87. Yu, O.; McGonigle, B. Metabolic engineering of isoflavone biosynthesis. Adv. Agron. 2005, 86, 147–190. [Google Scholar]
  88. Miao, L.; Yang, S.N.; Zhang, K.; He, J.B.; Wu, C.H.; Ren, Y.H.; Gai, J.Y.; Li, Y. Natural variation and selection in GmSWEET39 affect soybean seed oil content. New Phytol. 2020, 225, 1651–1666. [Google Scholar] [CrossRef] [PubMed]
  89. Aastveit, A.H.; Aastveit, K. Effects of genotype-environment interactions on genetic correlations. Theor. Appl. Genet. 1993, 86, 1007–1013. [Google Scholar] [CrossRef] [PubMed]
  90. Zhang, J.; Yu, O. Metabolic engineering of isoflavone biosynthesis in seeds. Modif. Seed Compos. Promot. Health Nutr. 2009, 51, 151–176. [Google Scholar]
  91. Yellayi, S.; Naaz, A.; Szewczykowski, M.A.; Sato, T.; Woods, J.A.; Chang, J.; Segre, M.; Allred, C.D.; Helferich, W.G.; Cooke, P.S. The phytoestrogen genistein induces thymic and immune changes: A human health concern? Proc. Natl. Acad. Sci. USA 2002, 99, 7616–7621. [Google Scholar] [CrossRef] [Green Version]
Figure 1. Comparison of quality and isoflavone traits between JD12 and Y9. (A) Photo of JD12 and Y9 seeds. (B) Protein content. (C) Oil content. (D) Content of daidzein isoflavone derivatives (Ds). (E) Content of genistein isoflavone derivatives (Gs). (F) Content of glycitein isoflavone derivatives (GLs). (G) Total isoflavone content (TIF). Bars represent means ± SDs from six replications. Asterisks indicate the significance of differences between JD12 and J9 as determined by the Student’s t-test at a 0.001 (***) significance level.
Agriculture 12 01178 g001
Figure 2. Correlation analysis of isoflavone, protein and oil content. Histograms of trait distributions are located in the diagonal cells. Correlation coefficients with significance levels are presented above the diagonal, while scatter plots with fitted curves are presented below the diagonal. Red asterisks indicate the significance of differences in RILs as determined by the Student’s t-test at 0.05 (*), 0.01 (**) and 0.001 (***) significance levels.
Agriculture 12 01178 g002
Figure 3. Heatmap of candidate genes’ expression levels in specific organs of soybean. The gene name is indicated on the right of the heatmap. Transcript abundance is expressed in standardized log10 fragments per kilobase of exon per million fragments mapped values. Data were obtained from soybase [27].
Agriculture 12 01178 g003
Figure 4. Colocalization of isoflavone and protein loci identified in the current population with loci identified in previous studies. Colors and bold fonts represent identified loci. Red and black blocks represent loci of isoflavone and protein traits, respectively. Projected regions are highlighted in corresponding colors. Bold markers in different colors indicate the boundaries of corresponding loci, with green indicating markers for both the isoflavone and protein traits. The consensus map shows previously identified loci for isoflavone or protein production based on soybase data.
Agriculture 12 01178 g004
Figure 5. Joint QTL mapping analysis for seed protein and isoflavone content on chromosomes 6, 8 and 9 performed using Cartographer software. Different chromosomes are separated by double solid lines; the horizontal line represents the threshold LOD value of 2.5; the red and black curve lines represent LOD values of total isoflavone traits and protein traits, respectively. (A) LOD value distribution in 2020. (B) LOD value distribution in 2021.
Agriculture 12 01178 g005
Figure 6. Effect of combining favorable loci from qISO5 and qISO6.2 on total isoflavone (TIF), protein and oil contents in the RIL population, produced as described in the Materials and Methods section. Letters (A, B, C, D) indicate the significance of differences as determined by Fisher’s LSD method at a 0.01 significance level. Different shapes represent different levels of oil content, and different colors represent different levels of protein content. N represents lines with no tested favorable loci, while q5 and q6.2 represent lines with the favorable loci qISO5 and qISO6.2, respectively. HP and HO denote respective protein and oil contents in excess of the mean values across the RIL population. LP and LO denote respective protein and oil contents below the mean values across the RIL population.
Agriculture 12 01178 g006
Table 1. Phenotypic variation and genetic analysis of isoflavone and quality traits using 185 soybean recombinant inbred lines (RILs).
TraitsYearParentsRILs
JD12Y9MinMaxMeanSDCV%SkewKurth2b
D2020157.71392.2310.95635.36273.69119.8143.780.24−0.520.75
2021106.95417.707.85514.92229.13105.0145.830.30−0.28
MD2020718.081783.3472.742590.861164.66493.1542.340.19−0.620.72
2021699.902095.3395.552385.681254.32414.1933.020.21−0.08
AD202045.24114.643.01174.7783.6634.1840.860.09−0.660.83
2021117.48166.651.27238.03128.9442.3732.86−0.470.21
Ds2020921.032290.21118.593367.061522.02638.1541.930.20−0.630.75
2021924.332679.69268.913080.171612.38533.3433.080.25−0.20
G2020109.83448.7914.18580.52257.63112.8143.790.19−0.440.85
2021264.09685.1912.05685.19347.84129.2337.15−0.01−0.21
MG2020900.452171.38189.812839.651406.51545.4838.780.10−0.580.81
20211125.642963.0259.462976.681506.45544.9436.170.270.03
Gs20201010.282620.16203.993420.171664.14655.7939.410.12−0.560.82
20211389.733648.2199.983648.211854.29664.4635.830.21−0.03
GL202050.53109.084.71127.8764.2319.7230.71−0.090.840.85
202162.44136.6811.04136.8184.0524.8929.61−0.23−0.36
MGL2020299.58590.92147.61594.40348.8786.5624.810.30−0.090.80
2021229.44672.04175.66696.02349.3086.9724.900.851.53
AGL20206.719.740.9947.9918.8912.0663.860.59−0.960.77
202153.0922.820.9786.8046.0019.0841.49−0.23−0.79
GLs2020356.82709.73169.19713.56431.99106.3224.610.14−0.120.84
2021344.97831.54255.58849.78479.34108.0722.540.530.58
TIF20202288.135620.11498.757028.183618.141357.6237.520.15−0.600.81
20212659.037159.431383.427397.733946.011237.2531.350.37−0.08
PC202042.2650.5537.4754.5346.453.357.22−0.07−0.450.86
202145.6553.6241.3056.9547.233.116.580.30−0.26
OC202018.819.649.6421.0415.462.1213.740.11−0.250.87
202119.168.248.2421.0216.012.0012.51−0.380.78
RILs: recombinant inbred lines. The traits observed are concentrations of 12 isoflavones, proteins and oils: D (daidzin, μg/g), MD (malonyldaidzin, μg/g), AD (acetyldaidzin, μg/g), Ds (sum of daidzein derivatives, μg/g), G (genistin, μg/g), MG (malonylgenistin, μg/g), Gs (sum of genistein derivatives, μg/g), GL (glycitin, μg/g), MGL (malonylglycitin), AGL (acetylglycitin, μg/g), GLs (sum of glycitein derivatives, μg/g), TIF (total isoflavone, μg/g), PC (protein content, %), OC (oil content, %).
Table 2. Putative QTLs for soybean isoflavone traits detected in a population of contrasting soybean parents and 185 RILs.
Integrated QTLSeparated QTLChrPosition (cM)Locus/IntervalLODADDPVE (%)Reference
qISO1qGL1(21), qD1(20), qDs1(20), qMD1(20), qGL1(20)1231.938–275.56901_51600690–01_547998442.52–3.96−80.46 6.1–9.5Novel (two year)
qISO2.1qTIF2.1(21), qGs2.1(21), qMD2.1(21), qMG2.1(21), qDs2.1(21), qGLs2.1(21), qMGL2.1(21)215.149–32.88702_2149517–02_36212332.67–3.06−136.35 6.5–7.4Seed_isoflavone_6-2 [11]
qISO2.2qMGL2.2(20)2249.84202_48470807–02_481761392.73−31.92 6.6–6.6Novel
qISO3qAD3(20), qTIF3(20), qG3(20)31.786–14.98303_314515–03_6018132.53–2.81−166.70 6.2–6.8Novel
qISO5qDs5(20), qGL5(21), qMD5(20), qAD5(20), qG5(20), qG5(21), qTIF5(20), qGs5(20), qGLs5(20), qMG5(20), qMG5(21), qMGL5(20), qGs5(21), qD5(20), qD5(21), qDs5(21), qGL5(20), qTIF5(21), qMD5(21), qMGL5(21), qGLs5(21)5317.424–318.43805_41415752–05_420986803.1–11.11−188.13 7.5–24.4Seed_isoflavone_1-1 [15], Seed_isoflavone_6-1 [11], Seed_isoflavone_7-5 [36]
qISO6.1qMD6.1(20), qAD6.1(21), qGs6.1(20), qMG6.1(20), qD6.1(20), qTIF6.1(20), qG6.1(20), qDs6.1(20)6179.84–191.07206_14871510–06_156427622.53–5.34−214.21 6.2–12.6Novel (two year)
qISO6.2qG6.2(21), qGLs6.2(21), qGLs6.2(20), qGs6.2(21), qMG6.2(21), qMGL6.2(21), qTIF6.2(21), qMGL6.2(20), qD6.2(20), qTIF6.2(20), qMD6.2(20), qDs6.2(20)6213.609–225.65006_18449510–06_210989942.94–11.34−160.98 7.1–24.8Seed_isoflavone_8-1 [35], Seed_isoflavone_1-2 [15]
qISO6.3qG6.3(21), qGL6.3(21), qGLs6.3(21), qTIF6.3(20), qGs6.3(20), qMG6.3(20), qMGL6.3(21), qGs6.3(21), qD6.3(20), qGLs6.3(20), qGL6.3(20), qDs6.3(20), qMD6.3(20), qMGL6.3(20)6241.934–242.93406_35913434–368355832.53–8.26−124.50 6.2–18.8Novel (two year)
qISO6.4qGs6.4(20), qMG6.4(20), qD6.4(20), qD6.4(21), qGLs6.4(20), qG6.4(21), qGLs6.4(21), qDs6.4(20), qTIF6.4(20), qMD6.4(20), qMG6.4(21), qMGL6.4(20), qMGL6.4(21), qGs6.4(21), qTIF6.4(21), qGL6.4(21)6271.344–273.16306_42113786–06_438873512.55–8.87−153.17 6.2–20Novel (two year)
qISO8.1qAD8.1(21), qD8.1(20), qDs8.1(20), qGL8.1(21), qGLs8.1(20), qMD8.1(20), qMGL8.1(20), qTIF8.1(20), qD8.1(21), qG8.1(21), qGs8.1(21), qTIF8.1(21)895.815–96.09608_9020859–08_90547952.52–4.59128.77 6.1–10.9Seed_isoflavone_7-1 [36], Seed_isoflavone_6-7 [11]
qISO8.2qD8.2(20), qDs8.2(20), qG8.2(20), qTIF8.2(20), qMD8.2(20), qMG8.2(20), qGs8.2(20)8178.24108_157168203.11–4.26220.78 7.5–10.2Seed_isoflavone_3-3 [34]
qISO9.1qG9.1(20), qGL9.1(20), qGLs9.1(20), qMGL9.1(20)931.95409_25563742.66–4.6335.35 6.5–11Seed_isoflavone_12-6 [32]
qISO9.2qTIF9.2(20), qD9.2(20), qDs9.2(20), qMD9.2(20)946.908–48.22409_3204462–09_36723842.83–3.09225.28 6.9–7.5Seed_isoflavone_12-6 [32]
qISO10.1qD10.1(20), qMD10.1(20), qDs10.1(20)102.436–3.43610_570120–10_11099022.83–3.04−144.96 6.9–7.4Novel
qISO10.2qAD10.2(20), qG10.2(20), qTIF10.2(20), qMG10.2(20), qGs10.2(20)1020.95410_12379082.77–3.21−195.80 6.7–7.8Novel
qISO10.3qG10.3(21), qAD10.3(20), qG10.3(20), qGs10.3(20), qMG10.3(20), qTIF10.3(20)10259.847–305.89610_43610530–10_486492712.54–2.93−159.48 6.2–7.1Seed_isoflavone_12-8 [32], Seed_isoflavone_12-9 [32]
qISO11qG11(21), qGL11(21), qGLs11(21), qGs11(21), qMGL11(21), qMD11(20), qDs11(20), qGLs11(20), qMGL11(20)11178.874–182.91811_25422320–11_260863982.57–3.54−77.86 6.2–8.5Seed_isoflavone_12-10 [32], Seed_isoflavone_11-16 [14]
qISO12qAD12(21), qGL12(21), qG12(20), qGs12(20), qMG12(20), qG12(21), qGs12(21), qMG12(21), qTIF12(21)1274.532–93.47612_5008803–12_57977762.56–4.29−127.06 6.2–10.2Seed_isoflavone_6-4 [11]
qISO14qAD14(20), qGLs14(20), qD14(20), qG14(20), qTIF14(20), qDs14(20), qGs14(20), qMD14(20), qMG14(20), qGL14(21)14200.845–216.81414_45868867–14_469530152.55–3.83−149.60 6.2–9.2Seed_isoflavone_11-17 [14]
qISO15qAD15(20), qGs15(20), qMG15(20), qG15(20)1511.737–12.73715_635901–15_12517343.26–3.58−129.16 7.9–8.6Seed_isoflavone_7-8 [36]
qISO17qGL17(20), qGLs17(21), qGLs17(20), qMGL17(21)1786.186–86.18617_63431793.02–4.28−26.22 7.3–10.2Seed_isoflavone_9-8 [55]
qISO19.1qGLs19.1(21), qMGL19.1(21)1949.333–49.33319_41727322.62–3.19−25.80 6.4–7.7Novel
qISO19.2qGLs19.2(21), qMGL19.2(21), qD19.2(20)19144.521–171.6219_36928466–19_392164822.89–3.22−4.51 7–7.8Seed_isoflavone_7-3 [36], Seed_isoflavone_11-3 [14]
qISO19.3qTIF19.3(21), qMG19.3(21), qGs19.3(21), qAGL19.3(20), qAGL19.3(21)19229.515–279.38219_42466443–19_466537072.54–2.85−124.14 6.2–6.9Seed_isoflavone_6-5 [11]
qISO20qGLs20(20), qMGL20(20)2059.05520_22601932.53–2.8134.31 6.2–6.8Novel
ADD values of >0 and <0 represent increasing effects of the QTLs derived from JD12 and Y9, respectively. Numbers in brackets represents the year when the QTLs were detected.
Table 3. Large-effect QTLs for soybean isoflavone traits verified through two years of detection in a population of contrasting soybean parents and 185 RILs of JD12 × Y9.
Integrated QTLYearSeparated QTLPositionChrLocus/IntervalLODADDPVE (%)
qISO52020qD5318.438505_41042159–05_4141575210.37−75.109623
2021qD5318.438505_41042159–05_414157528.63−48.322819.5
2020qDs5317.424505_41415752–05_4209868011.11−388.85424.4
2021qDs5318.438505_41042159–05_414157528.89−248.7120.1
2020qG5317.438505_414157526.26−63.559814.6
2021qG5317.438505_414157523.2−36.33617.7
2021qGL5317.424505_41415752–05_420986803.1−6.898117.5
2020qGL5318.438505_41042159–05_414157526.3−12.04414.7
2020qGLs5317.438505_414157526.73−59.647415.6
2021qGLs5318.438505_41042159–05_414157523.88−34.32599.3
2020qGs5317.438505_414157527.12−357.8216.4
2021qGs5317.438505_414157524.84−227.51311.5
2020qMD5317.424505_41415752–05_4209868011.04−297.50524.2
2021qMD5318.438505_41042159–05_414157528.93−193.46320.1
2020qMG5317.438505_414157527.2−294.2616.6
2021qMG5317.438505_414157525.1−191.17712
2020qMGL5317.438505_414157526.4−46.40614.9
2021qMGL5318.438505_41042159–05_414157523.88−27.63179.3
2020qTIF5317.438505_414157529.94−806.1222.1
2021qTIF5318.438505_41042159–05_414157526.96−516.5616.1
qISO6.22020qGLs6.2213.609606_1844951010.15−72.088222.5
2021qGLs6.2213.609606_1844951010.23−52.425822.7
2020qMGL6.2225.408606_19395795–06_2109899411.34−60.478824.8
2021qMGL6.2213.609606_1844951010.65−42.939723.5
2020qTIF6.2225.65606_210989943.76−515.9769
2021qTIF6.2213.609606_184495102.94−336.5377.1
ADD values of >0 and <0 represent increasing effects of the QTLs derived from JD12 and Y9, respectively.
Table 4. Putative QTLs for soybean protein and oil content detected in a population of contrasting soybean parents and 185 RILs.
Integrated QTLSeparated QTLChrPositionLocus/IntervalLODADDPVE (%)Reference
qQ2qOC2(21)231.25302_32649112.840.53 6.9Seed oil 26-1 [56]
qQ6.1qOC6.1(20), qOC6.1(21)6211.941–220.39706_17707370–06_185978493.02–3.56−0.59 7.3–8.6Seed oil 33-2 [57], Seed oil 27-1 [58]
qPC6.1(20), qPC6.1(21)6224.401–224.40806_19395795–06_203123143.16–4.651.00 7.6–11.1Seed protein 28-1 [16], Seed protein 29-1 [57], Seed protein 35-2 [59]
qQ6.2qOC6.2(20)6268.27306_397430793.01−0.58 7.3mqSeed_Oil-009 [60], Seed oil 24-19 [61]
qPC6.2(20)6271.34406_421137863.450.97 8.4Seed protein 24-1 [62]
qQ8qOC8(21), qOC8(20)880.663–103.27208_7270752–08_95023162.78–5.30.64 6.8–12.5Seed oil 30-2 [16], Seed oil 30-3 [16], Seed oil 34-1 [63]
qPC8(21), qPC8(20)880.663–103.27208_7270752–08_95023166.85–8.61−1.38715.9–19.5cqSeed_protein-013 [64], cqSeed_protein-016 [64], Seed protein 26-1 [58], Seed protein 30-4 [63], Seed protein 34-4 [65], Seed protein 34-5 [65]
qQ9qOC9(21)943.06609_30767992.640.51 6.4Seed oil 42-26 [14], Seed oil 43-22 [66]
qQ11.1qOC11(21)11155.44611_128185473.450.59 8.3Seed protein 24_3 [62], Seed protein 36-27 [66], Seed protein 40-3 [67], Seed protein 41-7 [68]
qPC11.1(21)11155.44611_128185472.72−0.82 6.6Novel
qQ11.2qPC11.2(21)11210.20811_20292294–11_297401522.8−0.84 6.8Seed protein 25-2 [69]
qPC11.3(21)11231.45511_307521513.68−0.93 8.8Seed protein 26-6 [58]
qQ13.1qOC13(20), qOC13(21)1380.692–102.98213_17332728–13_198785093.24–4.030.61 7.9–9.6Seed oil 36-4 [70]
qPC13.1(20)1395.03913_18585206–13_186545983.13−0.95 7.6Novel
qQ13.2qPC13.2(21)13175.22713_230432893.81−0.96 9.1Seed protein 36 [66]
qQ15.1qOC15.1(20), qOC15.1(21)1536.551–45.84815_2321231–15_43709084.53–5.450.72 10.8–12.8Seed oil 2-3 [28], Seed oil 32-1 [71]
qPC15(20), qPC15(21)1551.149–58.11715_4573538–15_48592894.8–5.8−1.16 11.4–13.6Seed protein 30-3 [63]
qQ15.2qOC15.2(20)1598.59815_78912074.220.68 10.1cqSeed_protein-001 [72], cqSeed_protein-008 [64], Seed protein 3-6 [64], Seed protein 4-5 [73], Seed protein 5-1 [73], Seed protein 30-3 [63], Seed protein 39-2 [74]
qPC9(20), qPC9(21)2043.066–45.90809_3076799–09_36723843.14–3.96−0.98 7.6–9.5Seed protein 1-3 [28], Seed protein 3-12 [75], Seed protein 11-1 [76]
qQ20.1qPC20.1(20), qPC20.1(21)2069.367–70.36720_2916159–20_35365057.05–7.73−1.35 16.3–17.8Seed protein 1-4 [28], Seed protein 11-1 [76], Seed protein 3-12 [75], Seed protein 1-3 [28]
qOC20.1(20), qOC20.1(21)2082.612–84.33720_5834525–20_61015539.96–10.300.98 22.3–22.8Seed oil 13-4 [62], mqSeed_Oil-020 [60], Seed oil 24-30 [61]
qQ20.2qPC20.2(20), qPC20.2(21)2092.65120_226320828.77–9.41−1.48 19.9–21.1Seed protein 31-1 [77], cqSeed_protein-003 [78], Seed protein 10-1 [76], Seed protein 37-8 [79]
qOC20.2(21)20110.44820_15355398–20_191820178.920.91 20.1cqSeed_oil-004 [78]
qQ20.3qOC20.3(21), qOC20.3(20)20126.455–131.28720_25307871–20_256910608.86–9.780.95 20.1–21.8Seed oil 13-4 [80], Seed oil 24-30 [61], mqSeed_Oil-020 [60], Seed oil 15-1 [81]
qOC20.4(20), qOC20.4(21)20144.07820_323816069.74–10.100.98 21.7–22.5Seed oil 2-1 [28]
qPC20.3(20), qPC20.3(21)20144.078–149.96420_32381606–20_332901047.53–8.19−1.39 17.4–18.6Seed protein 1-1 [28], Seed protein 1-2 [28], Seed protein 39-4 [74], Seed protein 26-5 [58]
qQ20.4qOC20.5(20), qOC20.5(21)20203.51720_377878552.51–4.540.60 6.1–10.8Seed oil 27-8 [58], Seed oil 42-39 [14], Seed oil 43-18 [66]
ADD values of >0 and <0 represent increasing effects of the QTLs derived from JD12 and Y9, respectively. Numbers in brackets represents the years when the QTLs were detected.
Publisher’s Note: MDPI stays neutral with regard to jurisdictional claims in published maps and institutional affiliations.

