Article

Preliminary Evaluation of Spraying Quality of Multi-Unmanned Aerial Vehicle (UAV) Close Formation Spraying

1
National Center for International Collaboration Research on Precision Agricultural Aviation Pesticides Spraying Technology, South China Agricultural University, Guangzhou 510642, China
2
Guangdong Laboratory for Lingnan Modern Agriculture, Guangzhou 510642, China
3
College of Electronic Engineering and Artificial Intelligence, South China Agricultural University, Guangzhou 510642, China
4
College of Engineering, South China Agricultural University, Guangzhou 510642, China
*
Author to whom correspondence should be addressed.
Agriculture 2022, 12(8), 1149; https://doi.org/10.3390/agriculture12081149
Submission received: 4 July 2022 / Revised: 31 July 2022 / Accepted: 1 August 2022 / Published: 3 August 2022
(This article belongs to the Special Issue Application of UAVs in Precision Agriculture)

Abstract

:
Chemical application using unmanned aerial vehicles (UAVs) has received significant attention from researchers and the market in recent years. The concept of using drones for collaborative spraying was proposed by manufacturers for improving intelligence and work efficiency. However, chemical spraying is a professional technology in which spraying quality is the main concern. Using drones to achieve multi-unmanned aerial vehicle formation spraying and evaluating the spraying effect has not yet been reported. In this study, an indoor test platform and two UAVs for field experiments were built. Indoor and outdoor trials of close formation spraying were carried out in Guangzhou and Changji, China from the end of 2018 to 2019, respectively. The droplet density and distribution uniformity of droplets were evaluated from multiple spray overlap areas. It can be seen that simultaneous spraying was better than sequential spraying with the indoor spraying results in the outer fuselage overlap area (S1), and spraying in a short-interval mode can improve the droplet deposition distribution in the overlapping spraying area. Additionally, the droplet distribution result of sequential spraying was better than that of simultaneous spraying in the route center overlap area (S2). Also, the droplet distribution result of the long-interval mode was better than that of the short-interval mode. The uniformity of the droplets’ distribution in two spray width areas (S3) did not change significantly among the treatments.

1. Introduction

Chemical application using unmanned aerial vehicles (UAVs) has developed rapidly in China in recent years. In China, driven by the market, scientific research projects and government policies, UAV technology has been rapidly updated, and the spraying area has gradually increased [1,2]. According to the statistical data, the number of drones in the market was less than 1000 previously, but by the end of 2020, the number of drones in China reached 106,000 with a total yearly working area of 64 million ha [3]. Compared with the conventional ground crop protection machinery, UAVs operate with lower labor intensity and operator exposure, and higher working efficiency, especially in complicated terrain and small farm sizes with separated plots [4,5]. At the same time, UAVs are limited by payload and can only spray at an ultra-low volume or have a limited role in large areas of farmland [6,7]. Recently, multi-agent systems (MAS) have been widely applied in the agriculture domain, which include pesticide spraying agricultural UAVs [8], coordinated weeding robot teams [9], the coordination of grape-harvesting and transport robots [10], robot tractor formation [11], irrigation scheduling [12], smart farming [13], a decision-making model for rural land management [14], wireless sensor networks [15], monitoring of cattle [15], an Internet of Things (IoT) system of greenhouses [16], etc. Due to the rapid development of technology and product iterations over the past two or three years, the high degree of agricultural UAV automation enables fully automatic operation with fewer operators. Therefore, one man can operate two to four agricultural UAVs for pesticide spraying under an autonomous flight mode normally, such as the commercial agricultural UAV MG-1P/T16 (Shenzhen DJI Sciences and Technologies Ltd., Shenzhen, China) produced by DJI and P20/30 series (Guangzhou XAG Co., Ltd., Guangzhou, China) produced by XAG. The remote controller of the T16 features a multi-aircraft control function, which can be used to coordinate the operation of up to five aircraft at the same time, enabling pilots to work efficiently. It is recommended for large spray areas.
Chemical spraying is a professional technology, in which the spraying quality is the main concern [16]. The direct way to study spray quality is through field experiments [17]. Existing field spraying experiments with drones focus on the feasibility of controlling pests and diseases in different crops, improving spraying quality and reducing drift [17,18,19]. The research on spraying or operational parameters is popular, and the flying speed and height of UAVs are the two most studied parameters [19,20]. The deposition and distribution of droplets on the crop canopy are closely related to the operational height and velocity of crop spraying executed by the UAV [21]. To summarize, for multi-rotor UAVs, the adequate operational height above the crop canopy is between 1.5–2.5 m, whereas the speed is between 2.5–4 m/s [22,23,24]. Meanwhile, for single-rotor UAVs (unmanned helicopters), the adequate flight height above the crop canopy is between 2.5–4 m, whereas the speed is between 3–5 m/s [4,21,25,26,27]. The coefficient of variation (CV) of the total deposition on the plants for both UAV types ranges from 30–70% normally; however, in the worst case the value exceeds 80% [5,23,25,28,29]. Most of the test data come from the flight of a single UAV. The test results are compared with the manual, ground spray equipment and aviation spray equipment. However, there is currently no research focusing on and evaluating the spraying quality of multi-UAV close formation spraying.
For a close formation of UAVs, since the relative distance between vehicles within the formation is close, there is a potential collision risk with other neighboring vehicles. Moreover, an issue for fixed-wing unmanned aerial vehicle (UAV) close formation aerodynamics is the wake vortex effect, which is when all trailing UAVs encounter the wake vortices generated by the neighboring, leading UAV within the formation [14,30,31]. Currently, most research on multi-UAV formation is only verified through numerical simulations. He, L. et al. [32] proposed a model of task allocation and flight route generation for the scenario of two UAVs conducting pesticide spraying on multiple farmlands. However, the two UAVs work independently on different farmlands without cooperation and the model was only verified by numerical simulation. Stefan, I. et al. proposed a multi-UAV area coverage method, of which the spraying accuracy and time efficiency can significantly outperform UAVs conducting pesticide spraying with existing path planning methods [8]. However, the proposed method was only verified by numerical simulation. It is necessary to build an unmanned aerial vehicle system to explore the effect of the close formation of UAVs on spray quality through actual spray experiments.
The concept of spraying plant protection products with one control and multiple machines was proposed by some agricultural drone companies, such as DJI and XAG. The user can control different aircraft by switching the dial of the remote control. This mode helps one person operate multiple drones spraying at the same time on multiple nearby farmland areas in order to improve work efficiency [33]. However, this model is not the same as the concept of close formation spraying studied in this article. Formation flying not only needs to consider individual movements, but also coordinate the mutual movements between UAVs. For multi-UAV close formation spraying applications, the spray quality needs to be paid attention to. In this paper, we evaluated the impact of UAV formation flying on spray quality by building an unmanned aerial spray system based on an indoor platform and field tests. The spray quality of aerial spraying with a dual-UAV formation flight was compared with aerial spraying with a single UAV. Spray quality indicators such as droplet density, coverage and uniformity were analyzed and compared between the aerial spraying by a single UAV and by a multi-UAV close formation flight.

2. Materials and Methods

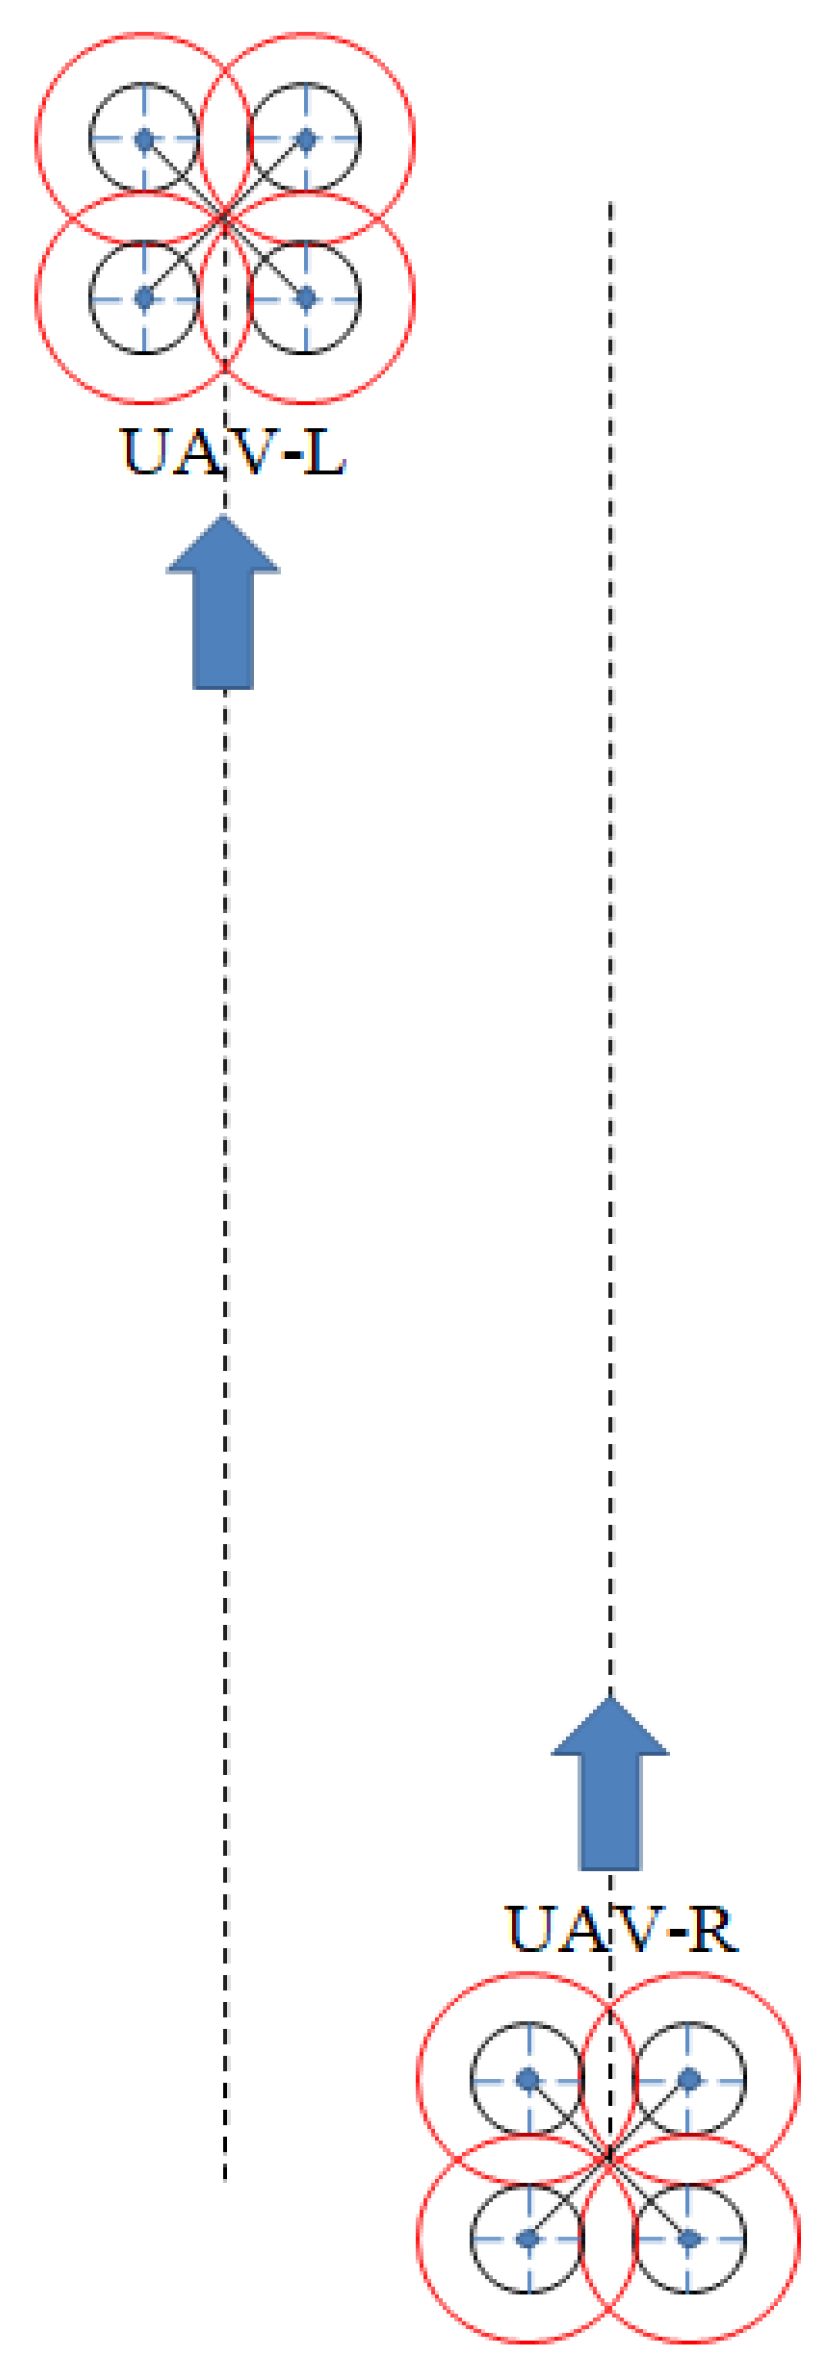
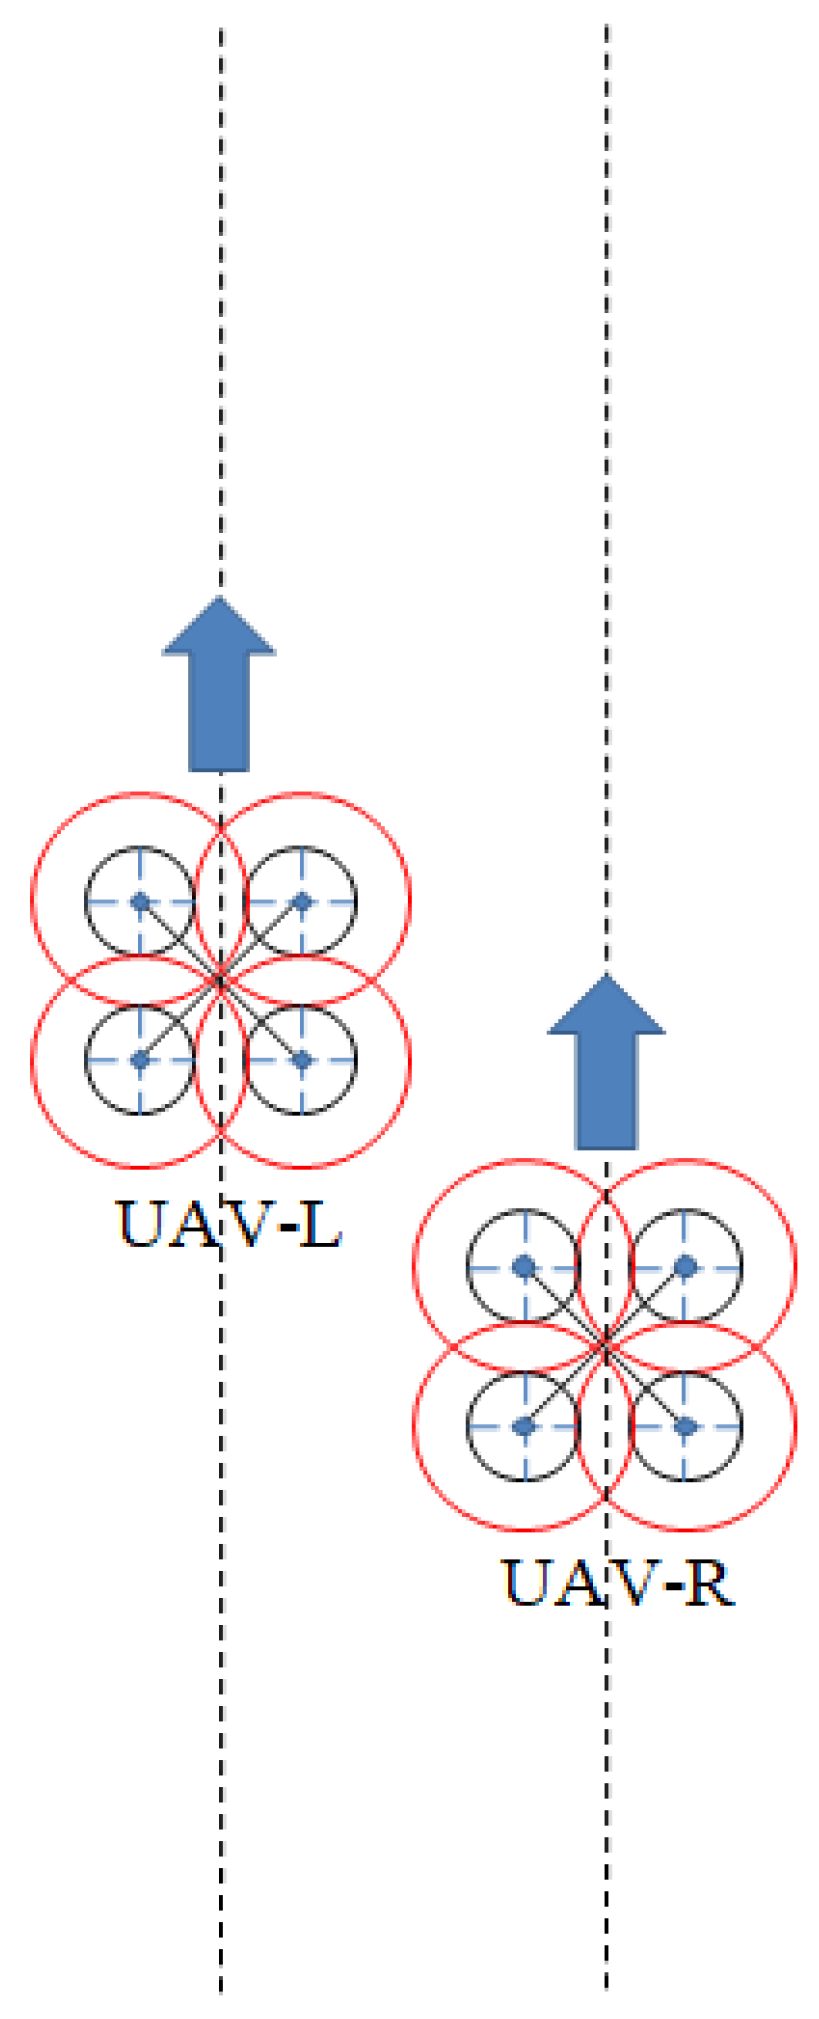
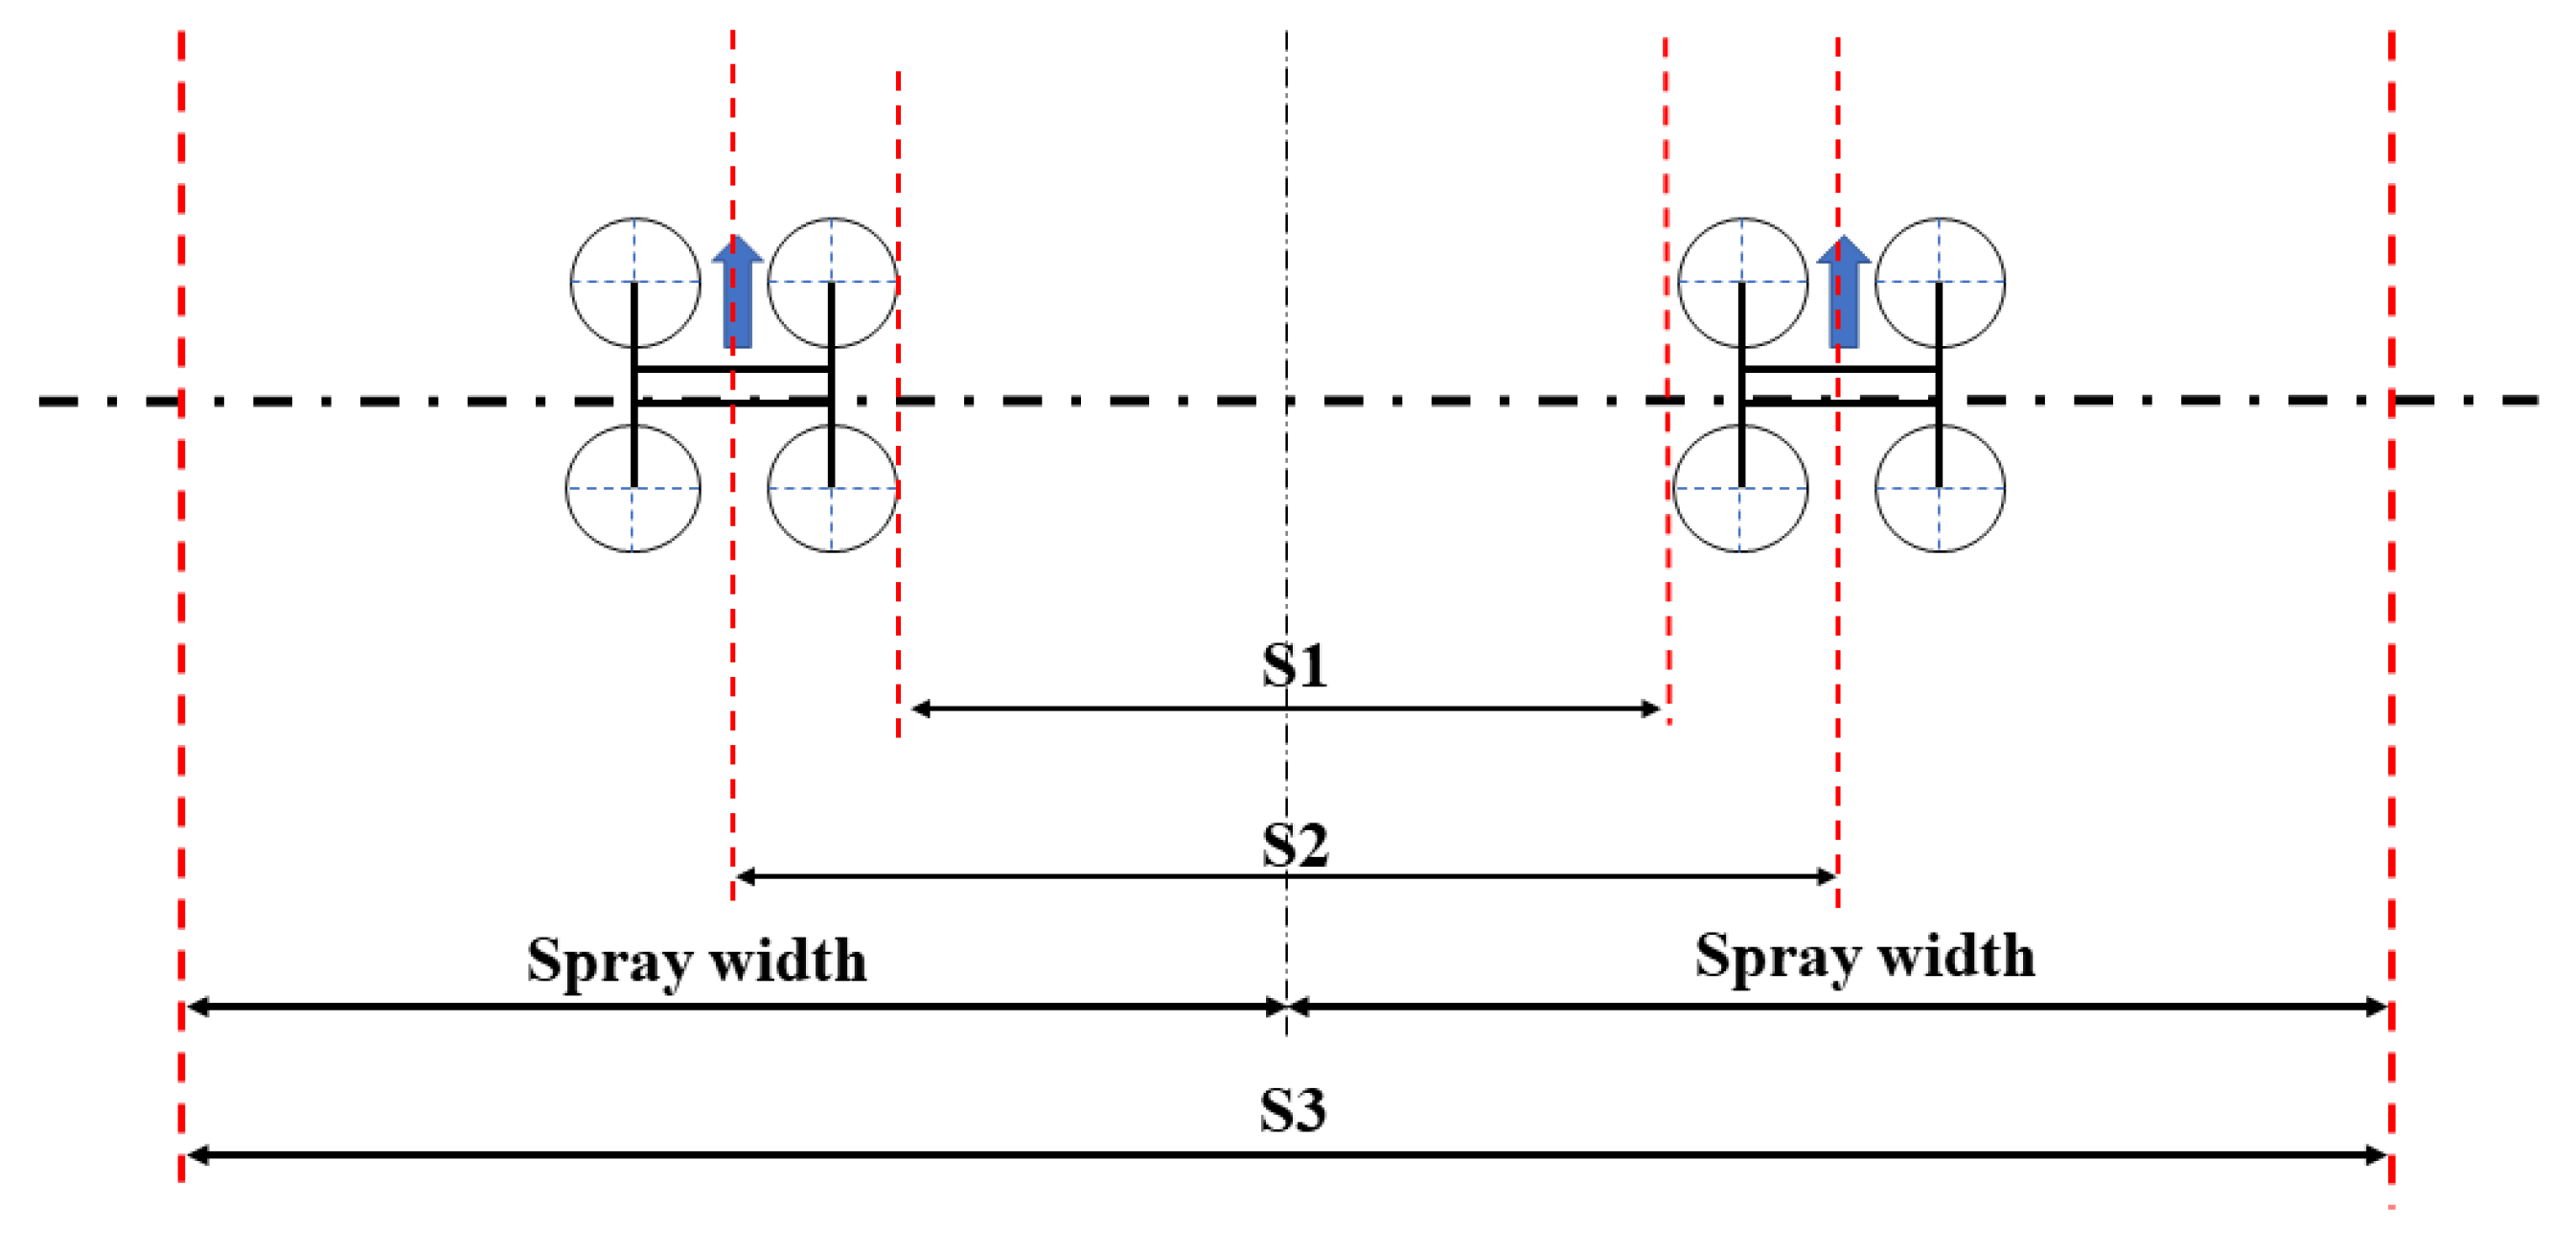
2.1. Multi-UAV Formation Spray Analysis

For aerial spraying with a multi-agricultural UAV close formation flight, the edge of the spraying swath width of each UAV within the formation should be connected and matched in order to avoid overlapping or deficient spraying. In addition, for a multi-UAV formation flight, there can be an infinite number of possible formations. In order to systematically study the effect of aerial spraying with a multi-UAV formation flight and ease the design of experiments, two concepts are proposed and are explained in advance, which are “sequential spraying” and “simultaneous spraying”. Take the scenario of aerial spraying with two identical UAVs as an example, where UAV-L stands for the UAV on the left and UAV-R stands for the UAV on the right. Two adjacent paths are predefined for UAV-L and UAV-R, with the interval of one spraying swath width to ensure the two spraying swath widths of UAV-L and UAV-R are connected and matched.
As shown in Figure 1 and Figure 2, “sequential spraying” refers to aerial spraying when the UAV-R enters the path on the right after the UAV-L completes the path on the left, and vice versa. “Simultaneous spraying” refers to aerial spraying with a dual-UAV close formation flight, where the UAV-L and UAV-R are flying along their own paths simultaneously except for during the take-off and landing phases. Moreover, “sequential spraying” is similar to the actual aerial spraying application by a single UAV, whereas “simultaneous spraying” represents aerial spraying with a multi-UAV formation flight, which is investigated in this paper.
In order to further quantify the difference between sequential spraying and simultaneous spraying, the parameters of the dual-UAV formation flight are shown in Figure 3. The parameters of dual-UAV simultaneous spraying include UAV flying speed v, flying height h, path spacing a and distance in the forward direction b. The path spacing a and distance in the forward direction b are two essential parameters of a dual-UAV formation flight for forming a specific formation. As shown in Figure 3, The path spacing a is equal to the spraying swath width of a single UAV and cannot be changed at will to avoid overlapping or deficient spraying. Therefore, the distance in the forward direction b is the only parameter used to set and adjust the dual-UAV formation.
The droplet deposition is related to the time t. The longer the time, the more droplets sprayed by the UAV are deposited on the ground or on plants. Therefore, Equation (1) is deployed in which the distance in the forward direction b is related to the UAV flying speed v and time t, where t is the time difference between the two UAVs in the forward direction. The parameter t is used to realize a certain formation flight of two neighboring UAVs. The time difference t is adjusted and realized by different take-off times, whereas the two UAVs are operated in a fully autonomous flight mode.
b = vt

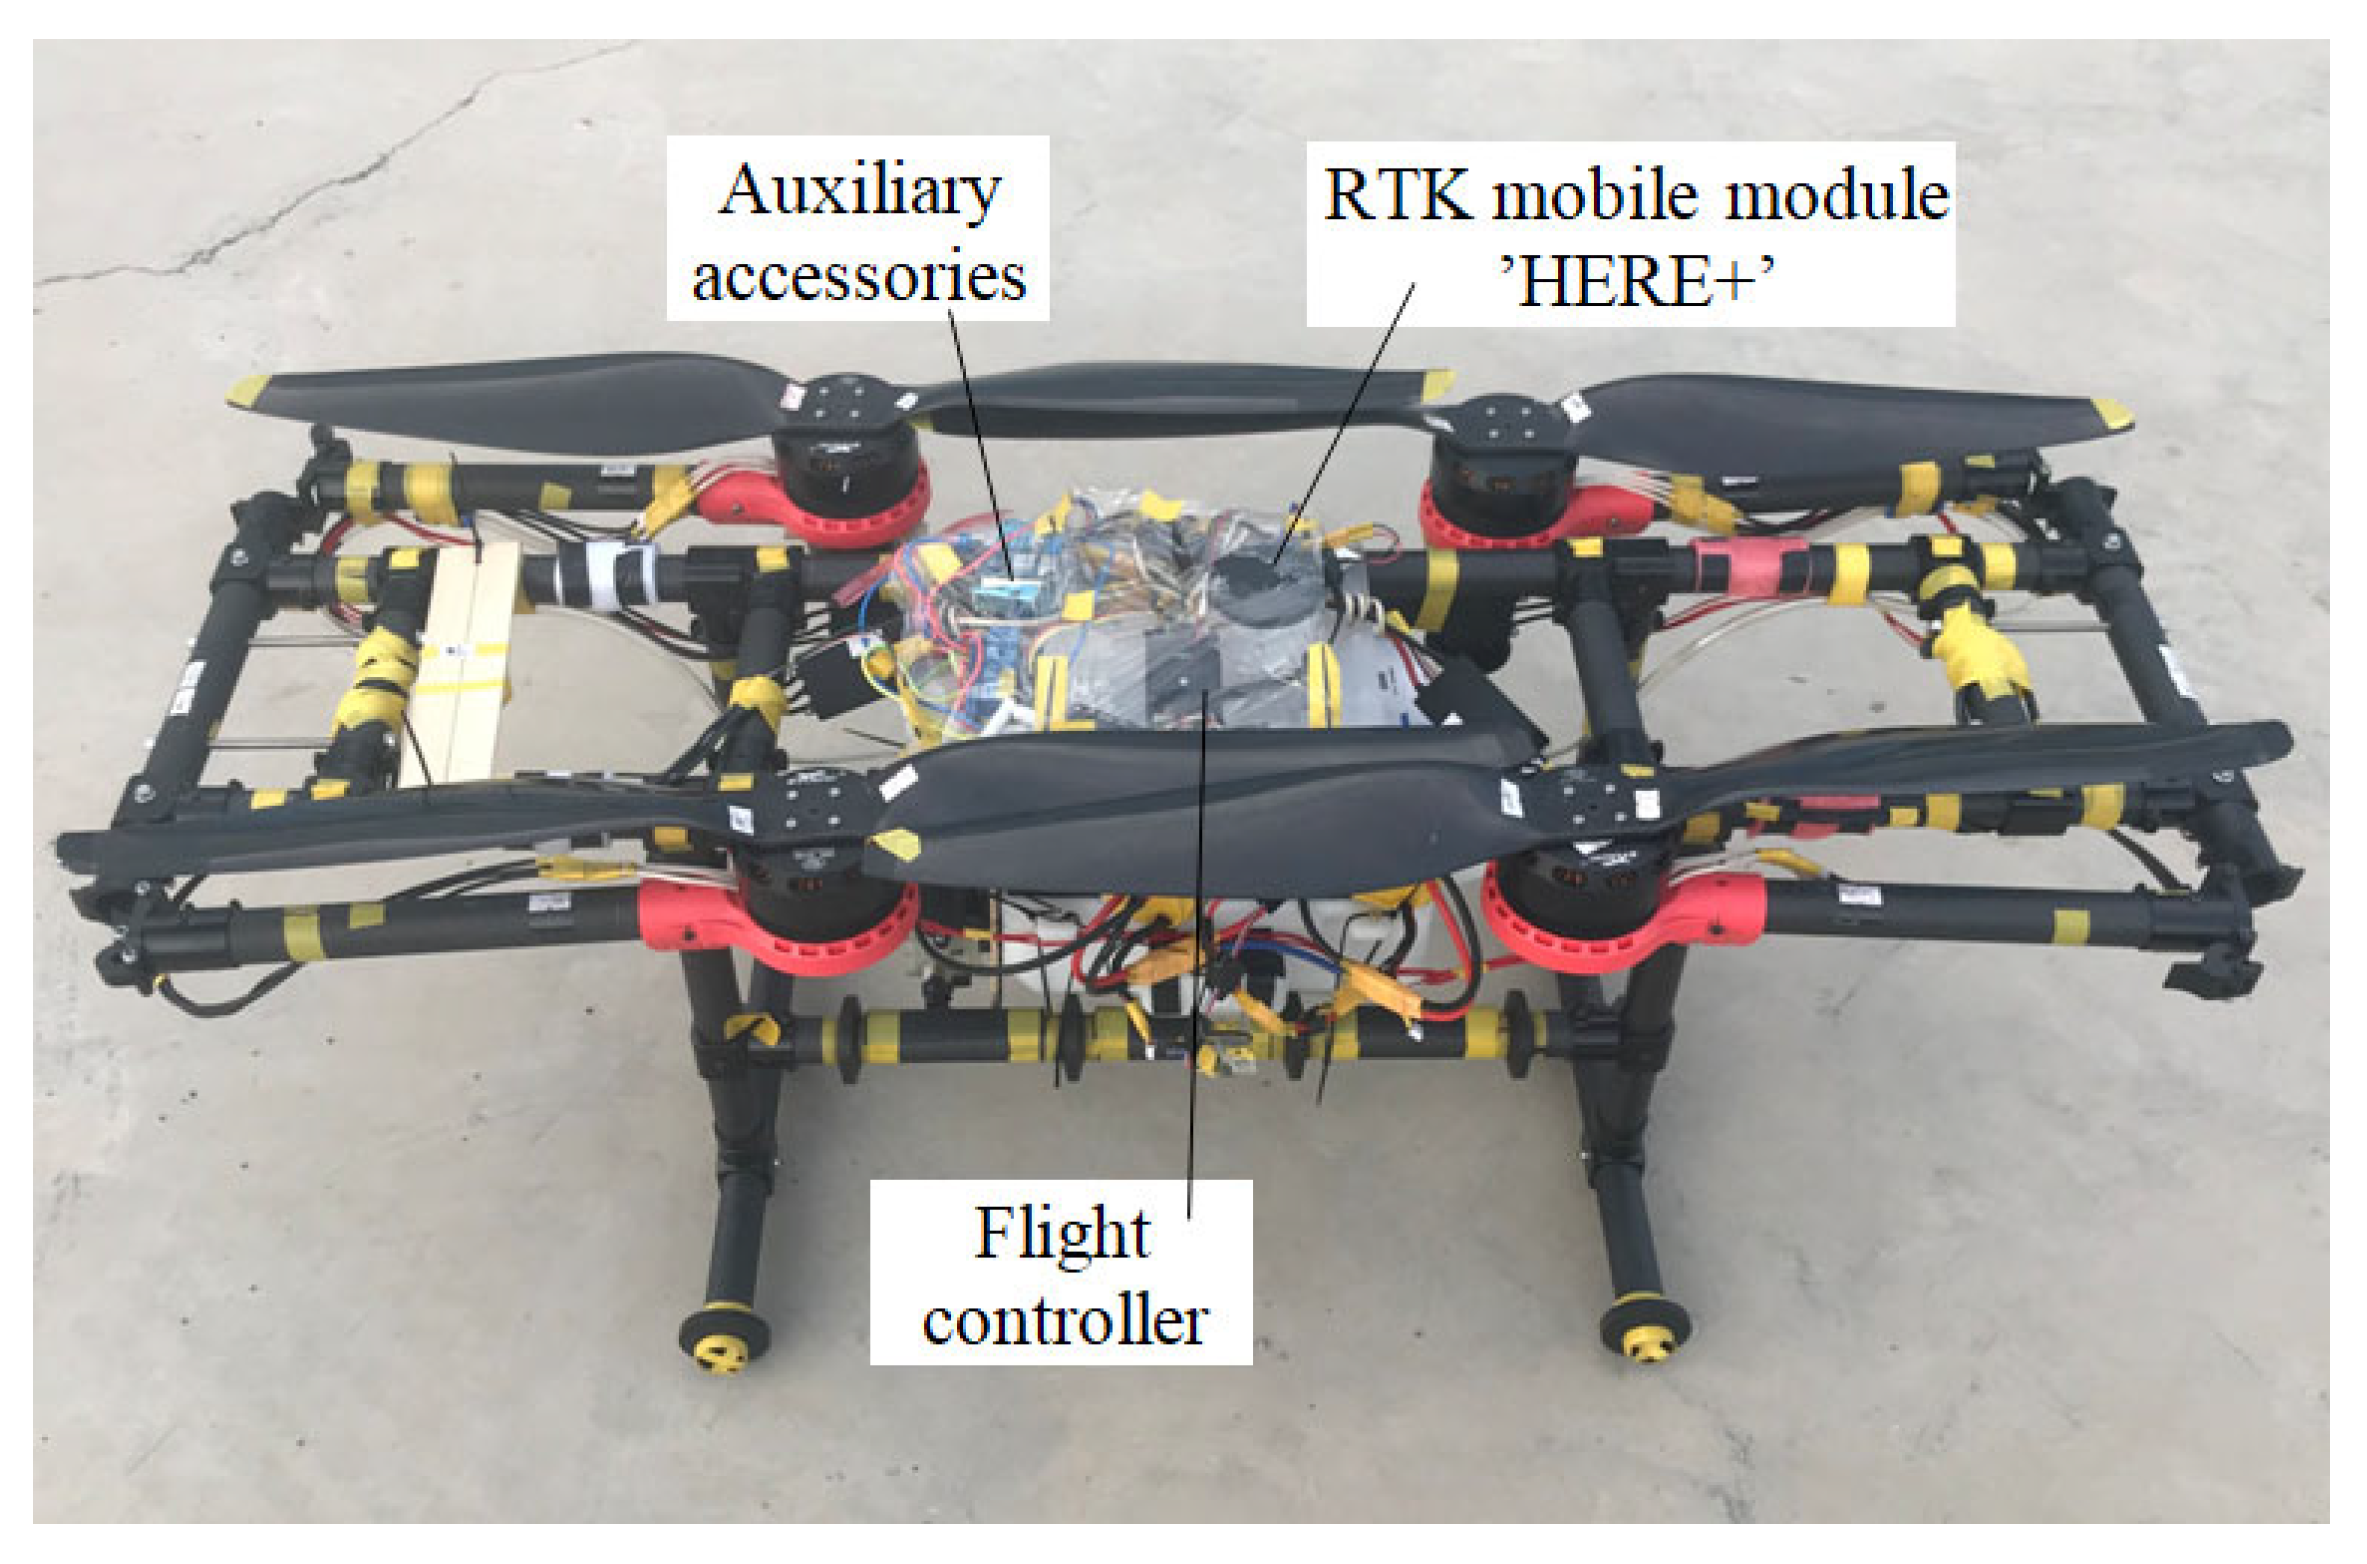
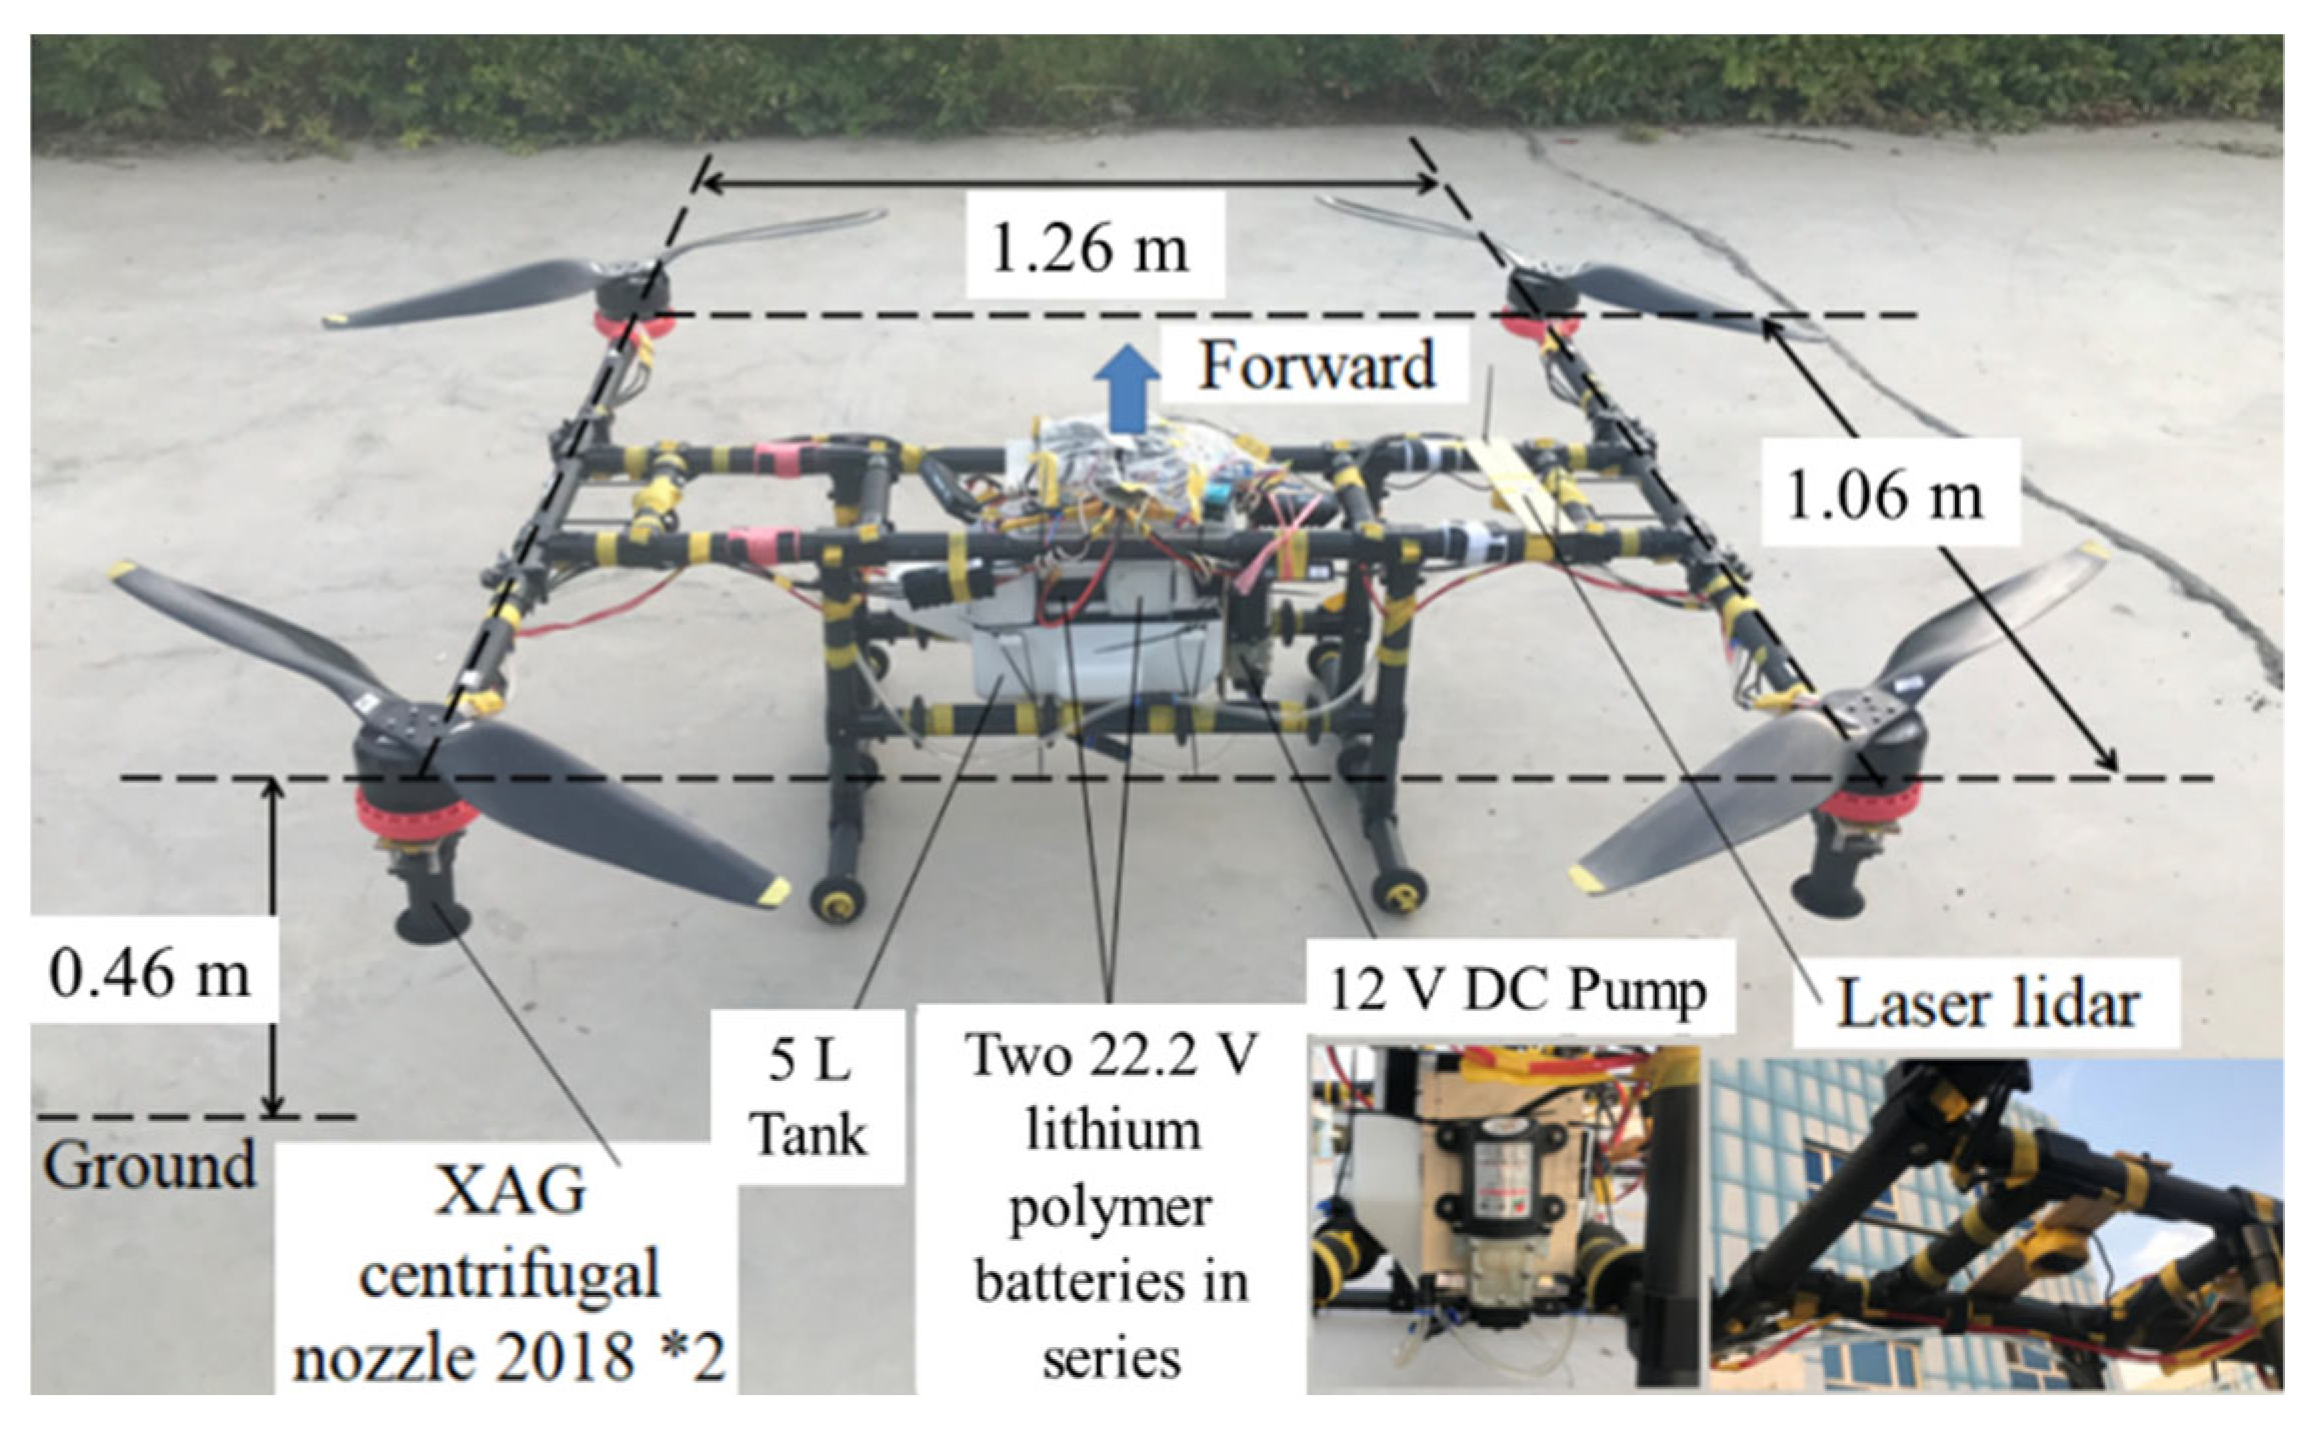
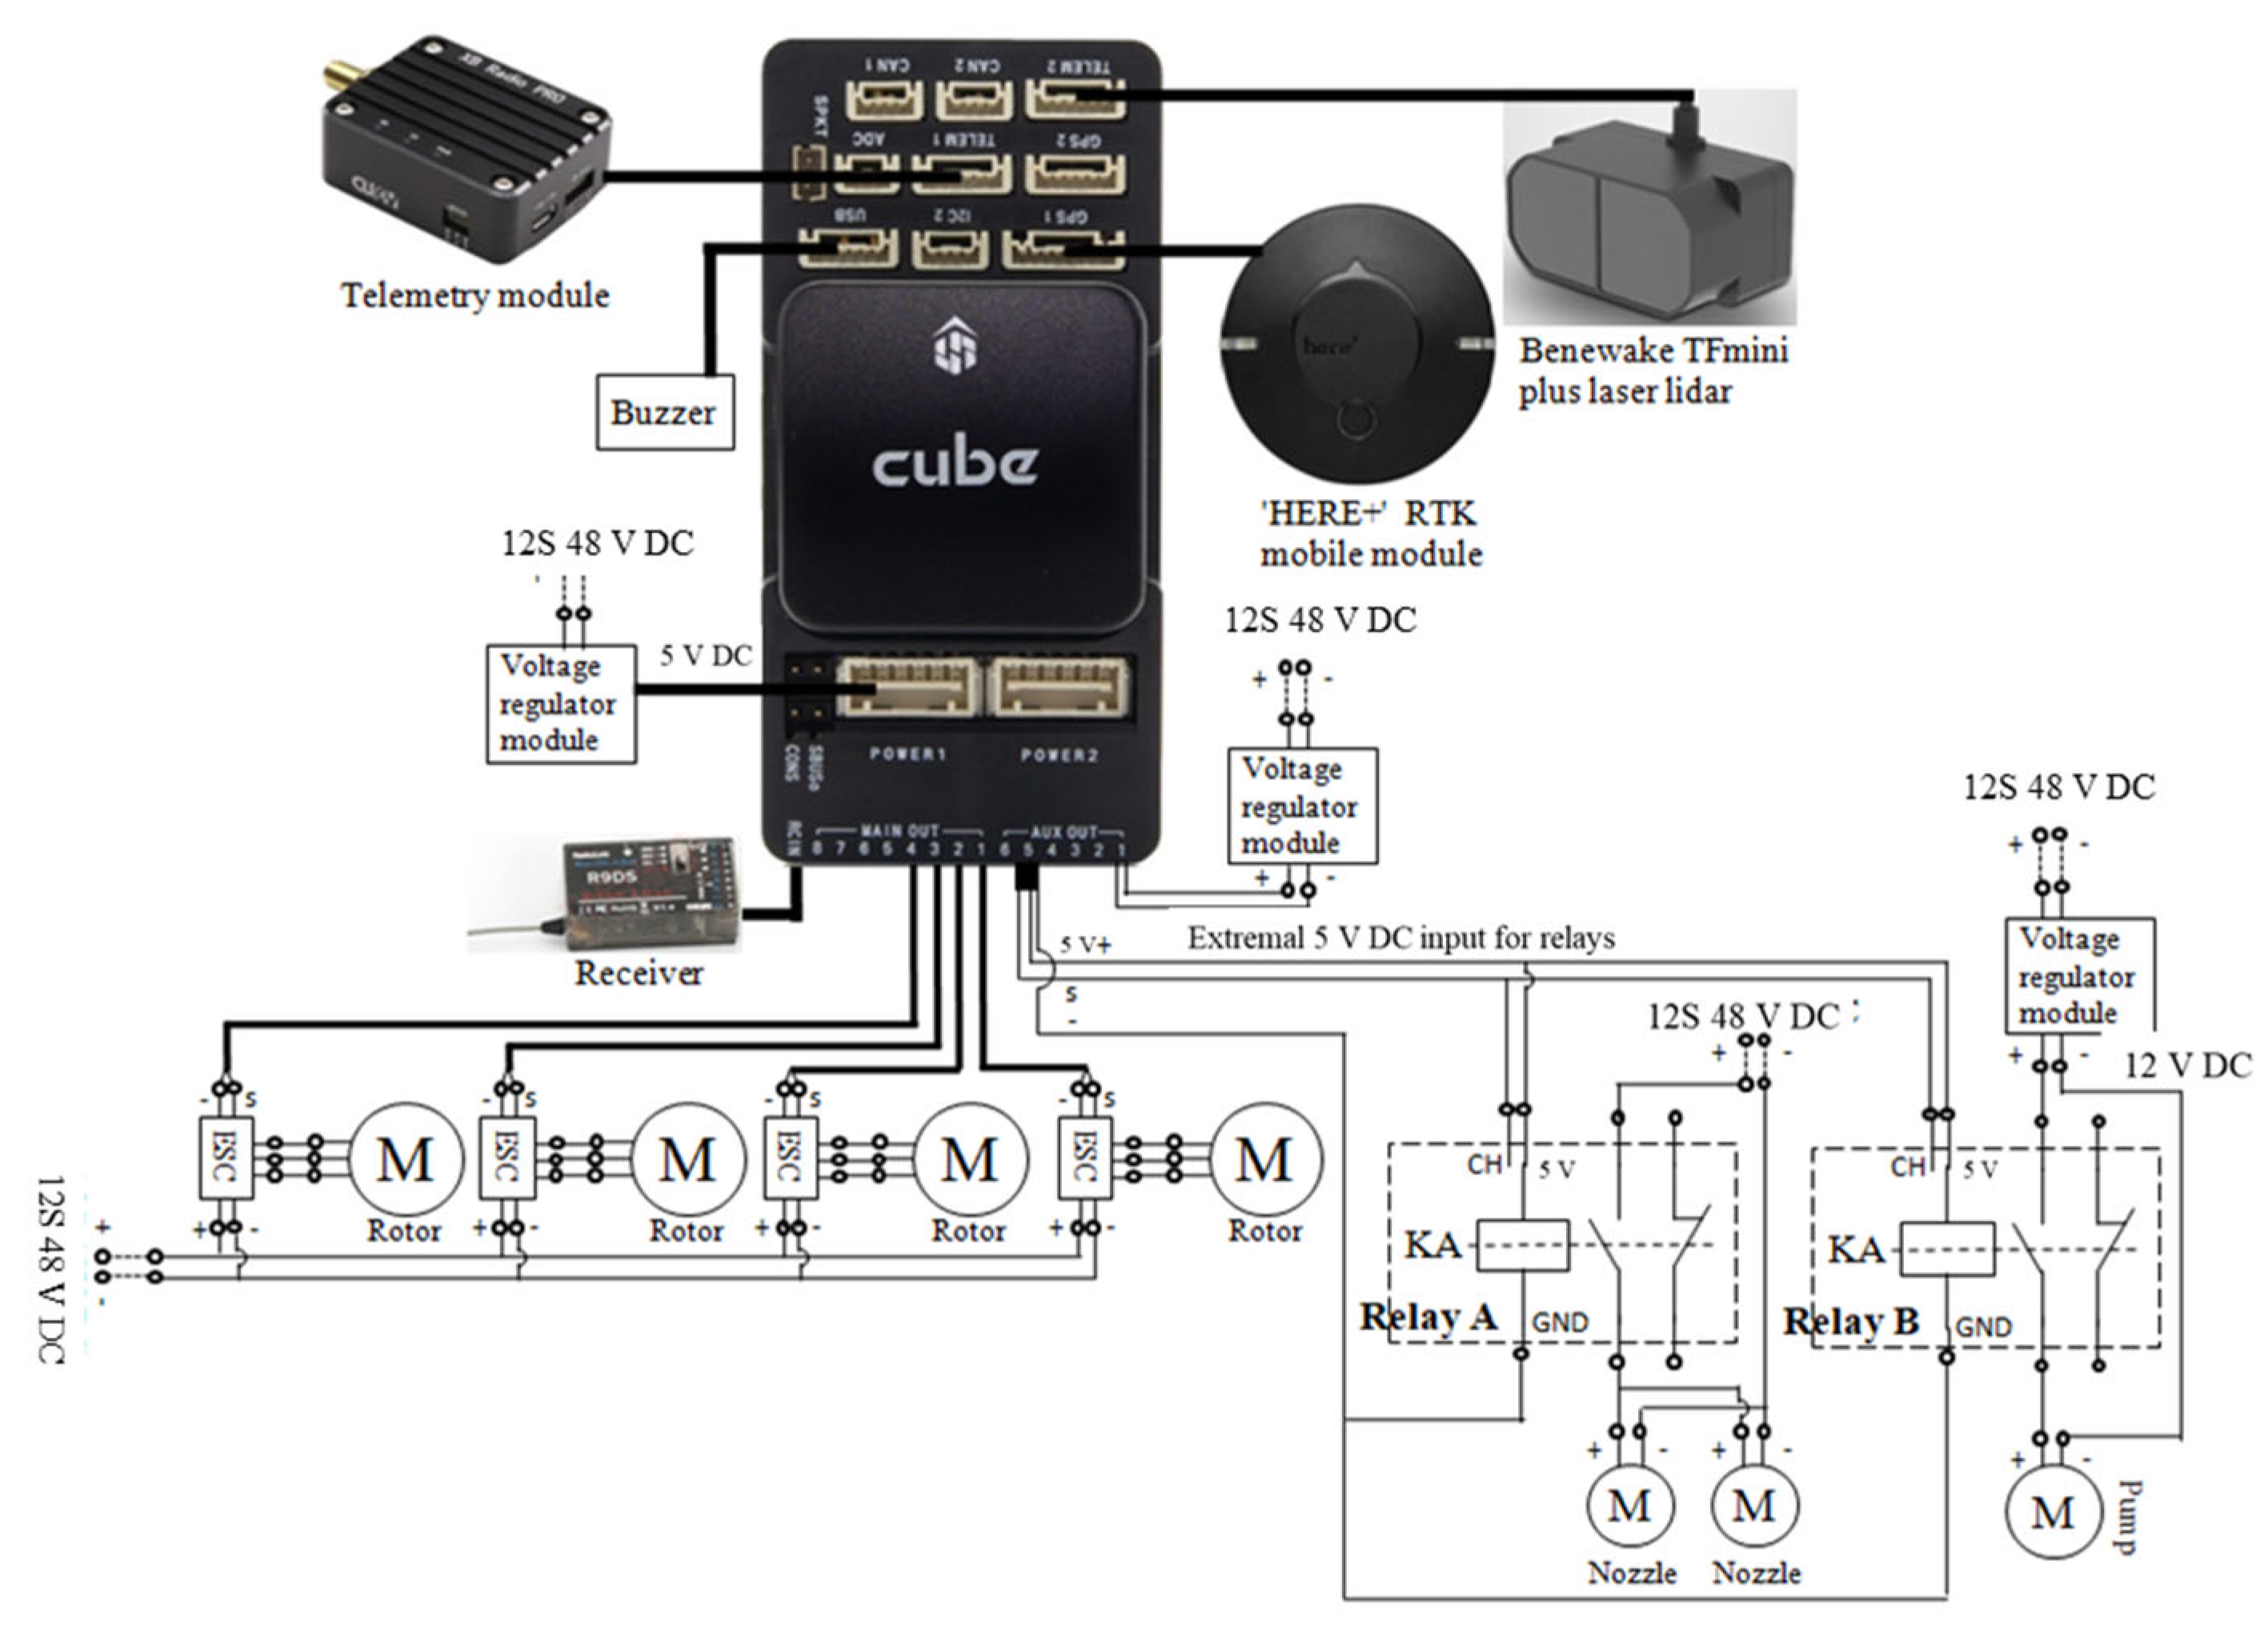
2.2. UAV Platform and Technical Parameters

The demonstration and dimensions of a four-rotor carbon-fiber UAV prototype are shown in Figure 4 and Figure 5. Two four-rotor UAV prototypes were built for the outdoor tests.
The deployed open-source flight controller Pixhawk 2 (RadioLink Electronics Co., Ltd., Shenzhen, China) and RTK mobile module “HERE+” were produced by ARDUPILOT and HEX Technology. The UAV power system consisted of two “10,000 mAh 22.2 V 25C 6 cells” lithium polymer batteries in series (generally expressed as 12S 48V DC) as the main power source, four Eaglepower Q9XL(8318) 100 kv brushless motors (Zhongshan Xiaoying Power Technology Co., Ltd., Zhongshan, China) with 30 inch carbon-fiber propellers and four XRotor-Pro-80A-HV (Shenzhen Hobbywing Technology Co., Ltd., Shenzhen, China) electronic speed controllers (ESCs). The four ESCs of the single UAV were controlled by the flight controller when flying under the autonomous flight mode in the field. For outdoor tests, the total take-off weight of a carbon-fiber UAV prototype was about 16.5 kg including batteries and 2 liters of water.
An electric wiring diagram of the electrical and control system is shown in Figure 6. Two relays (Relay A and B) were connected to the AUX OUT NO.5 that can be switched on or off by the 7th channel of the remote control. The simultaneous start and stop of the pump and nozzles can be realized by the two relays. Since there is only one “12S 48 V DC” main power source, several voltage regulator modules were deployed to obtain constant 12 V and 5 V DC input for the pump or relays. The Benewake TFmini Plus lidar sensor was deployed for altitude hold or terrain following. The Benewake TFmini Plus lidar sensor (Benewake (Beijing) Co., Ltd., Beijing, China) has an indoor range of 12 m and outdoor range of 7 m, and weighs only 5 g.
As illustrated in Figure 7, the spray system of the UAV prototype consisted of a 5-litre tank, a miniature direct current (DC) diaphragm pump (PLD-1206, 12 V, 45 W) and two centrifugal type nozzles which were purchased from XAG Co., Ltd., Guangzhou, China (model: XAG centrifugal nozzle 2018). The input voltage of the two centrifugal nozzles was around 48 V, provided by the two 22.2 V 6S lithium polymer batteries in series. The output flow rate of the DC diaphragm pump was 2.9–3 L/min when operated at a constant DC 12 V input, which was measured in advance. Only two centrifugal type nozzles were installed below the two rear rotors of each UAV, since normally only the two rear nozzles are turned on when flying forward in a real application, such as the aerial spraying application of the agricultural UAV XAG P20 2018 (XAG Co., Ltd., Guangzhou, China).

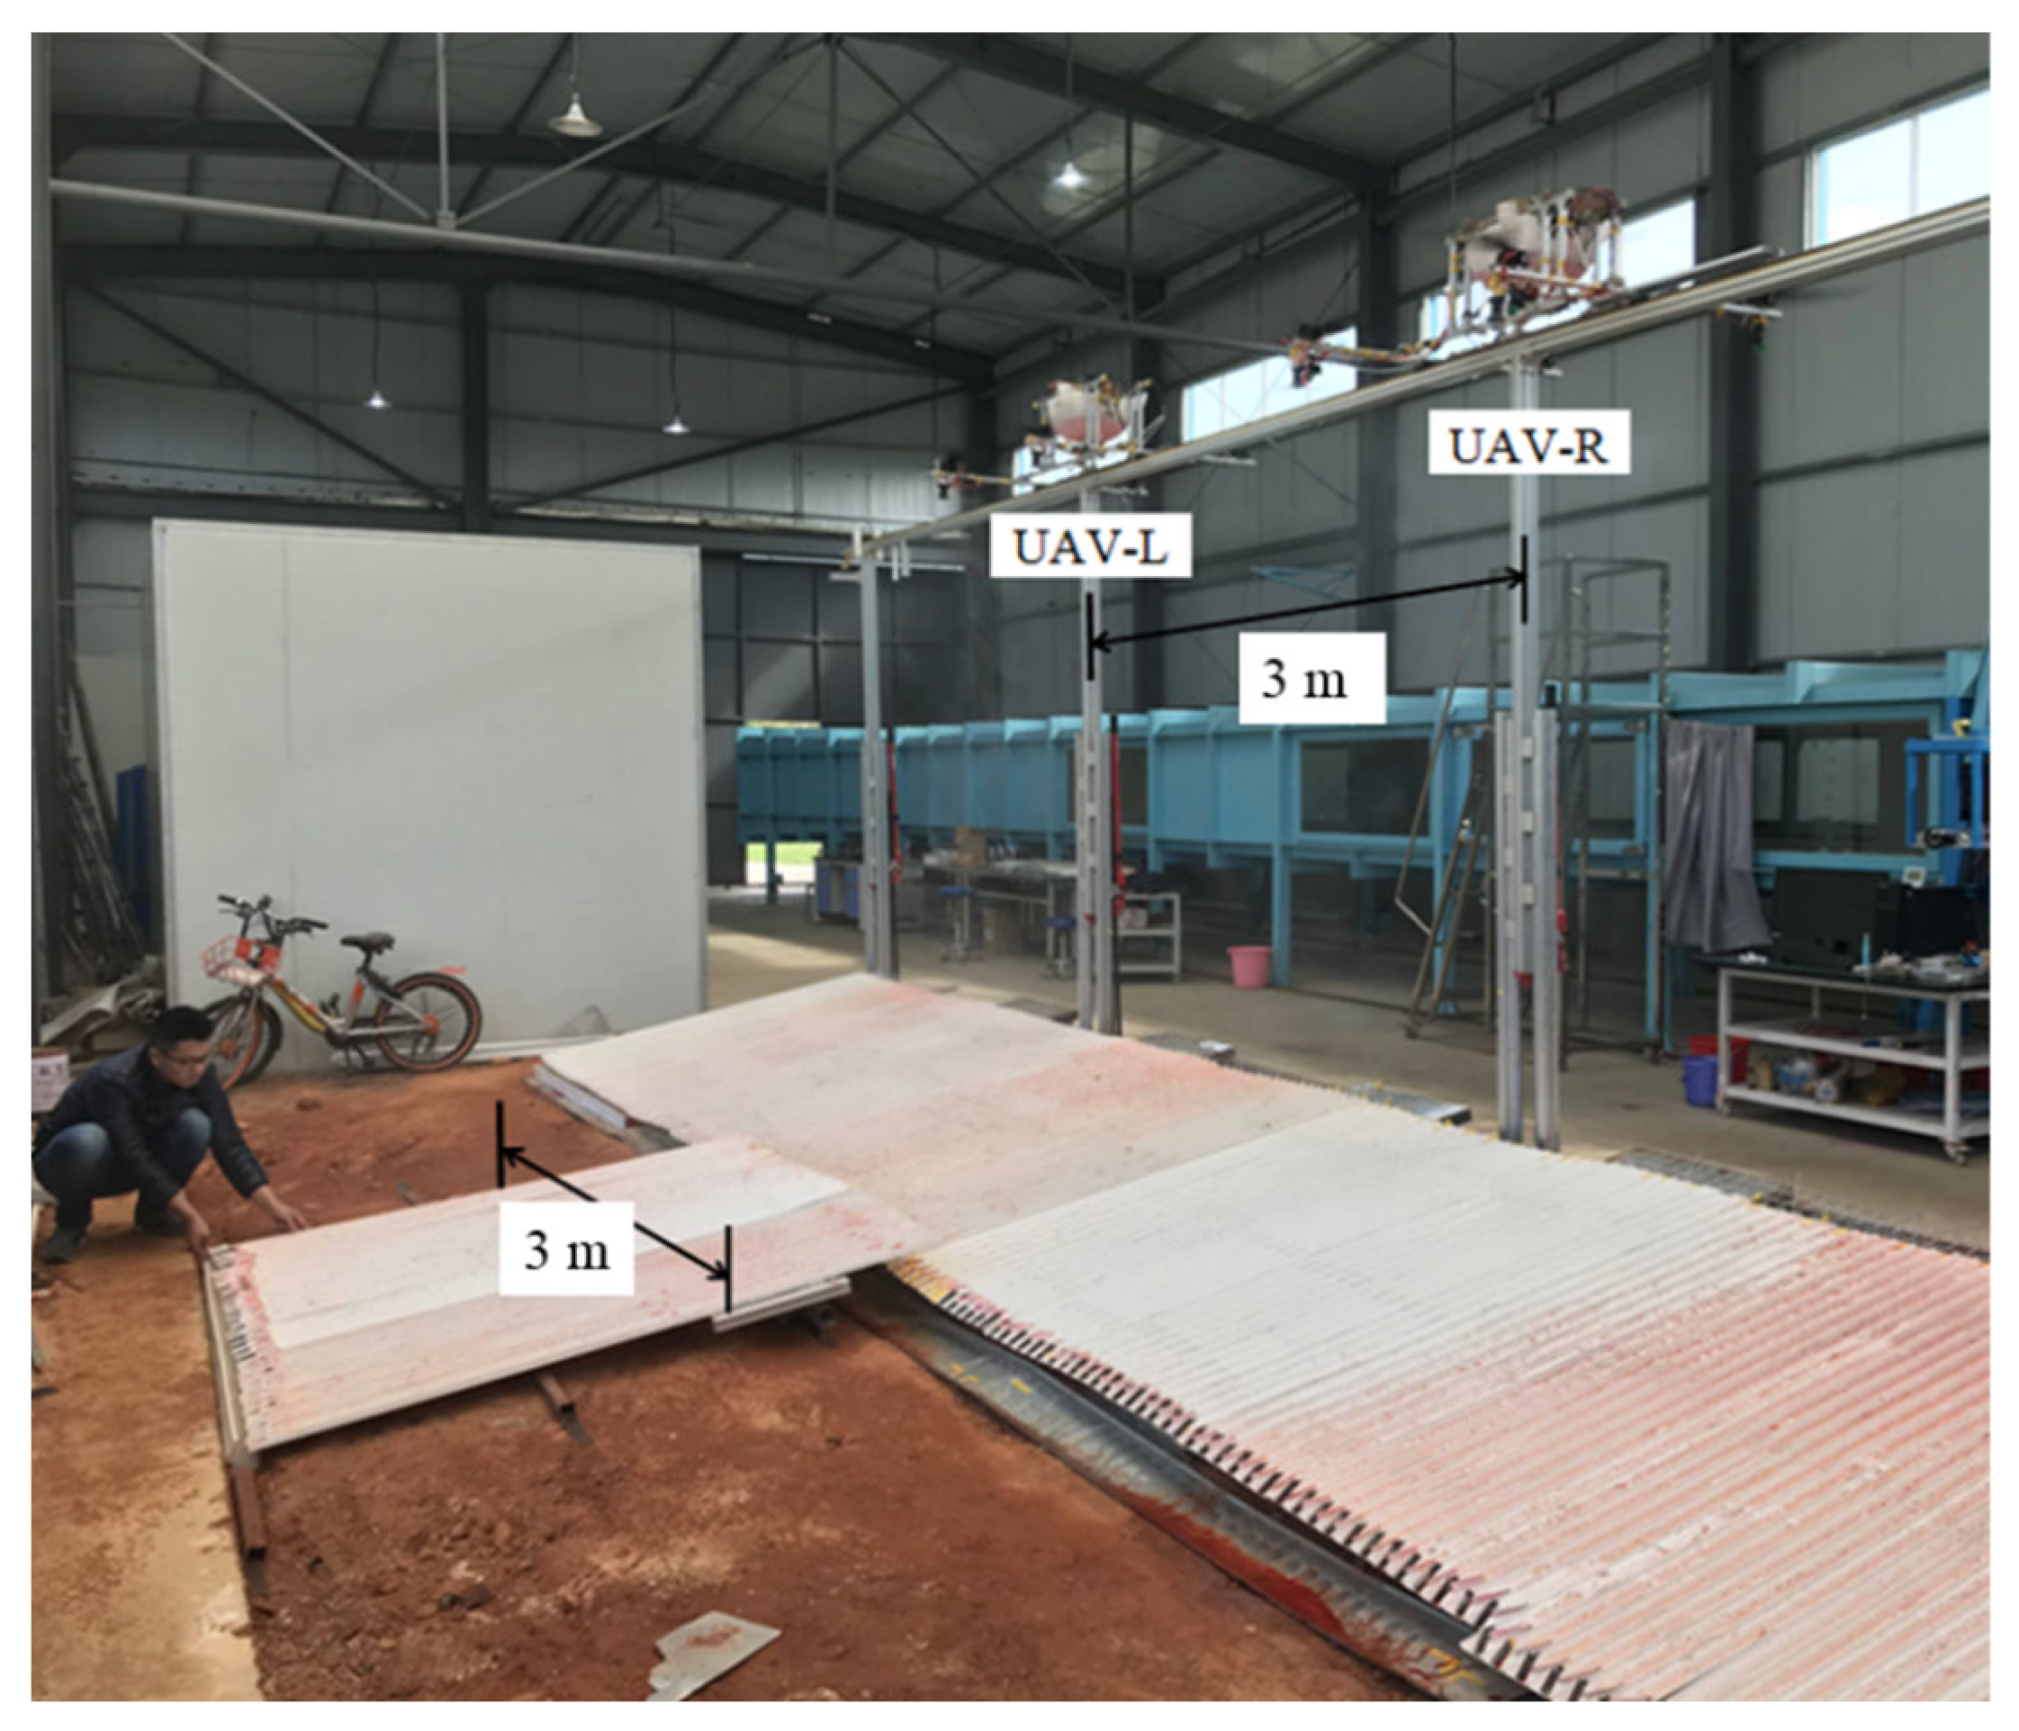
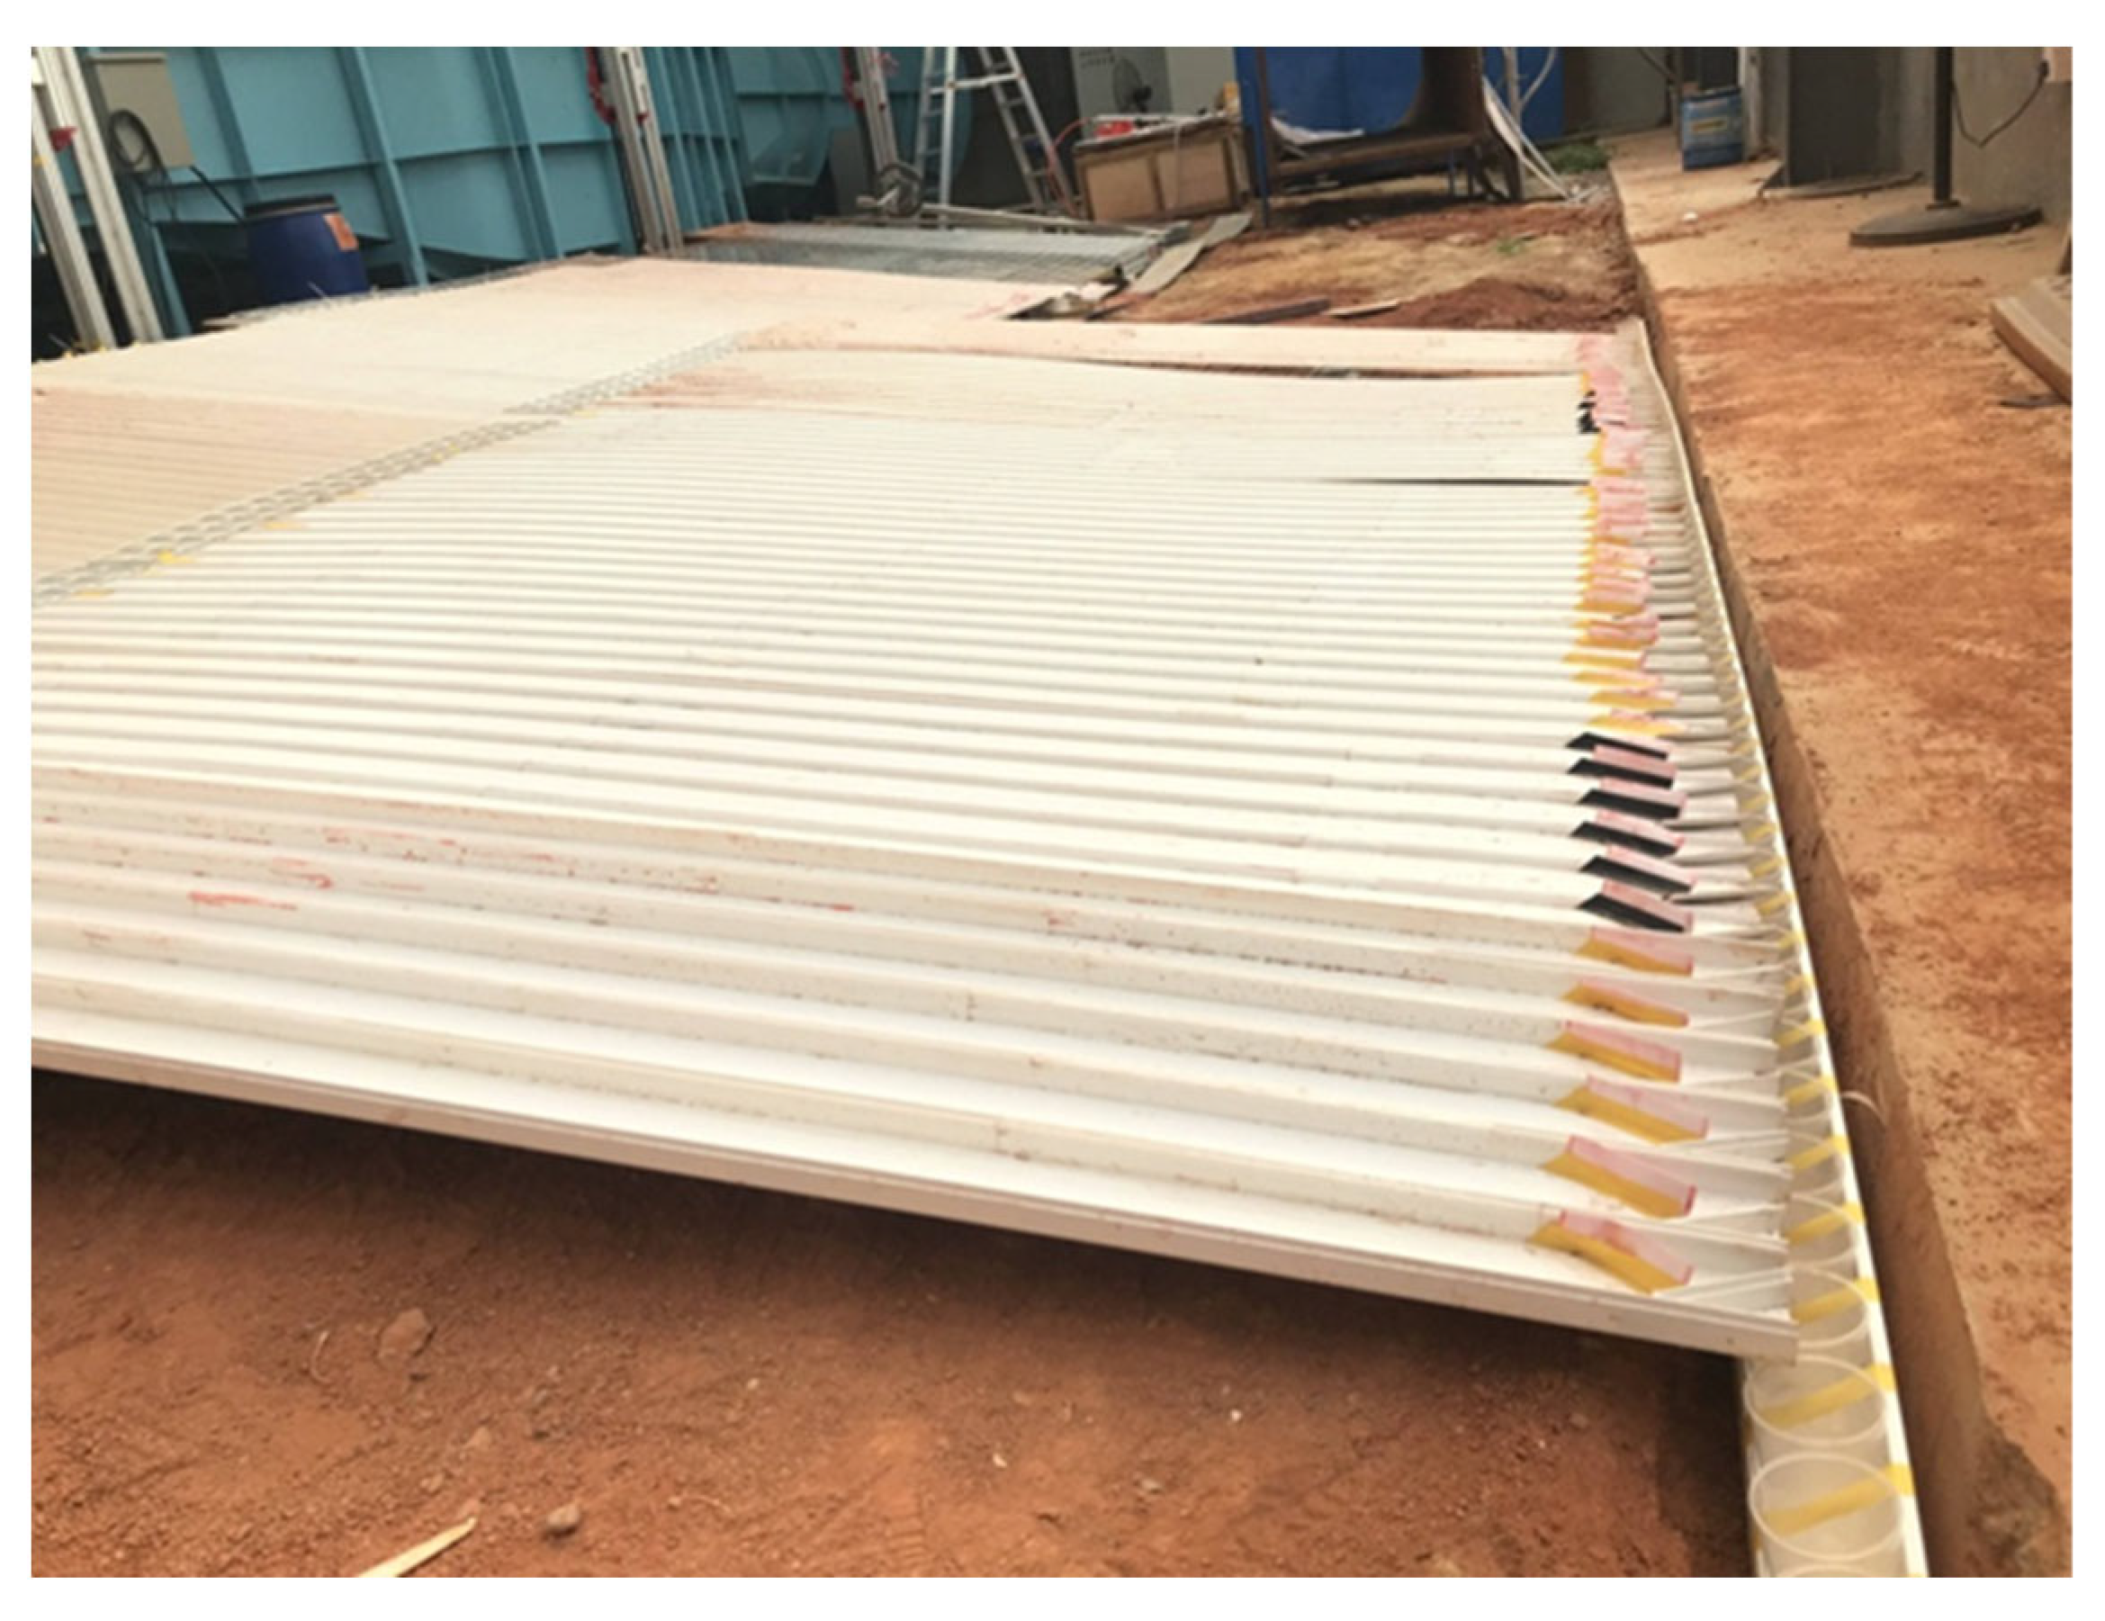
2.3. Indoor Tests of Dual-UAV Spraying

In order to explore the relationship between the downwash flows of two neighboring UAVs and droplet deposition before the outdoor tests, indoor tests were designed and implemented, as demonstrated in Figure 8, Figure 9 and Figure 10. An indoor test platform and two UAV prototypes were built for the indoor tests.
The height of the indoor test platform can be adjusted and locked accurately, which ranged from 2 m to 3 m. Two UAV prototypes were installed on the linear rail (Figure 9). The distance between the centers of the two UAV prototypes was equal to the spray swath width of a single UAV. The height of the indoor test platform was adjusted and locked at 3 m. The spraying height from the nozzles to the collecting flumes was 2.54 m. The spray swath width of a single UAV was between 2.6–3.2 m according to the results of the measurement in advance. Therefore, the distance between the centerlines of two UAV prototypes was set to 3 m. Collecting flumes with a width of 6 cm were connected in parallel and installed obliquely beneath the two UAVs on the ground with measuring cups used for collecting the water.

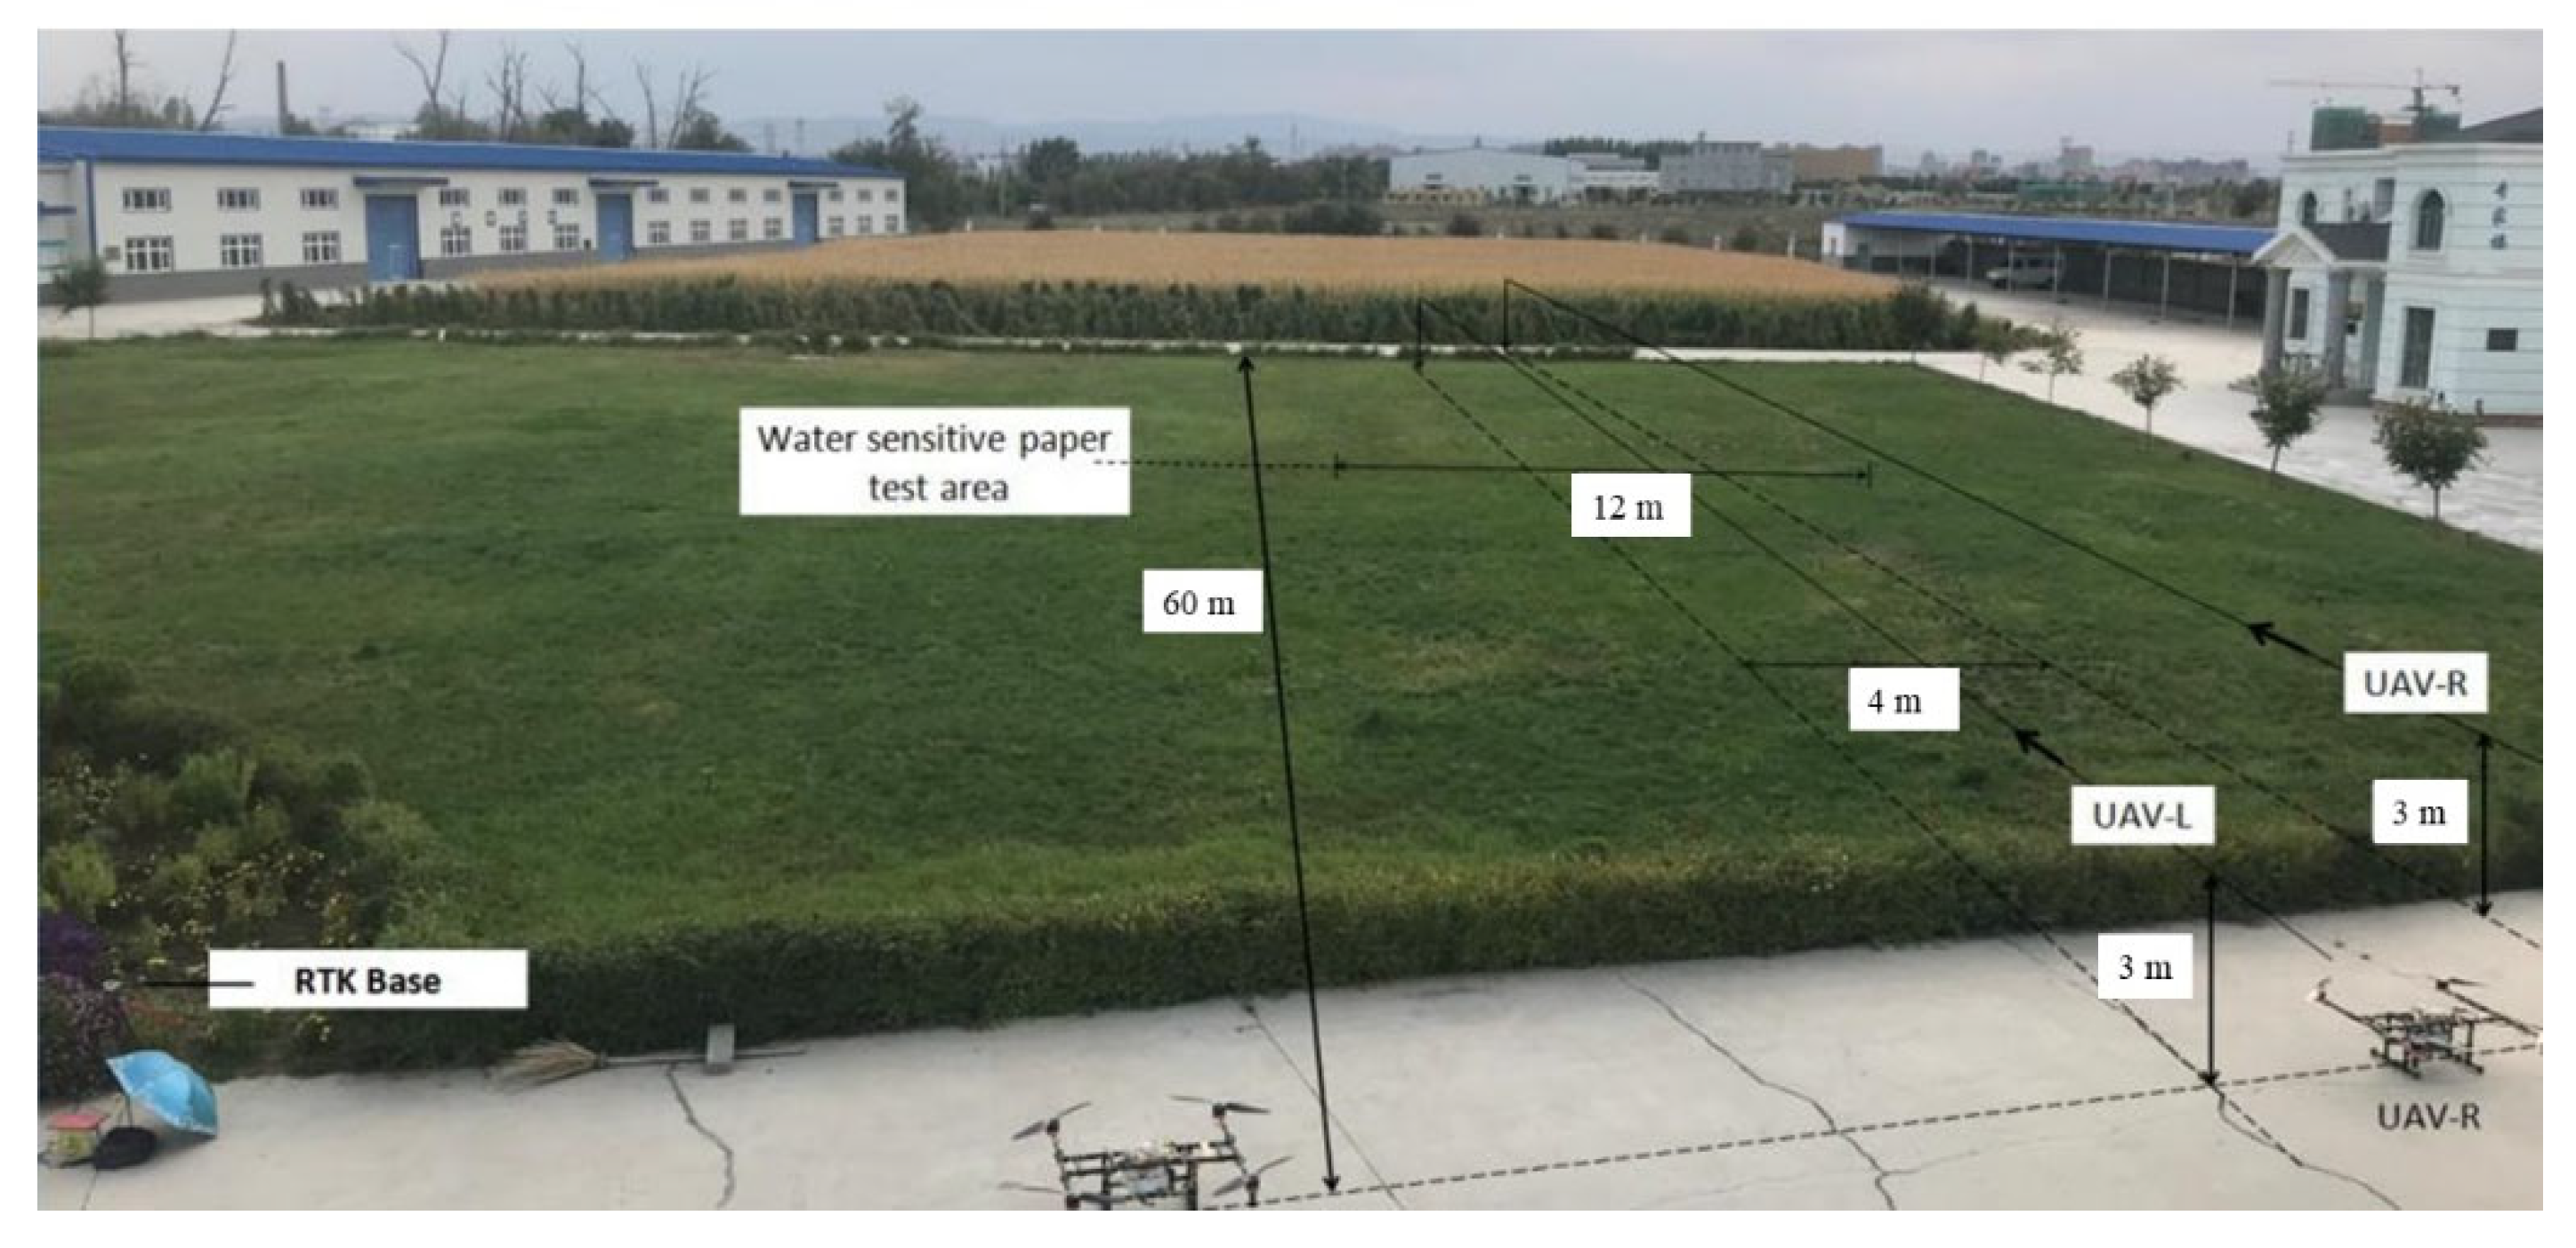
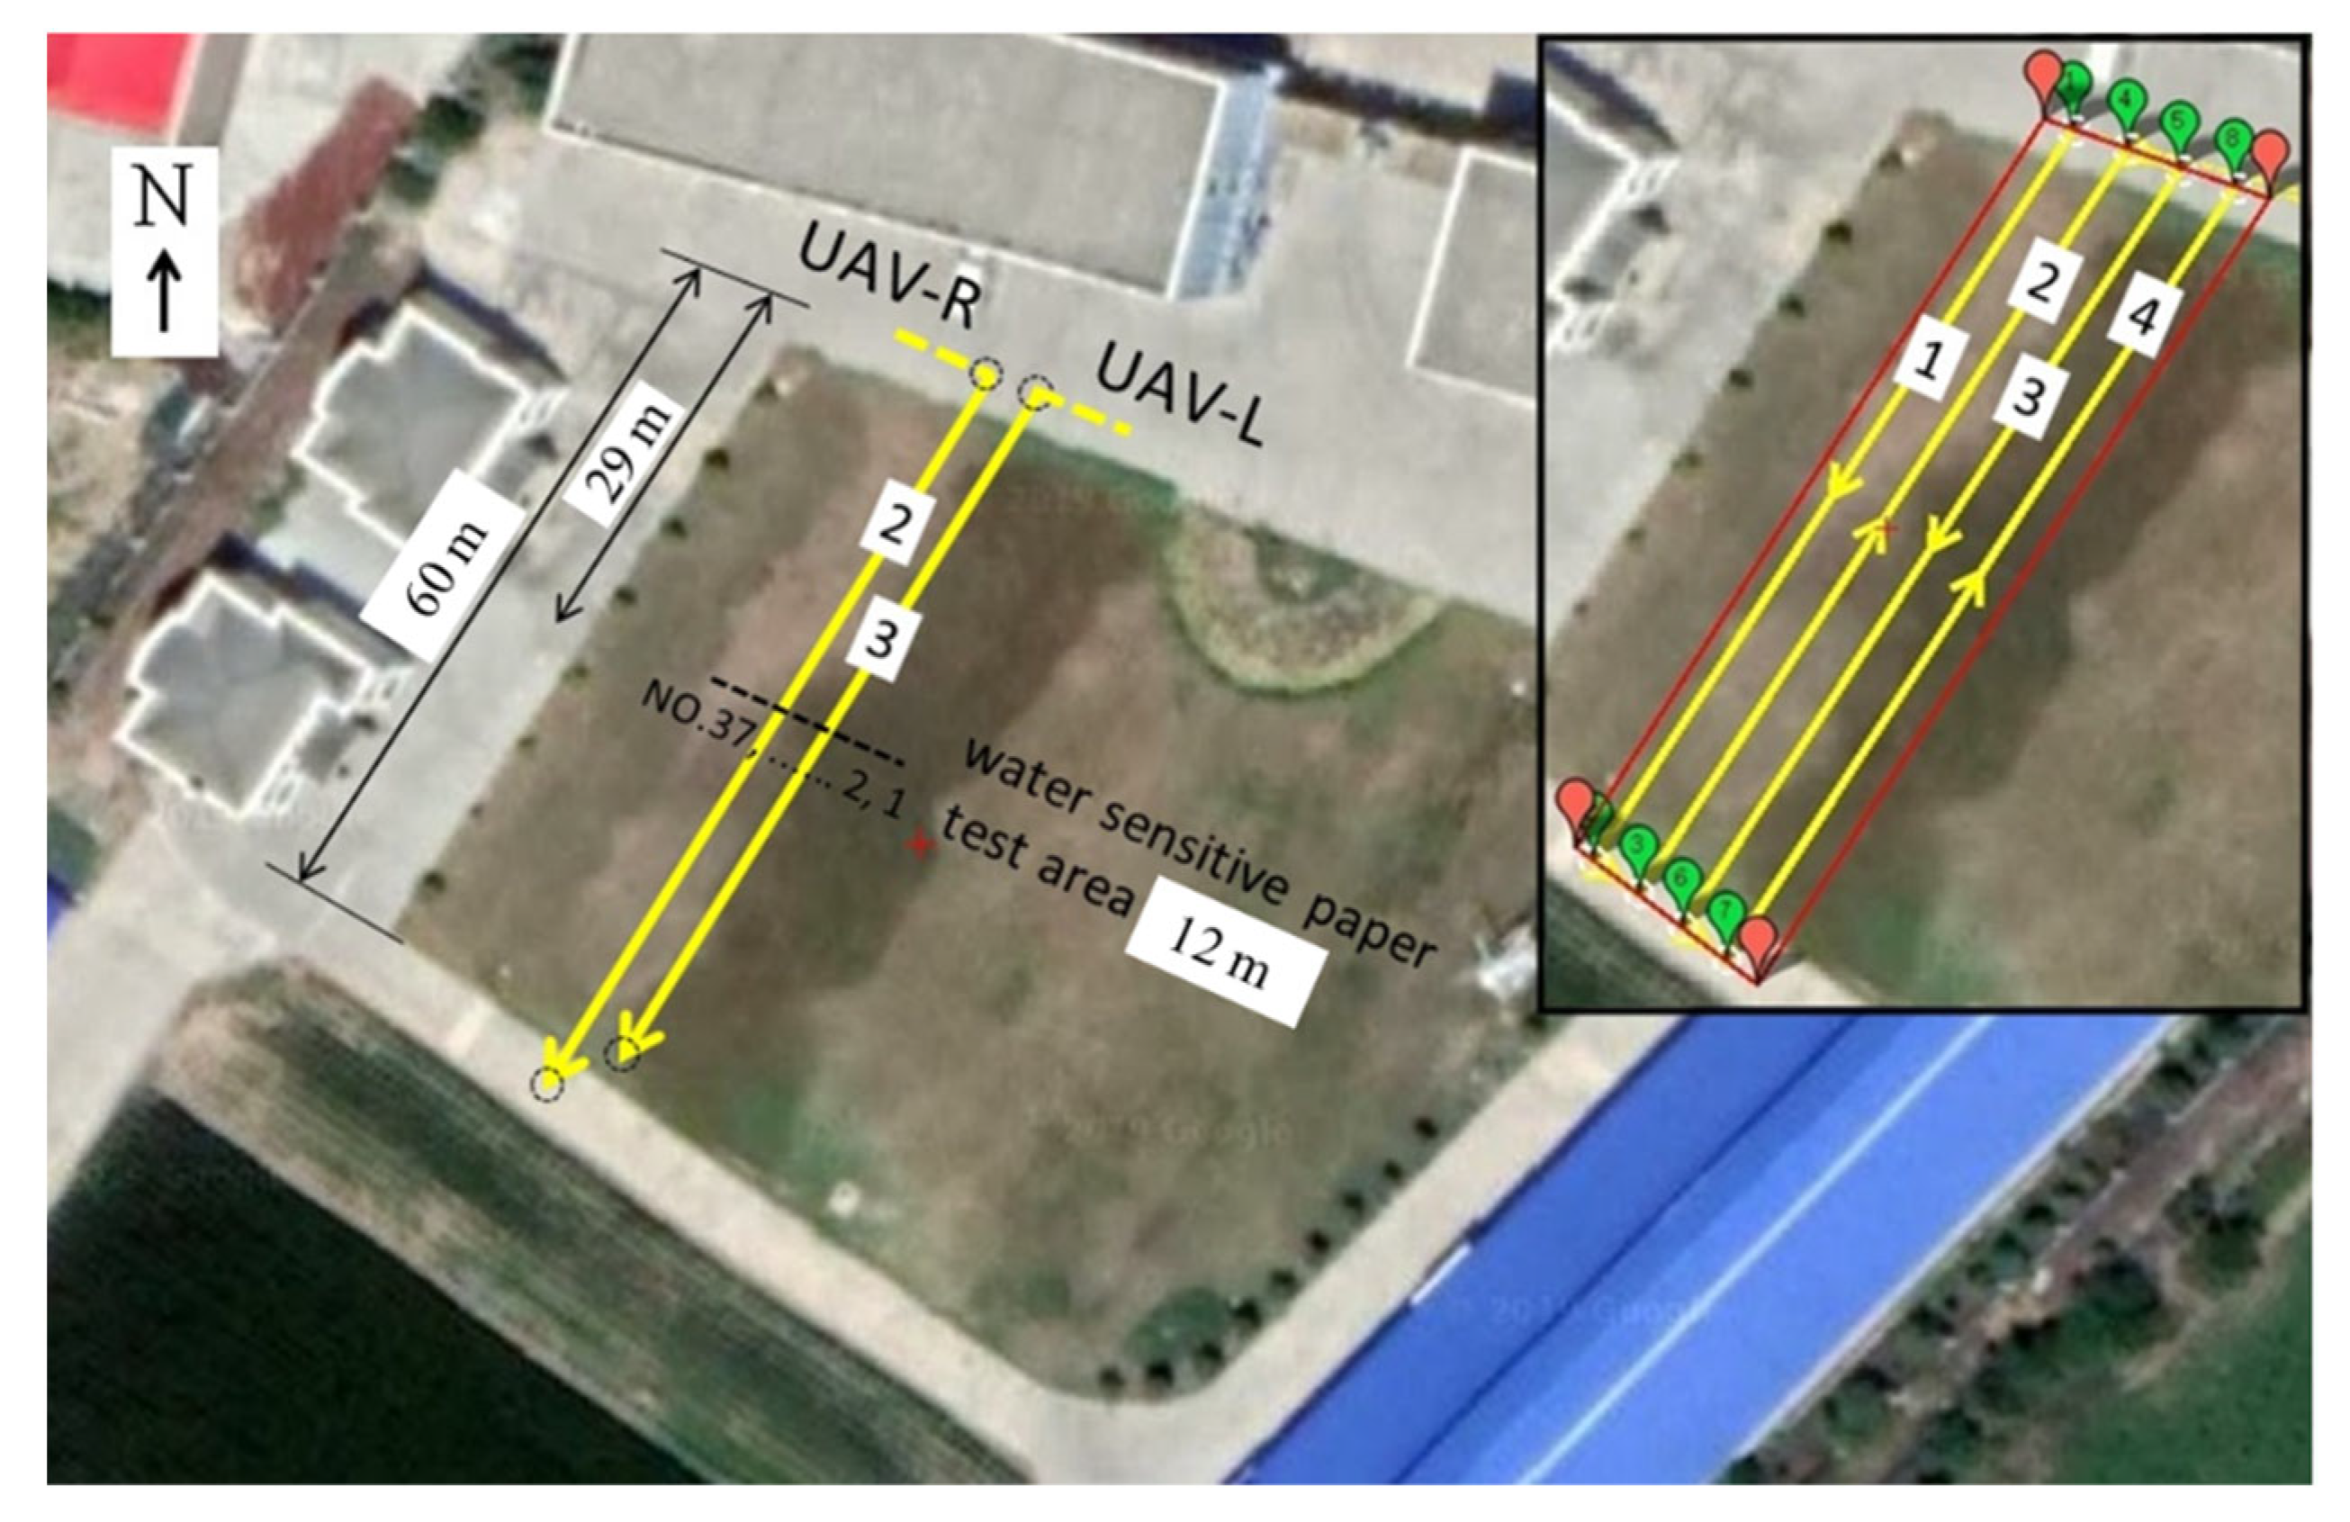
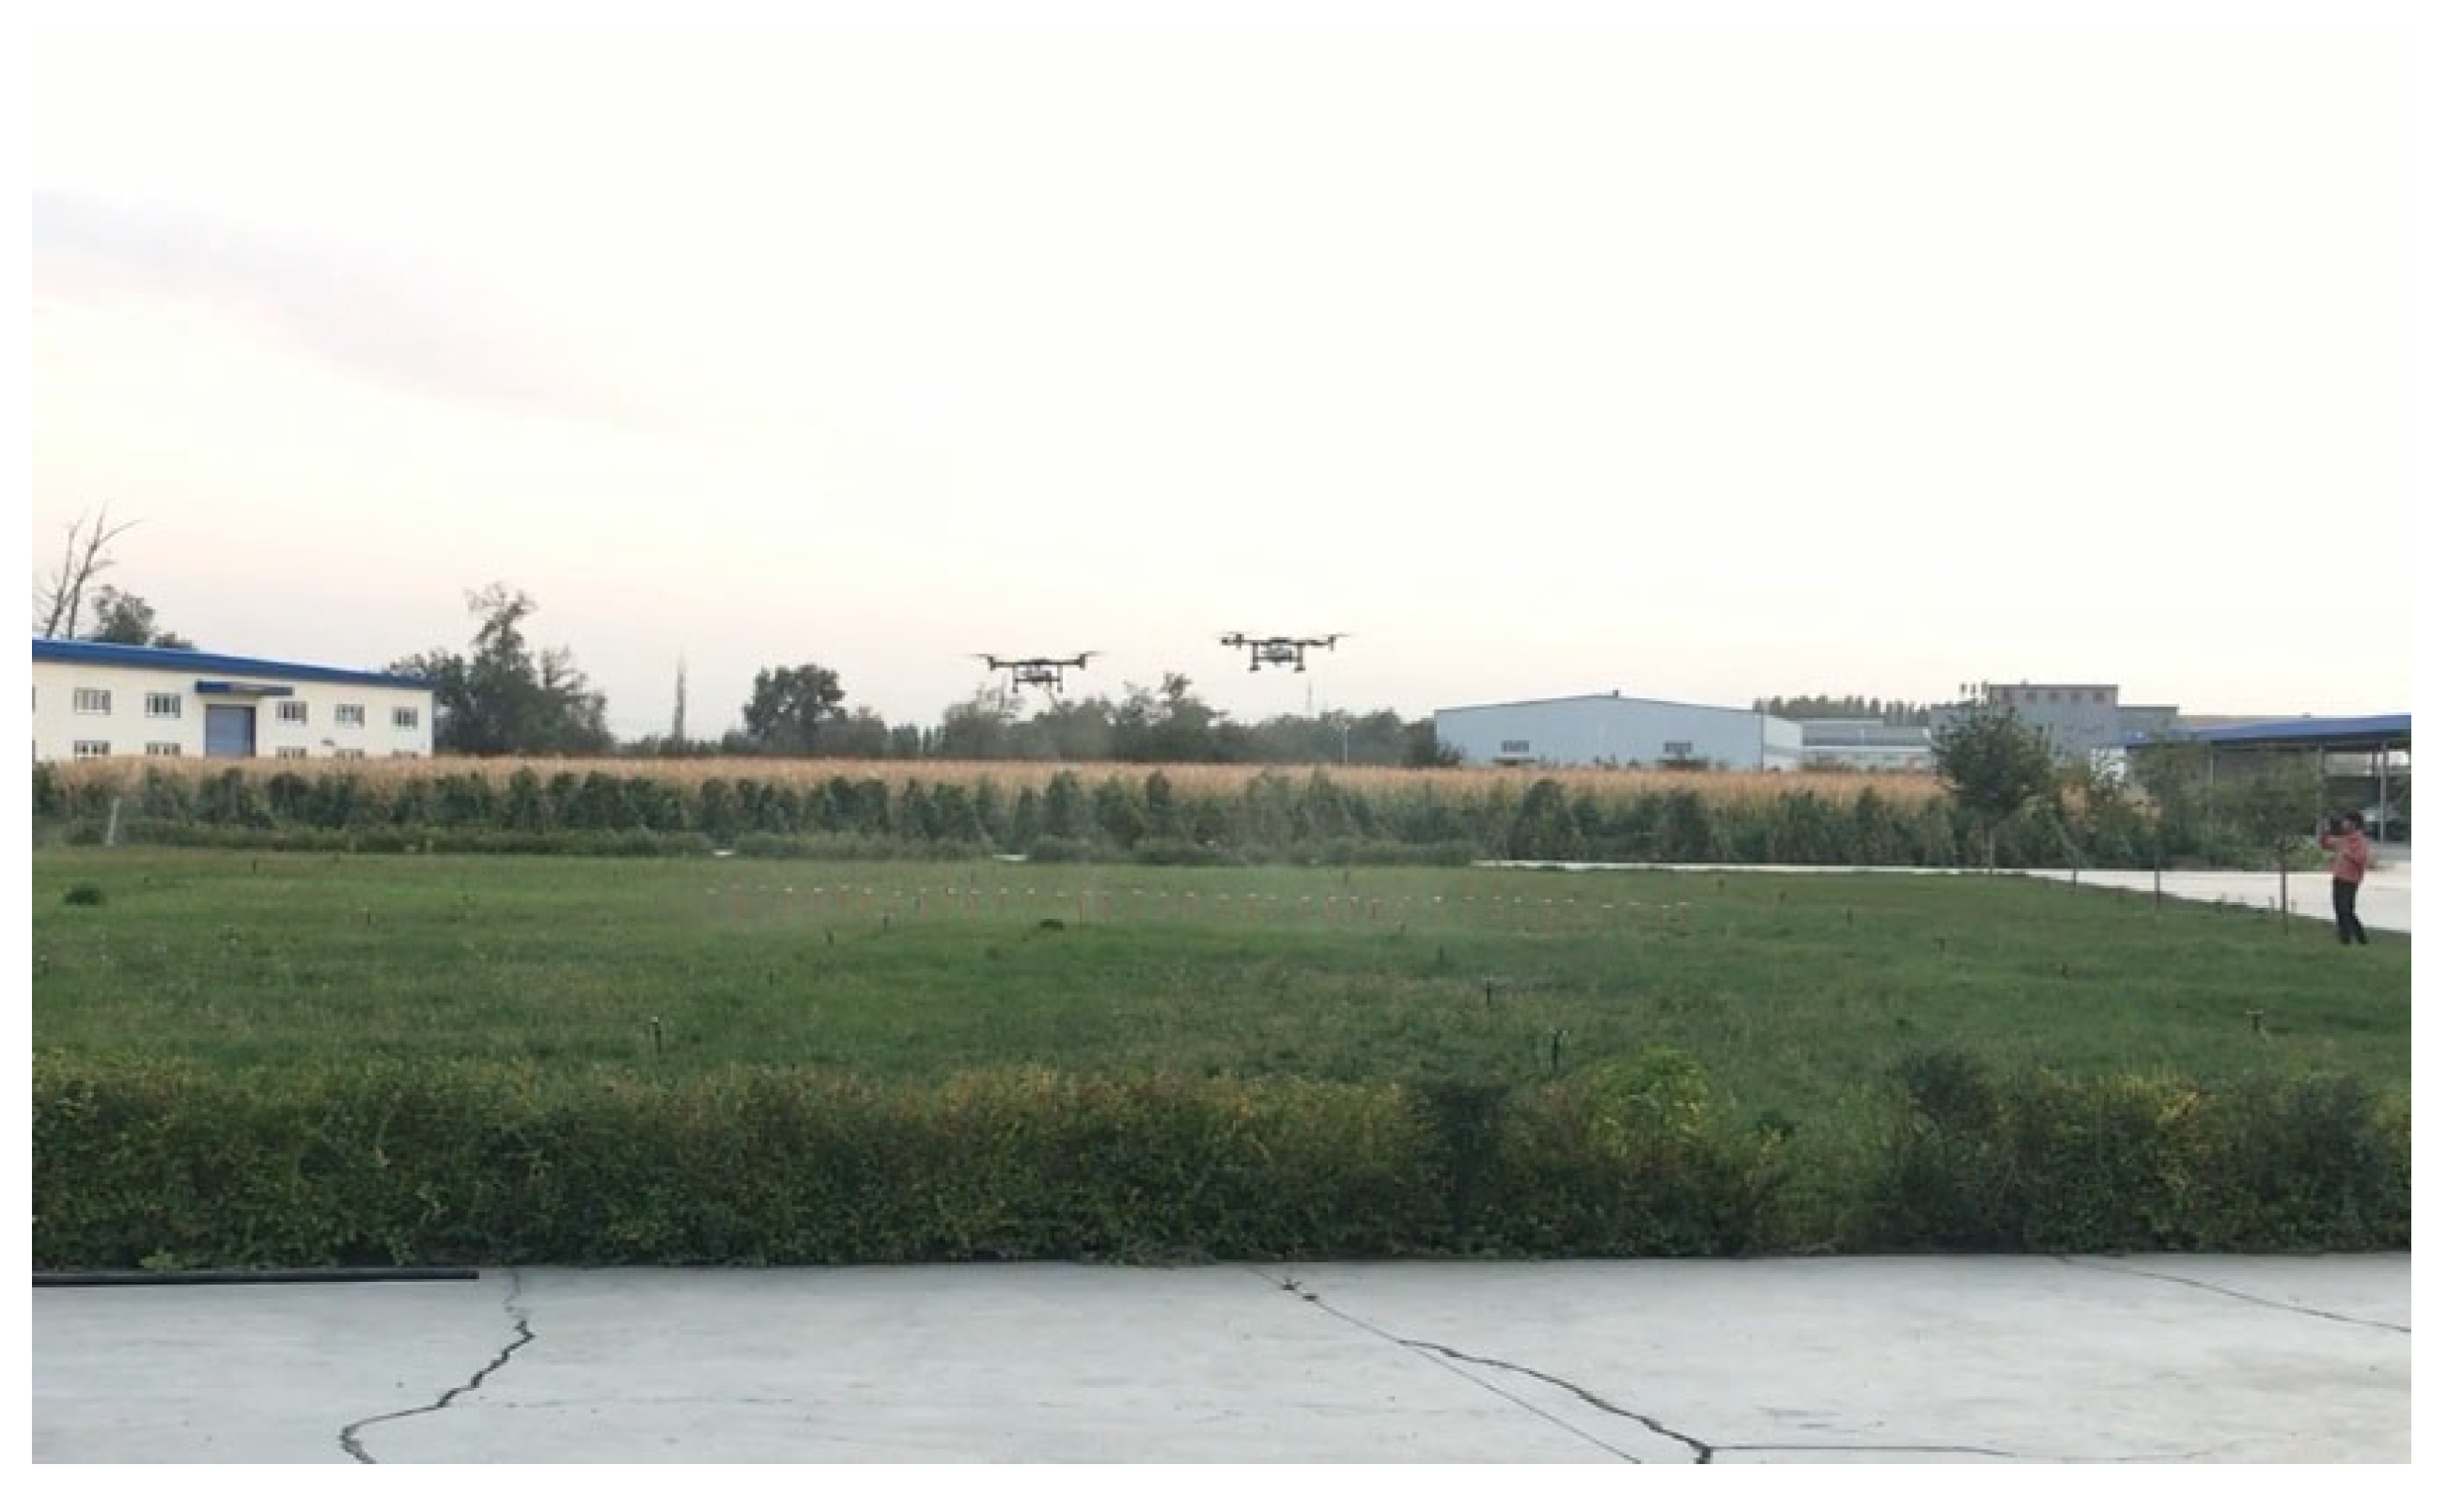
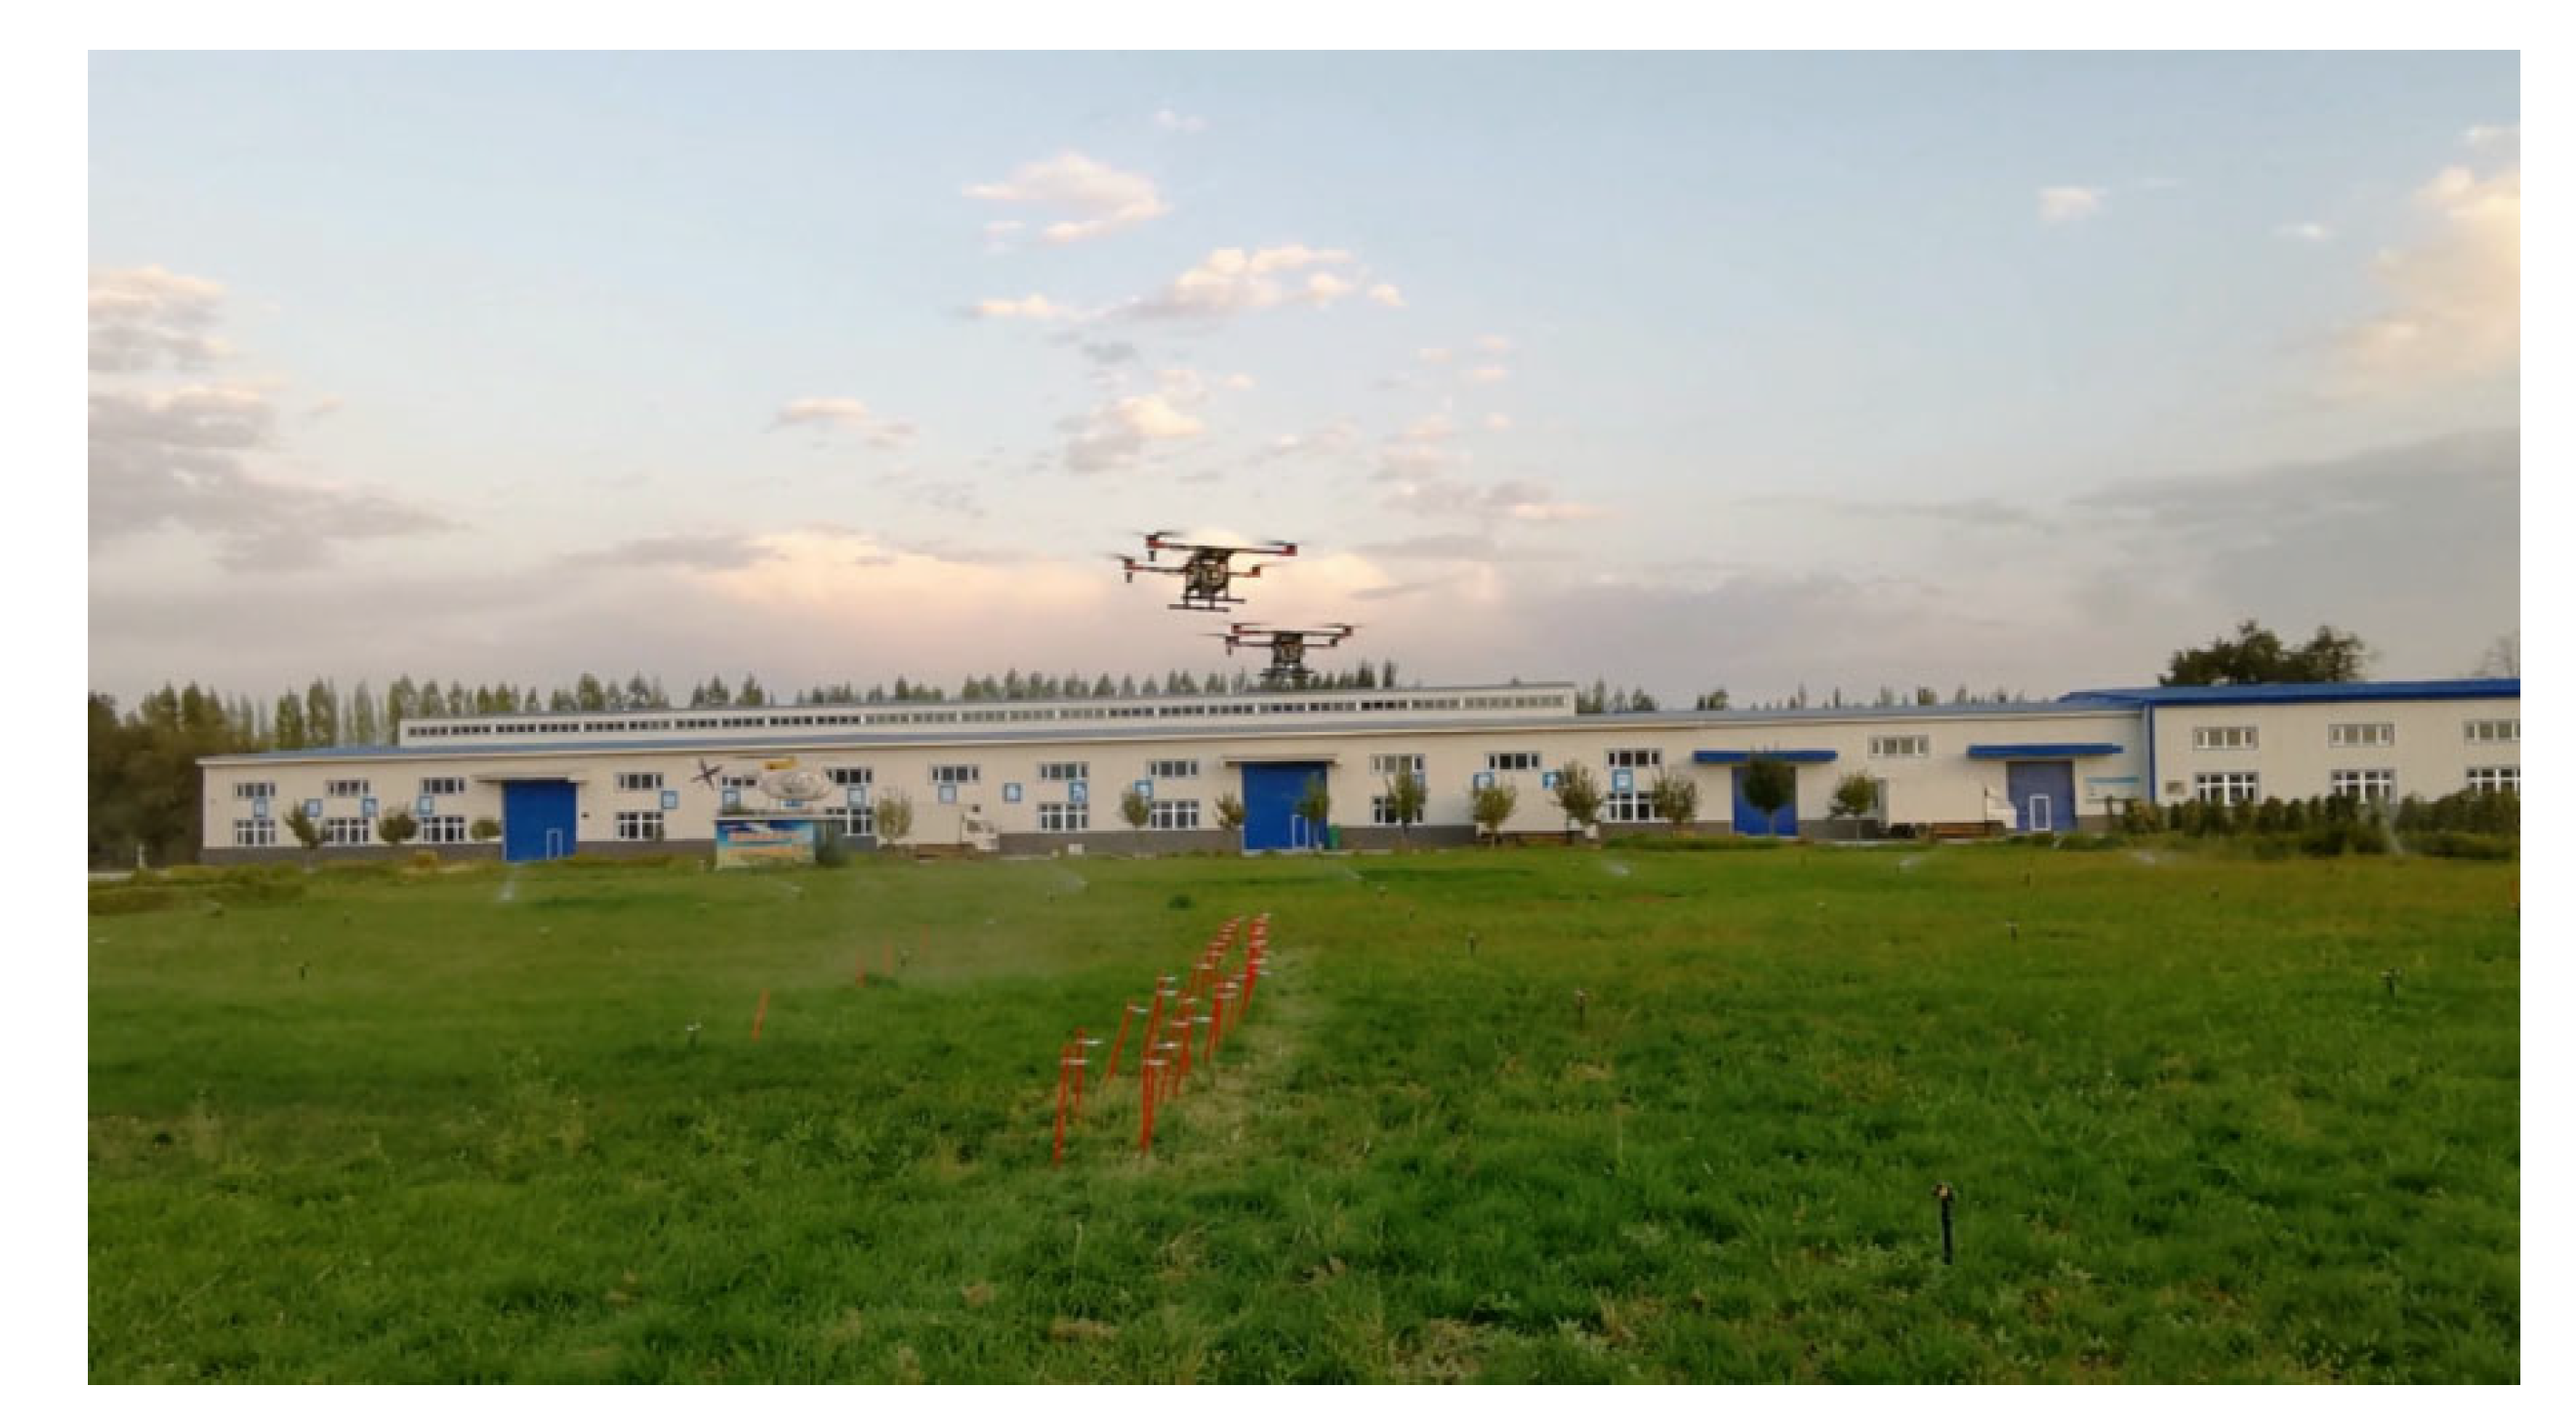
2.4. Outdoor Tests of Dual-UAV

2.4.1. Path Planning

As it is shown in Figure 11, the outdoor tests were carried out at the base of Xinjiang Tianshan Yuren Agricultural Aviation Technology Co., Ltd., located in Changji, Xinjiang in China. A “Here+” RTK portable base (Hexing (Xiamen) Electronics Co., Ltd., Xiamen, China) was self-calibrated and set up in advance. The UAV-L and UAV-R were the two UAV prototypes used in the outdoor experiments.
The waypoints, landing destinations (GPS coordinates), paths and directions of the UAV-L and UAV-R were designated in advance in the ground station software “Mission Planner”, as shown in Figure 12. Only the fully autonomous flight mode was used in the outdoor experiments, except during unlock and take-off. The take-off time of the UAV-L and UAV-R were controlled by two remote controls independently to generate an expected time difference t. Since all the parameters and setup of the UAV-L and UAV-R were the same, the formation and the time difference t can be controlled by different take-off times.
The test method of the spraying swath width was given in standard NY/T 3213-2018 (2018) to check the sampling points (water-sensitive papers) from both ends of the sampling area. According to the actual tests, the spraying swath width of the UAVs was 3 m–4 m (depending on the flying height). However, when the line spacing is set to 3 m, the nearest horizontal distance between the two UAVs (the distance between the edges of two UAV propellers) is 0.98 m, which is too dangerous because flight errors need to be taken into account as well. Moreover, the parameter setting of line spacing can only be set as an integer. Therefore, in order to ensure the safety of the experiments and avoid collision, the line spacing of the two paths of the UAV-L and UAV-R was set to 4 m in the ground station software (ArduPilot Dev Team, Griffith; Australia). In this case, the nearest horizontal distance between the two UAVs was 1.98 m.
The flight height of the two UAVs was set to 3 m and the water-sensitive papers (WSPs) were clamped on the clips at a height of 0.5 m above the ground. Therefore, the actual height from the nozzles to the water sensitive papers was approximately 2.5 m, which represents the operational height above the crop canopy. The flying speed was set to 3 m/s and 5 m/s as the representatives of low-speed and high-speed spraying applications, respectively.

2.4.2. Experiment Design

A total of 18 sets of outdoor experiments were carried out. There were six simultaneous spraying tests and three sequential spraying tests at each flying speed, which are numbered and summarized in Table 1 and Table 2. To facilitate the analysis of the test results, simultaneous spraying was divided into short-interval simultaneous spraying and long-interval simultaneous spraying, according to the time difference t between two UAVs as explained in Section 2.1 We took side-view and front-view videos for all flight experiments (Figure 13 and Figure 14). The time difference t between the two UAVs in the forward direction listed in Table 1 was obtained by watching the aerial spraying videos (side view) and timing with a stopwatch. Because the time difference t is realized by two persons separately controlling the take-off time, manual control of the take-off time cannot guarantee the accurate realization of “side by side” t = 0 s. When the time difference t is less than or equal to 1 s, it is considered as short-interval simultaneous spraying, and when t is greater than 1 s, it is considered as long-interval simultaneous spraying.
The environmental parameters were collected by the Kestrel weather meter (model NK-5500, Nielsen-Kellerman Co., Boothwyn, PA, 209 USA) with a collection frequency of 2 s, and include temperature, humidity, wind direction, wind speed, etc.

2.5. Data Analysis

After the laboratory test was completed, a balance was used to weigh the water in the measuring cup. In the pre-experiments, it was found that under the influence of the wind field, the fog droplets drifted to the rear of the collector. The cups in the first row could not collect enough droplets, thus a droplet collection area in the second row was set up, as shown in Figure 9. The results for the overlapping areas of the spray patterns in this study used the data in the second row.
Syngenta water-sensitive papers were used in the outdoor experiments, which were purchased from Beijing Leixina Environmental Technology Development Co., Ltd., Beijing, China As it is shown in Figure 14, a sampling and testing area with an interval of 0.33 m and a width of 12 m was set up with a total of 37 sampling staffs and clips to accommodate two spraying swath widths. Water-sensitive papers (WSPs) were clamped on the clips and the clips were fixed on the sampling staffs at a height of 0.5 m above the ground. WSPs were scanned in grayscale at 600 DPI to produce a digital image. Images were analyzed using the DepositScan™ software (Department of Agriculture, Agricultural Research Service, Wooster, OH, USA) to analyze and calculate droplet density and coverage.
The uniformity of droplet distribution affects the distribution of pesticide droplets in the horizontal spatial position. The coefficient of variation (CV) was calculated to study the uniformity of droplet distribution. The smaller the CV is, the better the uniformity of droplet distribution is. It was calculated by the following equation:
C V = S D X × 100 %           S D = i = 1 n x i X 2 n 1      
where SD is the standard deviation; X means the average coverage or droplet density; xi is the coverage or droplet density per square centimeter of water-sensitive paper (WSP); n is the total number of WSPs in each UAV treatment.

3. Results

3.1. Comparison Results with Indoor Test

Figure 15 shows the droplet weight data of 53 measuring cups that were 3.12 m-wide behind the dual-UAVs, as demonstrated in droplet collection area 2 of Figure 8 The indoor test only focused on the deposition between the two centerlines of the UAV-L and UAV-R, which was narrower than the first indoor test. From the results, it is obvious that the droplet deposition data of the simultaneous spray is increased by 25–100% compared with the data of the sequential spray. The average increase in droplet deposition is more than 50%, which implies that the dual-UAV simultaneous spray can improve the deposition behind the two UAVs. This result provides the basis and motivation for outdoor experiments.
The location within the two dashed lines in the figure is the area where the sprays overlap outside the fuselage of the aircraft (S1 in Figure 16). The outdoor test results are shown in Figure 17 and Figure 18. Within this area, the deposition distributions of the three modes showed differences, whereas the spray droplet distribution of the long-interval mode was lower than that of the other two modes. At a flight speed of 3 m/s, the droplet density and coverage of the long-interval pattern of simultaneous spraying were lower, whereas the deposition distribution of the sequential spraying remained relatively consistent with that of the simultaneous spraying (short interval). At 5 m/s, the droplet density and coverage rate of the short-interval mode of simultaneous spraying was the best, followed by the sequential spraying, and the droplet distribution of the long-interval mode of simultaneous spraying was poor.
It can be seen that the outdoor results are consistent with the indoor spraying results at 5 m/s. The spraying short-interval mode can improve the droplet deposition distribution in the overlapping spraying area. However, the difference decreases with the decrease in flight speed. When the flight speed is 3 m/s, the deposition distribution of simultaneous spraying with a short-interval mode is equal to or slightly lower than sequential spraying. The spraying results of the long-interval mode were not covered in the indoor test and, therefore, were not comparable.

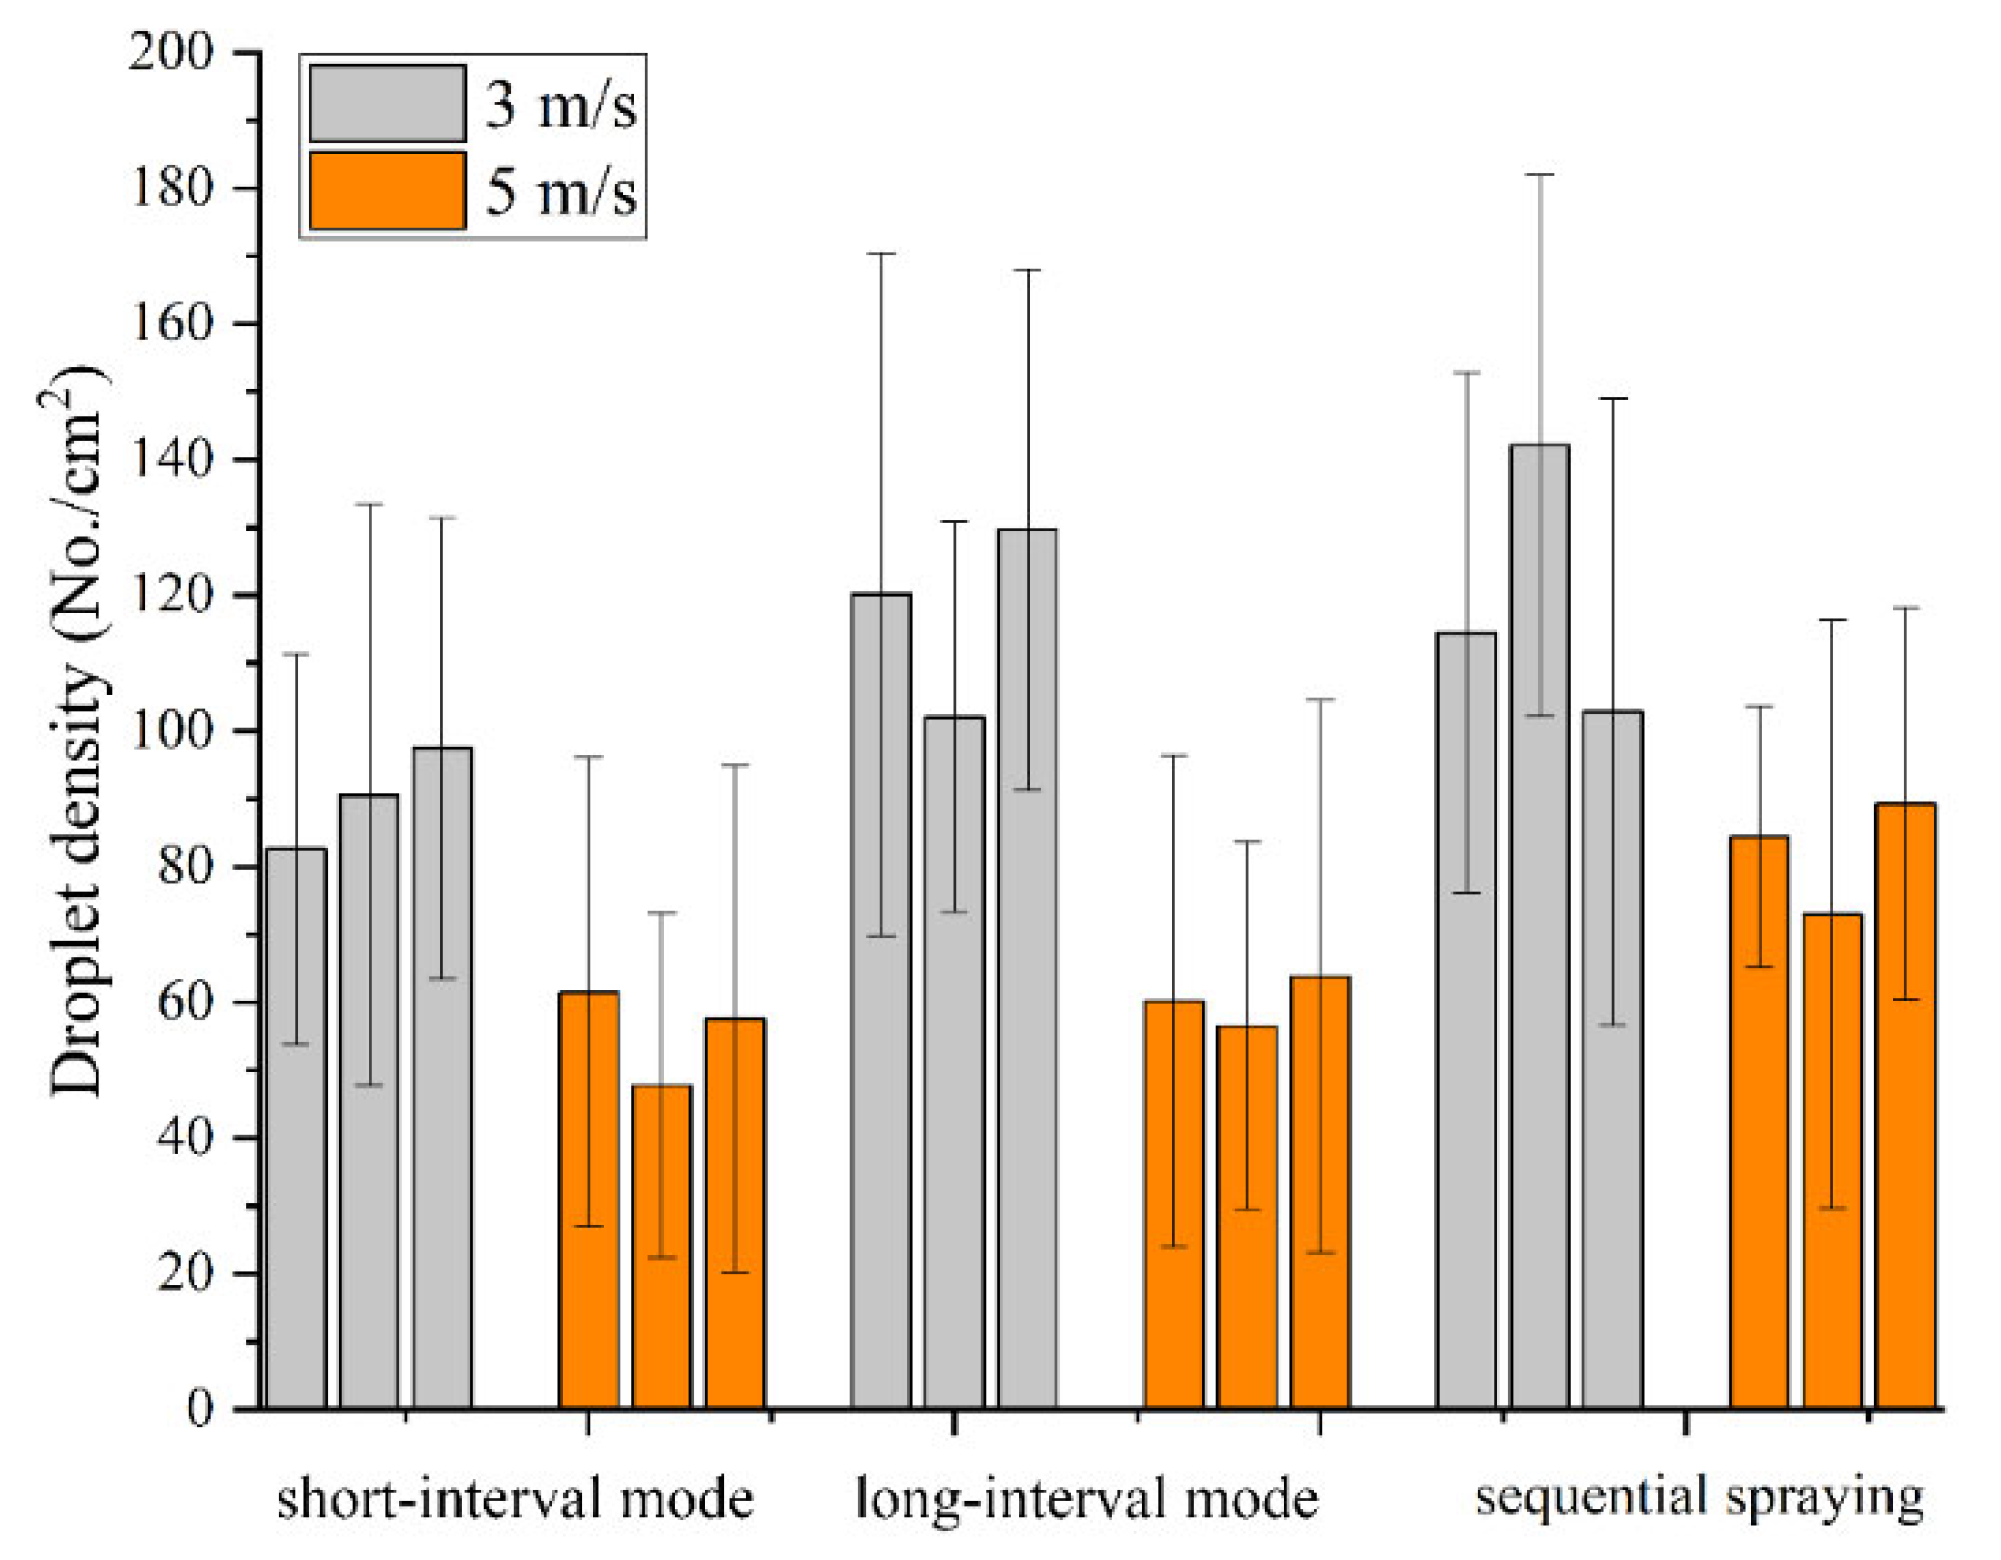
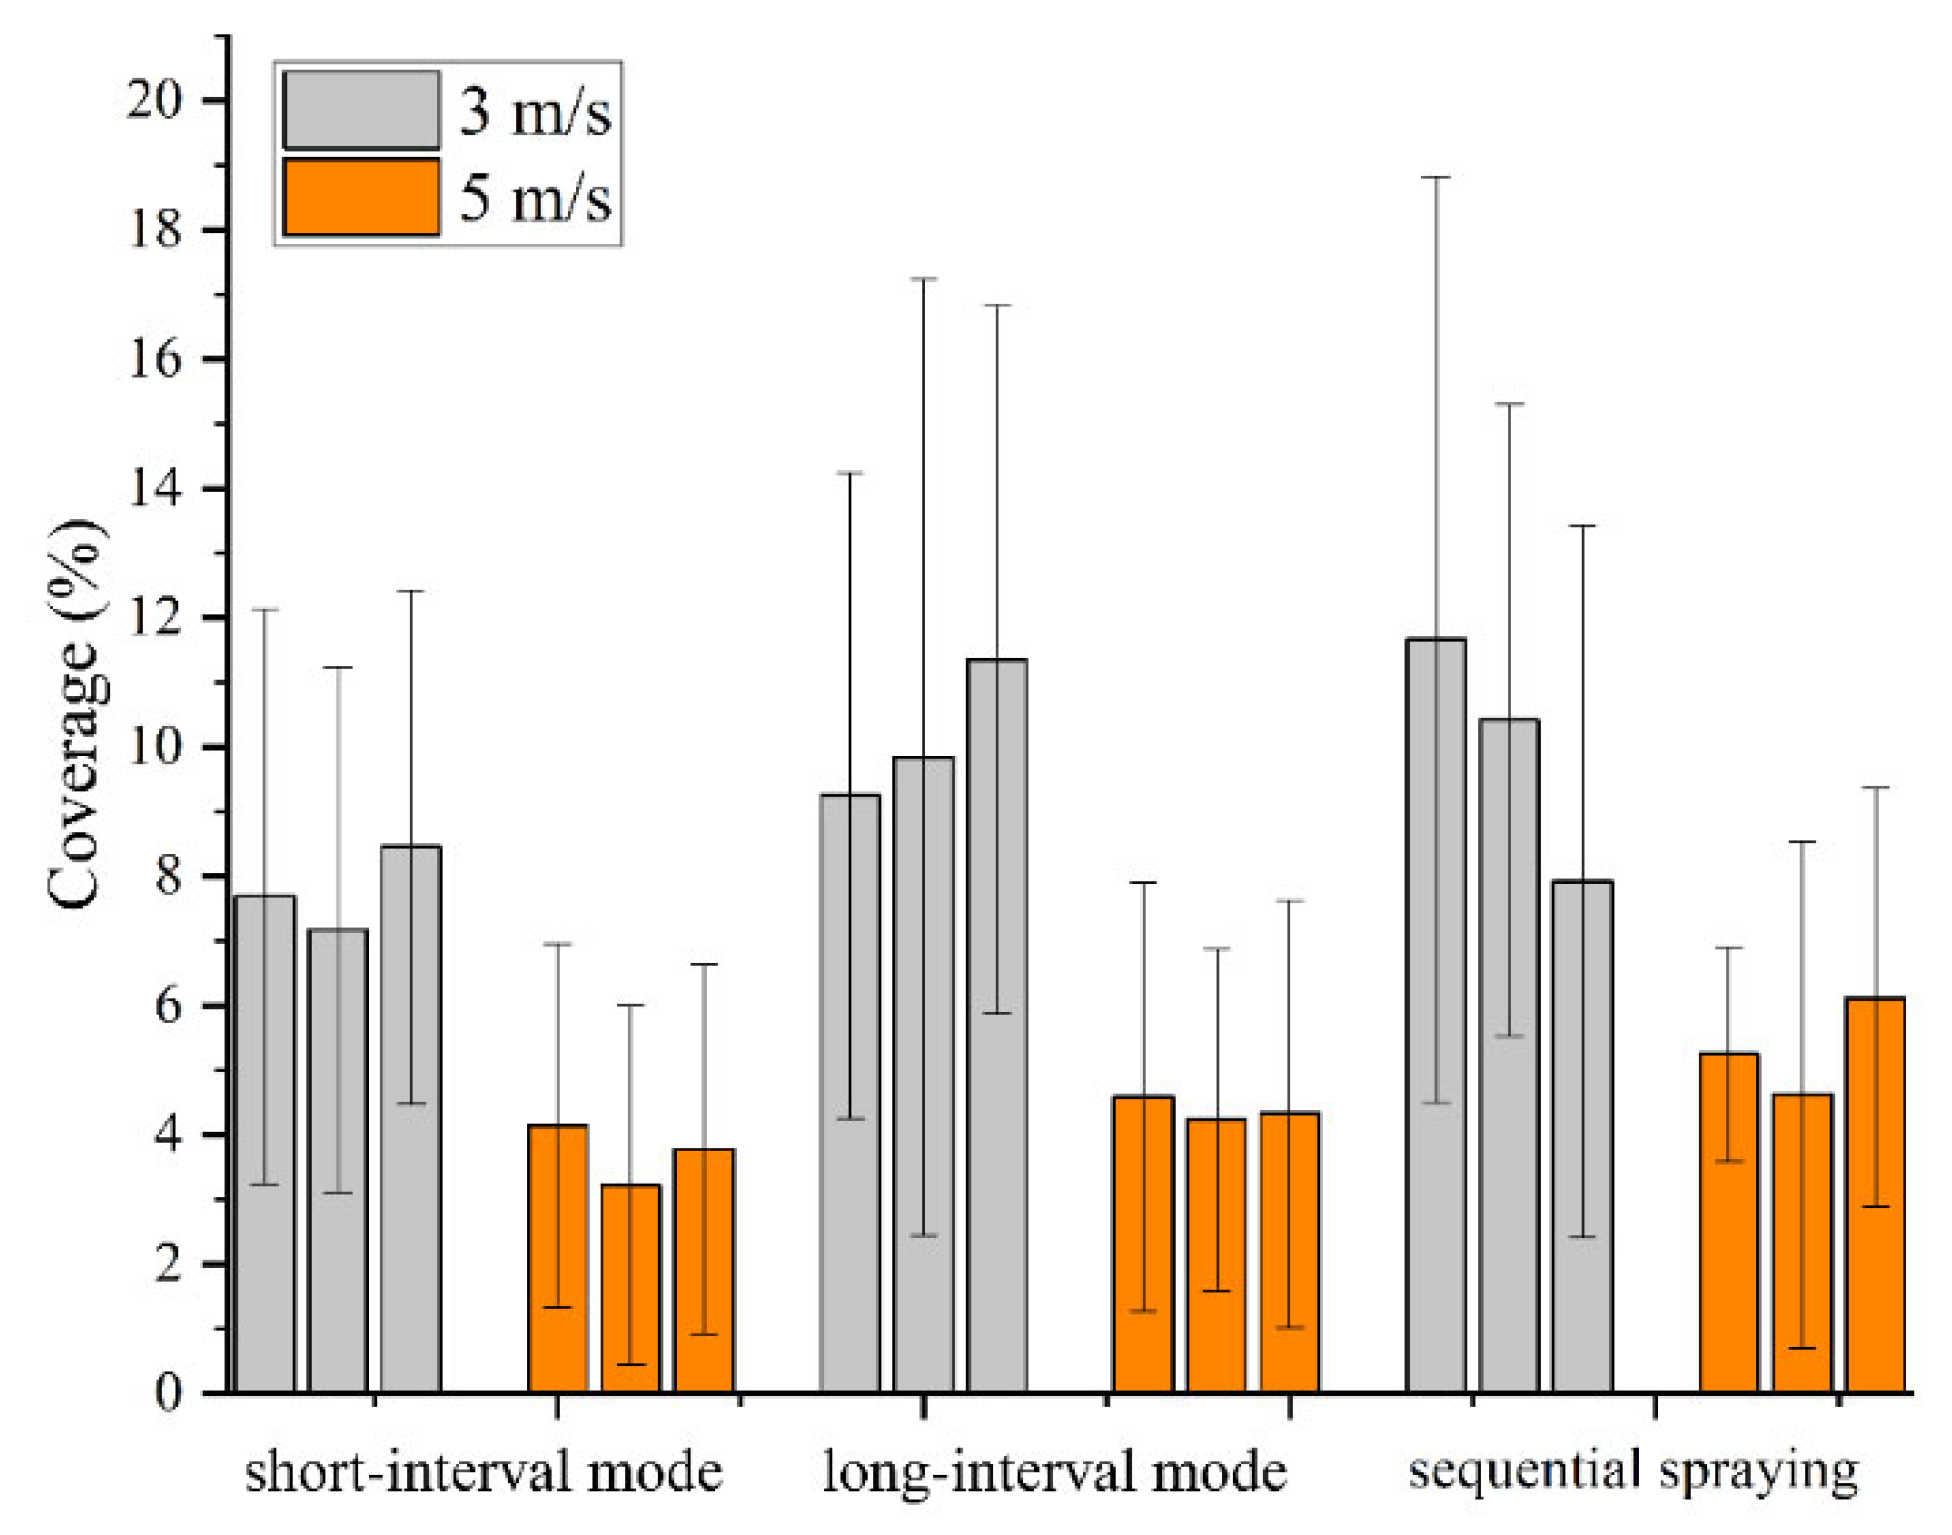
3.2. Droplet Distribution Results of Different Operating Modes

3.2.1. Spray Overlapping Area

Taking the center line of the flight route as the benchmark, the area between the two central routes is the research object (S2 in Figure 16). For simultaneous spraying, the long-interval mode’s droplet density is higher than that of the short-interval mode. As shown in Table 3 and Figure 19, when the flying speed is 3 m/s, the average droplet density of the long-interval mode is 117.3/cm2, which is 1.3 times that of the short-interval mode. When the flight speed is 5 m/s, the long-interval mode is 60.2/cm2, and the short-interval mode is 55.6/cm2. Moreover, the droplet density result of sequential spraying is better than that of simultaneous spraying. The density of droplets sprayed sequentially is higher than that of simultaneous spraying, especially compared to the short-interval mode. The result does not change with the flight speed.
The result of droplet coverage is shown in Figure 20 and Table 3. When the flight speed is 3 m/s, the long-interval mode’s coverage is 10.1%, which is better than the 7.8% of the short-interval mode. The droplet coverage of sequential spraying is higher than that of simultaneous spraying. When the flight speed is 5 m/s, as the flight interval increases, the droplet coverage in the overlapping area increases sequentially, from 3.72% for the short interval to 5.33% for sequential spraying. In summary, regardless of the droplet density or coverage, the droplet distribution improves as the relative flight interval increases.

3.2.2. Dual-UAV Spray Area

The combined area of the two spraying widths was used as the target area (S3 in Figure 16), and the uniformity of the droplet density and coverage were analyzed separately. When the flying speed is 3 m/s, the uniformity of droplet density distribution in the short-interval mode is 44.2%, whereas that of the long-distance method is 60.5%. The distribution uniformity of the short-interval mode is better than that of the long-interval mode. The comparison result of coverage uniformity is the same as the droplet density. As shown in Table 4, the short-interval mode’s CV value is 66.7%, which is better than the 87.4% of the long-interval mode. The uniformity of droplet density distribution and coverage in sequential spraying is 52.5% and 78.1%, respectively. Compared with the simultaneous spraying mode, the uniformity of droplet distribution in the sequential spraying mode is better than that of the long-interval mode, but lower than that of the short-interval mode.
When the flight speed is 5 m/s, there is no significant difference between the uniformity of droplet distribution in the short-interval mode and the long-interval mode. As shown in Table 4, the uniformity of the two modes’ droplet density is 62.3% and 61.4%, and the CV value of the coverage is 82.5% and 79.2%, respectively. Moreover, the uniformity of the deposition density and sequential spraying coverage is 52.5% and 73.3%, respectively. There is no difference in distribution uniformity between simultaneous spraying and sequential spraying.

4. Discussion

In this study, the spraying area of the multi-machine spray was divided into three parts, which are S1, S2 and S3 in Figure 16. The S1 part is the overlapping area outside the fuselage, which is also the droplets affected by the wingtip vortices. Indoor and outdoor tests showed that the data results of simultaneous spraying are better than sequential spraying. The results of the laboratory test were more pronounced. Droplet deposition data of simultaneous spray were increased by 25–100% compared to sequential spray data. We consider that the two UAVs were always kept in the same horizontal position in the indoor test. The droplets initially affected by the wingtip vortex collide with the affected droplets on the other side and deposit in this area, thereby improving the deposition. In the outdoor test, the two UAVs cannot be guaranteed to fly the same way, and there is a specific time difference. The original collision effect on the other side is weakened, thus the increase in the deposition amount becomes limited.
From the results of Section 3.2.1, it can be seen that the droplet distribution result of sequential spraying is better than that of simultaneous spraying. The result is verified from the droplet density and coverage results and does not change with the flight speed. Furthermore, the droplet distribution result of the long-interval mode is better than that of the short-interval mode. The speculated reason for this result is that the droplets of simultaneous spraying are affected twice by the horizontal wind flows of two UAVs, therefore more droplets are blown away and drift by the second wind flow (the horizontal airflow has a significant impact on the drift [32]). Comparatively, the droplets of sequential spraying are affected only once by the wind flow of one UAV during the process of deposition. We believe that the droplet distribution is significantly related to the time difference t between the two UAVs in the forward direction. When the time difference t is long enough, almost all the droplets were deposited on the ground or the WSPs; thus, the rotor wind flow of the second UAV does not affect the droplet distribution. Meanwhile, when the time difference t is short, some droplets floated in the air, which can be blown away and drift by the second UAV’s wind flow. However, we also noticed that the results of simultaneous spraying at short intervals in the S1 area were quite different from those of the S2 study, which was due to the difference in the two subjects. It can be seen from Figure 17 and Figure 18 that although simultaneous spraying (short interval) is better than sequential spraying in S1 area, the data for sequential spraying (short interval) on both sides of the S1 area show a sharp drop. Section 3.2.1 studied the comprehensive results of the S2 area inside the central route. Therefore, from the overall results in the S1 area, it can be seen that simultaneous spraying can temporarily increase the deposition of droplets, but in the overall part of the S2 area, the results of sequential spraying are better.
As shown in the results of Section 3.2.2, when the flying speed is 3 m/s, there is no significant difference in the uniformity of droplet distribution between short-interval and sequential spraying, and the uniformity of the long-interval mode is poorer. When the flying speed is 5 m/s, there is no significant difference in each treatment’s droplet distribution uniformity. It shows that the uniformity of the droplets’ distribution did not change significantly with the change in the time difference t. Affected by the two UAVs’ superimposed wind field, the deposition distribution at each sampling point in the short-interval mode was relatively low. That led to a reduction in the difference between the sampling points, thereby reducing the CV value. However, in this case, the improvement of droplet distribution uniformity is not what we need.
The existing research has rarely involved the concept of multi-UAV close formation spraying, thus it is not easy to compare our results with the existing research; however, there is much research on the spray quality and drift risk of UAVs [5,18,34]. We noticed that there is inconsistency in the spray effect at different spatial locations, such as the droplet results in the S1 area and the S2 area in this study. This is a common problem with drone spraying and has been confirmed in existing studies [5,28]. Chen et al. tried to change the spray quality by adjusting the operating parameters, but the results showed that the improvement of the spray uniformity was limited by the operating parameters, which was consistent with the results of Section 3.2.2 of this study. It may need to be resolved from the perspective of the rotor and nozzle layout structure [27,28]. Drift is unavoidable in UAV spraying. Existing studies believe that UAV drift is caused by the wingtip vortex generated by the rotor wind field and the wake vortex generated during the movement. This study involves the simultaneous application of two UAVs, and the motion state of the droplets in the middle overlapping area is still unknown; therefore more research is needed to explain this.
In the context of smart agriculture and unmanned farms, the use of drones for plant protection product spraying has become a trend [35]. UAV close formation spraying can not only solve the real problem of labor shortages, but also achieve higher efficiency. This study preliminarily evaluated the spray effect of multi-UAV close formation spraying, and the experimental data helped to understand the limitations of multi-UAV close formation spraying. Although a multi-UAV close formation can improve the operational efficiency of UAVs, as we said in the introduction, improving the spray quality is the core issue of UAV spraying. Finally, there are still some limitations in this study. On the one hand, the single-width spray study ignores the influence of wind drift on the droplets, and cannot explain the droplet distribution outside the spray area. Future research also needs to consider the effect of multiple spray patterns. Additionally, there is a limitation in outdoor experimental research that, in order to ensure the safety of the outdoor experiments and avoid collision, the line spacing of the two paths of the UAV-L and UAV-R was set to 4 m. However, a closer interval may lead to better experimental results since the interaction and interference of wind fields between two UAVs will be stronger. The expected line spacing can be set to 3 m (The line spacing can only be set as an integer in the ground station software), as the spraying swath width of a single UAV can be between 3–4 m if the precision of the GPS RTK and the flying accuracy of the UAV can be improved.

5. Conclusions

This study initially assessed the spray quality of close formation spraying through indoor and outdoor trials. A test bench and UAVs for indoor and outdoor experiments were first built. The deposition amount, deposition density and distribution uniformity of droplets were evaluated from different spray overlapping areas such as S1, S2 and S3, respectively. Compared with the indoor spraying results in the S1 area, it can be seen that simultaneous spraying is better than sequential spraying, and the spraying short-interval mode can improve the droplet deposition distribution in the overlapping spraying area. Additionally, the droplet distribution result of sequential spraying is better than that of simultaneous spraying in the S2 area. Furthermore, the droplet distribution result of the long-interval mode is better than that of the short-interval mode. The uniformity of the droplets’ distribution in the S3 area did not change significantly among the treatments.

Author Contributions

Conceptualization, F.O. and P.C.; methodology, P.C.; validation, F.O., Y.Z. and P.C.; formal analysis, P.C.; investigation, F.O.; resources, Y.L.; writing—original draft preparation, P.C.; writing—review and editing, F.O.; funding acquisition, Y.L and F.O. All authors have read and agreed to the published version of the manuscript.

Funding

This work was supported by the Laboratory of Lingnan Modern Agriculture Project (NT2021009), the Science and Technology Planning Project of Guangdong Province (2017B010116003) and the 111 Project (D18019).

Institutional Review Board Statement

Not applicable.

Informed Consent Statement

Not applicable.

Data Availability Statement

There is no report data.

Conflicts of Interest

The authors declare no conflict of interest.

References

  1. Chen, H.; Lan, Y.; Fritz, B.K.; Hoffmann, W.C.; Liu, S. Review of agricultural spraying technologies for plant protection using unmanned aerial vehicle (UAV). Int. J. Agric. Biol. Eng. 2021, 14, 38–49. [Google Scholar] [CrossRef]
  2. Li, J.; Lan, Y.; Shi, Y. Research progress on airflow characteristics and field pesticide application system of rotary-wing UAV. Trans. Chin. Soc. Agric. Eng. 2018, 34, 104–118. [Google Scholar]
  3. Zhang, Y.; Huang, X.; Lan, Y.; Wang, L.; Lu, X.; Yan, K.; Deng, J.; Zeng, W. Development and Prospect of UAV-Based Aerial Electrostatic Spray Technology in China. Appl. Sci. 2021, 11, 4071. [Google Scholar] [CrossRef]
  4. Chen, P.; Lan, Y.; Huang, X.; Qi, H.; Wang, G.; Wang, J.; Wang, L.; Xiao, H. Droplet Deposition and Control of Planthoppers of Different Nozzles in Two-Stage Rice with a Quadrotor Unmanned Aerial Vehicle. Agronomy 2020, 10, 303. [Google Scholar] [CrossRef] [Green Version]
  5. Chen, P.; Ouyang, F.; Wang, G.; Qi, H.; Xu, W.; Yang, W.; Zhang, Y.; Lan, Y. Droplet distributions in cotton harvest aid applications vary with the interactions among the unmanned aerial vehicle spraying parameters. Ind. Crop. Prod. 2021, 163, 113324. [Google Scholar] [CrossRef]
  6. Chen, P.; Douzals, J.P.; Lan, Y.; Cotteux, E.; Delpuech, X.; Pouxviel, G.; Zhan, Y. Characteristics of Unmanned Aerial Spraying Systems and related Spray Drift: A Review. Front. Plant. Sci. 2022, 13, 870956. [Google Scholar]
  7. Zhan, Y.; Chen, P.; Xu, W.; Chen, S.; Han, Y.; Lan, Y.; Wang, G. Influence of the downwash airflow distribution characteristics of a plant protection UAV on spray deposit distribution. Biosyst. Eng. 2022, 216, 32–45. [Google Scholar] [CrossRef]
  8. Ivić, S.; Andrejčuk, A.; Družeta, S. Autonomous control for multi-agent non-uniform spraying. Appl. Soft Comput. 2019, 80, 742–760. [Google Scholar] [CrossRef]
  9. McAllister, W.; Osipychev, D.; Davis, A.; Chowdhary, G. Agbots: Weeding a field with a team of autonomous robots. Comput. Electron. Agric. 2019, 163, 104827. [Google Scholar] [CrossRef]
  10. Arguenon, V.; Bergues-Lagarde, A.; Rosenberger, C.; Bro, P.; Smari, W. Multi-agent based prototyping of agriculture robots. In Proceedings of the International Symposium on Collaborative Technologies and Systems (CTS’06), Las Vegas, NV, USA, 14–17 May 2006; IEEE: Piscataway Township, NJ, USA, 2006; pp. 282–288. [Google Scholar]
  11. Zhang, C.; Noguchi, N. Development of a multi-robot tractor system for agriculture field work. Comput. Electron. Agric. 2017, 142, 79–90. [Google Scholar] [CrossRef]
  12. Jimenez, A.; Cardenas, P.; Canales, A.; Jimenez, F.; Portacio, A. A survey on intelligent agents and multi-agents for irrigation scheduling. Comput. Electron. Agric. 2020, 176, 105474. [Google Scholar] [CrossRef]
  13. Barriuso, A.L.; Villarrubia González, G.; De Paz, J.F.; Lozano, Á.; Bajo, J. Combination of multi-agent systems and wireless sensor networks for the monitoring of cattle. Sensors 2018, 18, 108. [Google Scholar] [CrossRef] [PubMed] [Green Version]
  14. Liu, Y.; Bucknall, R. A survey of formation control and motion planning of multiple unmanned vehicles. Robotica 2018, 36, 1019–1047. [Google Scholar] [CrossRef]
  15. García-Magariño, I.; Lacuesta, R.; Lloret, J. ABS-SmartComAgri: An agent-based simulator of smart communication protocols in wireless sensor networks for debugging in precision agriculture. Sensors 2018, 18, 998. [Google Scholar] [CrossRef] [Green Version]
  16. Wang, J.; Chen, M.; Zhou, J.; Li, P. Data communication mechanism for greenhouse environment monitoring and control: An agent-based IoT system. Inf. Process. Agric. 2020, 7, 444–455. [Google Scholar] [CrossRef]
  17. Wang, G.; Han, Y.; Li, X.; Andaloro, J.; Chen, P.; Hoffmann, W.C.; Han, X.; Chen, S.; Lan, Y. Field evaluation of spray drift and environmental impact using an agricultural unmanned aerial vehicle (UAV) sprayer. Sci. Total Environ. 2020, 737, 139793. [Google Scholar] [CrossRef] [PubMed]
  18. Chen, S.; Lan, Y.; Zhou, Z.; Ouyang, F.; Wang, G.; Huang, X.; Deng, X.; Cheng, S. Effect of Droplet Size Parameters on Droplet Deposition and Drift of Aerial Spraying by Using Plant Protection UAV. Agronomy 2020, 10, 195. [Google Scholar] [CrossRef] [Green Version]
  19. Wang, J.; Lan, Y.; Wen, S.; Hewitt, A.J.; Yao, W.; Chen, P. Meteorological and flight altitude effects on deposition, penetration, and drift in pineapple aerial spraying. Asia-Pac. J. Chem. Eng. 2019, 15, e2382. [Google Scholar] [CrossRef]
  20. Tang, Q.; Chen, L.; Zhang, R.; Deng, W.; Xu, M.; Xu, G.; Li, L.; Hewitt, A. Effects of application height and crosswind on the crop spraying performance of unmanned helicopters. Comput. Electron. Agric. 2021, 181, 105961. [Google Scholar] [CrossRef]
  21. Qin, W.; Qiu, B.; Xue, X.; Chen, C.; Xu, Z.; Zhou, Q. Droplet deposition and control effect of insecticides sprayed with an unmanned aerial vehicle against plant hoppers. Crop Prot. 2016, 85, 79–88. [Google Scholar] [CrossRef]
  22. Liao, J.; Zang, Y.; Luo, X.; Zhou, Z.; Lan, Y.; Zang, Y.; Gu, X.; Xu, W.; Hewitt, A.J. Optimization of variables for maximizing efficacy and efficiency in aerial spray application to cotton using unmanned aerial systems. Int. J. Agric. Biol. Eng. 2019, 12, 10–17. [Google Scholar] [CrossRef]
  23. Lou, Z.; Xin, F.; Han, X.; Lan, Y.; Duan, T.; Fu, W. Effect of unmanned aerial vehicle flight height on droplet distribution, drift and control of cotton aphids and spider mites. Agronomy 2018, 8, 187. [Google Scholar] [CrossRef] [Green Version]
  24. Tang, Y.; Hou, C.J.; Luo, S.M.; Lin, J.T.; Yang, Z.; Huang, W.F. Effects of operation height and tree shape on droplet deposition in citrus trees using an unmanned aerial vehicle. Comput. Electron. Agric. 2018, 148, 1–7. [Google Scholar] [CrossRef]
  25. Chen, S.; Lan, Y.; Li, J.; Zhou, Z.; Jin, J.; Liu, A. Effect of spray parameters of small unmanned helicopter on distribution regularity of droplet deposition in hybrid rice canopy. Trans. Chin. Soc. Agric. Eng. 2016, 32, 40–46. [Google Scholar]
  26. Qin, W.; Xue, X.; Zhang, S.; Wei, G.; Wang, B. Droplet deposition and efficiency of fungicides sprayed with small UAV against wheat powdery mildew. Int. J. Agric. Biol. Eng. 2018, 11, 27–32. [Google Scholar] [CrossRef] [Green Version]
  27. Xue, X.; Lan, Y.; Sun, Z.; Chang, C.; Hoffmann, W.C. Develop an unmanned aerial vehicle based automatic aerial spraying system. Comput. Electron. Agric. 2016, 128, 58–66. [Google Scholar] [CrossRef]
  28. Wang, G.; Lan, Y.; Yuan, H.; Qi, H.; Chen, P.; Ouyang, F.; Han, Y. Comparison of Spray Deposition, Control Efficacy on Wheat Aphids and Working Efficiency in the Wheat Field of the Unmanned Aerial Vehicle with Boom Sprayer and Two Conventional Knapsack Sprayers. Appl. Sci. 2019, 9, 218. [Google Scholar] [CrossRef] [Green Version]
  29. Meng, Y.; Su, J.; Song, J.; Chen, W.; Lan, Y. Experimental evaluation of UAV spraying for peach trees of different shapes: Effects of operational parameters on droplet distribution. Comput. Electron. Agric. 2020, 170, 105282. [Google Scholar] [CrossRef]
  30. Yu, Z.; Zhang, Y.; Jiang, B.; Yu, X.; Chai, T. Distributed adaptive fault-tolerant close formation flight control of multiple trailing fixed-wing UAVs. ISA Trans. 2020, 106, 181–199. [Google Scholar] [CrossRef] [PubMed]
  31. Zhang, Q.; Liu, H. Aerodynamic model-based robust adaptive control for close formation flight. Aerosp. Sci. Technol. 2018, 79, 5–16. [Google Scholar] [CrossRef]
  32. Xiongkui, H.; Bonds, J.; Herbst, A.; Langenakens, J. Recent development of unmanned aerial vehicle for plant protection in East Asia. Int. J. Agric. Biol. Eng. 2017, 10, 18–30. [Google Scholar]
  33. DJI. AGRAS T16 Manual User; DJI: Shenzhen, China, 2019; Volume 2022. [Google Scholar]
  34. Wang, G.; Lan, Y.; Qi, H.; Chen, P.; Hewitt, A.; Han, Y. Field evaluation of an unmanned aerial vehicle (UAV) sprayer: Effect of spray volume on deposition and the control of pests and disease in wheat. Pest Manag. Sci. 2019, 75, 1546–1555. [Google Scholar] [CrossRef] [PubMed]
  35. Chen, P.; Xu, W.; Zhan, Y.; Wang, G.; Yang, W.; Lan, Y. Determining application volume of unmanned aerial spraying systems for cotton defoliation using remote sensing images. Comput. Electron. Agric. 2022, 196, 106912. [Google Scholar] [CrossRef]
Figure 1. Sequential spraying.
Agriculture 12 01149 g001
Figure 2. Simultaneous spraying.
Agriculture 12 01149 g002
Figure 3. Parameters of dual-UAV formation flight.
Agriculture 12 01149 g003
Figure 4. Four-rotor UAV prototype.
Agriculture 12 01149 g004
Figure 5. Illustration of dimensions and modules.
Agriculture 12 01149 g005
Figure 6. The electric wiring diagram of the UAV.
Agriculture 12 01149 g006
Figure 7. The spray system of the UAV.
Agriculture 12 01149 g007
Figure 8. Top view of indoor test platform.
Agriculture 12 01149 g008
Figure 9. Illustration of droplet collection area.
Agriculture 12 01149 g009
Figure 10. Collecting flumes and measuring cups.
Agriculture 12 01149 g010
Figure 11. Testing area and experimental setup.
Agriculture 12 01149 g011
Figure 12. Path planning in the ground station software.
Agriculture 12 01149 g012
Figure 13. Front view of dual-UAV simultaneous spraying.
Agriculture 12 01149 g013
Figure 14. Side view of dual-UAV simultaneous spraying.
Agriculture 12 01149 g014
Figure 15. Indoor test results of simultaneous spraying and sequential spraying.
Agriculture 12 01149 g015
Figure 16. Spatial diagram of spray overlap area.
Agriculture 12 01149 g016
Figure 17. Outdoor test results at a speed of 3 m/s.
Agriculture 12 01149 g017
Figure 18. Outdoor test results at a speed of 5 m/s.
Agriculture 12 01149 g018
Figure 19. The results of droplet density in spray overlapping area.
Agriculture 12 01149 g019
Figure 20. The results of coverage in spray overlapping area.
Agriculture 12 01149 g020
Table 1. Experimental setup and conditions of 9 tests at 3 m/s.
Test NO.NameDescriptionMeteorological Conditions
1Simultaneous spray 1Side by side t = 0.2 s18:30–20:00 p.m., 25 September, sunny, mean wind speed m/s
1.4 ± 0.6 (north), mean temperature 24.4 ± 3.1 °C,
mean humidity 29.3 ± 2.0%
2Simultaneous spray 2Side by side t = 0.3 s
3Simultaneous spray 3Side by side t = 1 s
4Simultaneous spray 4One ahead t = 1.3 s
5Simultaneous spray 5One ahead t = 2.7 s
6Simultaneous spray 6One ahead t = 4.5 s
7Sequential spray 1One by one
8Sequential spray 2One by one
9Sequential spray 3One by one
Table 2. Experimental setup and conditions of 9 tests at 5 m/s.
Test NO.NameDescriptionMeteorological Conditions
10Simultaneous spray 1Side by side t = 0.3 s18:30–20:00 p.m., 24 September, sunny, mean wind speed m/s
1.2 ± 0.6 (northeast), mean temperature 26.2 ± 2.8 °C, mean humidity 33 ± 2.2%
11Simultaneous spray 2Side by side t = 0.7 s
12Simultaneous spray 3Side by side t = 1 s
13Simultaneous spray 4One ahead t = 2.5 s
14Simultaneous spray 5One ahead t = 3.5 s
15Simultaneous spray 6One ahead t = 4.3 s
16Sequential spray 1One by one
17Sequential spray 2One by one
18Sequential spray 3One by one
Table 3. Average value of droplet density and coverage in spray overlapping area.
SpeedSimultaneous Spraying
(Short Interval)
Simultaneous Spraying
(Long Interval)
Sequential Spraying
Droplet Density
(No/cm2)
3 m/s90.2 ± 6.08 b 1117 ± 11.4 ab120 ± 16.4 a
5 m/s55.6 ± 5.77 b60.2 ± 2.96 b82.2 ± 6.85 a
Coverage
(%)
3 m/s7.77 ± 0.53 a10.15 ± 0.89 a10 ± 1.55 a
5 m/s3.72 ± 0.38 b4.39 ± 0.15 ab5.33 ± 0.61 a
1 Data followed by different small letters in the same rows are significantly different among treatments at p < 0.05 by Duncan’s test.
Table 4. Average CV value of droplet density and coverage in spraying area.
SpeedSimultaneous Spraying
(Short Interval)
Simultaneous Spraying
(Long Interval)
Sequential Spraying
Droplet Density3 m/s44.2 ± 4.07 a 260.5 ± 4.03 b52.5 ± 4.57 ab
5 m/s62.3 ± 3.38 a61.4 ± 3.59 a52.5 ± 5.22 a
Coverage3 m/s66.7 ± 2.69 a87.4 ± 9.02 b78.1 ± 9.58 ab
5 m/s82.5 ± 9.51 a79.2 ± 6.32 a73.3 ± 11.1 a
2 Data followed by different small letters in the same rows are significantly different among treatments at p < 0.05 by Duncan’s test.
Publisher’s Note: MDPI stays neutral with regard to jurisdictional claims in published maps and institutional affiliations.

