Article

Analysis of the Coupling Characteristics of Water Resources and Food Security: The Case of Northwest China

1
College of Geography Sciences, Shanxi Normal University, Taiyuan 030031, China
2
Key Laboratory of Agricultural Soil and Water Engineering in Arid and Semiarid Areas, Ministry of Education, Northwest A&F University, Yangling 712100, China
3
Institute of Water Saving Agriculture in Arid Regions of China, Northwest A&F University, Yangling 712100, China
4
Shanxi Institute of Organic Dryland Farming, Shanxi Agricultural University, Taiyuan 030031, China
5
Department of Agricultural and Biological Engineering, Purdue University, West Lafayette, IN 47907, USA
*
Author to whom correspondence should be addressed.
Agriculture 2022, 12(8), 1114; https://doi.org/10.3390/agriculture12081114
Submission received: 18 June 2022 / Revised: 18 July 2022 / Accepted: 27 July 2022 / Published: 28 July 2022

Abstract

:
Exploring the coupling characteristics of regional water resources and food security helps to promote the sustainable development of grain production and is of great significance for achieving global food security. From the aspects of regional “water supply”, “water use” and “water demand”, the coupling characteristics of water resources and food security were systematically revealed; the new challenges faced by regional food security from the perspective of water resources were clarified; and effective ways to promote the utilization of regional water resources and the sustainable development of grain production were explored. This paper took Northwest China, which is the most arid region, where water-resource utilization and food security are in contradiction, as the research area. The water-resource load index, the water footprint of grain production and the water-consumption footprint were used to quantify the regional water-resource pressure index, as well as the residential grain-consumption types, population urbanization, the industrial-grain-processing industry and their corresponding water-consumption footprints from 2000 to 2020. The coupling characteristics of water resources and food security were systematically revealed. The results showed the following: (1) In 2000–2020, the water-resource load index increased from 4.0 to 10.7, and the load level increased from III to I. At the same time, agricultural water resources were largely allocated elsewhere. (2) During the period, the food rations showed a significant decreasing trend, and the average annual reduction was 3.4% (p < 0.01). The water footprint of animal products increased, particularly for beef and poultry (the average annual growth rates were 9.9% and 6.3%, respectively). In addition, the water footprint of industrial food consumption increased by 297.1%. (3) With the improvement of the urbanization level, the water-consumption footprint increased by 85.9%. It is expected that the water footprint of grain consumption will increase by 39.4% and 52.3% by 2030 and 2040, respectively. Exploring how to take effective measures to reduce the water footprint to meet food-security needs is imperative. This study proposed measures to improve the utilization efficiency of blue and green water and reduce gray water and the grain-consumption water footprint from the aspects of regional planting-structure optimization potential, water-saving irrigation technology, dietary-structure transformation and virtual water trade; these measures could better relieve the water-resource pressure and promote the sustainable development of grain production and water-resource utilization.

1. Introduction

Food security is an important basis for national security. Ensuring food security can not only contribute to social stability but also contribute to sustainable economic development. As the world’s most populous country, China gives a large contribution to both global grain-production and grain-consumption demand [1]. Whether China achieves food security is of great significance to global food security. China’s food security has always been an important concern for government policy makers [2]. For a long time, China has carried out agricultural production by increasing the high resource inputs of water resources, chemical fertilizers and pesticides. China’s per capita grain output has increased from 209.0 kg in 1949 to 483.48 kg in 2020, reaching the food-security standard of 483.48 kg stipulated by the FAO (Food and Agriculture Organization of the United Nations) [3]. However, this food security achieved at the cost of a high resource input is unsustainable, and the deep-seated problems caused have seriously affected the sustainable development of grain production and high-quality economic and social development.
The sustainable utilization of water resources, as a key factor in grain production, is the basic premise for realizing regional food security and the sustainable development of grain production. Although China is rich in total water resources, due to China’s huge population base, China’s per capita water resources are only a quarter of the global average, ranking among the 13 water-poor countries [4]. In the context of climate change, the increasingly significant spatial and temporal differences in water resources and the high water consumption of agricultural activities further aggravate the contradiction between the supply of and demand for regional water resources [5]. With the increase in the economic differences between the north and south of China and the improvement of the urbanization level, the cultivated-land area in the water-rich southern region is decreasing [6], and the distribution of cultivated-land resources in China is shifting from the south to the north. This further aggravates the contradiction between the supply of and demand for water resources in North China [1] and threatens China’s food security [1,7]. Especially in Northwest China, as an arid and semi-arid region, the sustainability of water-resource utilization is an important factor to ensure food security. Therefore, it is an important way to ensure food security to put forward effective suggestions to promote the efficient utilization of regional water resources and the sustainable development of food security.
Research on the coupling characteristics of water resources and food security has always attracted the attention of many scholars. Some of these scholars have focused on the coupled characteristics of water resources and grain production under water-saving-irrigation-technology conditions, such as drip irrigation [8,9], sprinkler use [10], microirrigation [11], alternating irrigation [12,13,14], loss-adjustment irrigation [9,13,15,16] and coating irrigation [17,18]. The main purpose has been exploring how to adjust the water supply during the crop growth period and reduce the water demand on the basis of ensuring crop production. The promotion of these water-saving technologies would help to reduce the amount of water-resource demand used for grain production from the perspective of crop water use [19]. At the same time, vigorously developing dry farming agriculture using precision agriculture and rainwater-intelligent agricultural technology [20] could effectively improve the efficiency of the crop utilization of precipitation and thus reduce the demand for irrigation water to achieve the purpose of alleviating regional water-resource pressure. This could effectively improve the precipitation utilization efficiency of crops, thus reducing the demand for irrigation water and achieving the purpose of relieving the pressure on regional water resources. In addition, some scholars have focused on the coupling characteristics of grain demand and water resources. For example, climate change, population growth and dietary-structure changes lead to the need to increase grain supply and water resources to meet regional food security [21,22,23,24,25,26]. In conclusion, current research on the coupling characteristics of water resources and food security has mainly focused on the single aspect of “water use” or “water demand”. However, the principle of regional water-resource allocation is often closely related to water-resource endowment, and the differences in water-resource allocation in different departments directly determine the amount of available water resources for grain production in this region. From the perspective of grain consumption, the transformation of the dietary structure, the rapid development of urbanization and the increase in industrial products all have a significant impact on regional food security and water-resource demand. It can be seen that regional water-resource endowment, its allocation and grain-consumption demand are interlinked. Therefore, in order to explore the coupling characteristics of regional water resources and food security, it is necessary to carry out systematic coupling evaluations from the aspects of natural attributes, water-resource allocation and grain consumption. Obviously, there is still insufficient research on these aspects.
In order to solve the above scientific problems, this paper takes Northwest China, which is the most arid region, where water-resource utilization and food security are in contradiction, as the research area. From the aspects of regional “water supply”, “water use” and “water demand”, the coupling characteristics of water resources and food security are systematically revealed; the new challenges faced by regional food security from the perspective of water resources are clarified; and effective ways to promote regional water-resource utilization and the sustainable development of grain production are explored. The water-resource load index, the water footprint of grain production and the water-consumption footprint are used to quantify the regional water-resource pressure index, as well as the residential grain-consumption types, population urbanization, industrial-grain-processing industry and their corresponding water-consumption footprints from 2000 to 2020. On the basis of analyzing the spatial- and temporal-distribution characteristics of regional water resources, water-resource pressure index and water-use-structure characteristics, this paper discusses the influence of factors such as the rapid development of urbanization, which has led to a large transfer of rural population to cities, and the improvement of resident income level, which has led to the change in the dietary structure and the increase in industrial grain use, on the quantitative nature of the demand for the grain-consumption water footprint. Our findings could provide important enlightenment for addressing regional-water-shortage and food-security issues and have important implications for ensuring food security in China and the world.

2. Materials and Methods

2.1. Overview of the Study Area

Northwest China (73°40’–126°04’ E, 31°60’–53°23’ N) includes Shaanxi Province, Gansu Province, Ningxia Hui Autonomous Region, Qinghai Province, Shanxi Province, Xinjiang Uygur Autonomous Region and Inner Mongolia Autonomous Region (Figure 1). It belongs to arid, semi-arid and ecologically fragile areas [7]. The region has a range of altitudes from 460 to 3600 m above sea level and is rich in land resources (about 14.8% of the country, including basins, plateaus, mountains and plains) [27], but the water resources are extremely lacking. In 2020, Northwest China’s total water resources accounted for only 10.3% of China’s [28]. Its rainfall and evapotranspiration show the characteristics of “east more than west less” and “west more than east less”, respectively, and their multi-year averages are 442 mm and 1014 mm, respectively [29]. Although the region lacks water resources, the land resources are plentiful, and sunshine is sufficient, with abundant solar-energy resources suitable for the development of agriculture.

2.2. Data Sources

The data involved in this study mainly include meteorological data, agricultural data, population data, consumption data and industrial-food-processing data relative to Northwest China from 2000 to 2020. The meteorological data are from China Meteorological Data Service Center (http://data.cma.cn accessed on: 18 June 2021) [29]. The agricultural data mainly include grain production, planting area, irrigation area, irrigation water consumption, total water resources, agricultural water consumption, industrial water consumption, ecological water consumption, domestic water consumption, etc. These data are from China Water Resources Bulletin, Water Resources Bulletin for Northwest China Provinces, China Statistical Yearbook, China Statistical Yearbook for Northwest China Provinces, China Rural Statistical Yearbook, China Environmental Statistical Yearbook and China Agricultural Statistical Yearbook for the years 2001–2021. The population data, which mainly include urban and rural populations, come from Statistical Yearbooks of Provinces in Northwest China from 2001 to 2021. The consumption data mainly include the consumption quantities of food rations, beef, pork, chicken, eggs, dairy and aquatic products and are mainly from Statistical Yearbook of Provinces in China and Statistical Yearbook of China’s Rural Areas for the period of 2001–2021. The industrial-grain-processing data mainly include liquor, beer, alcohol and non-staple food. The data mainly come from Statistical Yearbooks of Provinces in Northwest China.

2.3. Methods

2.3.1. Water-Resource Load Index

The water-resource load index expresses the relationship among water resources, population and economic development in a certain region and can reflect the spatial and temporal distribution, utilization degree and development potential of regional water resources [30,31]. Since the model fully considers the dual attributes of nature and society of water-resource systems, it can scientifically characterize the actual situation of regional water-resource utilization.
C ( t ) = K ( t ) P ( t ) G ( t ) / W ( t )
where C(t) is the load index of water resources of the region in period t; P(t) is the population size (ten thousand people) of the region in period t; G(t) is the gross domestic product (CNY 100 million) of the region in period t; W(t) represents the total water resources (100 million cubic meters) of the region in period t; and K(t) is the coefficient related to the precipitation in the region in period t, which can be expressed by the formula below [30].
K ( t ) = { 1.0 , R ( t ) 200 mm ; 1.0 0.1 × R ( t ) 200 200 , 200 < R ( t ) 400 mm ; 0.9 0.2 × R ( t ) 400 400 , 400 < R ( t ) 800 mm ; 0.7 0.2 × R ( t ) 800 800 , 800 < R ( t ) 1600 mm ; 0.5 , R ( t ) > 1600
where R(t) is the precipitation in the region (mm) during period t.
In order to intuitively reflect the spatial- and temporal-distribution characteristics and the development and utilization of regional water resources, the water-resource load index can be divided into five grades, as shown in Table 1.

2.3.2. Water Footprint of Grain Production

Where W F p r o d i is the water footprint of grain production in region i, m3/kg; B W F i is the blue-water footprint (i.e., irrigation water consumption) of grain production in region I (m3); G W F i is the green-water footprint (i.e., precipitation consumption) of grain production in region i (m3); G W F i is the gray-water footprint (i.e., the amount of water required to dilute pollutants in the agricultural production process) of the grain production process in region i (m3); and Gi is the grain production in region i (kg).
W F p r o d i = ( B W F i + G W F i + G W F i ) G i
G W F i = c = 1 n ( W g c × A G c )
where W g c is the green-water consumption of crop c during growth (m3) [32]; A G c is the planting area of crop c (ha); and n is the sum of all kinds of grain crops (this study considers rice, wheat, maize, soybeans and potatoes).
W g c = 10 min ( E T c c , P e c )
where P e c is the effective precipitation of crop c during its reproductive period (mm); E T c c is the actual evapotranspiration of crop c during its reproductive period (mm); 10 is the conversion factor (converting water depth (mm) to volume) (m3/ha).
E T C c = K c × E T 0
where K c is the crop coefficient for crop c and E T 0 is the daily potential evapotranspiration rate (mm/d).
E T 0 = 0.408 Δ ( R n G ) + γ 900 T + 273 u 2 ( e s e a ) Δ + γ ( 1 + 0.34 u 2 )
where Δ is the slope of the saturation vapor-pressure curve (kPa∙°C−1); R n is the net radiation (MJ∙m−2∙day−1); G is the soil heat-flux density (MJ∙m−2∙day−1); γ is the psychometric constant (KPa∙°C−1); T is the temperature at the height of 2 m (°C); u 2 is the wind speed at the height of 2 m (m∙s−1); e s is the saturated water-vapor pressure (KPa); and e a is the actual water-vapor pressure (KPa).
We take the average of the daily precipitation at each meteorological station for the same time period in each region as the daily precipitation value for that time period for that province. In this study, we use the CropWat model to calculate the effective precipitation during the growth period, which is currently recognized and generally recommended by the United States Department of Agriculture’s Soil Conservation Administration. The formula is as shown below [33].
P e c = { P ( 4.17 0.2 P ) / 4.17 P < 8.3   mm / d 4.17 + 0.1 P P 8.3   mm / d
where p is the precipitation in mm.
B W F i = c = 1 n ( I G c × A G c )
where I G c is the irrigation water consumption of grain c per unit area (m³∙ha−1) and A G c is the sown area of grain c (ha).
I G c = ( W U A × R G c ) / A G c
where R G c is the proportion of irrigation water use for crop c to the total irrigation water use in the irrigation district [34] and WUA is the total irrigation water use of the province (m³).
R G c = ( E T c c P e c ) × A G c c = 1 n [ ( E T c c P e c ) × A G c ]
The gray-water footprint is calculated according to Hoekstra et al. [35], as shown below.
G W F i = ( α × A R i ) / ( c max c n a t )
where ARi is the application of nitrogen fertilizer per hectare in kilograms per hectare; α is the leaching rate, which is generally 10% [34]; c max is the maximum permissible nitrogen concentration, which is 10 mg/L; and c n a t is the natural background nitrogen concentration.

2.3.3. Water Footprint of Grain Consumption

Where W F cons ( p ) is the per capita water-consumption footprint of grain p (m3); c ( p ) is the per capita consumption of grain p (kg); ρ ( p ) is the coefficient of each grain p converted into grain; p indicates the ration (beef, pork, mutton, poultry, eggs and milk). Among them, the proportions of rations converted into grain in rural and urban areas are 1.0 and 1.25, respectively (the ration consumption of rural residents in the statistics is calculated on the grain, while the ration consumption of urban residents is calculated on the basis of traded grain) [7]. The conversion coefficients of beef, pork, mutton, poultry, egg, milk and aquatic products are 4.1, 4.6, 4.1, 3.2, 3.6, 0.8 and 2.0, respectively [36,37].
W F cons ( p ) = c ( p ) × ρ ( p ) × W F p r o d G

3. Results

3.1. Impact of Water-Supply Capacity on Food Security

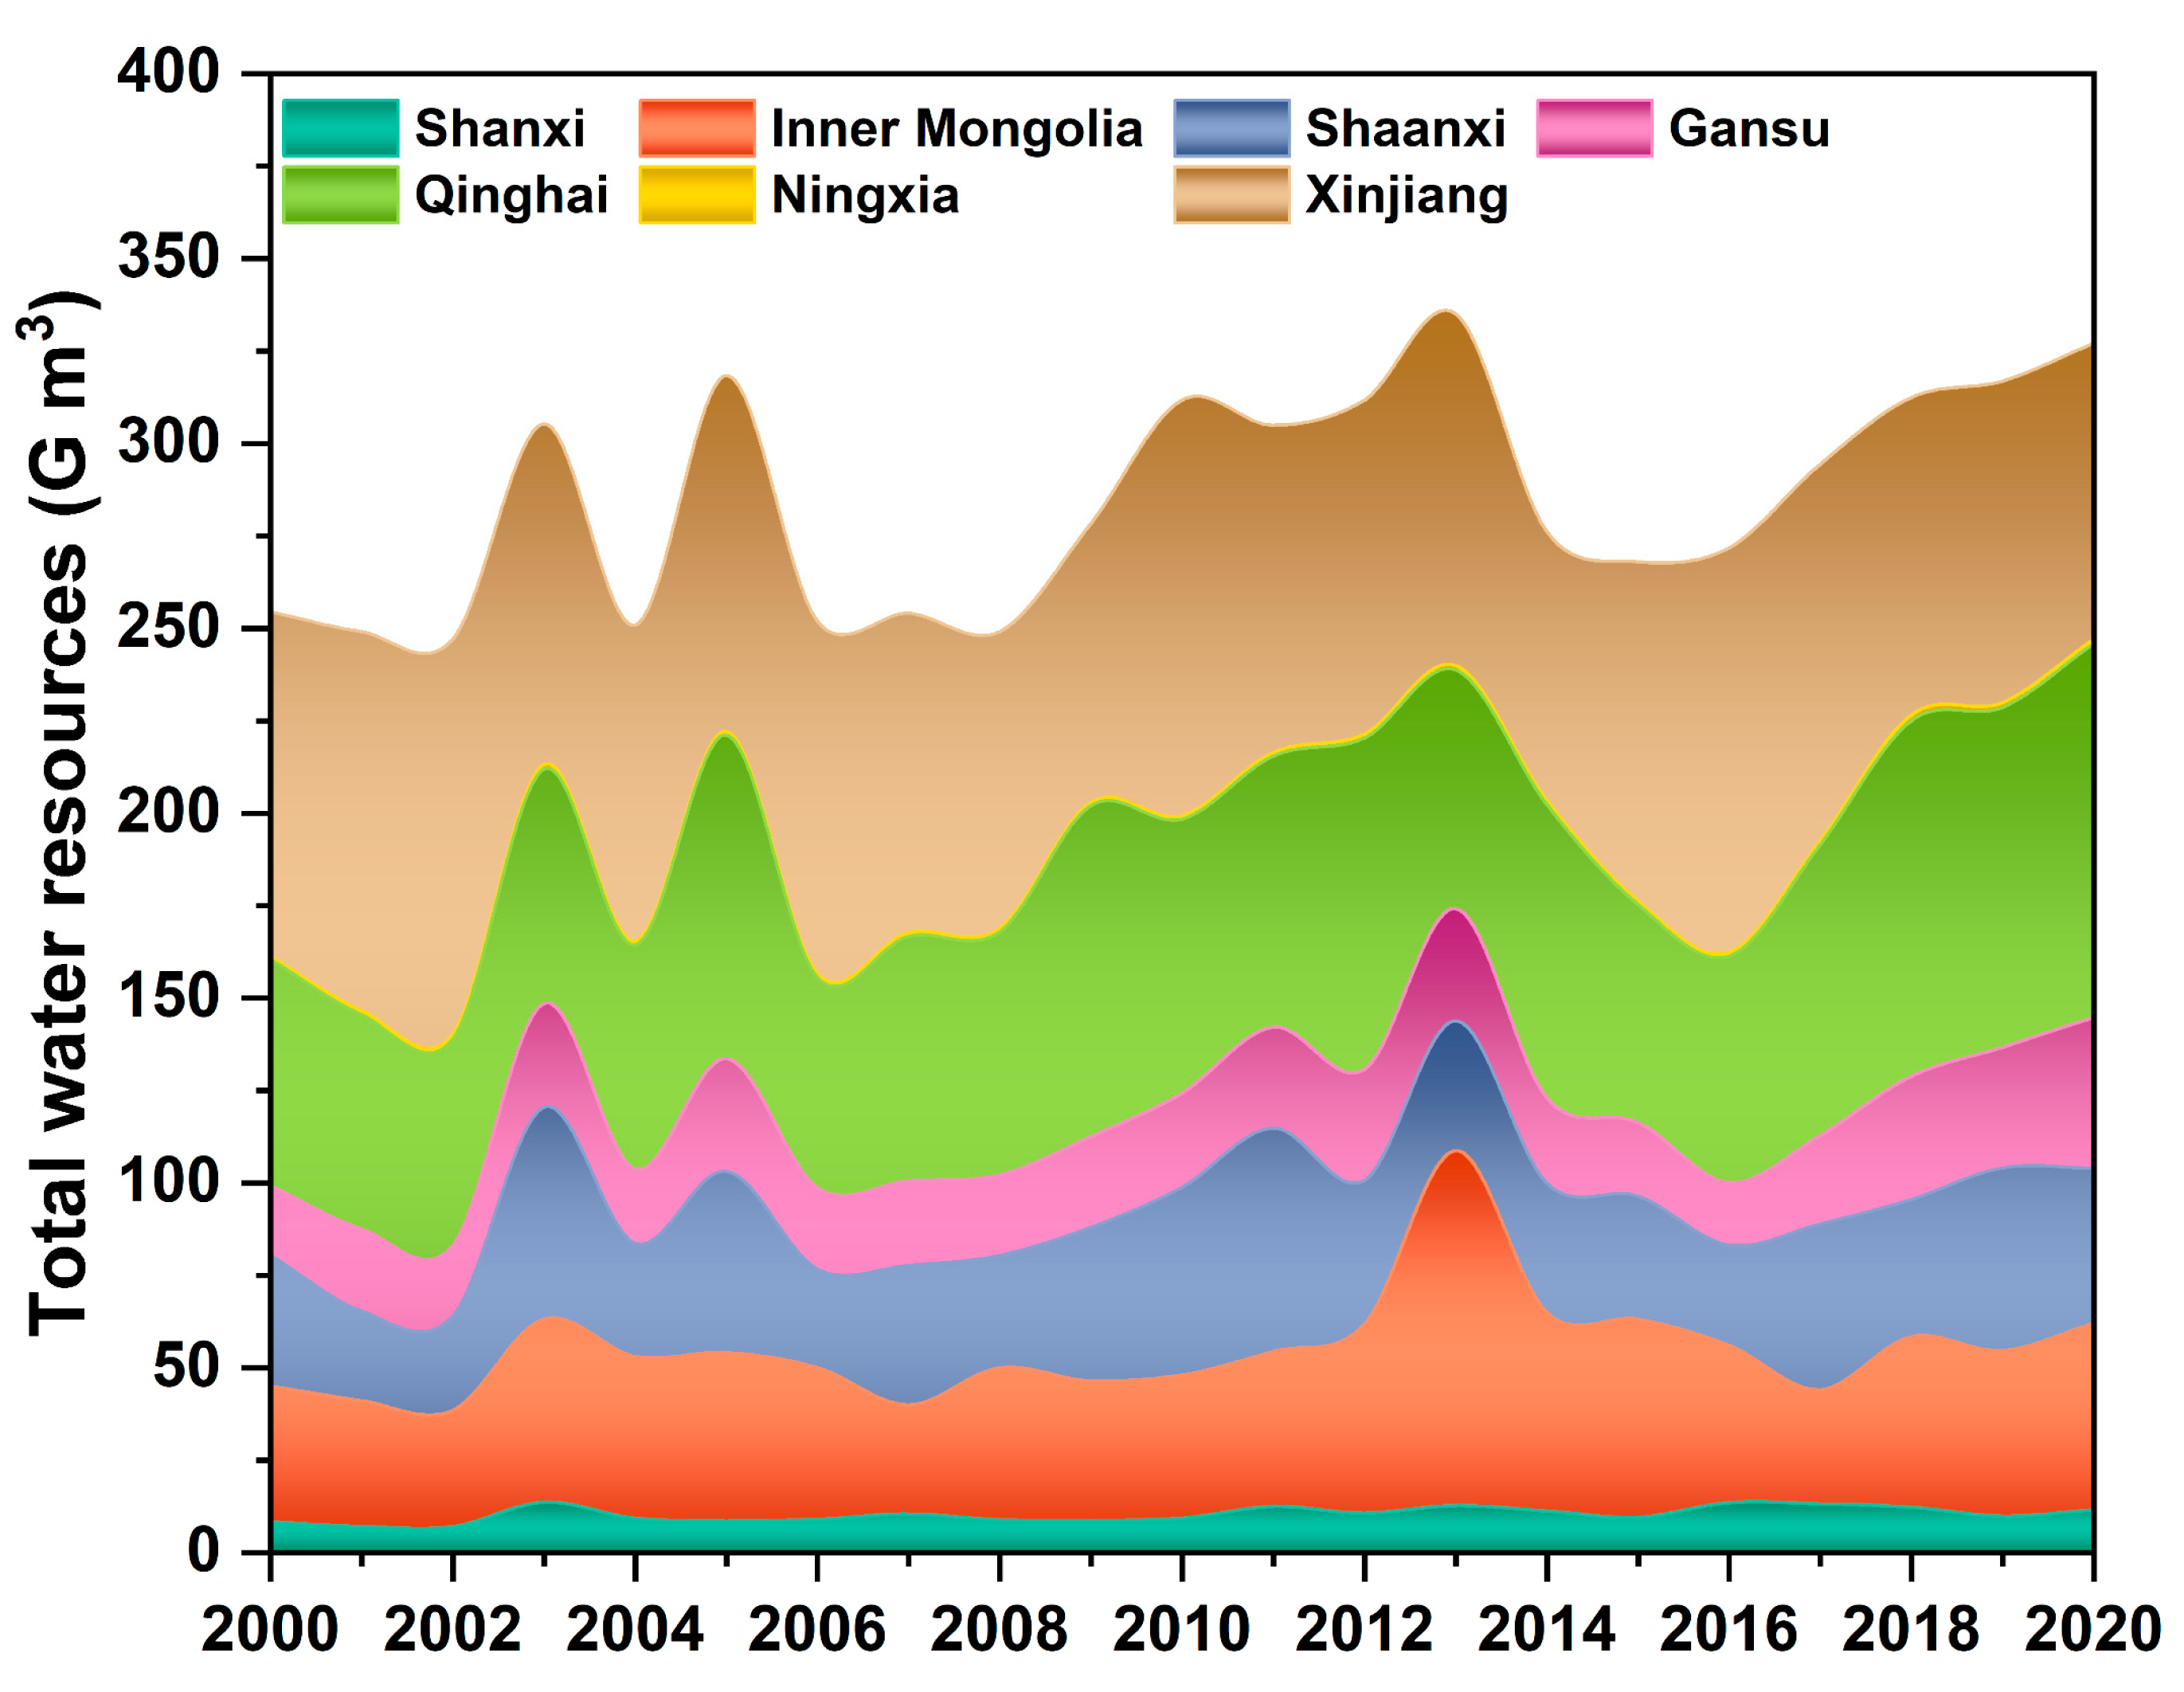
3.1.1. Spatial- and Temporal-Distribution Characteristics of Water Resources

The total amount of water resources in Northwest China remained stable, but the spatial distribution was significantly different. The increasing trend of water resources in Northwest China over time from 2000 to 2020 was not obvious, with an average annual increase of 1.9% (Figure 2). It can be seen that water resources in the region remained basically stable. Spatially, Xinjiang and Qinghai were richer in water resources, with multi-year averages of 91.8 and 73.1 G m3, respectively. They were 125.5% and 79.4% higher than the average values in Northwest China. Ningxia’s water resources were the scarcest, and its multi-year water resources were 97.4% lower than the regional average. In the arid Northwest of China, the abundance of water resources determined the amount of water available for agricultural production in the region and its potential for further increase.

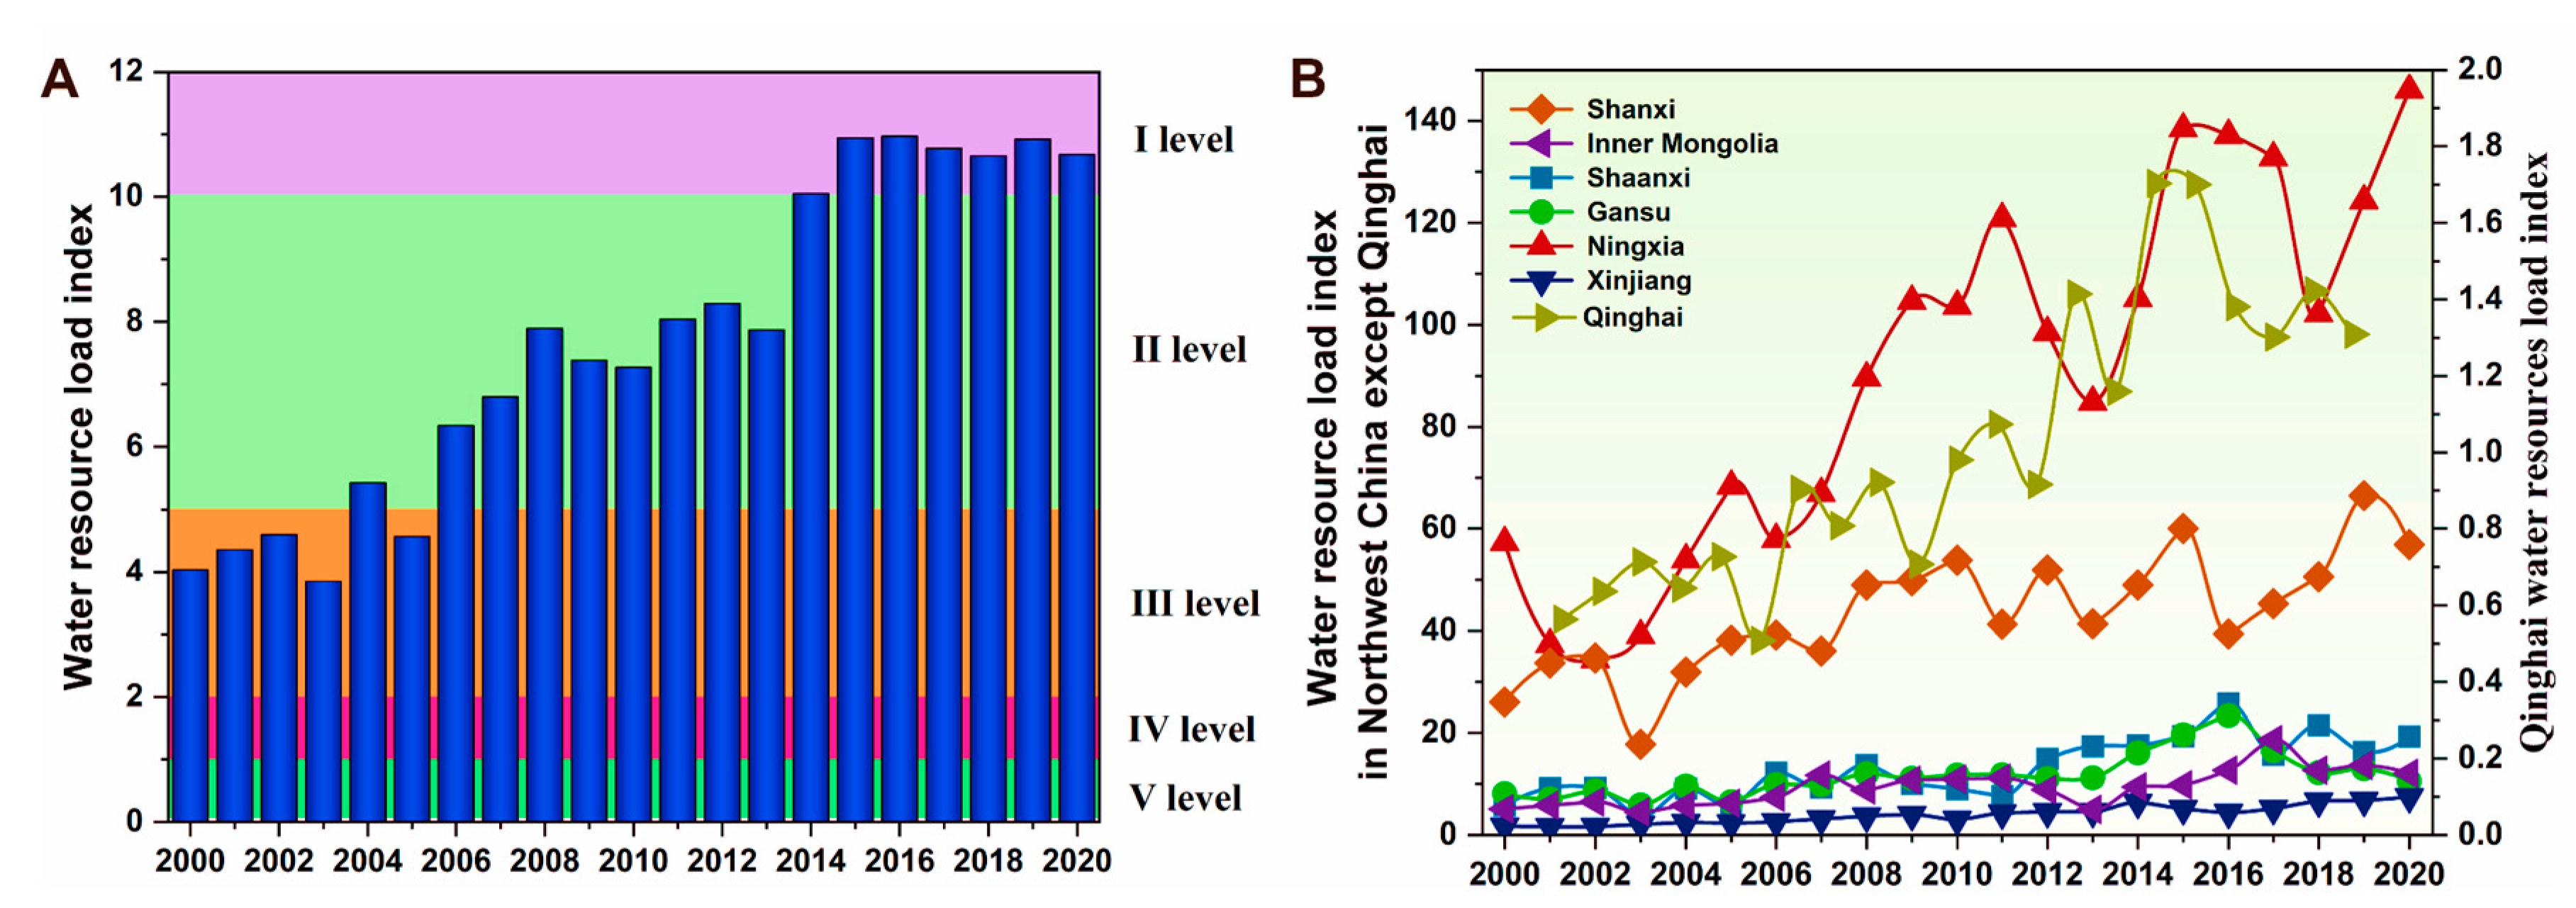
3.1.2. Analysis of Water-Resource Development Potential

The water-resource development potential in Northwest China decreased. From 2000 to 2020, the regional water-resource load index showed an extremely obvious increasing trend over time (p < 0.01), with an annual increase of 6.0% (Figure 3). Its water-resource load level increased from grade III in 2000 to grade I in 2020, which indicated that the region was already at a high water-resource stress level and that the water resources were no longer available for further development (Figure 3A). Among them, Ningxia, Inner Mongolia, Gansu, Shanxi and Shaanxi all had water-resource load ratings of grade I. All provinces in the region showed varying degrees of increase in water-resource stress over time (Figure 3B). Among them, Ningxia’s situation was particularly severe, and its multi-year average of water-resource load index was 91.0, which was 11.8 times that of Northwest China. From 2000 to 2020, the water-resource load index of Ningxia showed an increasing trend over time (p < 0.05) and increased by 154.9% from 57.3 to 146.1. The water-resource pressure of Qinghai in Northwest China was the smallest, and its water-resource load index increased from 0.6 in 2000 to 1.3 in 2020 over time. Its grade changed from V to IV, and the water-resource development potential decreased. Qinghai’s multi-year water-resource load index was 1.1, which was 86.7% smaller than the average value of Northwest China. On the basis of maintaining a perennial stability of regional water resources, the significant increase in the water-resource load index indicated the unsustainable utilization of regional water resources. This also indicated that the region was unable to meet the needs of the agricultural sector by further exploiting water resources, which threatened the sustainable development of regional food security and grain production.

3.1.3. Spatial and Temporal Characteristics of Water-Use Structure

Agricultural water consumption in Northwest China was gradually allocated to other departments, and its proportion was greatly reduced. In 2004–2020, the proportion of agricultural water in Northwest China had a significant reduction trend (p < 0.05). Based on the increase of 26.0% in crop plantation, its agricultural water use was reduced from 86.6% to 78.8%, with an annual decrease of 0.6% (Figure 4). Among the provinces, the most significant reductions in agricultural water use were in Inner Mongolia (p < 0.01) and Ningxia (p < 0.01). In 2004–2020, the two provinces increased their crop acreage by 49.9% and 1.4%, respectively. Their proportion of agricultural water use was reduced by 19.9% and 10.3%, respectively, with annual decreases of 1.4% and 0.7%, respectively. It is worth noting that Qinghai, with less water pressure, increased its share of agricultural water by 7.7% during the study period on the basis of its stable crop acreage. This showed that the decrease in the proportion of agricultural water consumption in provinces with large water-resource pressure in the region was passive. In other words, the reduction in regional agricultural water consumption was not only caused by the improvement of water-use efficiency but was also due to agricultural water consumption being mainly allocated to other departments and being forced to reduce the amount of water resources available for agricultural production.
Contrary to the trend of agricultural water consumption, the proportion of regional domestic and ecological water consumption to total water consumption significantly increased over time (p < 0.05), especially ecological water consumption. From 2004 to 2020, the proportion of ecological water in Northwest China showed a significant increase (p < 0.01) of 309.9%. From the spatial point of view, the proportion of agricultural water use in Northwest China was the largest, with an annual average of 83.6%. The minimum ecological water consumption was 3.9%. Based on the unique climate and soil conditions in Xinjiang and Ningxia, the largest agricultural water consumption was determined, and the proportion of agricultural water consumption in these two provinces for many years was 92.2% and 88.9%, respectively. The smallest proportion of agricultural water was that of Shanxi, which was 59.9%. Taking Shanxi as a benchmark, it could be seen that agricultural water in the provinces of northwest China had the potential to be further allocated. Therefore, with the further development of urbanization in the region and the gradual attention paid by the Chinese government to its ecological security, we can predict that the amount of regional domestic and ecological water consumption in the future will significantly increase. However, on the basis of the lack of the further development potential of regional water resources, agricultural water will likely be further allocated elsewhere. This is bound to pose new challenges to the sustainable development of regional agricultural production and food security.

3.2. Relationship between Water-Resource Demand and Food Security

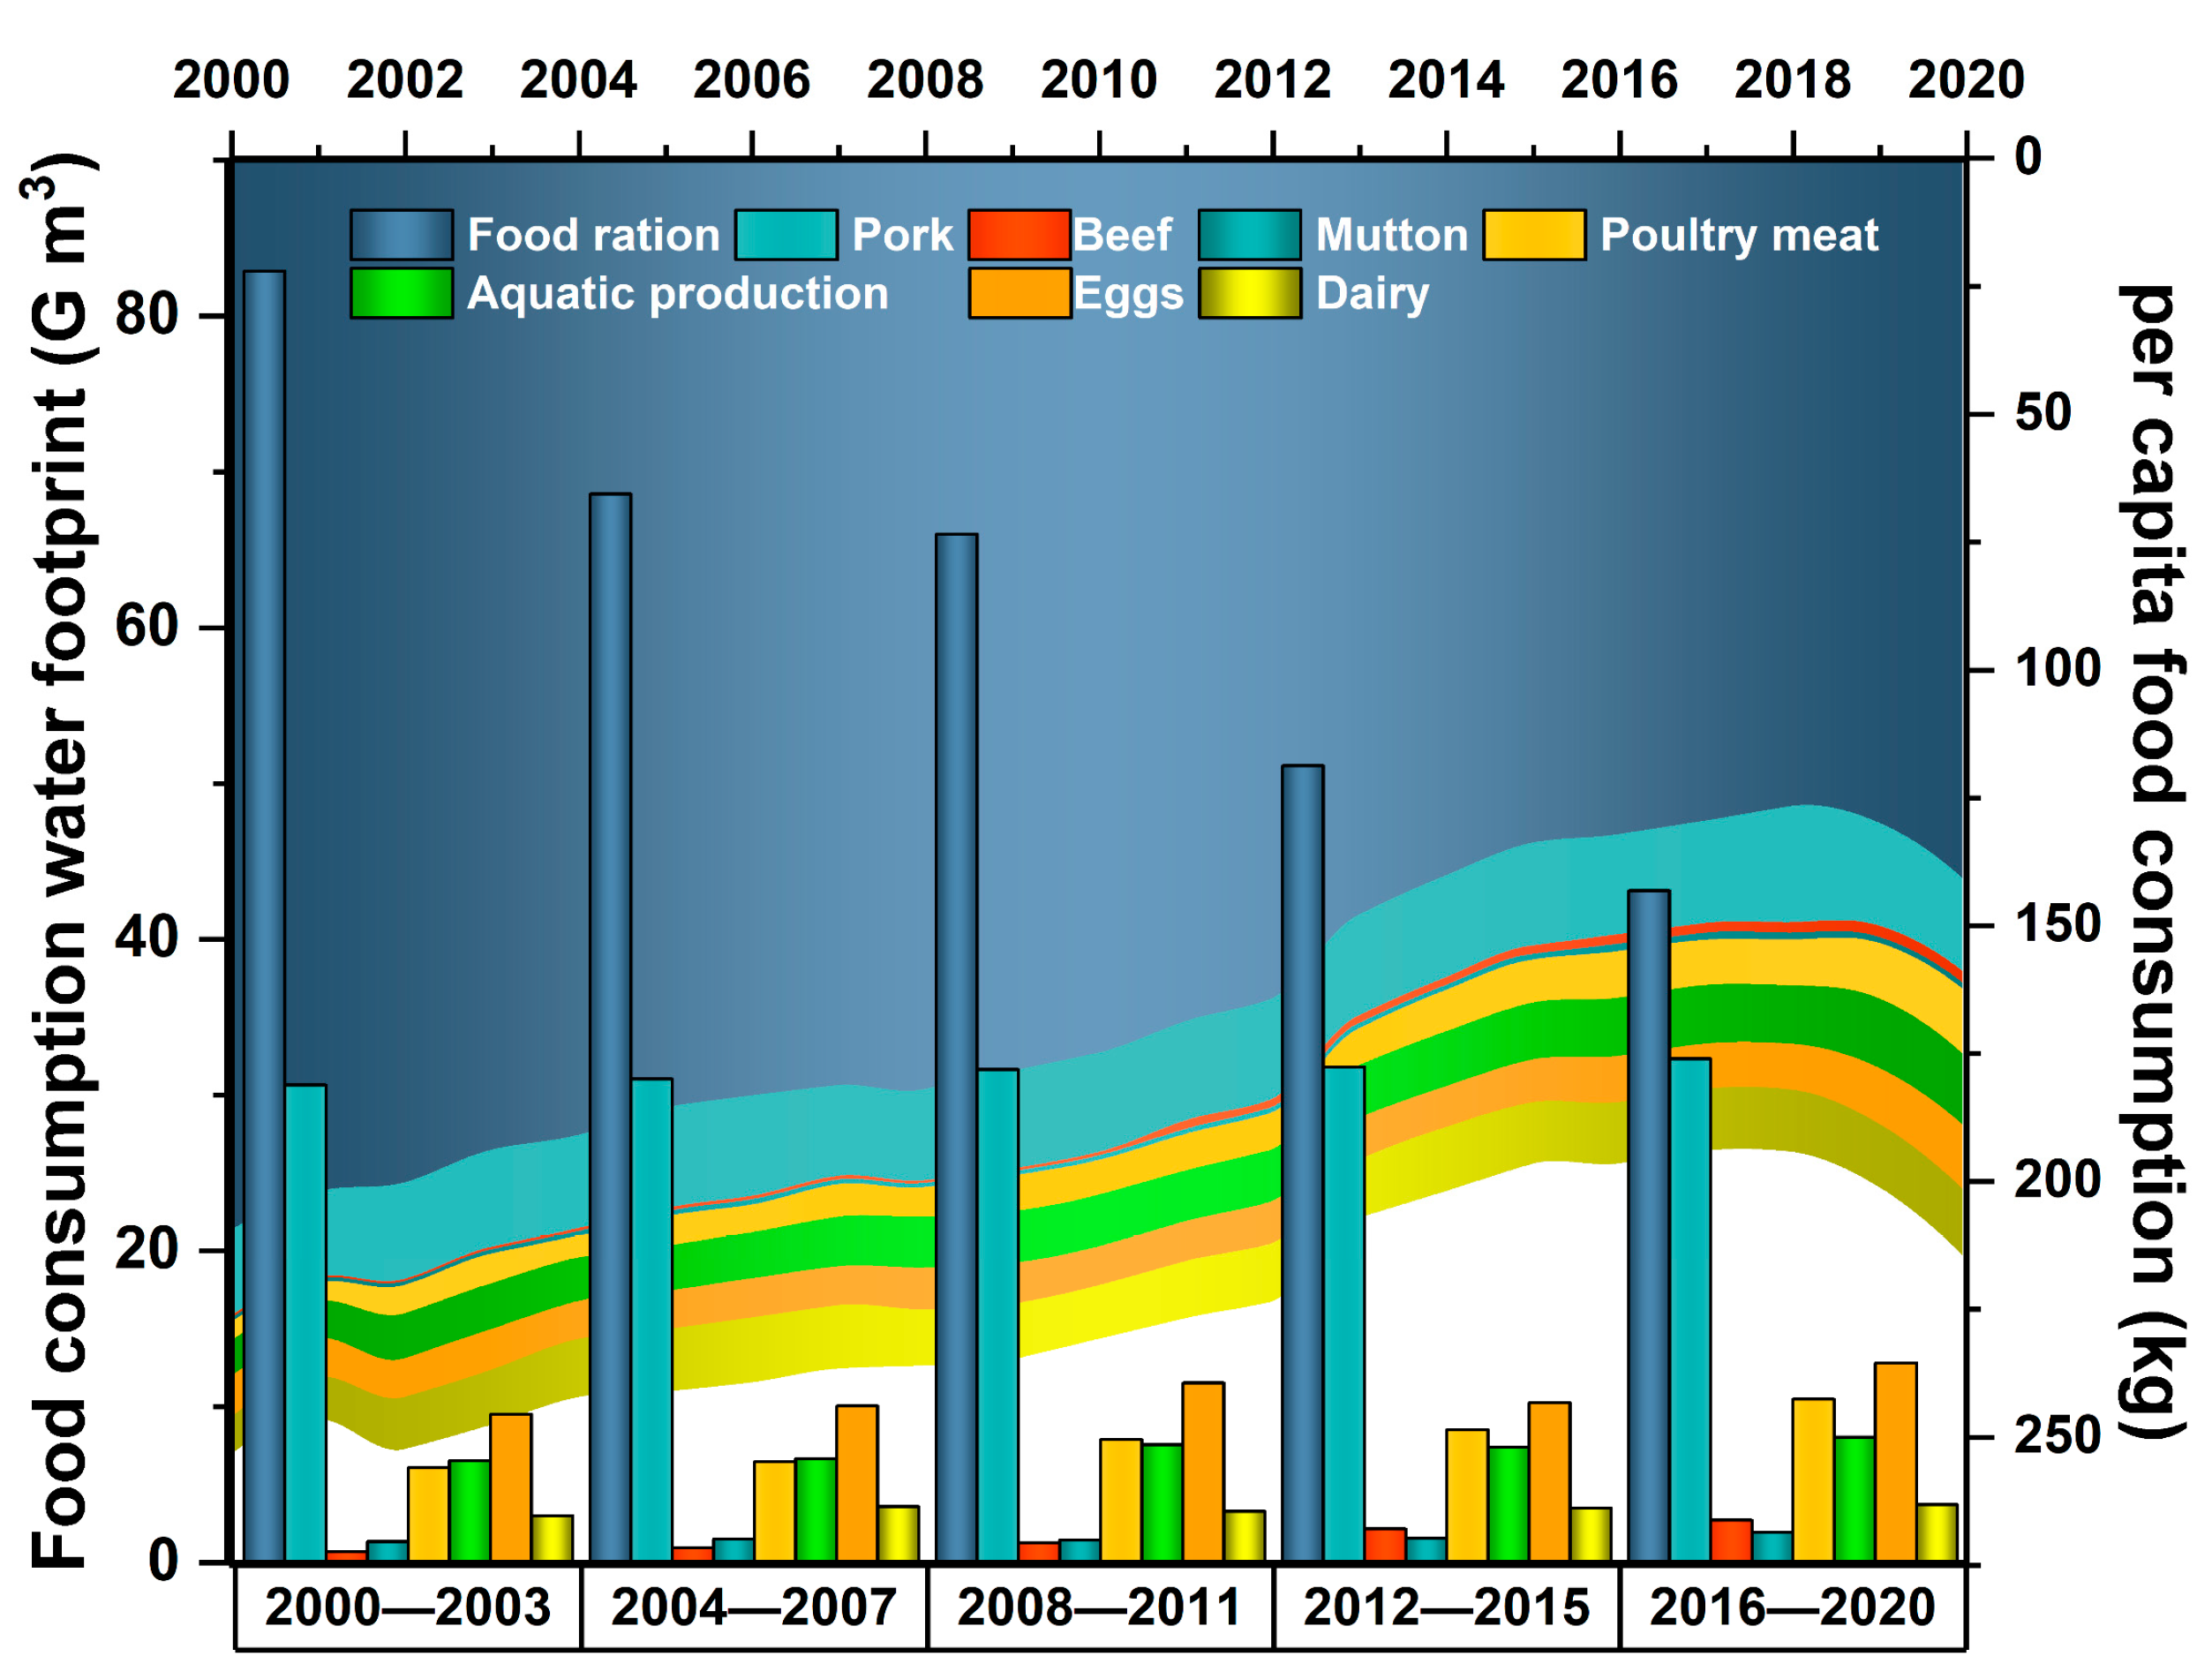
3.2.1. Effect of Dietary-Structure Change on Water-Resource Demand

With the increase in the income level, the dietary structure of residents changed, and the change in the dietary structure increased the demand for water resources for regional food security. In 2000–2020, the amount of per capita food-ration consumption was significantly reduced (p < 0.01) by 47.9% over the period (Figure 5). Pork (p < 0.05), beef (p < 0.01), mutton (p < 0.05), poultry (p < 0.01), aquatic products (p < 0.01), eggs and dairy products (p < 0.05) showed varying degrees of increase. Due to the change in the dietary structure of residents in Northwest China, the water footprint of food-ration consumption in this region showed a significantly decreasing trend (p < 0.01), with an annual decrease of 3.4%. The water-consumption footprints of pork, beef, mutton, poultry, aquatic products, eggs and dairy products in the region increased by varying degrees. Especially, for beef and poultry, the average annual growth rates were 9.9% and 6.3%, respectively. The animal products consumed by residents were mainly pork, eggs, poultry and aquatic products. The water footprints of four types of grain consumption accounted for 28.1%, 11.1%, 9.1% and 7.0% of the total water footprint, respectively. Since different foods require different water footprints for the same calorie supply, animal products rank higher than grain in this respect. For example, on the basis of providing the same calories, dairy products need a 9.8 times higher water footprint than grain [7]. This indicates that the change in the dietary structure of residents will likely increase the amount of grain and water resources required to meet regional food security.

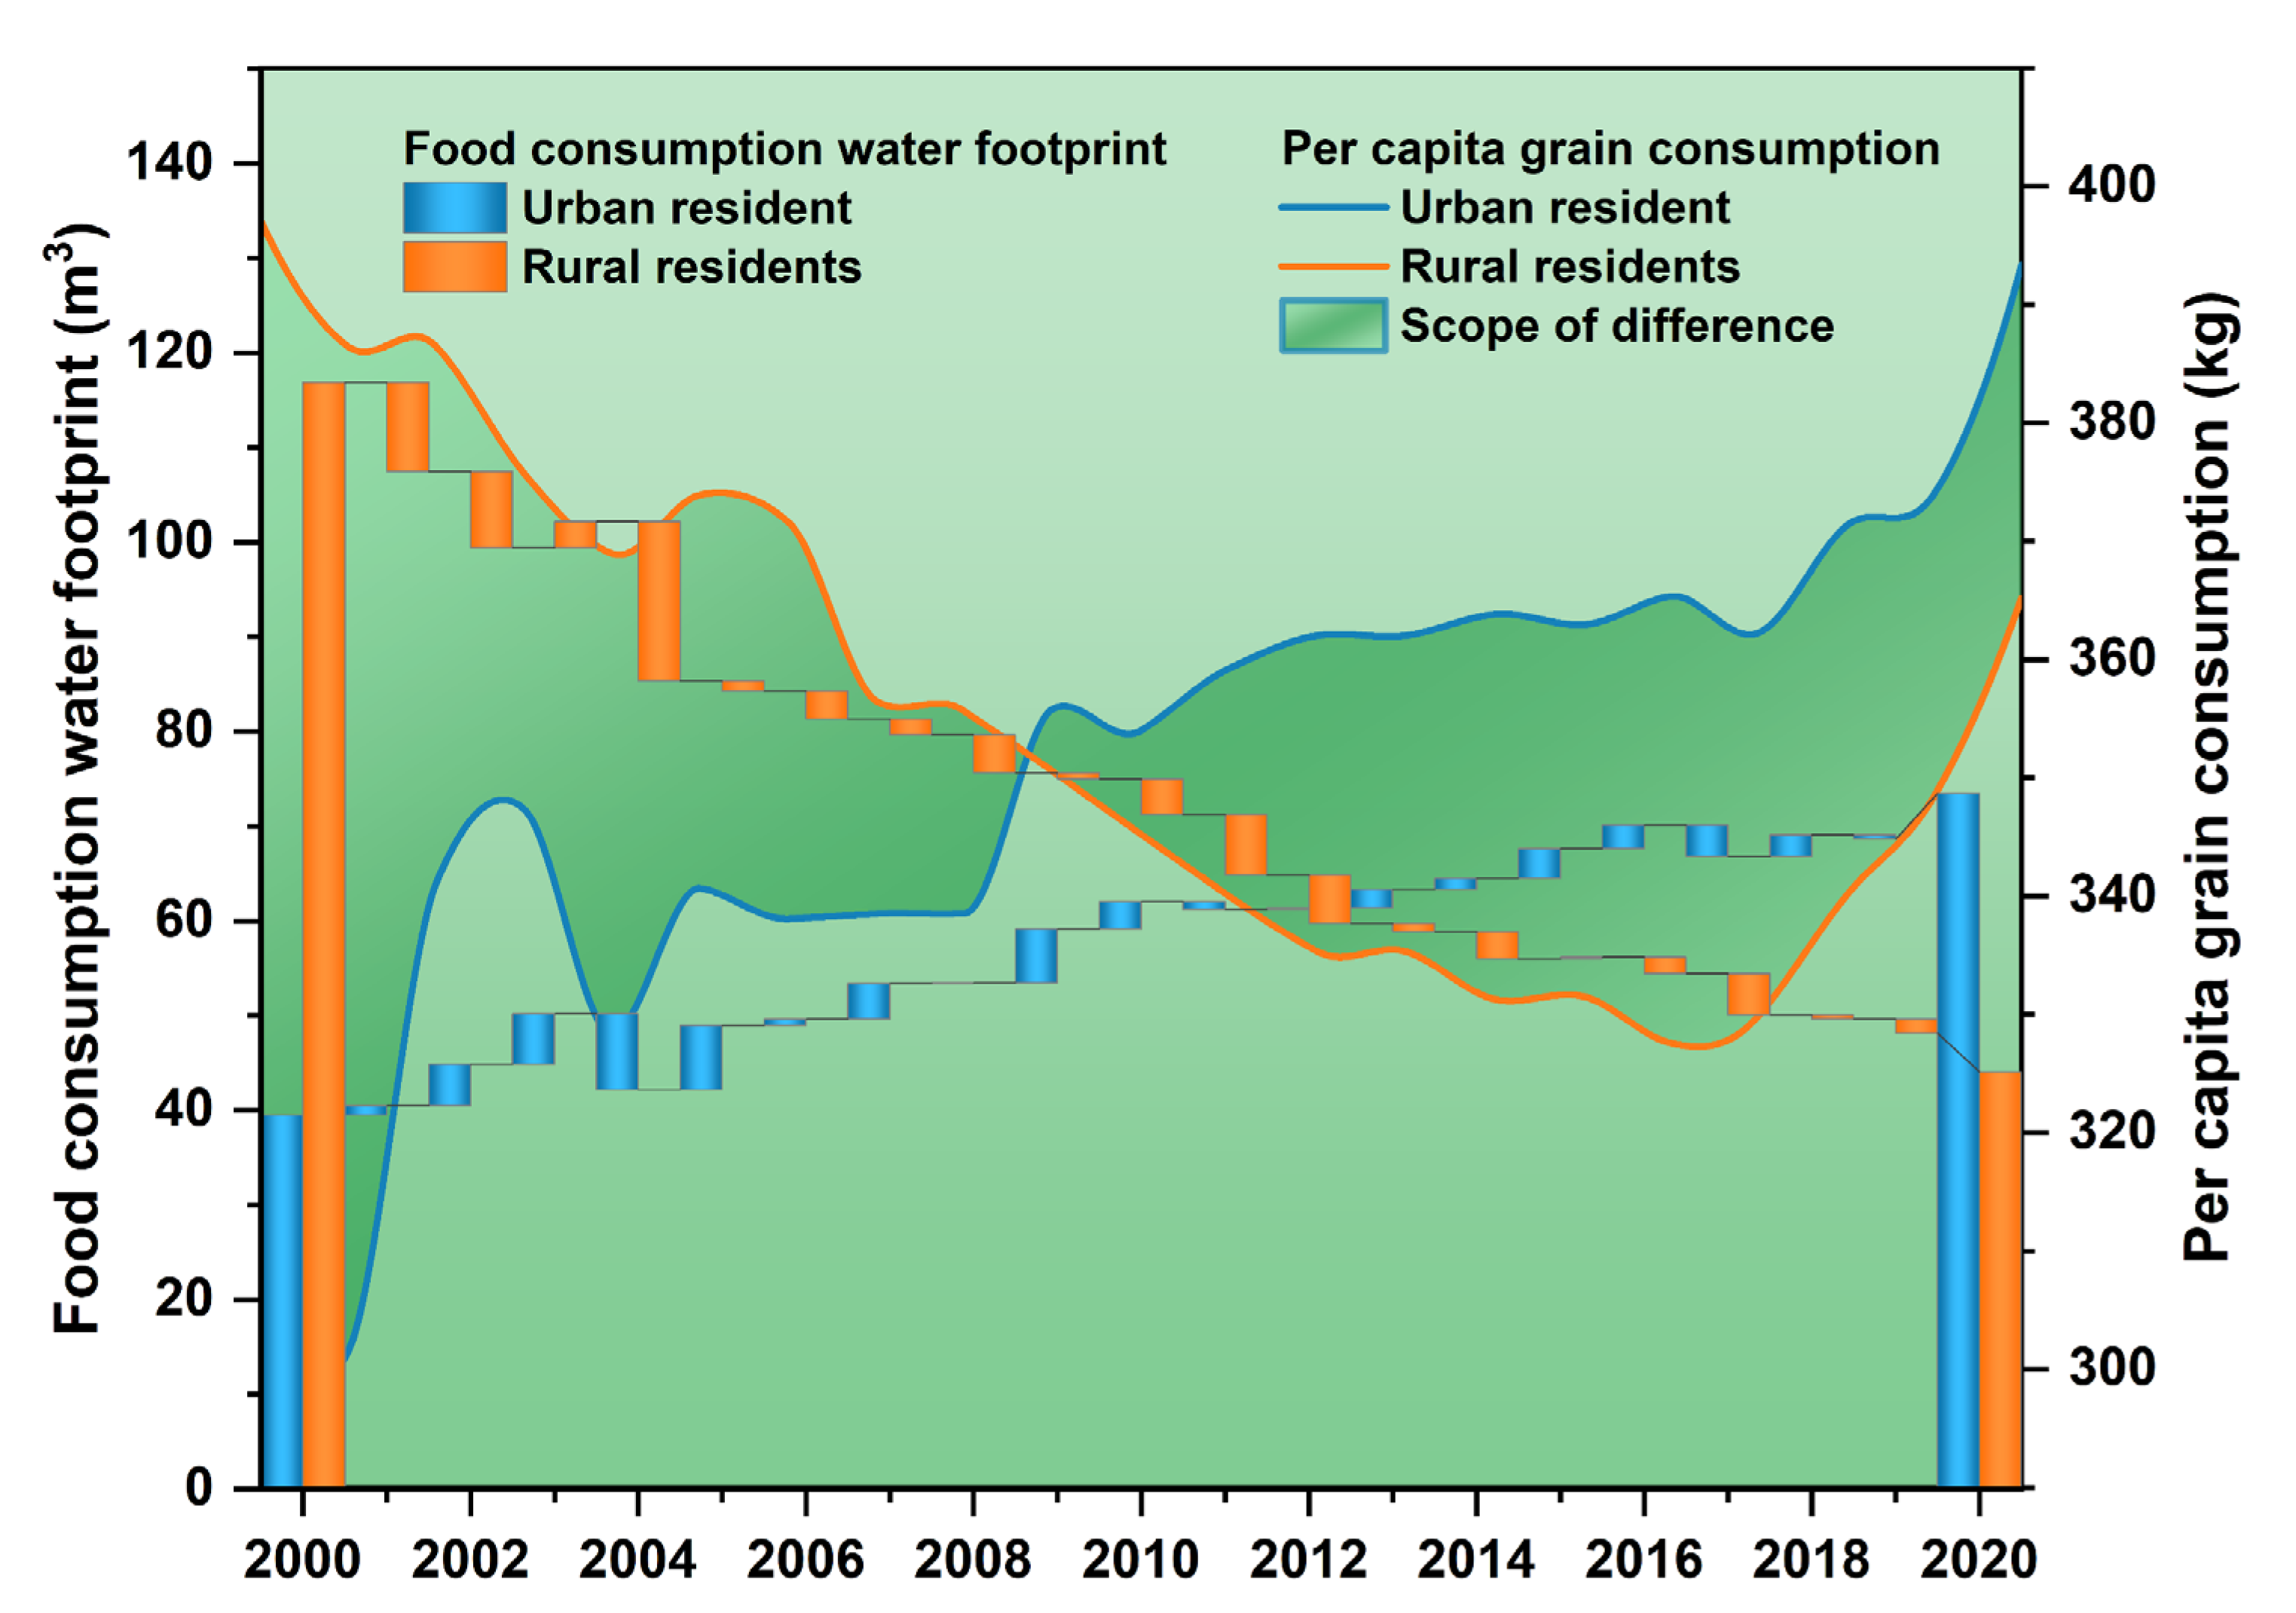
3.2.2. Impact of Population Urbanization on Water-Resource Demand

Due to the different distribution of environment, resources and food, urban and rural residents have different dietary preferences, which leads to different water-consumption footprints in urban and rural areas. As living standards improved, per capita grain consumption of urban and rural residents in Northwest China showed fluctuating upward and downward trends, respectively (Figure 6). In 2000–2020, the per capita grain consumption of urban residents showed an indigenous increasing trend (p < 0.05), an increase of 26.9%, with an average annual increase of 1.3%. It is worth noting that in 2017–2020, the per capita grain consumption of urban and rural residents showed an upward trend, and the two gradually approached one another over time. This was the inevitable result of the narrowing of urban–rural differences and the achieving of coordinated development. The water footprint of grain consumption, which is closely linked to grain consumption, showed a relatively similar trend. With rapid urbanization, the urban population significantly increased as a result of the massive migration of rural residents to cities. The urban population increased from 44.4 million in 2000 to 98.8 million in 2020, an increase of 122.5%. Urban residents had greater per capita grain consumption than rural ones, which increased the regional demand for grain and water resources. From 2000 to 2020, the water footprint of grain consumption of urban residents in Northwest China showed a very significant increasing trend (p < 0.01), and the water footprint of grain consumption increased by 85.9%. It is worth noting that due to the decrease in regional production water footprint (in 2000–2020, it decreased by 34.1%), the increase in urban residents’ grain-consumption water footprint was smaller than those of the population and the per capita grain consumption. In conclusion, the improvement of urbanization increased the water footprint of regional grain consumption and put forward higher requirements for food security and water resources.

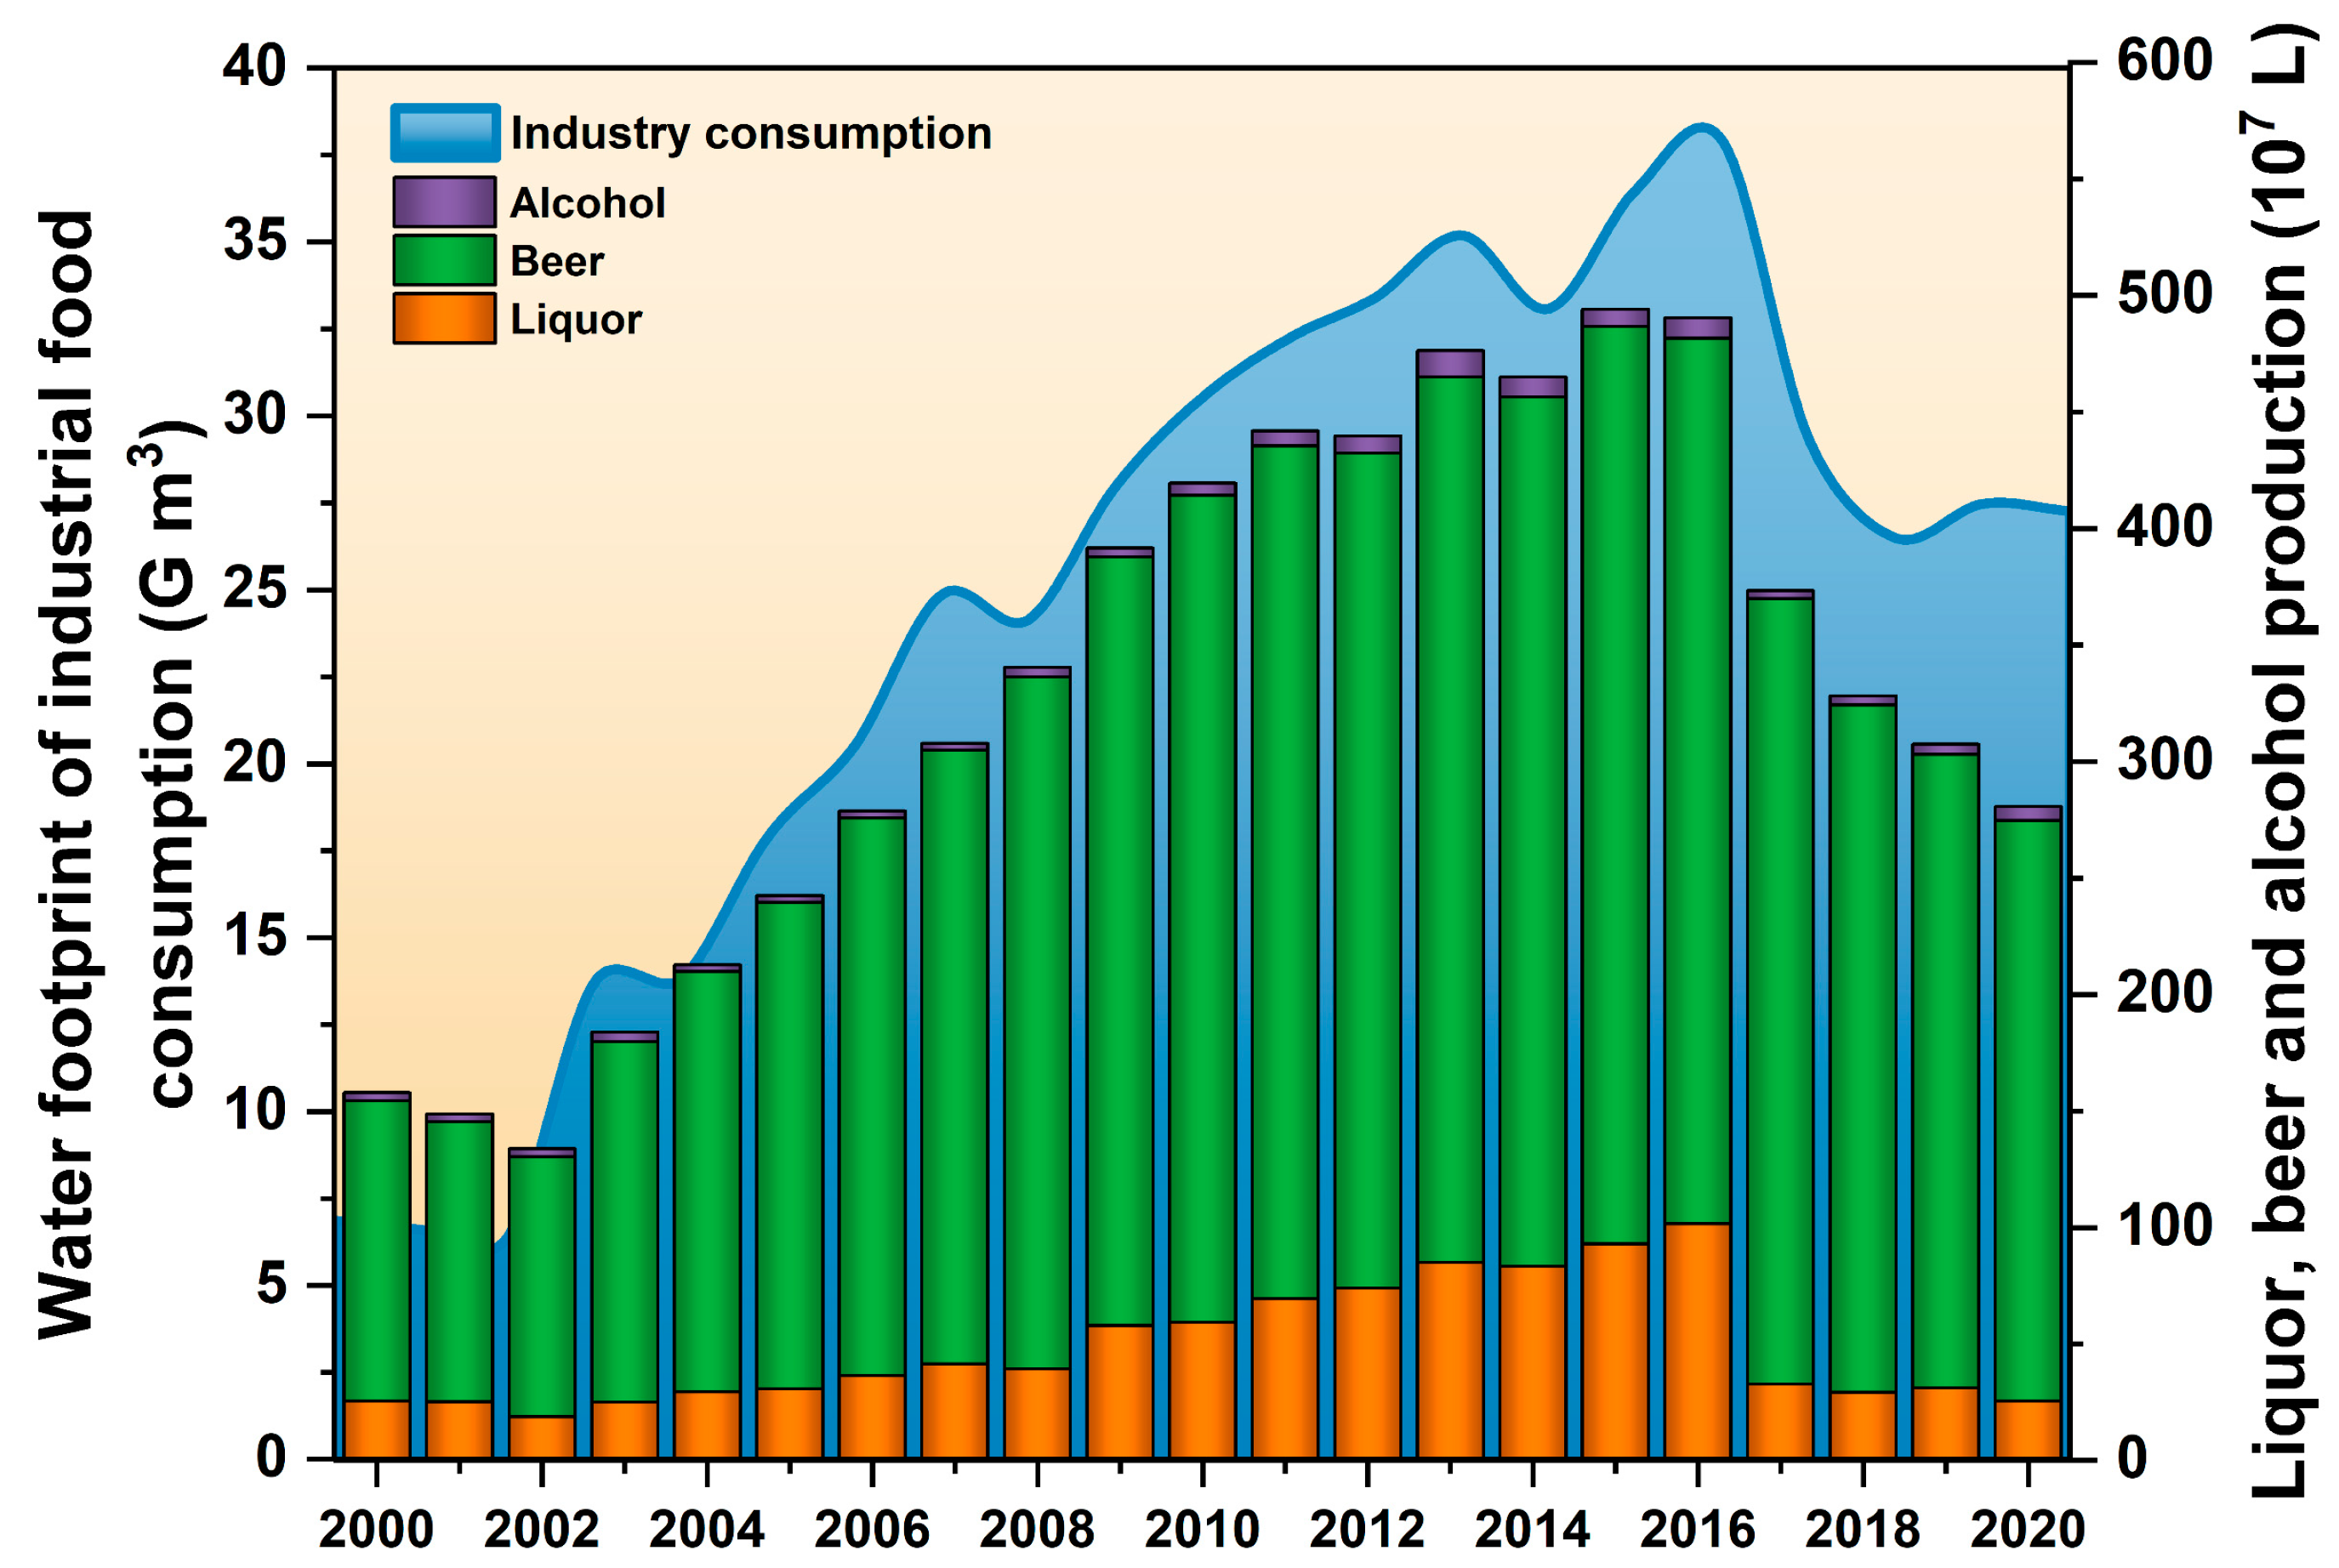
3.2.3. Impact of Industrial Consumption on Water-Resource Demand

With the rapid development of the regional economy, the grain water footprint of industrial consumption increased year by year. From 2000 to 2020, the grain water footprint of regional industrial consumption showed an extremely significant increasing trend (p > 0.01), with an annual increase of 9.3% (Figure 7). The large increase in the water footprint of industrial grain consumption will likely aggravate the demand for grain and water resources in the region and bring greater challenges to regional food security.
It is noteworthy that the water footprint of regional industrial consumption showed a significant downward trend from 2017 to 2020. Compared with 2016, in 2017, it decreased by 22.6%. In addition to the decrease in the water footprint of grain production, the main reason for the sharp decrease in the water footprint of industrial consumption in 2017 was the decrease in liquor, beer and alcohol production. The sharp decrease in liquor production is mainly attributed to the following: (1) Policy orientation: “The three public consumptions” policy (The Chinese government issued restrictions on government officials’ fees for overseas trips, officials’ reception fees and the purchase and maintenance of official vehicles.) promulgated by the Chinese government directly reduced the amount of liquor consumption by restricting government personnel’s travel-related food and drink consumption. Moreover, with the government’s increasing penalties for drunk driving and the widespread publicity of “driving without drinking”, people dared not drink too much, which directly led to a decline in liquor production. (2) China‘s economy is still in the processes of slowly digesting excess capacity, deleveraging and defoaming. The downward pressure on the economy continued to increase from 2014, especially due to the restrictions on “the three public consumptions”, which led to structural adjustment and price declines in the liquor industry. (3) With the improvement of residents’ health awareness, residents began to slowly exclude alcohol, no longer excessively drank or even no longer drank, resulting in liquor-production decline. (4) Consumption upgrading caused by the increase in per capita disposable income: This reduced the demand for low-priced wine and increased the demand for high-priced wine. In order to survive, enterprises had to take the high-end route to actively improve the price of liquor. However, the rise in liquor prices inhibited the consumption demand of some residents for liquor. If liquor prices continue to increase, more demand will likely be inhibited. In general, the grain water footprint of industrial consumption in Northwest China is increasing, which intensifies the pressure on water resources in arid areas and brings greater challenges to food security. However, the promulgation of relevant national policies and the change in residents’ wine-drinking preferences alleviated the demand for industrial grain, regional grain and water resources to a certain extent and brought certain positive effects on ensuring regional food security.

4. Discussion

4.1. Water Resources and Food Security Will Likely Face Greater Challenges in the Future

In the future, the contradiction between water supply and demand in Northwest China will likely be sharp, and the water footprint of grain consumption will likely surge. From the perspective of water-resource supply, the total amount of water resources in Northwest China is in a stable state (Figure 2), and it is now at a high water-resource pressure level (its water load index was grade I in 2020), so there is no potential for further development (Figure 3). From the perspective of water-resource allocation, with the rapid development of industrialization and urbanization and the high attention to the ecological environment, the non-agricultural phenomena of agricultural water resources in this region are serious (especially in water-resource shortage areas), exacerbating the contradiction between the supply of and demand for regional water resources. As shown in Figure 4, the proportion of agricultural water consumption in Northwest China decreased by 9.0% from 2004 to 2020, while the ecological and living water consumption increased by 309.9% and 55.0%, respectively. In terms of water demand, with the development of the economy and urbanization, the dietary structure of residents is changing, and residents are more inclined to consume more water-consuming animal products. As shown in Figure 5, in 2000–2020, the amount of per capita food ration consumption was significantly reduced (p < 0.01), by 47.9%, over the period. Pork (p < 0.05), beef (p < 0.01), mutton (p < 0.05), poultry (p < 0.01), aquatic products (p < 0.01), eggs and dairy products (p < 0.05) showed varying degrees of increase. Secondly, residents’ demand for industrial consumer products substantially increased, leading to an increased demand for industrial grain. From 2000 to 2020, the grain water footprint of regional industrial consumption showed an extremely significant increasing trend (p > 0.01), with an annual increase of 9.3% (Figure 7). Moreover, urban residents had a greater per capita grain demand than rural areas (in 2020, the per capita grain consumption of urban residents was 7.7% higher than that of rural ones) (Figure 6), and urbanization led to a large transfer of rural residents to cities. With the further development of urbanization in the future, the water footprint of grain consumption in Northwest China will likely further increase. On the basis of excluding the impact of economic and social development, climate change and agricultural production technology on future agricultural production, it is expected that the water-consumption footprint used to meet food security in 2030, 2040 and 2050 will increase by 39.4%, 52.3% and 63.7% compared with 2020, respectively (Table 2). In conclusion, on the basis of the further increase in the water footprint of regional grain consumption expected in the future, the water resources used for agricultural production do not have the potential for further increase (Figure 3), or they even decrease year by year (Figure 4). This means that the amount of water resources needed for regional food security cannot be achieved by developing/increasing agricultural water inputs. Only by improving the efficiency of agricultural water resources, can we reduce the amount of water resources needed for regional food security. Therefore, it is urgent to take effective measures to reduce the amount of water resources used to meet food-security needs.

4.2. Measures to Effectively Reduce the Water Footprint of Crop Production and Water-Consumption Footprint

In order to realize the sustainable development of regional water resources and grain production, it is necessary to improve the efficiency of the regional agricultural use of water resources, that is, to reduce the water footprint of various grain crops in the region. As shown in Figure 6, the water footprint of grain production decreased due to improved crop-water-utilization efficiency in the Northwest region. As a result, the increase in the water footprint of grain consumption in Northwest China was smaller than the increase in the population in Northwest China and per capita consumption demand. Therefore, measures must be taken to improve the water-use efficiency of crops in order to reduce the regional production water footprint [7]. This would help to reduce the amount of the water-resource demand for grain production on the basis of increased regional grain-consumption demand and better guarantee food security and the sustainable development of grain production.
(1) Optimize the regional crop-planting structure. The regional planting structure needs to be adjusted according to the relative comparative advantage in producing each crop (the comparative advantage in producing the same crop in different regions) and the absolute comparative advantage (the comparative advantage in producing different crops in the same region). ① Relative comparative advantage in producing crops: (a) Blue-water footprint of crop production. The blue-water footprint of rice production in Shaanxi Province had a comparative advantage and was 38.1% smaller than the average value of Northwest China (Figure 8A). Shaanxi, Gansu, Inner Mongolia and Shanxi Provinces had a comparative advantage in producing rice. Provinces with a comparative advantage in producing wheat (blue-water footprint) were Shaanxi, Shanxi and Inner Mongolia, whose production blue-water footprints were 52.5%, 43.9% and 34.5% smaller than the regional average, respectively. Moreover, the provinces with a comparative advantage in producing corn were Shaanxi, Shanxi, Qinghai and Inner Mongolia, whose footprints were 50.9%, 34.4%, 31.6% and 30.5% smaller than the regional average, respectively. (b) Green-water footprint of crop production. In terms of rice, the provinces with a comparative advantage in this region were Shanxi, Shaanxi and Gansu, respectively, and the footprints of the production of green water were 50.4%, 25.5% and 6.3% higher than the regional average, respectively (Figure 8B). The provinces with a comparative advantage in producing wheat were Qinghai, Gansu and Shanxi, whose footprints were 54.5%, 11.6% and 9.4% higher than the regional average, respectively. Similarly, Xinjiang, Inner Mongolia, Ningxia and Gansu Provinces had a comparative advantage in producing maize. Improving the utilization efficiency of regional crops for green water could help to reduce the amount of crop demand for blue water. (c) Grey-water footprint of crop production. The provinces with a comparative advantage in producing wheat in this region were Shanxi, Xinjiang, Shaanxi and Gansu, and the production footprints of gray water were 39.2%, 34.0%, 25.5% and 22.9% lower than the average of Northwest China (Figure 8C). Similarly, Shanxi Province, Inner Mongolia Province, Xinjiang Province and Ningxia Province had a comparative advantage in terms of maize gray-water footprint in this region. ② Absolute comparative advantage in producing crops. Different crops in the same region have different production water footprints, that is, they represent an absolute comparative advantage: (a) Blue-water footprint of crop production. The most significant difference in the water footprint of crop production in this region was in Qinghai, and soybean had a footprint 90.5 times that of potato. The crops representing an absolute comparative advantage were potato and corn, which were 0.05 and 0.27 times the average of grain crops in Qinghai, respectively. The smallest difference was in Inner Mongolia, with the largest blue-water footprint of soybean produced being only 21.5 times that of potato. The crops representing an absolute comparative advantage in Gansu were potato, corn and rice. (b) Green-water footprint of crop production. The most significant difference in the footprint of crop production was in Qinghai, where the footprint of soybean was 11.8 times that of potato, and the crops representing an absolute comparative advantage were soybean and wheat. The smallest difference was in Xinjiang, where the footprint of soybean was only 4.8 times higher than that of potatoes. Therefore, we should expand the planting area of crops in areas with relative and absolute comparative advantages, while correspondingly reducing the proportion of crops that do not represent a comparative advantage. This would help to improve the efficiency of regional agricultural water-resource utilization (blue, green and gray water) and reduce the amount of water resources needed for grain production, so as to alleviate regional water pressure and promote food security and the sustainable development of grain production.
(2) Strengthen the management level of field management and promote water-saving irrigation technology. By performing the comparative analysis of grain-production water footprint in Northwest China and the national average level, it could be seen that grain-irrigation-water productivity in this region was still lower than the national average, that is, its production water footprint was larger than the national average, indicating that it still had great water-saving potential [3]. The goal of reducing the regional grain-crop-production water footprint could be achieved with the following strategies: (a) We should increase the support for irrigation and water-conservancy infrastructure; vigorously promote agricultural mechanization [41]; and promote water-saving irrigation technology, such as drip irrigation [42,43,44], sprinkler use [45,46], direct root-zone irrigation [47], deficit irrigation [9,13,48], alternate partial root-zone irrigation [13], negative-pressure irrigation [49], the application of crop close planting [50], intercropping [51], film mulching [18,42,50,52] and biochar application [53,54] in the fields, thus improving the utilization efficiency of blue-water and green-water resources from the perspective of crop physiology. New drought-resistant crops could also be cultivated [15,55]. Then, we should minimize the demand for blue-water resources in regional grain production, relieve the pressure of regional water resources and promote the coordinated development of regional water resources and grain production. (b) On the basis of ensuring the maximum utilization efficiency of blue-water utilization, we should also focus on green-water resources. This goal could be achieved by increasing the application of ridge–furrow mulching systems [17], rain-intelligent agriculture [56], plastic film mulching [18], water-retention agents [57], crop rotation and other technologies. In addition, according to the regional precipitation characteristics, the crop-planting period should be appropriately adjusted to make the reproductive period coincide with precipitation, which can maximize the regional utilization efficiency of precipitation. The above measures can relieve the pressure of regional water resources and realize the sustainable development of grain production. (c) Figure 8 shows that the regional grain-ash water footprint constituted a large proportion of the grain water footprint. Taking measures to reduce the regional gray-water footprint would not only help to indirectly reduce the demand for water resources of regional grain production but also help to promote regional ecological security. For example, on the basis of vigorously developing regional water-saving irrigation technology, we should improve the utilization efficiency of crop nitrogen fertilizers by implementing integrated water–fertilizer irrigation, precision fertilization and soil fertilization [58] to reduce the demand for chemical fertilizers for crop growth by developing organic agriculture [59], etc. (d) On the basis of the above measures, the region should also change the current business model of small-scale farmers to integrated and intelligent agriculture (integrating modern information technologies such as the Internet, the Internet of Things, Big Data, cloud computing and artificial intelligence with agriculture, so as to realize the new agricultural production mode of agricultural information perception, quantitative decision making, intelligent control, precise investment and personalized service), so as to reduce the blue-water footprint and gray-water footprint of crops and increase the green-water footprint. Therefore, the above field-management measures are expected to reduce the amount of water resources needed for grain production while satisfying regional food security, so as to relieve the pressure on regional water resources and achieve the sustainable development of grain production.
(3) Reasonably guide residents to change their diet structure. As shown in Figure 5, residents’ spontaneous eating habits gradually changed from food rations to animal products, and the production of animal products requires more water resources. Therefore, the footprint of water consumption could be reduced by reasonably guiding residents to change to a healthy diet [60,61,62]. For example, eating “fruit-dairy” can provide more energy than “meat-fish-poultry-egg” and “bread-grain-rice-pasta”, while effectively reducing the water-consumption footprint [63]. A complete replacement of cereals with starchy roots in the diet would lower the agricultural water demand by 25% [21]. In order to promote the transformation of residents’ dietary structure to a healthy diet, some relevant policies and measures could also be appropriately promulgated to encourage them to cooperate. For example, the large reduction in alcohol consumption in the Chinese market is mainly attributed to the implementation of “the three public consumptions” policy.
(4) Strengthen the food trade among regions/countries. As shown in Figure 8, the various grain crops within the region had relative and absolute comparative advantages, as well as among regions/countries. Therefore, on the basis of ensuring the absolute security of regional grain rations, the proportion of the planted water-intensive crops should be moderately reduced in favor of water-sparse crops. The consumer demand for scarce water-intensive crops could be met with the food trade among regions/countries [64]. This would help to relieve water pressure on the basis of ensuring food security in the region [65] and would also help to save the amount of water used worldwide for grain production [66].

5. Conclusions

Exploring the coupling characteristics of regional water resources and food security can not only better realize the sustainable development of regional water-resource utilization and grain production but also help decision makers to take targeted measures in advance. This study uses the concept of water footprint, systematically reveals the coupling characteristics of water resources and food security in Northwest China from the aspects of regional “water supply”, “water use” and “water demand” and clarifies the new challenges facing regional food security from the perspective of water resources. The main conclusions are reported below.
(1) Water-resource pressure in Northwest China is already at a high level, and there is no potential for further development. With the improvement of urbanization and the government’s attention to the ecological environment, the phenomenon of regional agricultural water resources is further intensified, and the amount of available agricultural water resources and grain production are seriously threatened. Moreover, the transformation of dietary structure, urbanization development and industrial-grain-use increase have brought higher requirements for regional food security and water resources. These factors pose great challenges to ensuring regional food security and the sustainable development of grain production.
(2) The production of animal products needs greater water footprints; the dietary structure of residents has gradually changed from rations to animal products, and the residents’ demand for industrially processed products has also greatly increased, which has brought higher requirements for the water footprint of regional grain consumption. The demand for industrial products has also greatly increased, which has brought higher requirements for the regional grain consumption and water footprint. Moreover, increased urbanization has also exacerbated the amount of water footprint needed for regional food security. If maintained at the current level of agricultural production technology, it is expected that the water footprint of grain consumption in the region will reach 163.8, 178.9 and 192.4 G m3 by 2030, 2040 and 2050, respectively. Therefore, exploring how to meet regional food security in the future should attract the attention of policy makers and encourage them to take countermeasures as early as possible.
(3) The amount of water resources needed for regional food security cannot be achieved by developing/increasing the agricultural water-resource input but only by improving the efficiency of agricultural water-resource utilization and reducing the amount of water resources needed for regional food security. According to the unsustainable situation of regional water resources and grain production, this study proposes effective suggestions to improve blue-water and green-water utilization efficiency and reduce the quantity of gray water. It is also proposed to reduce the water footprint of regional grain consumption by reasonably guiding the residents to change their dietary habits and to strengthen the grain trade among regions or countries, so as to better promote the sustainable development of regional water resources and grain production.

Author Contributions

X.L., Y.X., S.S., X.Z. and Y.W. conceived the central idea; X.L., Y.X. and Y.W. collected the data and performed the calculations; X.L. created all the figures. X.L. and Y.X. wrote the first draft. X.L. and Y.W. corrected the English language in the paper. All authors contributed to the analysis and developed the manuscript. All authors have read and agreed to the published version of the manuscript.

Funding

This study was supported by Fundamental Research Program of Shanxi Province (20210302123261), National Key Research and Development Program of China (2016YFC0400205), National Natural Science Foundation of China (41871207) and 111 Project (No. B12007).

Institutional Review Board Statement

Not applicable.

Informed Consent Statement

Not applicable.

Data Availability Statement

The data presented in this study are available within the article.

Conflicts of Interest

The authors declare that they have no known competing financial interests or personal relationships that could have appeared to influence the work reported in this paper.

References

  1. Liu, X.; Xu, Y.; Engel, B.A.; Sun, S.; Zhao, X.; Wu, P.; Wang, Y. The impact of urbanization and aging on food security in developing countries: The view from Northwest China. J. Clean. Prod. 2021, 292, 126067. [Google Scholar] [CrossRef]
  2. Zhang, Z.; Duan, Z.; Chen, Z.; Xu, P.; Li, G. Food security of China: The past, present and future. Plant Omics 2010, 3, 183. [Google Scholar]
  3. Liu, X.; Shi, L.; Qian, H.; Sun, S.; Wu, P.; Zhao, X.; Engel, B.A.; Wang, Y. New problems of food security in Northwest China: A sustainability perspective. Land Degrad. Dev. 2020, 31, 975–989. [Google Scholar] [CrossRef]
  4. Zhang, H.; Li, M. China’s water diplomacy in the Mekong: A paradigm shift and the role of Yunnan provincial government. Water Int. 2020, 45, 4–347. [Google Scholar] [CrossRef]
  5. Chartres, C.J.; Noble, A. Sustainable intensification: Overcoming land and water constraints on food production. Food Secur. 2015, 7, 235–245. [Google Scholar] [CrossRef]
  6. Jiang, Y.; Cai, W.; Du, P.; Pan, W.; Wang, C. Virtual water in interprovincial trade with implications for China’s water policy. J. Clean. Prod. 2015, 87, 655–665. [Google Scholar] [CrossRef]
  7. Liu, X.; Shi, L.; Engel, B.A.; Sun, S.; Wang, Y. New challenges of food security in Northwest China: Water footprint and virtual water perspective. J. Clean. Prod. 2019, 245, 118939. [Google Scholar] [CrossRef]
  8. Qin, S.; Li, S.; Kang, S.; Du, T.; Tong, L.; Ding, R. Can the drip irrigation under film mulch reduce crop evapotranspiration and save water under the sufficient irrigation condition? Agric. Water Manag. 2016, 177, 128–137. [Google Scholar] [CrossRef]
  9. Lu, J.; Ma, L.; Hu, T.; Geng, C.; Yan, S. Deficit drip irrigation based on crop evapotranspiration and precipitation forecast improves water-use efficiency and grain yield of summer maize. J. Sci. Food Agric. 2022, 102, 653–663. [Google Scholar] [CrossRef]
  10. Amare, D. Review on Effect of Different Irrigation Method on Water Use Efficiency, Yield Productivity and Nitrogen Application. J. Biol. Agric. Healthc. 2020, 10, 1–9. [Google Scholar]
  11. Li, J.; Xu, X.; Lin, G.; Wang, Y.; Liu, Y.; Zhang, M.; Zhou, J.; Wang, Z.; Zhang, Y. Micro-irrigation improves grain yield and resource use efficiency by co-locating the roots and N-fertilizer distribution of winter wheat in the North China Plain. Sci. Total Environ. 2018, 643, 367–377. [Google Scholar] [CrossRef] [PubMed]
  12. Kang, S.; Zhang, L.; Trout, T. Special Issue: Improving Agricultural Water Productivity to Ensure Food Security under Changing Environments. Agric. Water Manag. 2017, 179, 1–4. [Google Scholar] [CrossRef]
  13. Cheng, M.; Wang, H.; Fan, J.; Zhang, S.; Liao, Z.; Zhang, F.; Wang, Y. A global meta-analysis of yield and water use efficiency of crops, vegetables and fruits under full, deficit and alternate partial root-zone irrigation. Agric. Water Manag. 2021, 248, 106771. [Google Scholar] [CrossRef]
  14. Cheng, M.; Wang, H.; Fan, J.; Zhang, F.; Wang, X. Effects of soil water deficit at different growth stages on maize growth, yield, and water use efficiency under alternate partial root-zone irrigation. Water 2021, 13, 148. [Google Scholar] [CrossRef]
  15. Du, T.; Kang, S.; Zhang, J.; Davies, W. Deficit irrigation and sustainable water-resource strategies in agriculture for China’s food security. J. Exp. Bot. 2015, 66, 2253–2269. [Google Scholar] [CrossRef]
  16. Tong, X.; Wu, P.; Liu, X.; Zhang, L.; Zhou, W.; Wang, Z. A global meta-analysis of fruit tree yield and water use efficiency under deficit irrigation. Agric. Water Manag. 2022, 260, 107321. [Google Scholar] [CrossRef]
  17. Xu, Y.; Wang, Y.; Ma, X.; Liu, X.; Jia, Z. Ridge-furrow mulching system and supplementary irrigation can reduce the greenhouse gas emission intensity. Sci. Total Environ. 2020, 717, 137262. [Google Scholar] [CrossRef]
  18. Wang, J.; Zhang, S.; Sainju, U.M.; Ghimire, R.; Zhao, F. A meta-analysis on cover crop impact on soil water storage, succeeding crop yield, and water-use efficiency. Agric. Water Manag. 2021, 256, 107085. [Google Scholar] [CrossRef]
  19. Farooq, M.; Hussain, M.; Ul-Allah, S.; Siddique, K.H. Physiological and agronomic approaches for improving water-use efficiency in crop plants. Agric. Water Manag. 2019, 219, 95–108. [Google Scholar] [CrossRef]
  20. Leal Filho, W.; de Trincheria Gomez, J. Preface: Rainwater-Smart Agriculture in Arid and Semi-Arid Areas; Springer: Berlin/Heidelberg, Germany, 2018; pp. 1–5. [Google Scholar]
  21. Damerau, K.; Waha, K.; Herrero, M. The impact of nutrient-rich food choices on agricultural water-use efficiency. Nat. Sustain. 2019, 2, 233–241. [Google Scholar] [CrossRef]
  22. Wang, J.; Sun, S.; Yin, Y.; Wang, K.; Sun, J.; Tang, Y.; Zhao, J. Water-Food-Carbon Nexus from Producer-Consumer Link: A Review. Adv. Nutr. 2022, 13, 938–952. [Google Scholar] [CrossRef] [PubMed]
  23. Duan, W.; Chen, Y.; Zou, S.; Nover, D. Managing the water-climate- food nexus for sustainable development in Turkmenistan. J. Clean. Prod. 2019, 220, 212–224. [Google Scholar] [CrossRef]
  24. Kirby, M.; Ahmad, M.U.D. Can Pakistan achieve sustainable water security? Climate change, population growth and development impacts to 2100. Sustain. Sci. 2022, 1–14. [Google Scholar] [CrossRef]
  25. Abbas, S.; Kousar, S.; Khan, M.S. The role of climate change in food security; empirical evidence over Punjab regions, Pakistan. Environ. Sci. Pollut. Res. 2022, 1–19. [Google Scholar] [CrossRef] [PubMed]
  26. Jalava, M.; Guillaume, J.H.A.; Kummu, M.; Porkka, M.; Siebert, S.; Varis, O. Diet change and food loss reduction: What is their combined impact on global water use and scarcity? Earth’s Future 2016, 4, 62–78. [Google Scholar] [CrossRef] [Green Version]
  27. Sun, M.; Niu, W.; Zhang, B.; Geng, Q.; Yu, Q. Spatial-temporal evolution pattern and response of ecosystem service value under land use change in the Yellow River Basin: A case study of Shaanxi-Gansu-Ningxia region, Northwest China. Chin. J. Appl. Ecol. 2021, 1–11. [Google Scholar] [CrossRef]
  28. NBS. National Bureau of Statistics, China Statistical Yearbook; National Bureau of Statistics (NBS): Beijing, China, 2021.
  29. CMDC. China Meteorological Data Service Center; CMDC: Beijing, China, 2000–2020. [Google Scholar]
  30. Wu, D.; Shen, Y.J.Y.W.H. Analysis of the Break-even and Load Index of Water Resources in Beijing. In Proceedings of the 1st International Symposium on Innovative Management and Economics (ISIME 2021), Moscow, Russia, 2–3 June 2021; Atlantis Press: Paris, France, 2021; pp. 584–590. [Google Scholar]
  31. Xia, F.; Chen, Y.; Dou, M.; Han, Y. Calculation method and application of spatial equilibrium coefficient of water resources. Water Resour. Prot. 2020, 36, 52–57. [Google Scholar]
  32. Luan, X.; Wu, P.; Sun, S.; Wang, Y.; Gao, X. Quantitative study of the crop production water footprint using the SWAT model. Ecol. Indic. 2018, 89, 1–10. [Google Scholar] [CrossRef]
  33. Döll, P.; Siebert, S. Global modeling of irrigation water requirements. Water Resour. Res. 2002, 38, 8-1–8-10. [Google Scholar] [CrossRef]
  34. Sun, S.K.; Yin, Y.L.; Wu, P.T.; Wang, Y.B.; Luan, X.B.; Li, C. Geographical Evolution of Agricultural Production in China and Its Effects on Water Stress, Economy and the Environment: The Virtual Water Perspective. Water Resour. Res. 2019, 55, 4014–4029. [Google Scholar] [CrossRef]
  35. Hoekstra, A.Y.; Chapagain, A.K.; Aldaya, M.M.; Mekonnen, M.M. The Water Footprint Assessment Manual: Setting the Global Standard; Routledge: London, UK; Washington, DC, USA, 2011. [Google Scholar]
  36. Xu, Z.; Zhang, W.; Li, M. China’s grain production. Mon. Rev. 2014, 66, 25–37. [Google Scholar] [CrossRef]
  37. Yang, M.Z.; Pei, Y.S.; Li, X.D. Study on grain self-sufficiency rate in China: An analysis of grain, cereal grain and edible grain. J. Nat. Resour. 2019, 34, 881–889. [Google Scholar] [CrossRef]
  38. Wang, L.; Xiao, Y.; Ouyang, Z. Food and Grain Consumption Per Capita in the Qinghai–Tibet Plateau and Implications for Conservation. Nutrients 2021, 13, 3742. [Google Scholar] [CrossRef]
  39. Tang, H.J.; Li, Z. Study on per capita grain demand based on chinese reasonable dietary pattern. Sci. Agric. Sin. 2012, 45, 2315–2327. [Google Scholar]
  40. United Nations. Department of Economic and Social Affairs Population Dynamics, World Population Prospects 2019. Available online: https://population.un.org/wpp/Download/Standard/Population/ (accessed on 1 January 2021).
  41. Devkota, K.P.; Khanda, C.M.; Beebout, S.J.; Mohapatra, B.K.; Singleton, G.R.; Puskur, R. Assessing alternative crop establishment methods with a sustainability lens in rice production systems of Eastern India. J. Clean. Prod. 2020, 244, 118835. [Google Scholar] [CrossRef]
  42. Zhang, W.; Dong, A.; Liu, F.; Niu, W.; Siddique, K.H.M. Effect of film mulching on crop yield and water use efficiency in drip irrigation systems: A meta-analysis. Soil Tillage Res. 2022, 221, 105392. [Google Scholar] [CrossRef]
  43. Li, J.; Luo, G.; Shaibu, A.S.; Li, B.; Zhang, S.; Sun, J. Optimal fertilization level for yield, biological and quality traits of soybean under drip irrigation system in the arid region of Northwest China. Agronomy 2022, 12, 291. [Google Scholar] [CrossRef]
  44. Zhu, Y.; Cai, H.; Song, L.; Wang, X.; Shang, Z.; Sun, Y. Aerated irrigation of different irrigation levels and subsurface dripper depths affects fruit yield, quality and water use efficiency of greenhouse tomato. Sustainability 2020, 12, 2703. [Google Scholar] [CrossRef] [Green Version]
  45. Isla, R.; Valentín-Madrona, F.; Maturano, M.; Aibar, J.; Guillén, M.; Quílez, D. Comparison of different approaches for optimizing nitrogen management in sprinkler-irrigated maize. Eur. J. Agron. 2020, 116, 126043. [Google Scholar] [CrossRef]
  46. Zapata, N.; Robles, O.; Playán, E.; Paniagua, P.; Romano, C.; Salvador, R.; Montoya, F. Low-pressure sprinkler irrigation in maize: Differences in water distribution above and below the crop canopy. Agric. Water Manag. 2018, 203, 353–365. [Google Scholar] [CrossRef]
  47. Ma, X.; Sanguinet, K.A.; Jacoby, P.W. Direct root-zone irrigation outperforms surface drip irrigation for grape yield and crop water use efficiency while restricting root growth. Agric. Water Manag. 2020, 231, 105993. [Google Scholar] [CrossRef]
  48. Yu, L.; Zhao, X.; Gao, X.; Siddique, K.H. Improving/maintaining water-use efficiency and yield of wheat by deficit irrigation: A global meta-analysis. Agric. Water Manag. 2020, 228, 105906. [Google Scholar] [CrossRef]
  49. Zhang, J.; Ji, J.; Wang, P.; Long, H.; Wu, X. Molecular mechanism of negative pressure irrigation inhibiting root growth and improving water use efficiency in maize. Plant Soil 2022, 472, 127–143. [Google Scholar] [CrossRef]
  50. Cheng, D.; Wang, Z.; Yang, L.; Zhang, L.; Zhang, Q. Combined effects of mulching and crop density on soil evaporation, temperature, and water use efficiency of winter wheat. Exp. Agric. 2021, 57, 163–174. [Google Scholar] [CrossRef]
  51. Liang, J.; He, Z.; Shi, W. Cotton/mung bean intercropping improves crop productivity, water use efficiency, nitrogen uptake, and economic benefits in the arid area of Northwest China. Agric. Water Manag. 2020, 240, 106277. [Google Scholar] [CrossRef]
  52. Li, Y.; Tian, D.; Feng, G.; Yang, W.; Feng, L. Climate change and cover crop effects on water use efficiency of a corn-soybean rotation system. Agric. Water Manag. 2021, 255, 107042. [Google Scholar] [CrossRef]
  53. Gao, Y.; Shao, G.; Lu, J.; Zhang, K.; Wu, S.; Wang, Z. Effects of biochar application on crop water use efficiency depend on experimental conditions: A meta-analysis. Field Crops Res. 2020, 249, 107763. [Google Scholar] [CrossRef]
  54. Wu, W.; Han, J.; Gu, Y.; Li, T.; Xu, X.; Jiang, Y.; Cheng, K. Impact of biochar amendment on soil hydrological properties and crop water use efficiency: A global meta-analysis and structural equation model. GCB Bioenergy 2022, 14, 657–668. [Google Scholar] [CrossRef]
  55. Bi, J.; Hou, D.; Zhang, X.; Tan, J.; Bi, Q.; Zhang, K.; Luo, L. A novel water-saving and drought-resistance rice variety promotes phosphorus absorption through root secreting organic acid compounds to stabilize yield under water-saving condition. J. Clean. Prod. 2021, 315, 127992. [Google Scholar] [CrossRef]
  56. Oguge, N.; Oremo, F. Fostering the use of rainwater for off-season small-scale irrigation in arid and semi-arid areas of Kenya. In Rainwater-Smart Agriculture in Arid and Semi-Arid Areas; Springer: Berlin/Heidelberg, Germany, 2018; pp. 159–174. [Google Scholar]
  57. Guo, L.; Ning, T.; Nie, L.; Li, Z.; Lal, R. Interaction of deep placed controlled-release urea and water retention agent on nitrogen and water use and maize yield. Eur. J. Agron. 2016, 75, 118–129. [Google Scholar] [CrossRef]
  58. Chen, C.; Wang, X.; Chen, H.; Wu, C.; Mafarja, M.; Turabieh, H. Towards Precision Fertilization: Multi-Strategy Grey Wolf Optimizer Based Model Evaluation and Yield Estimation. Electronics 2021, 10, 2183. [Google Scholar] [CrossRef]
  59. Muneret, L.; Mitchell, M.; Seufert, V.; Aviron, S.; Pétillon, J.; Plantegenest, M.; Thiéry, D.; Rusch, A. Evidence that organic farming promotes pest control. Nat. Sustain. 2018, 1, 361–368. [Google Scholar] [CrossRef]
  60. Rose, D.; Willits-Smith, A.M.; Heller, M.C. Single-item substitutions can substantially reduce the carbon and water scarcity footprints of US diets. Am. J. Clin. Nutr. 2022, 115, 378–387. [Google Scholar] [CrossRef] [PubMed]
  61. Tompa, O.; Kiss, A.; Maillot, M.; Sarkadi Nagy, E.; Temesi, Á.; Lakner, Z. Sustainable Diet Optimization Targeting Dietary Water Footprint Reduction-A Country-Specific Study. Sustainability 2022, 14, 2309. [Google Scholar] [CrossRef]
  62. Mirzaie-Nodoushan, F.; Morid, S.; Dehghanisanij, H. Reducing water footprints through healthy and reasonable changes in diet and imported products. Sustain. Prod. Consum. 2020, 23, 30–41. [Google Scholar] [CrossRef]
  63. Sobhani, S.R.; Rezazadeh, A.; Omidvar, N.; Eini-Zinab, H. Healthy diet: A step toward a sustainable diet by reducing water footprint. J. Sci. Food Agric. 2019, 99, 3769–3775. [Google Scholar] [CrossRef]
  64. Liu, W.; Yang, H.; Liu, Y.; Kummu, M.; Hoekstra, A.Y.; Liu, J.; Schulin, R. Water resources conservation and nitrogen pollution reduction under global food trade and agricultural intensification. Sci. Total Environ. 2018, 633, 1591–1601. [Google Scholar] [CrossRef] [Green Version]
  65. Delbourg, E.; Dinar, S. The globalization of virtual water flows: Explaining trade patterns of a scarce resource. World Dev. 2020, 131, 104917. [Google Scholar] [CrossRef]
  66. Liu, W.; Antonelli, M.; Kummu, M.; Zhao, X.; Wu, P.; Liu, J.; Yang, H. Savings and losses of global water resources in food-related virtual water trade. Wiley Interdiscip. Rev.: Water 2019, 6, e1320. [Google Scholar] [CrossRef] [Green Version]
Figure 1. Survey of geography of Northwest China.
Agriculture 12 01114 g001
Figure 2. Dynamic changes in total water resources in Northwest China from 2000 to 2020.
Agriculture 12 01114 g002
Figure 3. Dynamic changes in water-resource load index in Northwest China from 2000 to 2020. Note: (A) shows the variation trend of water resource load index over time in Northwest China. (B) shows the change trend of water resource load index over time in each province of Northwest China.
Agriculture 12 01114 g003
Figure 4. Characteristics of water-use structure in Northwest China.
Agriculture 12 01114 g004
Figure 5. Dynamics of the water footprint of the consumption of different foods over time. Note: The bar chart represents the average value of the water footprint of grain consumption in Northwest China over time. The area map represents the amount of grain consumed per capita in Northwest China.
Agriculture 12 01114 g005
Figure 6. Water footprint of grain consumption by urban and rural residents in Northwest China.
Agriculture 12 01114 g006
Figure 7. Water footprint of industrial grain consumption in Northwest China, 2000–2020. Note: The data of liquor, beer and alcohol in the statistical analysis results are shown according to volume. According to their density differences, we multiplied their volume unit values by 0.89, 1.0 and 0.8, respectively, into mass units. Industrial consumption involves liquor, beer, alcohol and side food. Their conversion coefficients to grain are 2.33, 0.15, 2.80 and 1.20, respectively [38,39].
Agriculture 12 01114 g007
Figure 8. Spatial distribution characteristics of the water footprint of grain production. Note: (AC) show the blue water, green water and grey water footprints of crop production, respectively.
Agriculture 12 01114 g008
Table 1. Classification and evaluation criteria of water-resource load index [30,31].
RankCWater-Resource Utilization DegreeWater-Resource Development Potential
≥10Very highBare
[5, 10)HighSmall
[2, 5)MediumMedium
[1, 2)Relatively lowRelatively large
[0, 1)LowGreat
Table 2. Water-footprint projections for grain consumption in Northwest China.
YearPopulation
(Million)
Urbanization
(%)
Grain-Consumption Water
Footprint (billion m3)
2025173.159.5155.2
2030175.865.5163.8
2035177.867.8171.8
2040178.670.2178.9
2045178.872.5185.8
2050178.574.8192.4
Note: First, according to the United Nations [40], National Population Development Plan (2016–2030) and Liu et al. [1], we obtained the expected population and urbanization levels in Northwest China from 2025 to 2050. Second, using the gray prediction model, the future per capita grain consumption in the region was predicted from the dietary-structure consumption characteristics of urban and rural residents in the region from 2000 to 2017. The actual consumption data of urban and rural residents from 2018 to 2020 were used to verify the corresponding prediction data, which showed an error range of ±5%, with high reliability. This part of grain consumption mainly included the consumption based on the dietary structure of urban and rural residents and industrial grain. We suppose that the future industrial grain and agricultural production levels of the region will be comparable with those of 2020.
Publisher’s Note: MDPI stays neutral with regard to jurisdictional claims in published maps and institutional affiliations.

