You are currently viewing a new version of our website. To view the old version click .
Agriculture
  • Article
  • Open Access

11 July 2022

Genetic Diversity of Fish in Aquaculture and of Common Carp (Cyprinus carpio) in Traditional Rice–Fish Coculture

,
,
,
,
,
and
1
College of Life Sciences, Zhejiang University, Hangzhou 310058, China
2
National Engineering Research Center for Marine Aquaculture, Zhejiang Ocean University, Zhoushan 316022, China
3
College of Forestry, Henan Agriculture University, Zhengzhou 450002, China
4
Agricultural and Rural Bureau of Yongjia County, Yongjia 325100, China
This article belongs to the Special Issue Sustainable Agriculture: Theories, Methods, Practices and Policies

Abstract

The genetic diversity of cultured species (e.g., plants and fish) has decreased as intensive agriculture and aquaculture have increased in recent decades. Maintaining genetic diversity in agriculture is a significant concern. To test whether aquaculture affects the genetic diversity of aquatic animals and whether traditional agriculture could help maintain genetic diversity, we conducted a meta-analysis to quantify the genetic diversity of cultured and wild populations. We also examined the genetic diversity and population genetic structure of common carp (Cyprinus carpio) in the traditional rice–fish coculture in the south of Zhejiang Province, China, using 20 microsatellite loci. The results of the meta-analysis showed a negative overall effect size of all cultured aquatic animals that were tested both when weighted by population replicate and when weighted by the inverse of variance. Aquaculture has caused a general decline in the genetic diversity of many cultured aquatic animals. The results from the survey of a traditional rice–fish coculture system in the south of Zhejiang Province of China showed high levels of genetic diversity in all 10 sampled populations (mean Na = 7.40, mean Ne = 4.57, mean I = 1.61, mean He = 0.71, and mean Ho = 0.73). Both the conventional analysis and a model-based analysis revealed a high and significant genetic divergence among the 10 sampled populations all over the three counties (FST value ranged from 0.00 to 0.13, and Nei’s genetic distance ranged from 0.07 to 0.62). Populations within Yongjia and Jingning counties were also genetically differentiated, respectively. Furthermore, molecular variance (AMOVA), membership coefficients estimated by STRUCTURE, PCoA, and migration network analysis supported the findings from pairwise FST values. Our results suggest that the traditional rice–fish coculture plays an important role in maintaining the genetic diversity of carp cocultured in rice paddies and future policies should favor the conservation of the rice–fish system and raise the awareness of farmers on methods to maintain carp genetic diversity.

1. Introduction

The rapid development of modern intensive agriculture has contributed to improving global food output and ensuring food security []. However, with the intensive development of agriculture, the use of high chemical inputs and high-yield varieties causes the reduction in genetic diversity in agriculture [,]. There has been much concern over how to conserve and manage genetic diversity [,,]. In contrast to modern intensive agriculture, traditional agriculture developed by local farmers using indigenous natural and social resources often nourishes rich genetic diversity [], which is critical in providing germplasm and maintaining ecosystem services and would help improve local food security for an uncertain future [,,].
Aquaculture is a kind of agriculture that has experienced rapid growth in the past decades as a reliable source of protein for the human diet [,,]. Although the aquaculture industry is increasingly important, it has brought great environmental and ecological risks, including water pollution and degradation of germplasm resources of aquatic species []. For example, there are concerns about the release of non-native species that may escape from aquaculture and cause negative genetic impacts on wild species; further work in understanding and mitigating those risks is justified. []. However, compared with staple crops and livestock, the development and conservation of aquatic animals have not received as much attention []. Due to the high fertility of many aquatic animals, farmers usually use a small number of brood stock, which leads to inbreeding, genetic drift, and, thus, the reduction in genetic diversity [,,]. As genetic diversity is the primary resource in the successful artificial propagation of any aquatic animals, understanding the effect of aquaculture on the genetic diversity of aquatic animals is essential.
Studies have shown that traditional rice–fish systems have maintained several types of common carp [,,]. The coculture of rice and fish is an integrated agri-aquaculture system (IAAS) that combines rice cultivation with aquaculture, which is a typical traditional farming system in southern China []. In the rice–fish coculture system, common carp (C. carpio) is the major aquatic animal raised in the paddy field, where the environment is characterized by shallow water [].
In the present study, the effect sizes of genetic diversity (i.e., Na and He) in cultured and wild populations of a variety of aquatic animals, including mollusk, arthropod, echinoderm, carp, perch, flounder, salmon, catfish, puffer, and herring, were assessed by a meta-analysis based on 117 studies. We also catalogued the genetic diversity and genetic variation of common carp cocultured in paddies (C. carpio) in three counties (i.e., Jingning, Qingtian, and Yongjia) of Zhejiang Province, China, using 20 polymorphic microsatellite loci. Our objectives were to evaluate the impact of aquaculture activities on the genetic diversity of aquatic animals and characterize the genetic diversity of carp cocultured in paddies in the southern Zhejiang Province of China.

2. Materials and Methods
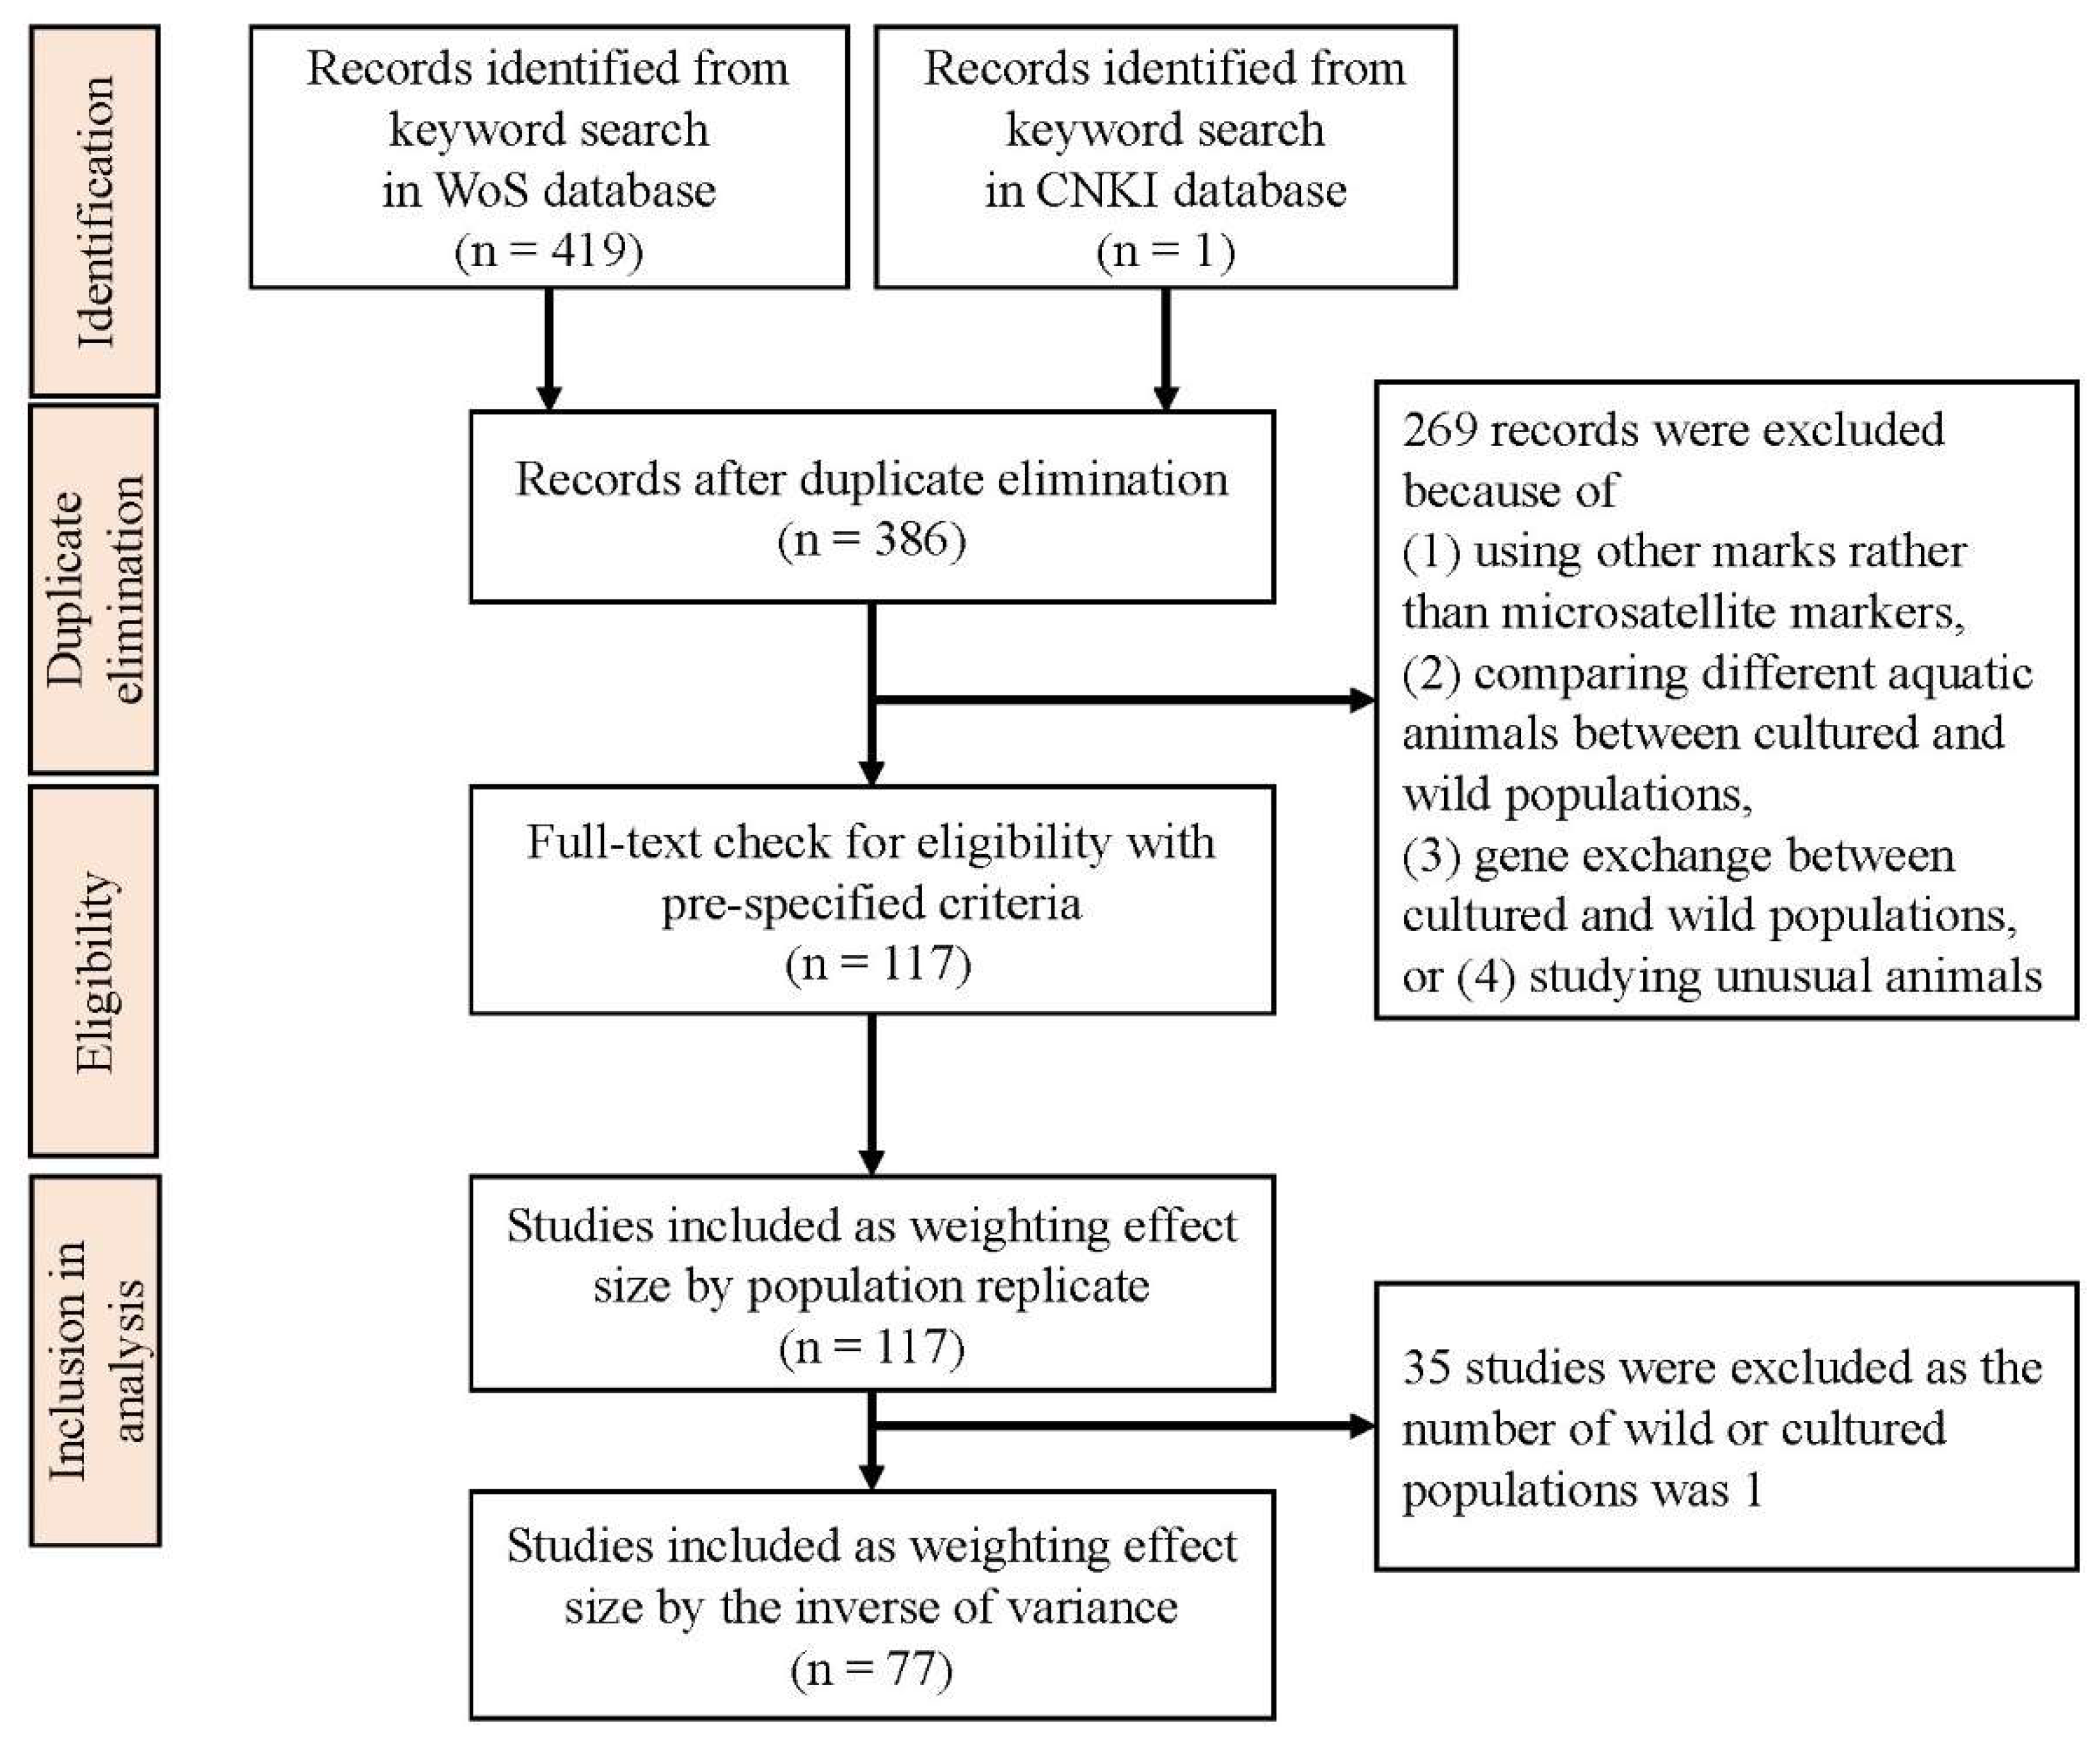
2.1. Meta-Analysis

A systematic search of the literature was conducted across two databases: the Web of Science (1900–2021) and CNKI (1970–2021) in March 2022. No restrictions were considered either on the language or on the publication date. A combination of search terms used to search for the topic was as follows: “genetic diversity” OR “genetic variability” AND nature* OR wild AND farmed OR cultured OR hatchery OR artificial OR cultivated AND fish. The pre-specified eligibility criteria for research to be selected in the meta-analysis database were that (1) the studies used microsatellite markers, (2) the studies included cultured and wild populations of the same aquatic animals, and (3) cultured and wild populations were isolated from each other and had no gene exchange.
The species of aquatic animals, number of cultured and wild populations, mean of the number of alleles per locus (Na), and mean of the expected heterozygosity (He) were extracted from data reported in each piece of literature. The natural log (ln)-transformation of the response ratio R was used to calculate effect sizes []:
l n R = ln Y 1 ¯ Y ¯ 2 = ln Y 1 ¯ ln Y 2 ¯
The variance of lnR was calculated as:
V ln R = S 1 2 n 1 Y ¯ 1 2 + S 2 2 n 2 Y ¯ 2 2
where   Y 1 ¯ and   Y 2 ¯ represent the means of genetic diversity of cultured and wild populations, respectively, S 1 2   and S 2 2 represent the variance of genetic diversity of the cultured and wild populations, respectively, and n1 and n2 represent the numbers of cultured and wild populations, respectively.
The weight of the effect sizes is calculated in two ways: (1) weighting by the inverse of variance ( 1 V l n R ) and (2) weighting by the population replicate:
W = N p = n 1 n 2 n 1 + n 2
Because the calculation of S 1 2   or S 2 2 is not allowed when the number of cultured or wild populations was 1 (i.e., n1 = 1 or n2 = 1), we excluded those items of research that had only one population of cultured or wild aquatic animals when we weighted the effect sizes by the inverse of variance. The meta-analysis was performed in Metawin v2.1 with 95% confidence intervals (CIs) [].

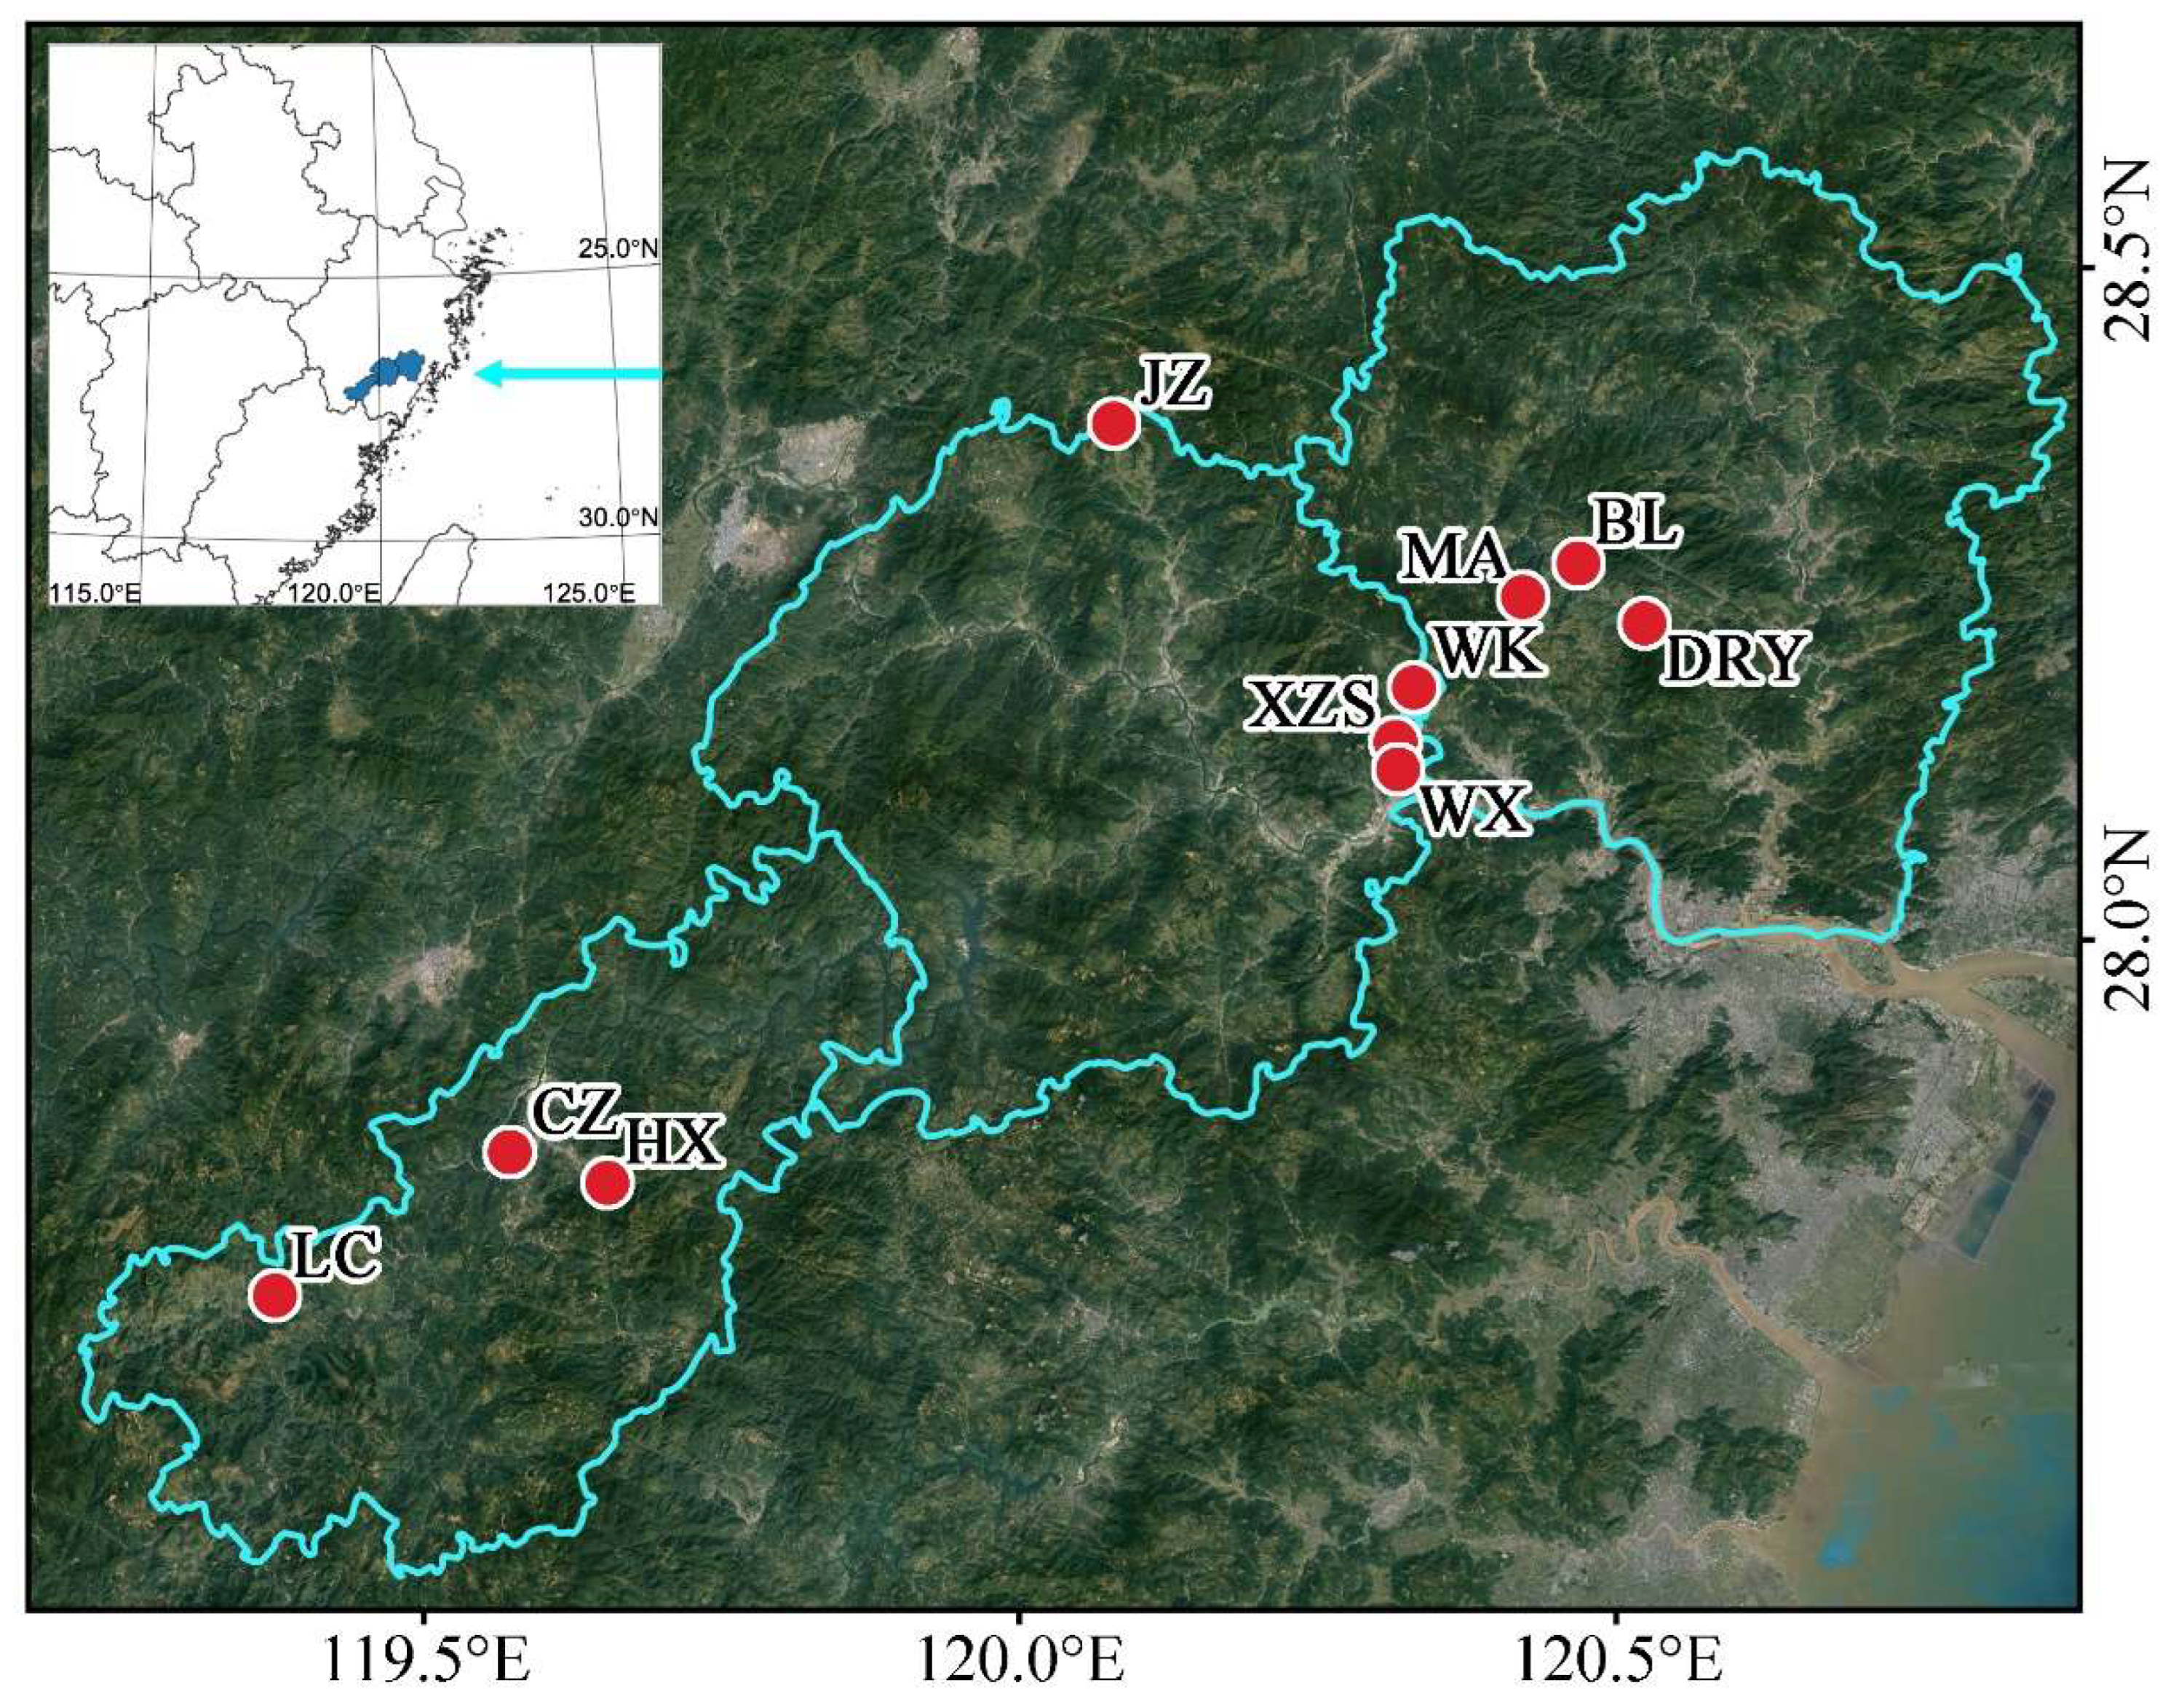
2.2. Sample Collection and DNA Extraction

The traditional rice–fish coculture system located in southern Zhejiang Province of China has a long history, of more than 1200 years, and is listed as a Globally Important Agriculture Heritage System (GIAHS) [,]. The fish populations with breeding introduction on purpose or by chance were excluded from the sample collection. Those isolated local populations were sampled in this study to avoid the influences of genetic exchange with modern varieties. A total of 166 carp cocultured in rice paddies were collected from 10 locations across three counties (i.e., Jingning, Qingtian, and Yongjia in the south of Zhejiang Province, China) (Figure 1 and Table 1). All of these locations have a long history of rice–fish coculture. The total genomic DNA extraction was obtained from the tail fin of each individual using a commercial DNA extraction kit ( Sangon Biotech Co., Ltd. Shanghai, China). After the quality of DNA was examined through the 1% agarose gel electrophoresis, the extracted DNA was stored at −20 °C before further polymerase chain reactions (PCRs).
Figure 1. The sampling locations of common carp (C. carpio) in the traditional rice–fish coculture system in the south of Zhejiang Province, China.
Table 1. Collection details for C. carpio cocultured in paddies in the south of Zhejiang Province, China.

2.3. Microsatellite Analysis

We selected 20 microsatellite loci for C. carpio from the literature (Table S1) [,,,,]. The forward primers were labeled with a fluorescent dye (-FAM, TAMRA, or HEX) at the 5′ end. Microsatellite polymorphism of each DNA sample was analyzed by PCR, which was performed in a final volume of 15 µL reaction containing 50 ng of DNA, 1.5 pmol of each forward and reverse primer, and 7.5 µL Taq MasterMix (Cwbiotech. Co. Ltd., Beijing, China). Cycling conditions for all assays included initial denaturation at 94 °C for 3 min followed by 30 cycles at 94 °C for 30 s, 50–60 °C for 30 s, and 72 °C for 1 min and final elongation at 72 °C for 7 min. Sequencing was performed on the ABI3730xl platform by Sangon Biotech Co. Ltd. (Shanghai, China).

2.4. Genetic Data Analysis

2.4.1. Genetic Diversity

Micro-Checker v2.2.3 software was used to double-check the effect of null alleles and allele scoring errors before data analysis []. For each microsatellite locus, we assessed the number of alleles per locus (Na), the effective number of alleles per locus (Ne), Shannon’s diversity index (I), expected heterozygosity (He), observed heterozygosity (Ho), and the fixation index (Fis) using GenAlEx v6.5 [].
The linkage disequilibrium method (LD) was used to estimate the effective population size for each carp population by NeEstimator v2 []; the lowest allele frequency used was 0.01 and the confidence interval was 95%. The two-phased model (TPM) with 90% single-step mutations and 10% multiple-step mutations with 1000 replications and the mode-shift test [] based on an L-shaped distribution of allele frequency under mutation–drift equilibrium were used to assess whether populations of the sampled carp had experienced recent bottlenecks by using Bottleneck v1.2.02 software []. Statistical significance at each locus was evaluated by a one-tailed Wilcoxon sign-rank test [].

2.4.2. Genetic Variation

To estimate the level of genetic variation among population pairs, pairwise FST values and the exact test p values were calculated using Arlequin v3.5 []. The Nei’s genetic distance was assessed by GenAlEx v6.5 []. The molecular variance (AMOVA) was also assessed by Arlequin v3.5 []. The software Structure v2.3.4 was used for the clustering analysis based on the Bayesian method (admixture model, K set 1 to 7, 20 runs, MCMC = 1,000,000, burn-in = 25,000) []. The results were submitted to an online tool, Structure Harvester v0.6094 [], to obtain the best K value. Principal coordinates analysis (PCoA) of the correlation matrix was used to further investigate the relationships between individuals using GenAlEx v6.5 [].
The directional relative migration patterns among populations were estimated by the web-based software divMigrateOnline using the FST statistic as a measure of genetic differentiation []. The significance of asymmetrical migration patterns among populations was tested using 1000 bootstrap iterations. Additionally, the mantel test (10,000 repetitions) for isolation by distance (IBD) was performed between genetic distance and geographical distance (i.e., Euclidean distance based on latitude and longitude ) via R software with ggplot2, diveRsity, and reshape packages [].

3. Results

3.1. Meta-Analysis

The meta-analysis data set was derived from 117 articles for which we weighted the data by population replicate and a further 77 articles for which we weighted the data by the inverse of the variance (Figure 2, Tables S2 and S3). According to the taxonomic status of species in publications, species were divided into 10 groups, including mollusk, arthropod, echinoderm, and seven groups of bony fish in chordate (i.e., carp, perch, flounder, salmon, catfish, puffer, and herring). Echinoderm and puffer were only used when weighted by population replicate.
Figure 2. Selection of literature to be included in the meta-analysis data set.
Results from the meta-analysis showed the negative effect size of all cultured aquatic animals that were tested both when weighted by population replicate and weighted by the inverse of variance. The levels of genetic diversity decrease were different in different aquatic animals (Table 2). In the results when weighted by the inverse of variance, the highest effect sizes of Na and He were in flounder and salmon, respectively, and the genetic diversities of cultured populations decreased by 38.44% and 10.73% from wild populations, respectively. In the results when weighted by population replicate, the highest effect sizes of Na and He were in echinoderm and carp, respectively, and the genetic diversities of cultured populations decreased by 31% and 10% from wild populations, respectively. The overall effect size was −0.23 (CI: −0.32 to −0.16) for Na and −0.08 (CI: −0.13 to −0.04) for He, respectively, when weighted by the inverse of variance. Similarly, the overall effect sizes were −0.24 (CI: −0.33 to −0.15) for Na and −0.05 (CI: −0.07 to −0.03) for He, respectively, when weighted by population replicate. For carp, the reduction in genetic diversity of cultured populations was 12% or 24% by Na and 5% or 10% by He when weighted by the inverse of variance or when weighted by population replicate, respectively.
Table 2. Meta-analysis of the effect of aquaculture on different aquatic animals.

3.2. Genetic Diversity within Carp Populations in Rice–Fish Coculture

All 20 microsatellite loci were polymorphic in the sampled carp (Table S3). The average numbers of alleles (Na) ranged from 5.80 (HX) to 10.40 (MA), the effective numbers of alleles (Ne) ranged from 3.86 (LC) to 5.70 (BL), Shannon’s diversity indices (I) ranged from 1.42 (WX) to 1.85(BL), the expected heterozygosity (He) values ranged from 0.68 (LC) to 0.76 (CZ and BL), the observed heterozygosity (Ho) values ranged from 0.68 (WX) to 0.76 (MA), and the fixation indices (Fis) ranged from −0.02 (CZ) to 0.08 (JZ) (Table 3). Mean Na = 7.40, mean Ne = 4.57, mean I = 1.61, mean He = 0.71, and mean Ho = 0.73 (Table 3).
Table 3. The genetic characteristics of the 10 carp populations based on 20 microsatellite loci.
The effective population size estimates of the 10 populations ranged from 8.6 (CZ, CI = 5.7–13.6) to infinity (JZ, CI = 148.9–infinity and DRY, CI = 58.3–infinity) (Table 4). The results from the bottleneck tests showed that no heterozygote excess was significant in any of the populations, indicating that there was no recent genetic bottleneck in the sampled carp populations in the south of Zhejiang Province, China (Table 4). In addition, a normal L-shaped distribution pattern of the allele frequency from the mode-shift test also suggested the lack of bottleneck events in the recent history of carp coculture in rice paddies in the south of Zhejiang Province, China.
Table 4. Effective population size estimates with 95% confidence intervals and results from the bottleneck analysis for the 10 C. carpio populations using 20 microsatellite loci.

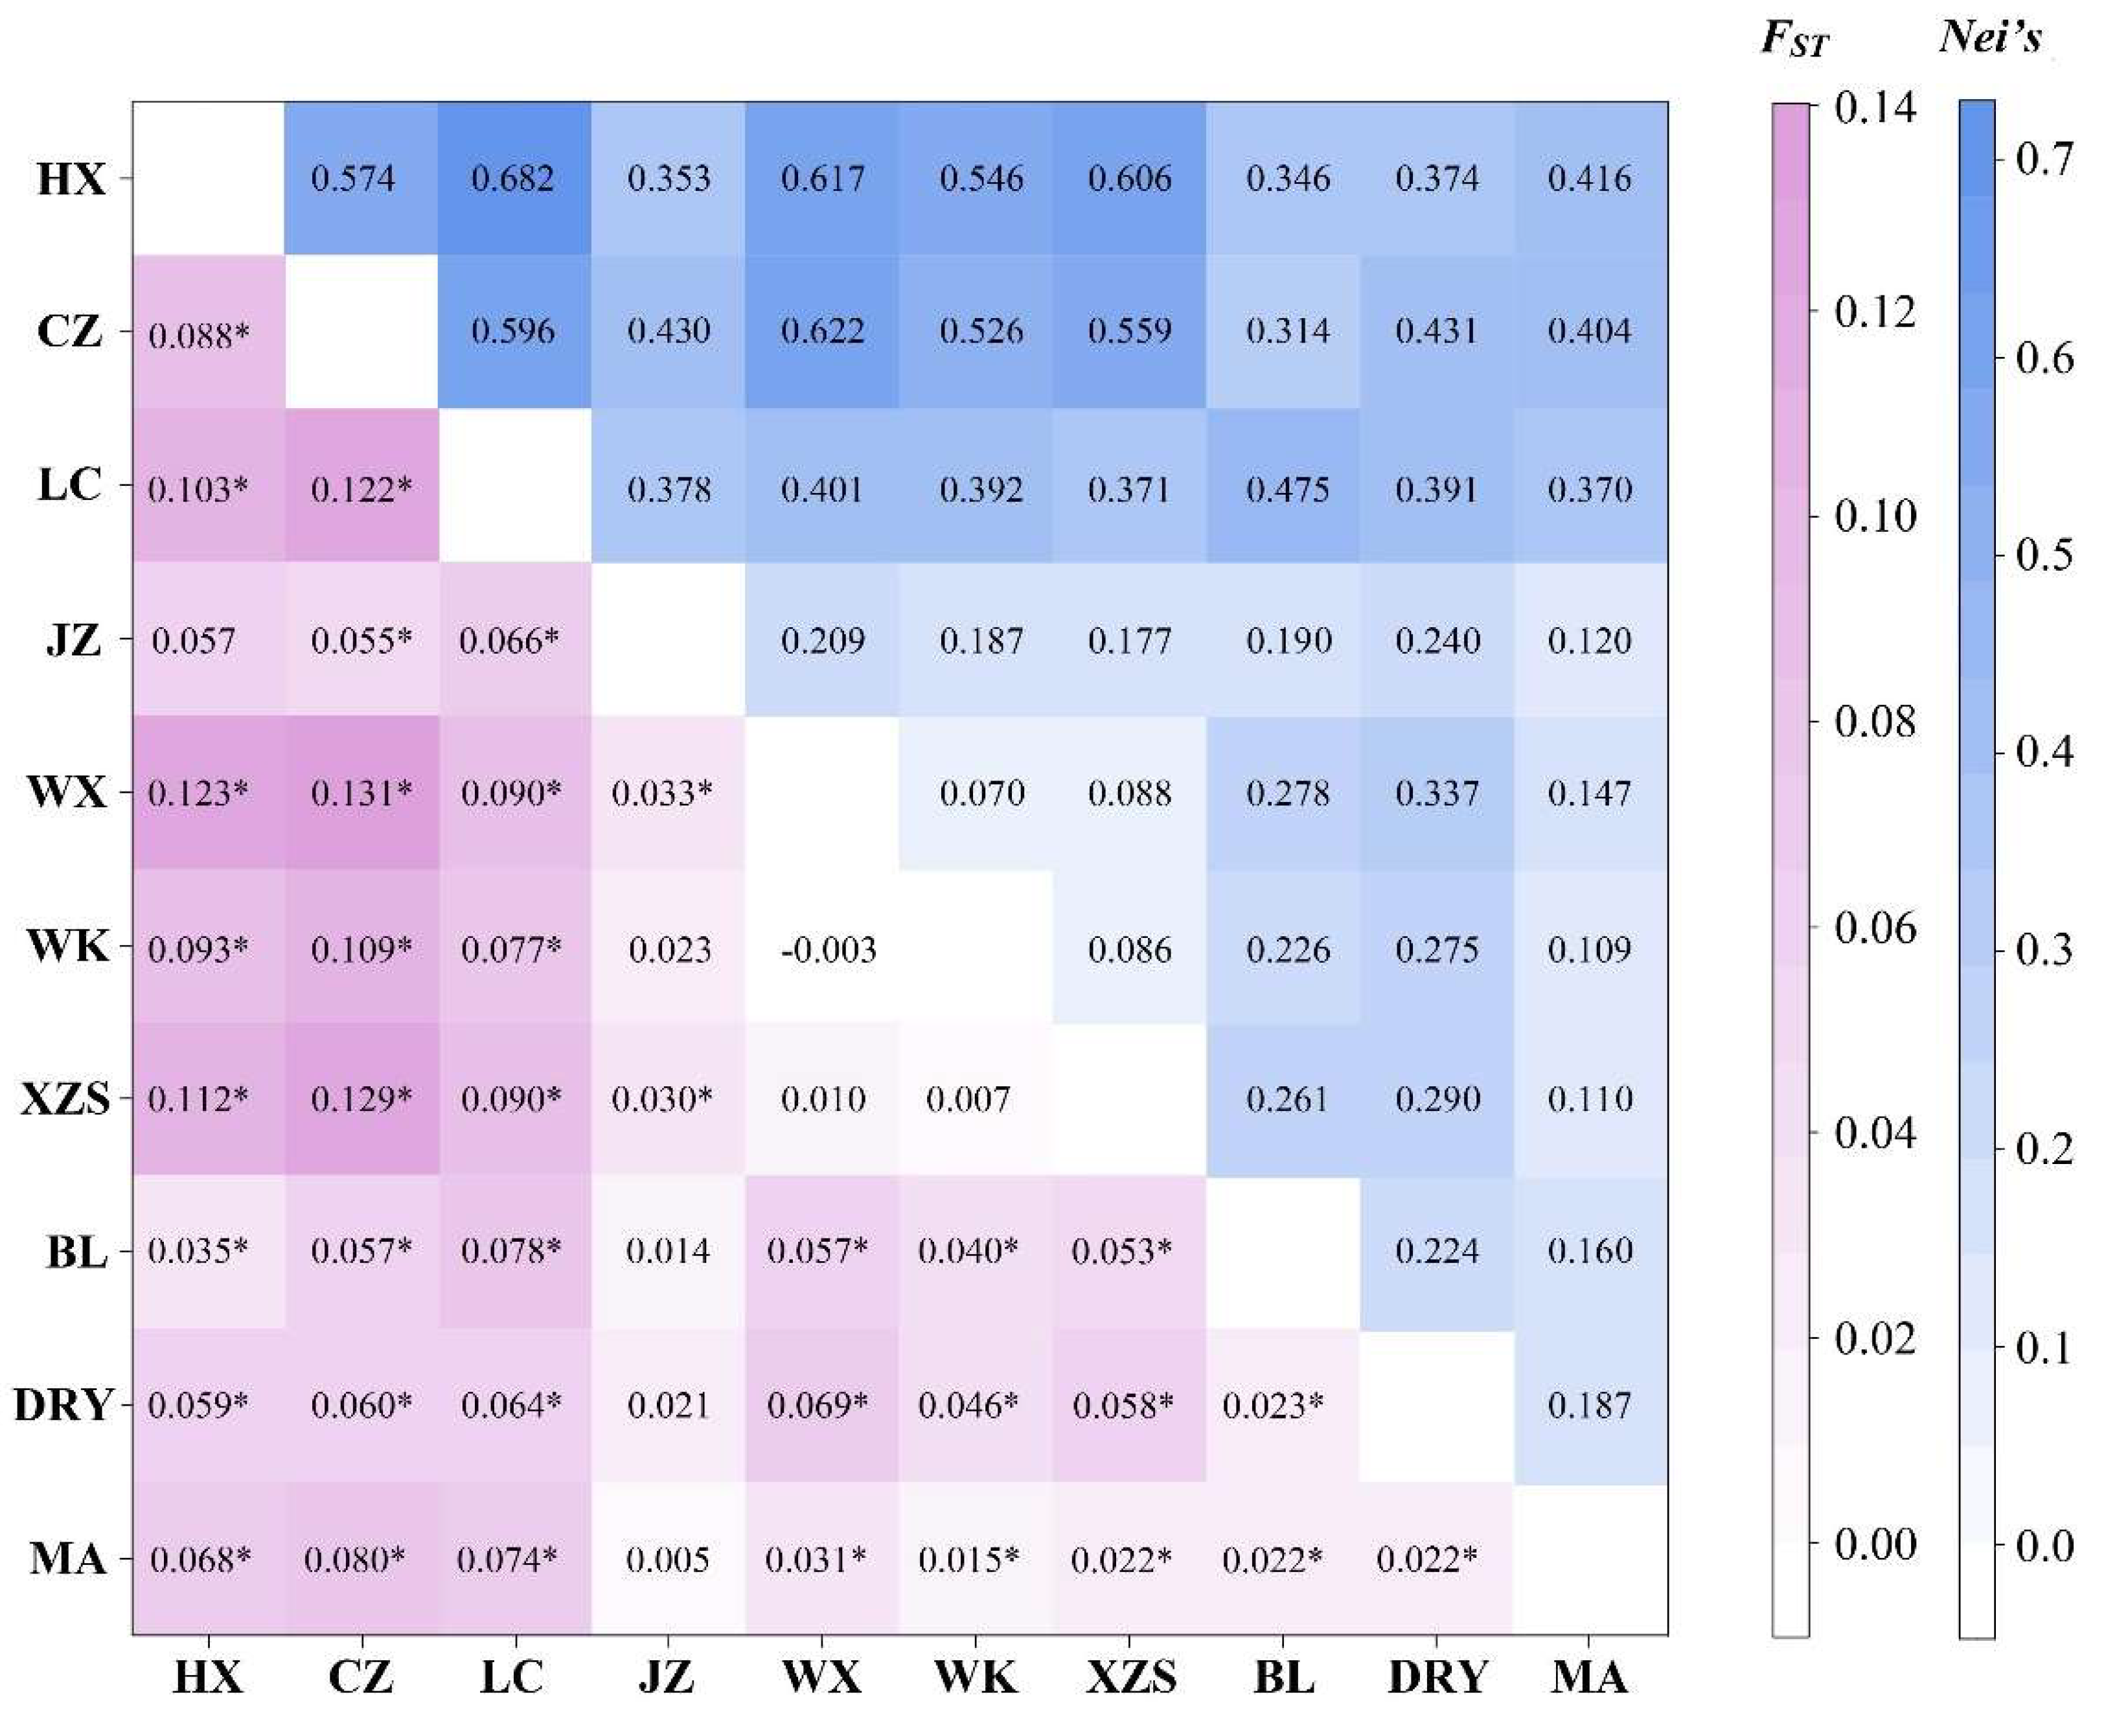
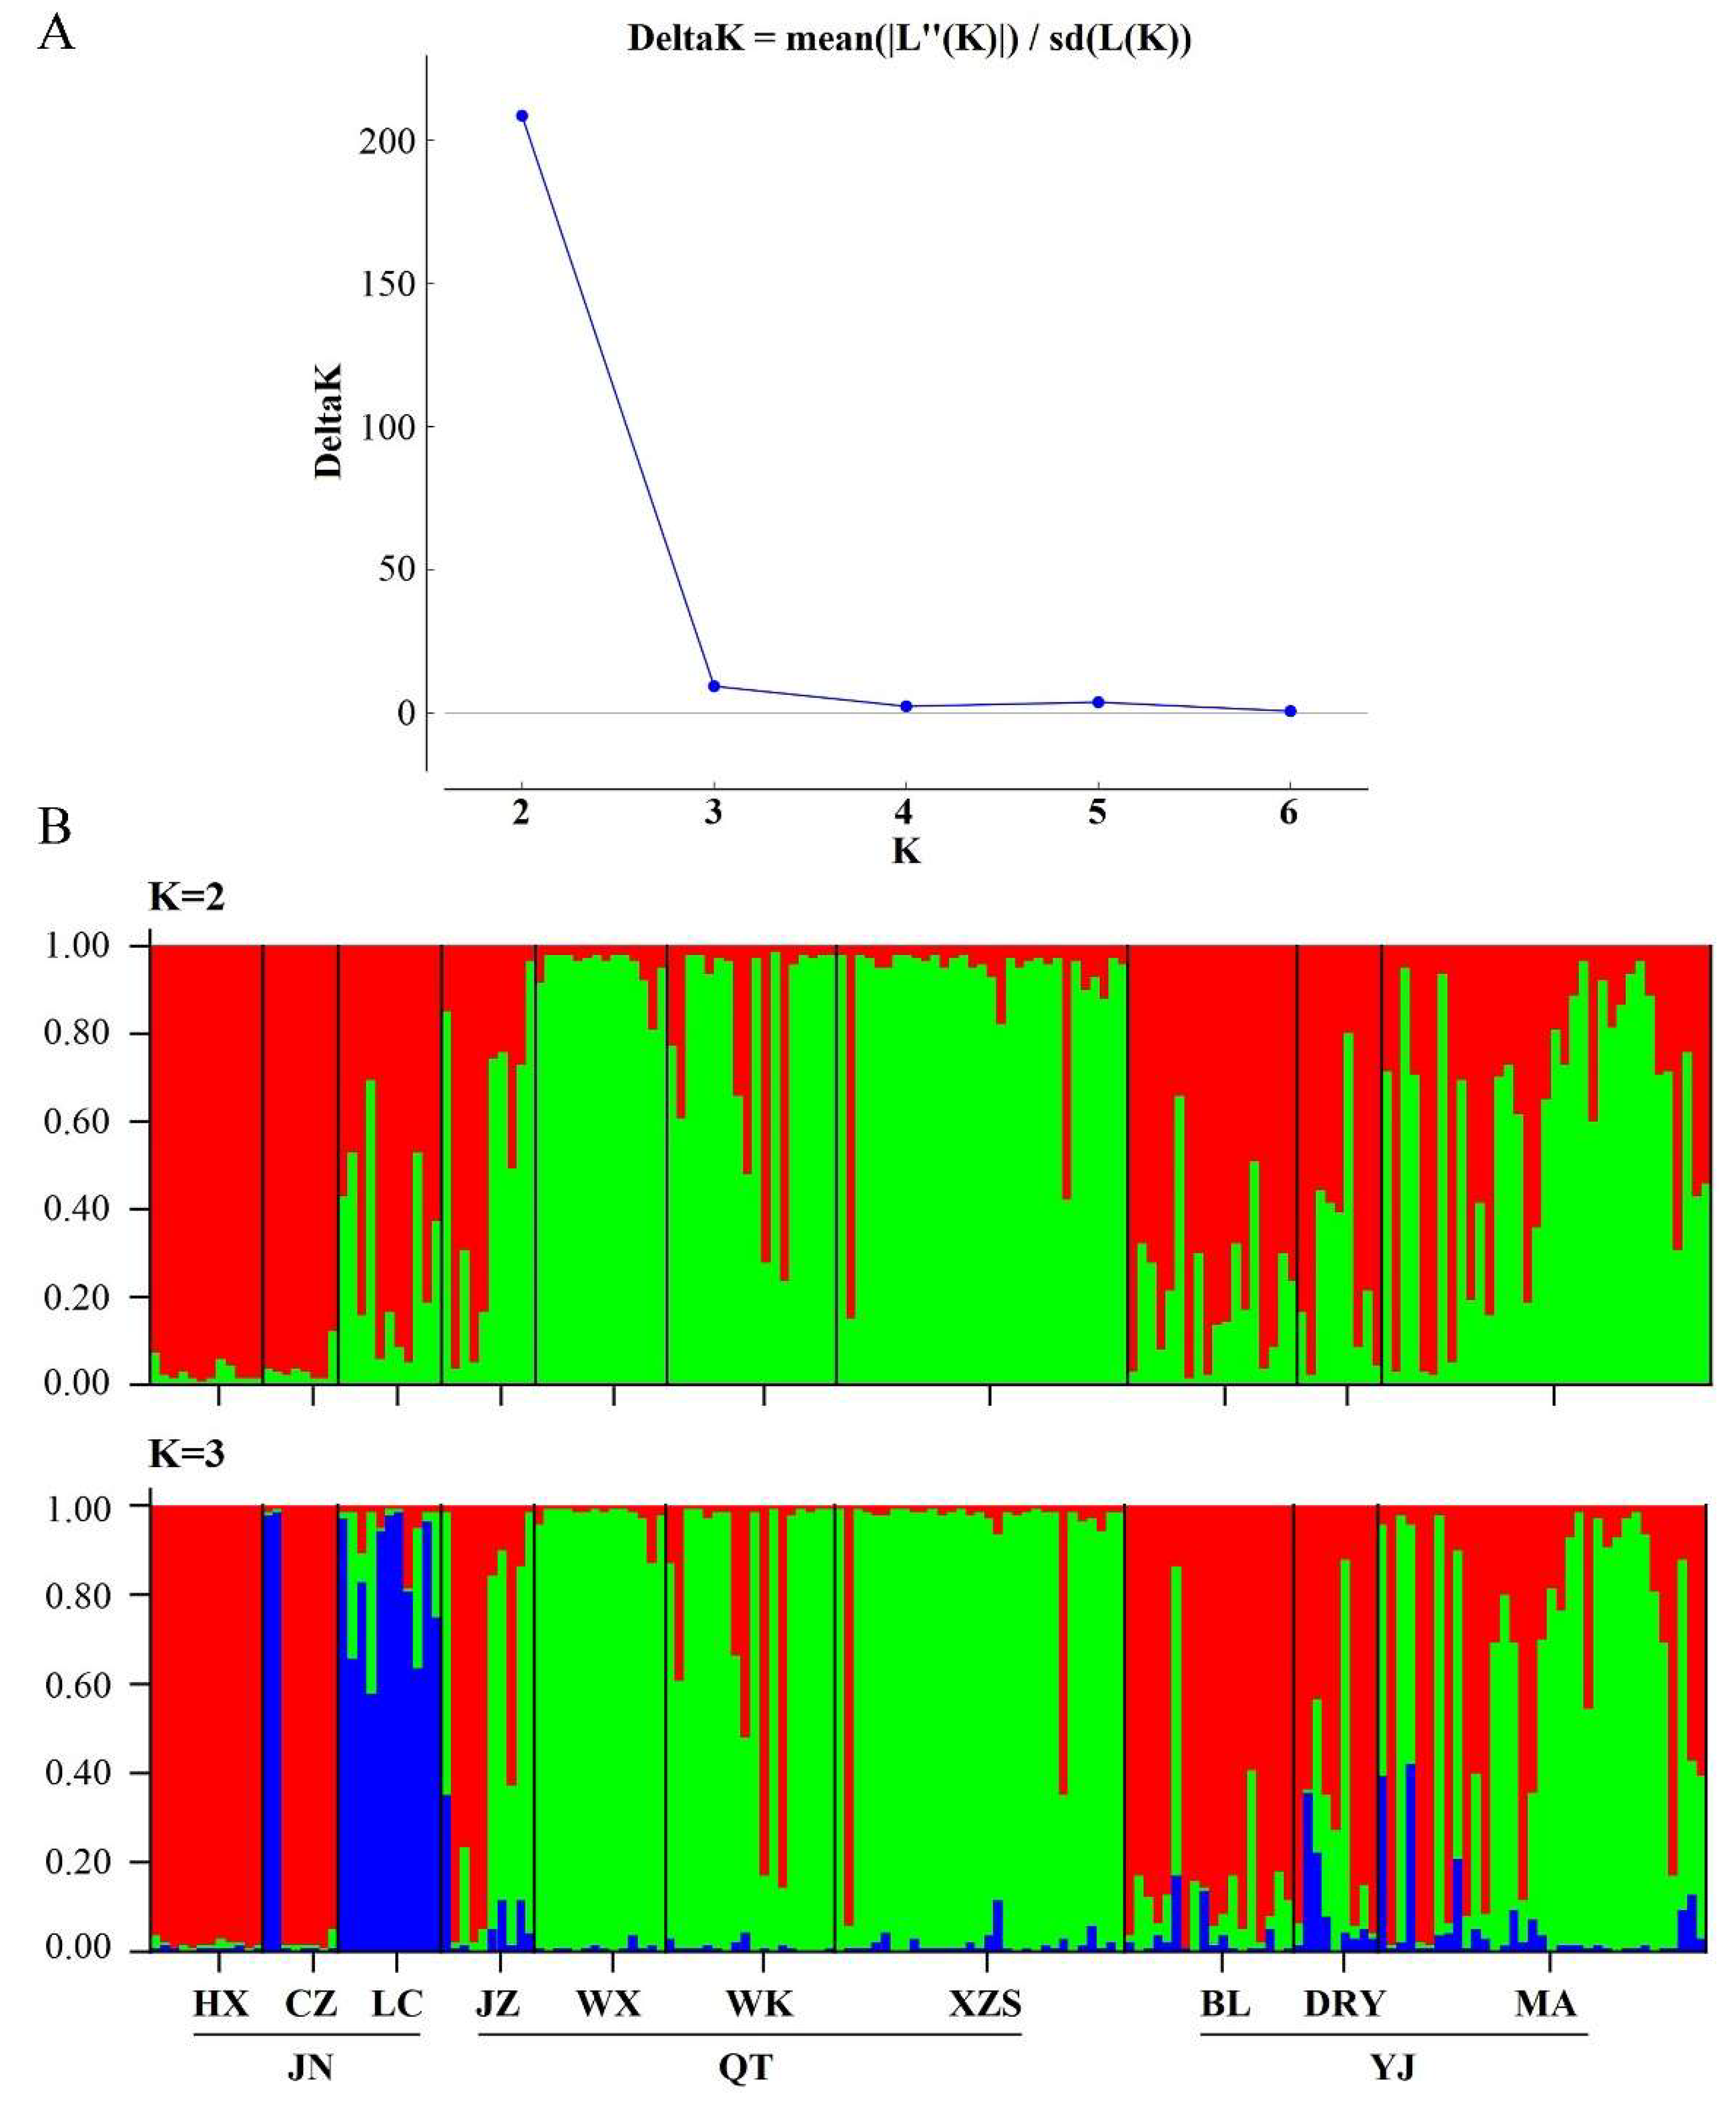
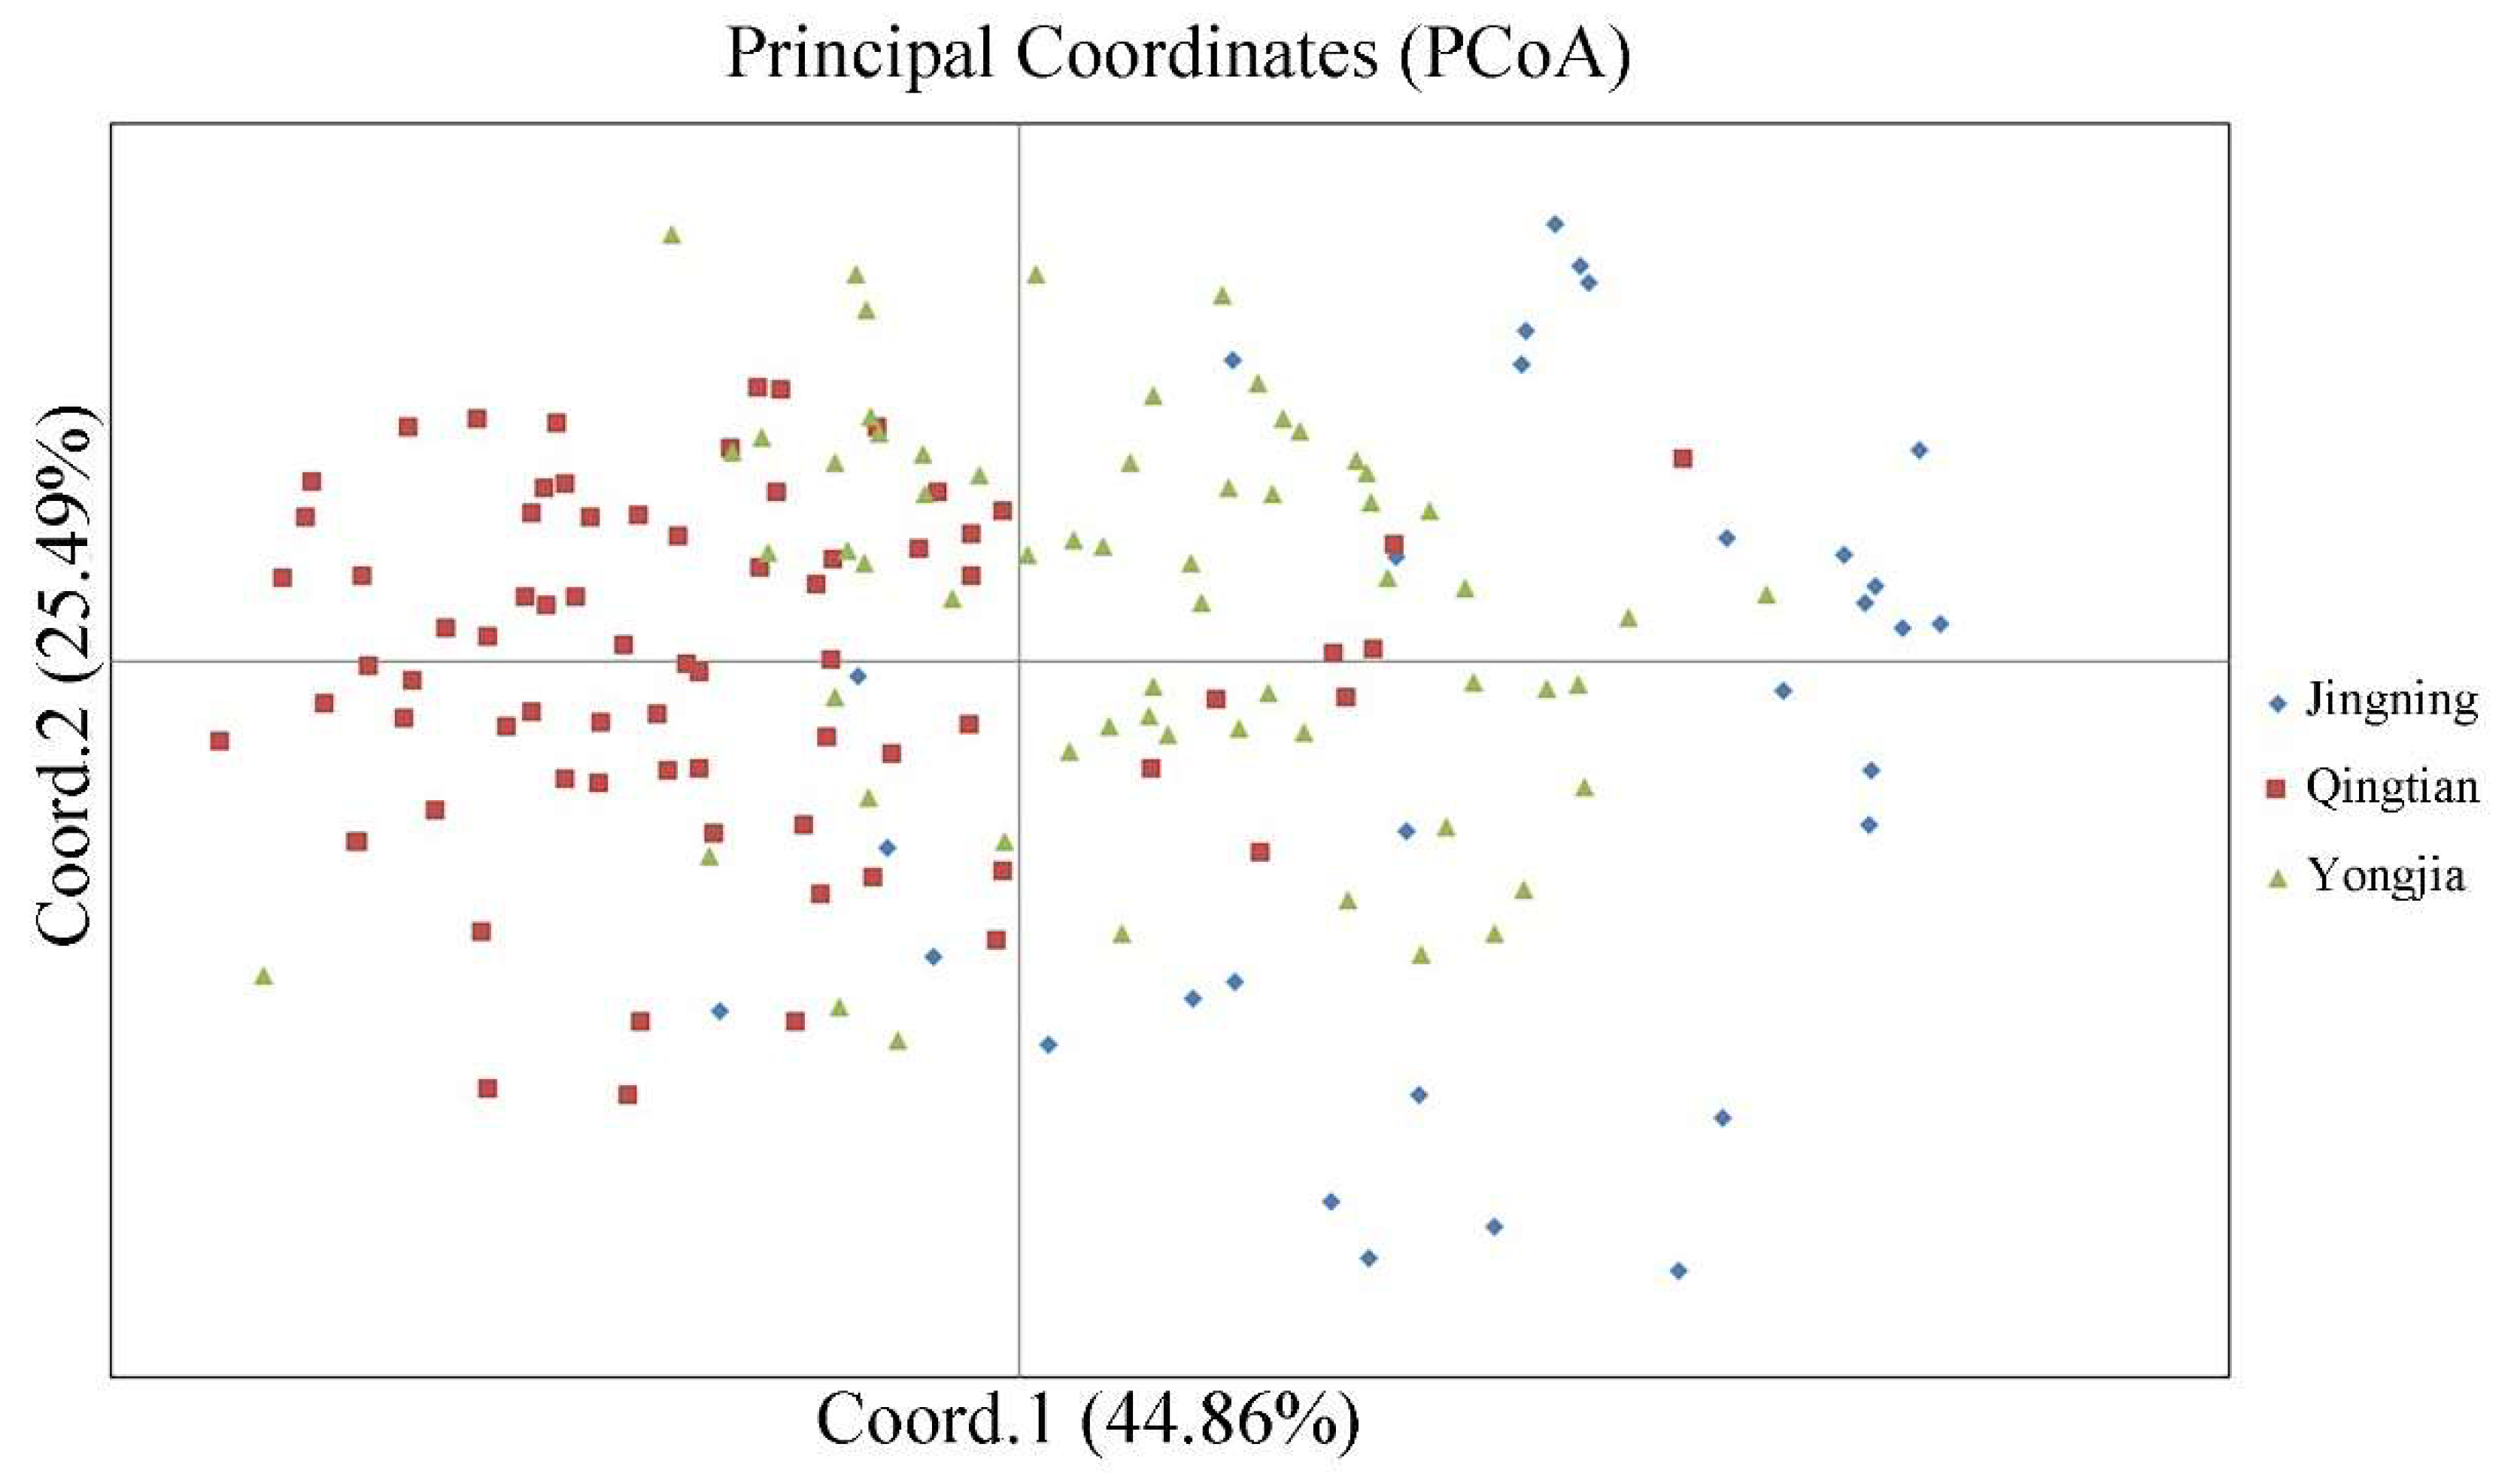
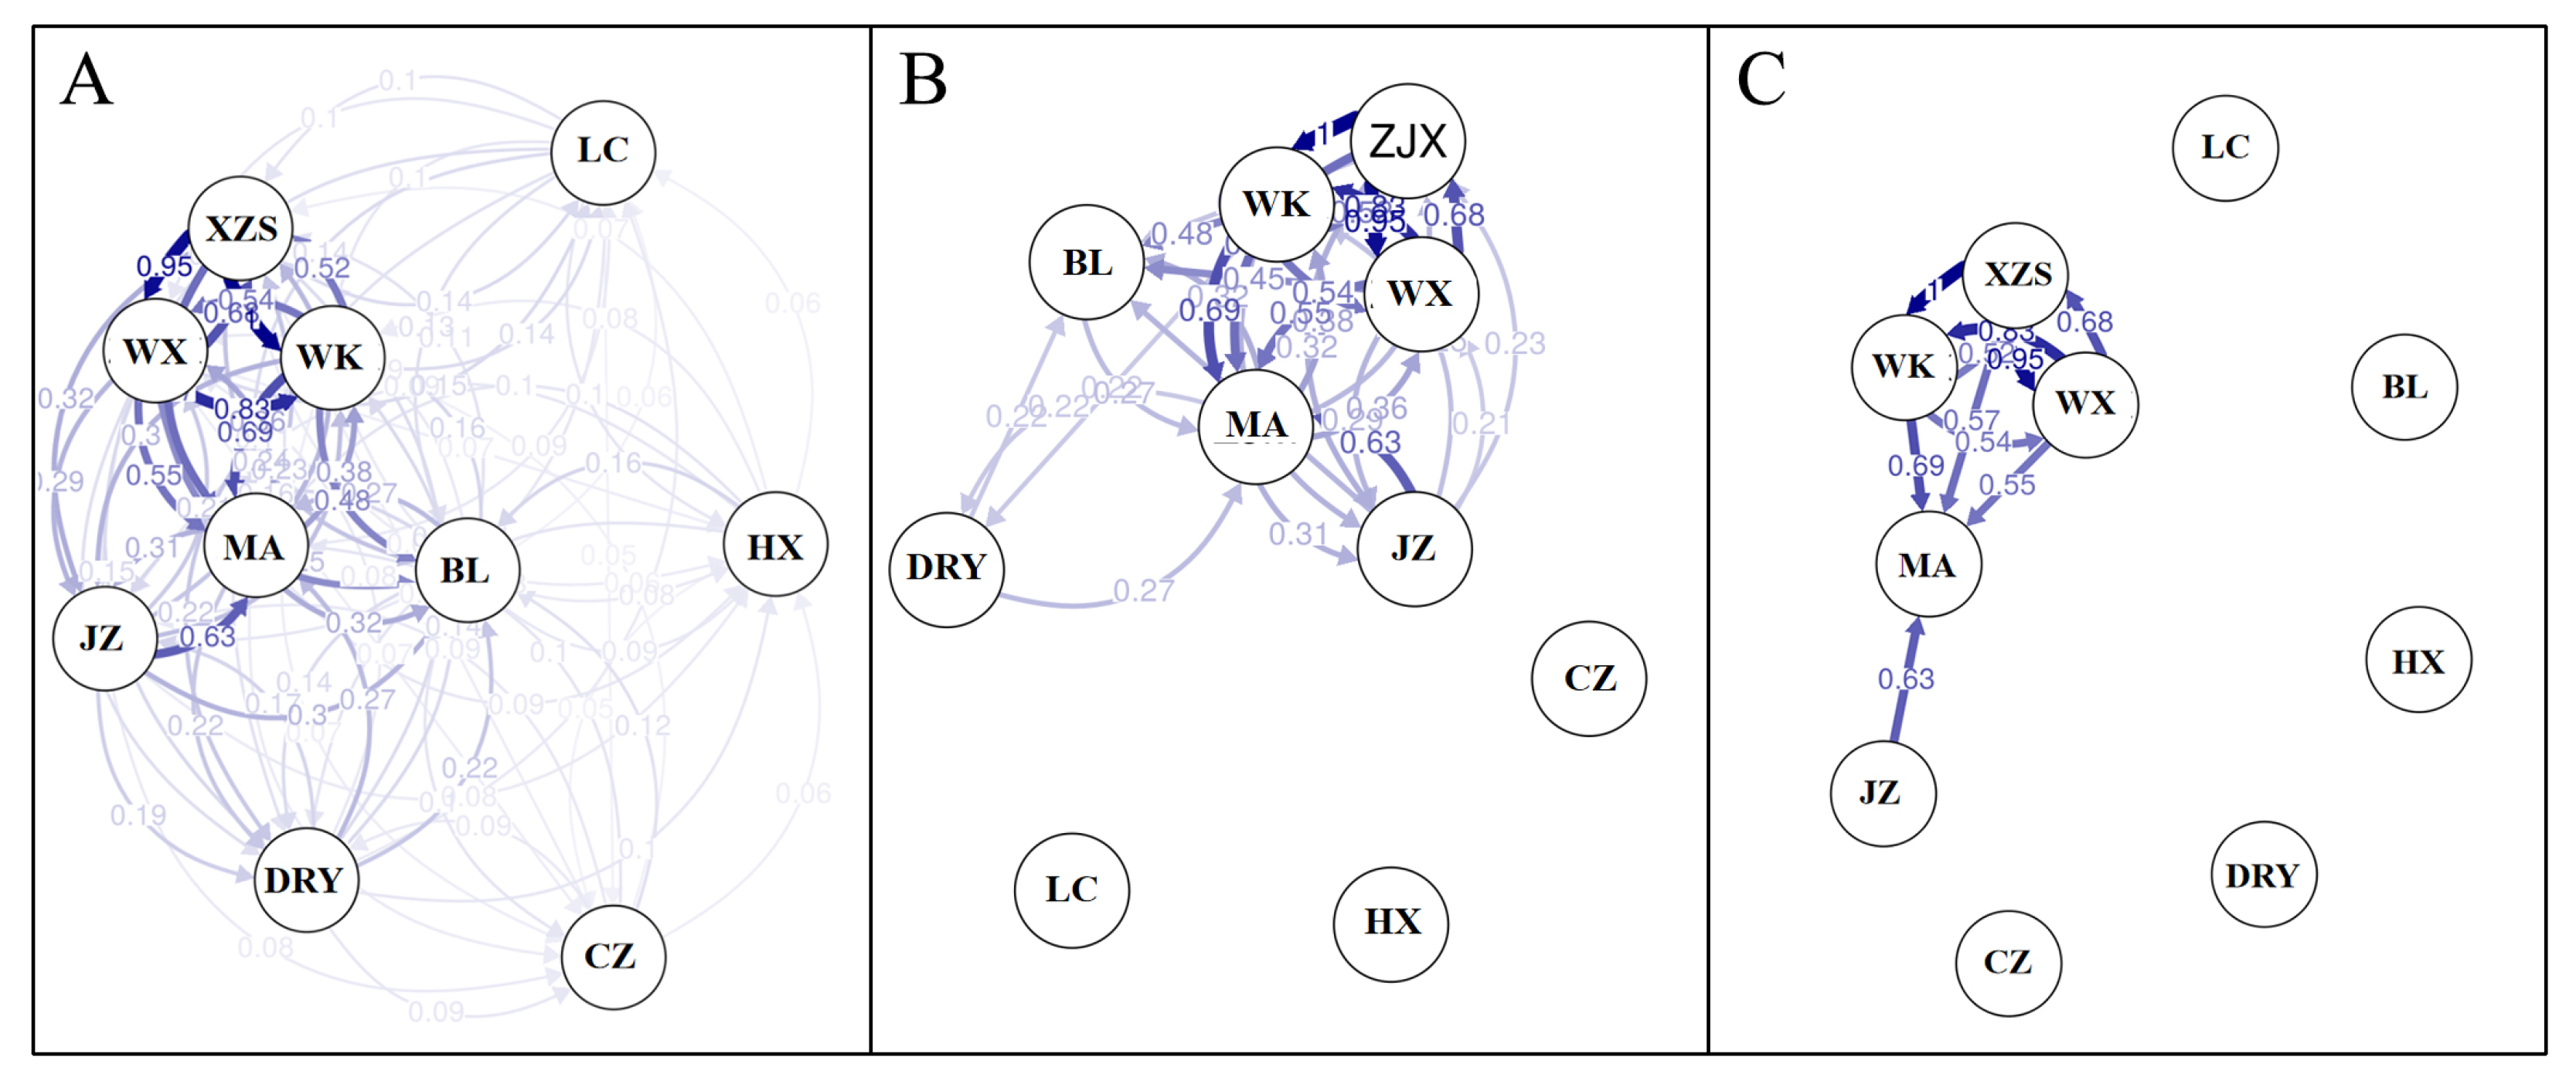
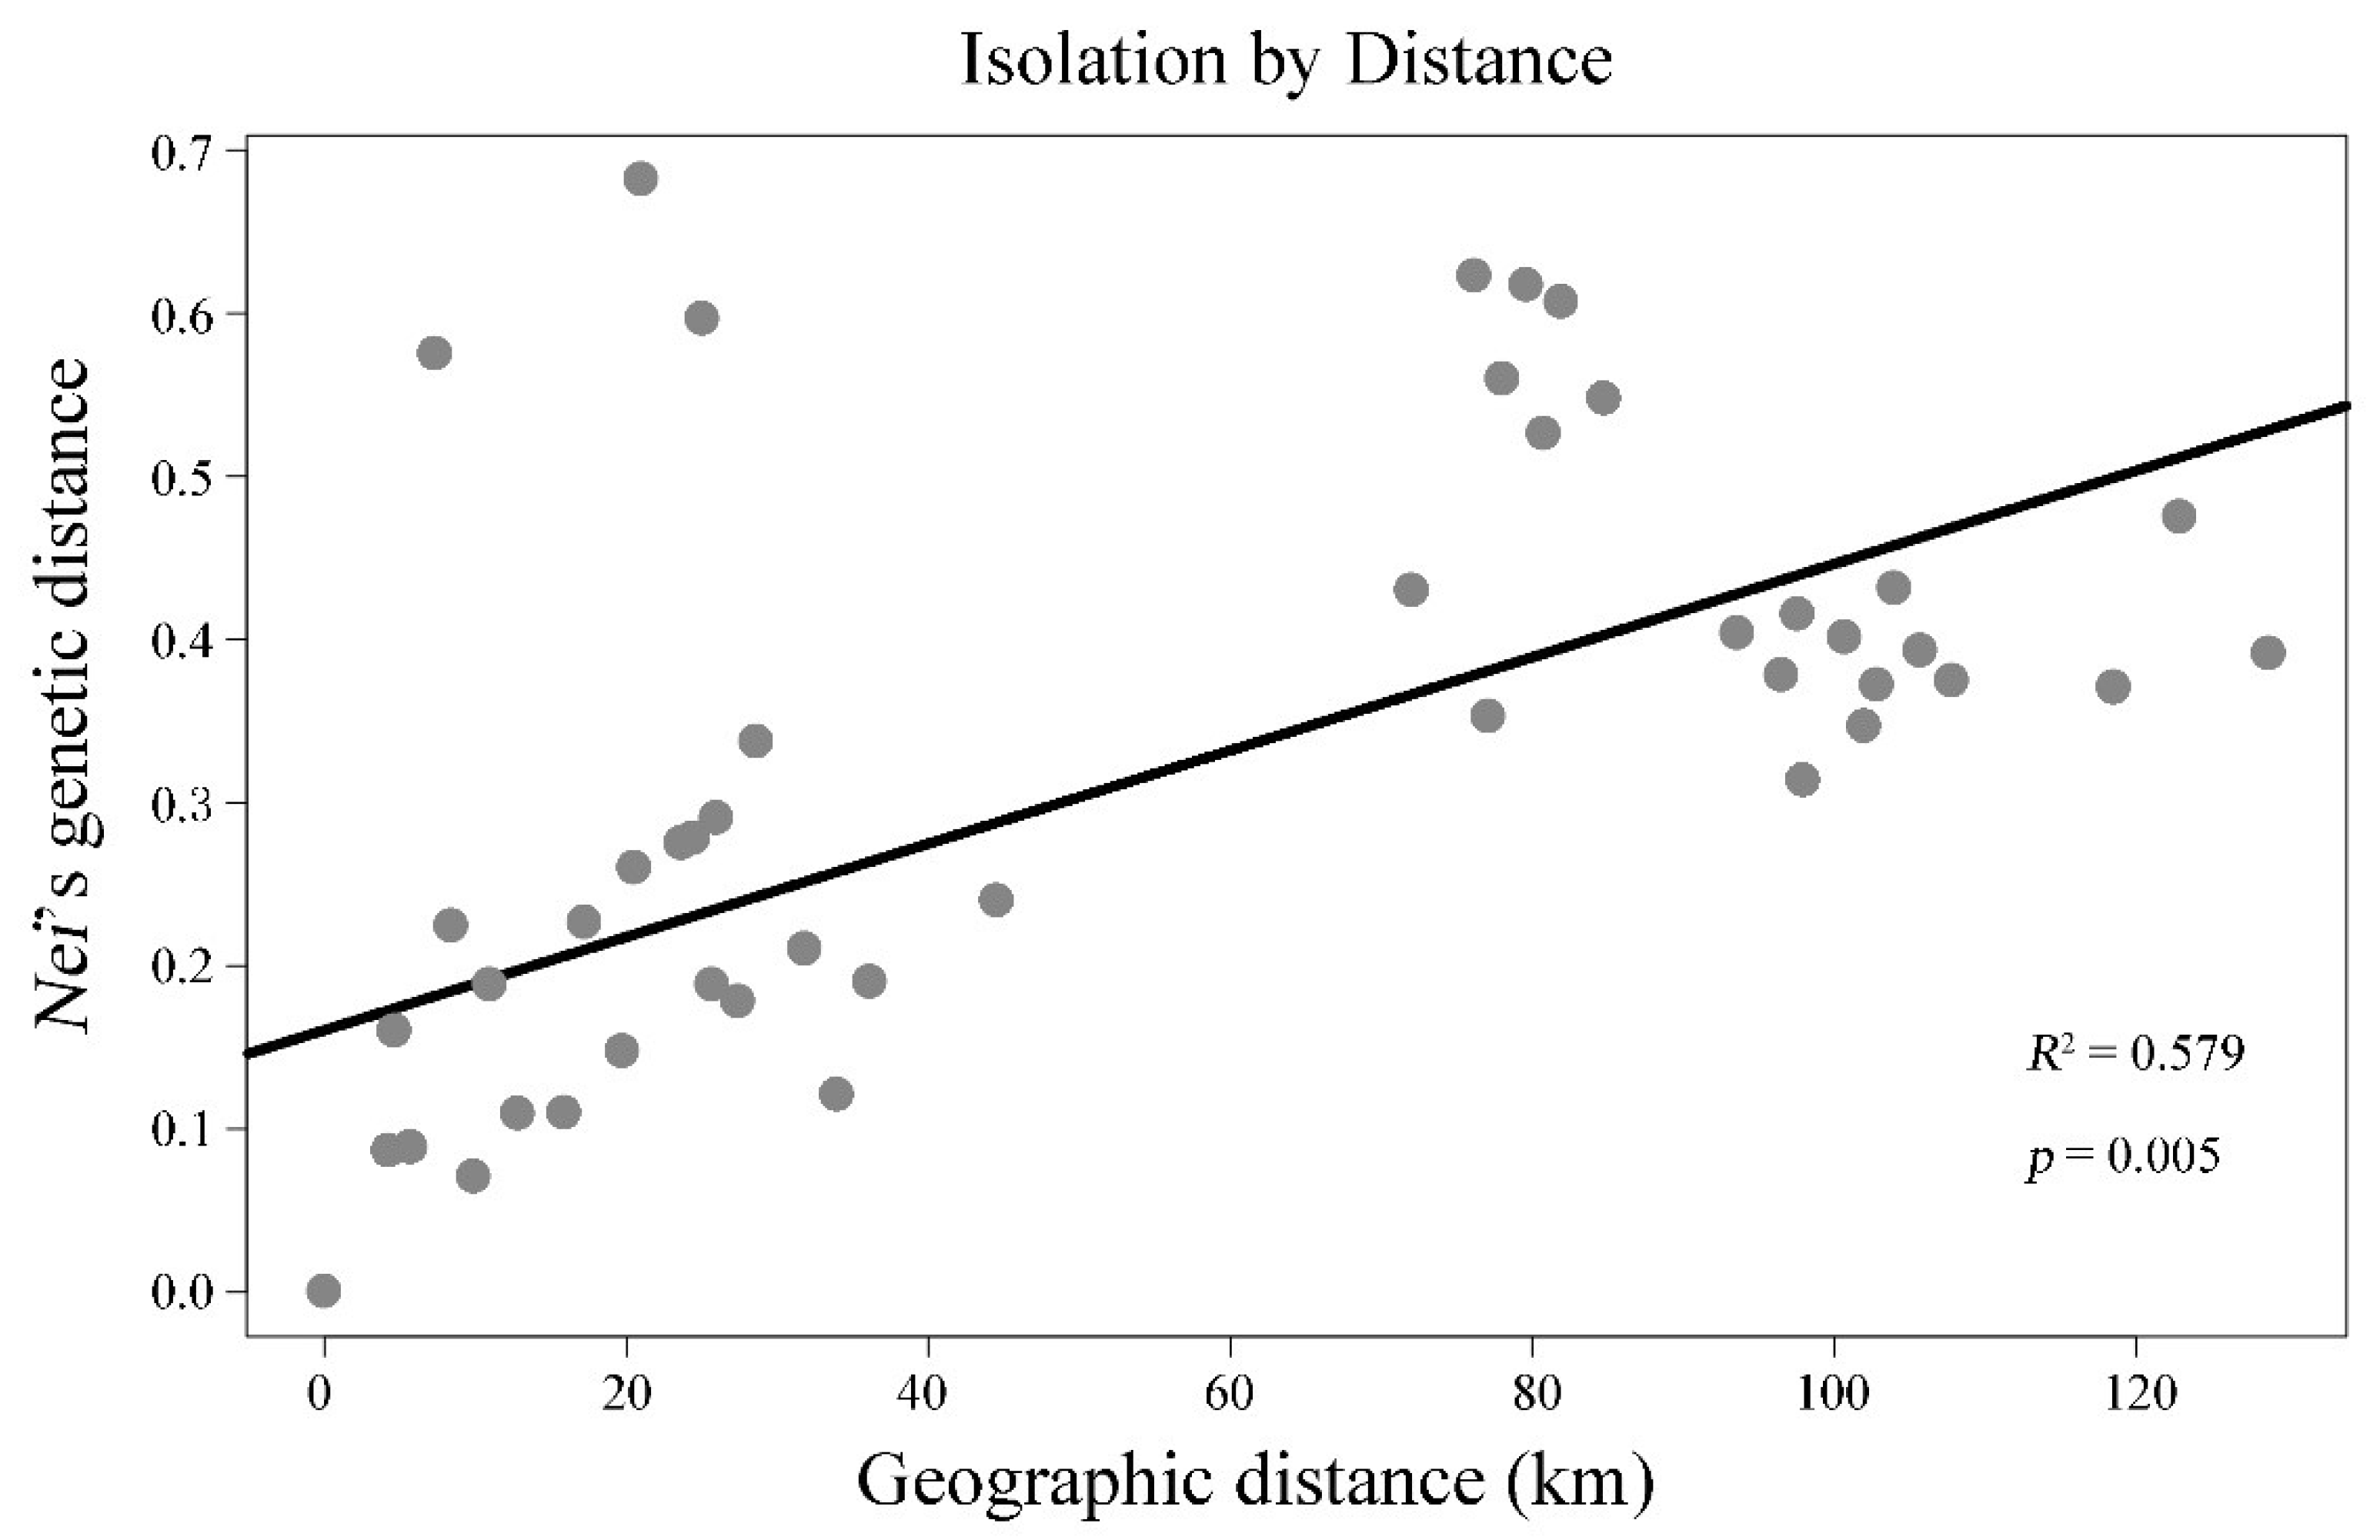
3.3. Genetic Differentiation among Populations

The pairwise FST values ranged from 0.00 (WX-WK) to 0.13 (WX-CZ), and Nei’s genetic distances ranged from 0.070 (WX-WK) to 0.620 (WX-CZ) (Figure 3). Among all 45 FST values, 37 values were statistically significant (p < 0.001; p-value after adjusting for multiple comparisons = 0.05/45), revealing remarkable differentiation of carp cocultured in paddies in the south of Zhejiang Province, China. Pairwise FST analyses also indicated that populations within Yongjia and Jingning counties were genetically different. Weak genetic differentiation was found within Qingtian County except that JZ was significantly different from WX and XZS. AMOVA revealed that the genetic variations among populations and within populations contributed 5% (p < 0.01) and 95% (p < 0.01) to the total genetic variation, respectively (Table 5).
Figure 3. Pairwise differentiation estimates (FST) (below the diagonal) and Nei’s genetic distances (above the diagonal) of the 10 C. carpio populations based on 20 microsatellite loci. Values with * indicate statistical significance (p < 0.001; p-value after adjusting for multiple comparisons = 0.05/45).
Table 5. The AMOVA of carp cocultured in paddies in three counties based on 20 microsatellite loci.
The Structure Harvester analysis identified K = 2 as the most probable cluster number of the 10 populations, and the second identified K value was K = 3 (Figure 4A). The Structure clustering analysis revealed two major genetic clusters (the red cluster and the green cluster, Figure 4B). The carp from Qingtian County were mainly assigned into the red cluster, while the carp from Jingning County were mainly assigned into the blue cluster. The two clusters equally made up Yongjia County. In the case of K = 3, another cluster (indicated in blue) was mainly separated from Jingning County. The result of the principal coordinates analysis (PCoA) based on Nei’s genetic distance is presented in Figure 5. The first and second axes explained 45% and 25% of the total variance, respectively. No obvious clustering was found among the three counties. The samples from Yongjia County were located in the center, while the samples from Jingning County were relatively discrete.
Figure 4. (A) Selection of K value in the structure analysis. (B) Genetic structure of the 10 carp populations based on 20 microsatellite loci in the case of K = 2 or 3. Colors represent the membership of each individual to the different clusters.
Figure 5. Principal coordinates analysis of the sampled carp based on Fst values.
The directional relative migration network for the studied carp populations indicated that WX, WK, XZS, JZ, and MA were core populations that had a high level of genetic exchange with other populations (i.e., migration in directional relative migration networks), the first four of which belong to Qingtian County, whereas HX, LC, CZ, DRY, and BL were peripheral populations with a low level of genetic exchange (Figure 6), the first three of which belong to Jingning County. No significant asymmetric migration pattern was detected. The test of isolation by distance (IBD) proved that there was a significantly positive correlation between the genetic distances and the geographical distances of the 10 carp populations (R2 = 0.579 and p = 0.005, Figure 7). This indicated that the genetic differentiation between the sampled carp populations in southern Zhejiang Province of China was mainly affected by geographical distance.
Figure 6. Directional relative migration networks of the studied carp populations constructed with divMigrate. Numbers on the arrows represent the relative migration coefficients derived from FST statistics. Line shading and thickness increase with the relative strength of gene flows. When larger than 0.05 (A), 0.2 (B), or 0.5 (C), the coefficients are displayed.
Figure 7. Relationship between the genetic distance and geographic distance among the studied carp populations.

4. Discussion

Our meta-analysis showed that the genetic diversity of cultured populations of most tested aquatic animals was obviously lower than that of wild populations and that the change in genetic diversity differed among different types of aquatic animals. Those results indicate that aquaculture could generally reduce the genetic diversity of many cultured aquatic animals. An additional concern is the reduction in some wild populations and, hence, the reduction in those pools of genetic diversity. Actually, some tested species in this study may not have a statistically significant reduction in genetic diversity (e.g., catfish, arthropods). New techniques are being used to maximize genetic diversity in cultured species [,,]. The genetic resources of aquatic animals were not significantly paid attention to until the 1990s [,]. A small effective population size and poor breeding management were considered to be the main causes of decline in genetic diversity in cultured populations []. For example, Machado-Schiaffino et al. [] found the imbalance in the sex ratio in breeding causes a decline in genetic diversity of the fish Salmo salar. Fazzi-Gomes et al. [] found a loss of genetic diversity and high inbreeding rates in farmed populations of the fish Arapaima gigas throughout the Amazon basin due to genetic bottlenecks caused by the domestication process and the founding effect. The decrease in the genetic diversity of aquatic animals will impair the adaptation and fitness of aquatic animals (e.g., productivity and disease resistance) [,,]. As the proportion of aquaculture is increasing in the supply of aquatic products, it is urgent to protect the genetic diversity of aquatic animals. To ensure the long-term sustainability of aquatic stocks, the breeding program should be taken seriously. The selective breeding program can provide farmers a high rate of economic return by creating wide variations and improving hereditary traits [,]. As the breeding program progresses, it is important to collect as much allelic variability as possible, which can maintain the level of genetic variability of aquatic animals []. Genetic diversity should be paid more attention to in the future as a guide for choosing brood stock to form the base population for selective breeding programs and for ongoing monitoring of the levels of inbreeding and genetic drift [,].
The genetic diversity of C. carpio cocultured in paddies in southern Zhejiang Province was at a high level throughout our study. Ren [] conducted a literature review to evaluate the genetic diversity indices of wild carp populations (mean Na = 7.71, He = 0.71) and cultured carp populations (mean Na = 5.37, He = 0.62) from 55 relevant published papers. The results of our study (mean Na = 7.40, He = 0.71) were similar to the genetic diversity of wild carp populations and higher than cultured carp populations. This suggests that traditional agricultural systems play a role in in situ conservation of the genetic diversity of carp cocultured in paddies in southern Zhejiang Province. The C. carpio preserved in the traditional rice–fish coculture system is a landrace that has well adapted to the paddy environment, with strong resistance to pests and diseases and adaptation to the fierce habitat changes during rice cultivation [,]. In the traditional agricultural system, the conservation of carp depends on the recognition, collection, and introduction of new strains by local smallholders, resulting in the diversity accumulation of genotypes and alleles in landraces [,]. Farmers often exchanged germplasm (e.g., selection and exchange of brood stock or seed) of carp cocultured in paddies in the traditional agricultural system. Germplasm exchange has been found to be an important factor in maintaining genetic diversity of crops and livestock in many traditional agricultural systems [,,,]. In our study, the carp cocultured in paddies in Qingtian County were rich in body color. The practice of having a mixed culture of carp with diverse color types is in favor of the diversified use of natural food resources by fish in paddy fields, which promotes fish productivity []. Therefore, the demand for diverse carp colors may be the reason for maintaining germplasm exchange. In addition, in Yongjia County, the exchange of carp with different colors is also related to marriage customs; this custom is still preserved in some areas []. Accordingly, the traditional techniques and culture noted in Zhejiang are an excellent source of maintaining genetic diversity. It is somewhat encouraging that, with proper management, such as those learned from traditional agriculture, genetic losses in agriculture could be minimized or avoided [,].
Pairwise FST value in our study revealed significant genetic differentiation of carp populations among the three counties. This genetic division may be due to geographic isolation and the differences between farmers from different counties in the selection preference of carp. The results also suggested a significant genetic differentiation within Yongjia County and within Jingning County, while a weak genetic differentiation was found within Qingtian County, except for JZ. This could be due to the fact that the sampling sites of Yongjia and Jingning were located in remote and isolated mountainous areas, while Qingtian County, as a GIAHS site, still maintains a large area of the traditional rice–fish farming system: more than 90% of rice paddies are stocked with fish []. Traditional farmers have created a unique sharing system in which farmers interdependently select parental carp and produce and exchange fry in Qingtian County []. Larger relative migration values from the migration network estimated by divMigrateOnline of the XZS population to other populations indicated that XZS was most likely the source population, whereas the populations from Jingning County (i.e., LC, HX, and CZ) might be the sink populations. The results strongly suggested that JZ was genetically distinct from the other Qingtian populations. This population exhibited the lowest FST values with populations from Yongjia County compared to the other three populations from Qingtian County. Membership coefficients estimated by Structure and the migration network strongly suggested that the JZ population was genetically distinct from other Qingtian populations. The JZ population and populations from Yongjia County had close relationships. This could be due to the transfer of seed stock/brood stock from JZ to the Yongjia area. A genetic structure analysis in the present study showed that the genetic structure of carp populations cocultured in paddies in southern Zhejiang Province was mainly determined by germplasm exchange caused by breeding introduction.
The rice–fish coculture system can be a sustainable agricultural model that improves farm productivity, provides an opportunity to improve the economic benefits of farmers, and improves the utilization of paddy and water resources []. However, the development of modern agriculture reduces the exchange of germplasm resources and activities of the rice–carp coculture in paddies among farmers. To ensure the long-term sustainability of germplasm resources of carp cocultured in paddies, a scientific and feasible monitoring program of genetic diversity in the existing populations should be formulated and proper measures of development and conservation should be strengthened. Firstly, we suggest the government should formulate policies on promoting the practice of rice–fish coculture, on training farmers to maintain carp diversity by continuing to exchange brood stock, and on monitoring every 5 to 10 years. Secondly, in the breeding process, to avoid the reduction in genetic diversity caused by inbreeding, the number of parents and effective population size should be increased to at least the minimum level of heterozygosity required. Thirdly, seed stock or brood stock selection should be performed locally to avoid genetic pollution of the local population. In addition, it is necessary to reduce environmental pollution and protect the paddy habitats and resources for traditional agriculture and local carp populations, thus ensuring the sustainable development of the rice–fish coculture system in southern Zhejiang Province of China.

5. Conclusions

The meta-analysis results, both when weighted by population replicate and when weighted by the inverse of variance, showed an overall negative effect size in genetic diversity of all tested aquatic animals. This indicates that aquaculture activities have caused a general decline in the genetic diversity of aquatic animals, although at different levels for different types of aquatic animals. We detected high levels of genetic variation in all 10 populations of carp cocultured in paddies (C. carpio) in the traditional rice–fish coculture system in southern Zhejiang Province of China. Low levels of an effective population size were detected in most of the C. carpio populations. No bottleneck events have recently occurred in these populations. Both conventional and model-based population genetic analyses suggested significant genetic divergence among the three counties. Pairwise FST values suggested genetic differentiation within Yongjia County and Jingning County, while no obvious genetic difference between sampled populations was found in Qingtian County with the exception of the JZ population. We suggest formulating policies, training farmers, and monitoring regularly for maintaining the rice–fish coculture system and using a sufficient number of parents in the breeding process to avoid inbreeding and genetic erosion of local carp cocultured in paddies.

Supplementary Materials

The following supporting information can be downloaded at https://www.mdpi.com/article/10.3390/agriculture12070997/s1. Table S1: Information of 20 polymorphic microsatellite loci for C. carpio. Table S2: Source data in meta-analysis of the effect of aquaculture on aquatic animals (weighted by the inverse of variance). Table S3: Source data in meta-analysis of the effect of aquaculture on aquatic animals (weighted by population replicates).

Author Contributions

Conceptualization, Y.Y. and W.R.; methodology, L.H. and X.C.; software, L.Z.; validation, S.Z., J.T., L.H. and X.C.; formal analysis, Y.Y. and W.R.; investigation, L.Z.; resources, S.Z., J.T. and X.C.; data curation, L.H.; writing–original draft preparation, Y.Y. and W.R.; writing–review and editing, L.H. and X.C.; visualization, J.T.; supervision, L.H.; project administration, L.H. and X.C.; funding acquisition, L.H. and X.C. All authors have read and agreed to the published version of the manuscript.

Funding

The study was supported by the National Natural Science Foundation of China (31770481, 31661143001), Zhejiang Provincial Key Research and Development Project (2022C02058, LGN22C030002), and Guangdong Provincial Key Research and Development Project (2021B0202030002).

Institutional Review Board Statement

Not applicable.

Data Availability Statement

The data presented in this study are available upon request from the corresponding author.

Conflicts of Interest

The authors declare no conflict of interest.

References

  1. Pingali, P.L. Green Revolution: Impacts, limits, and the path ahead. Proc. Natl. Acad. Sci. USA 2012, 109, 12302–12308. [Google Scholar] [CrossRef] [PubMed] [Green Version]
  2. Cheng, W.; D’Amato, A.; Pallante, G. Benefit sharing mechanisms for agricultural genetic diversity use and on-farm conservation. Econ. Politica 2020, 37, 337–355. [Google Scholar] [CrossRef]
  3. Castilla, F.; Montilla-Bascón, G.; Bekele, W.A.; Howarth, C.J.; Prats, E. Population genomics of mediterranean oat (A. sativa) reveals high genetic diversity and three loci for heading date. Theor. Appl. Genet. 2021, 134, 2063–2077. [Google Scholar]
  4. van de Wouw, M.; Kik, C.; Hintum, T.; van Treuren, R.; Visser, B. Genetic erosion in crops: Concept, research results and challenges. Plant Genet. Resour. 2010, 8, 1–15. [Google Scholar] [CrossRef] [Green Version]
  5. Boettcher, P.J.; Hoffmann, I. Protecting indigenous livestock diversity. Science 2011, 334, 1058. [Google Scholar] [CrossRef]
  6. Aerts, R.; Berecha, G.; Honnay, O. Protecting coffee from intensification. Science 2015, 347, 139. [Google Scholar] [CrossRef] [Green Version]
  7. Rajpurohit, D.; Jhang, T. In situ and ex situ conservation of plant genetic resources and traditional knowledge. In Plant Genetic Resources and Traditional Knowledge for Food Security; Springer: Singapore, 2015; pp. 137–162. [Google Scholar]
  8. Priyanka, V.; Kumar, R.; Dhaliwal, I.; Kaushik, P. Germplasm conservation: Instrumental in agricultural biodiversity—A review. Sustainability 2021, 13, 6743. [Google Scholar] [CrossRef]
  9. Jarvis, D.I.; Brown, A.H.D.; Cuong, P.H.; Collado-Panduro, L.; Latournerie-Moreno, L.; Gyawali, S.; Tanto, T.; Sawadogo, M.; Mar, I.; Sadiki, M.; et al. A global perspective of the richness and evenness of traditional crop-variety diversity maintained by farming communities. Proc. Natl. Acad. Sci. USA 2008, 105, 8160. [Google Scholar] [CrossRef] [Green Version]
  10. Achtak, H.; Ater, M.; Oukabli, A.; Santoni, S.; Kjellberg, F.; Khadari, B. Traditional agroecosystems as conservatories and incubators of cultivated plant varietal diversity: The case of fig (Ficus carica L.) in Morocco. BMC Plant Biol. 2010, 10, 28. [Google Scholar] [CrossRef] [Green Version]
  11. Garlock, T.; Asche, F.; Anderson, J.; Bjørndal, T.; Kumar, G.; Lorenzen, K.; Tveteras, R. A global blue revolution: Aquaculture growth across regions, species, and countries. Rev. Fish Sci. Aquac. 2020, 28, 107–116. [Google Scholar] [CrossRef]
  12. Ahmad, A.; Abdullah, S.R.S.; Hasan, H.A.; Othman, A.R.; Ismail, N.I. Aquaculture industry: Supply and demand, best practices, effluent and its current issues and treatment technology. J. Environ. Manag. 2021, 287, 112271. [Google Scholar] [CrossRef] [PubMed]
  13. Napier, J.A.; Haslam, R.P.; Olsen, R.E.; Tocher, D.R.; Betancor, M.B. Agriculture can help aquaculture become greener. Nat. Food 2020, 1, 680–683. [Google Scholar] [CrossRef]
  14. Wang, C.; Li, Z.; Wang, T.; Xu, X.; Zhang, X.; Li, D. Intelligent fish farm—The future of aquaculture. Aquacult. Int. 2021, 29, 2681–2711. [Google Scholar] [CrossRef] [PubMed]
  15. Ju, R.T.; Li, X.; Jiang, J.J.; Wu, J.; Liu, J.; Strong, D.R.; Li, B. Emerging risks of non-native species escapes from aquaculture: Call for policy improvements in China and other developing countries. J. Appl. Ecol. 2020, 57, 85–90. [Google Scholar] [CrossRef] [Green Version]
  16. Tan, M.P.; Wong, L.L.; Razali, S.A.; Afiqah-Aleng, N.; Mohd Nor, S.A.; Sung, Y.Y.; de Peer, Y.V.; Sorgeloos, P.; Danish-Daniel, M. Applications of next-generation sequencing technologies and computational tools in molecular evolution and aquatic animals conservation studies: A short review. Evol. Bioinform. 2019, 15, 1–5. [Google Scholar] [CrossRef] [Green Version]
  17. Aguiar, J.D.P.; Gomes, P.F.F.; Hamoy, I.G.; Santos, S.E.B.D.; Schneider, H.; Sampaio, I. Loss of genetic variability in the captive stocks of tambaqui, Colossoma macropomum (Cuvier, 1818), at breeding centres in Brazil, and their divergence from wild populations. Aquac. Res. 2018, 49, 1914–1925. [Google Scholar] [CrossRef]
  18. Lind, C.E.; Evans, B.S.; Knauer, J.; Taylor, J.J.U.; Jerry, D.R. Decreased genetic diversity and a reduced effective population size in cultured silver-lipped pearl oysters (Pinctada maxima). Aquaculture 2009, 286, 12–19. [Google Scholar] [CrossRef]
  19. Loukovitis, D.; Ioannidi, B.; Chatziplis, D.; Kotoulas, G.; Magoulas, A.; Tsigenopoulos, C.S. Loss of genetic variation in Greek hatchery populations of the European sea bass (Dicentrarchus labrax L.) as revealed by microsatellite DNA analysis. Mediterr. Mar. Sci. 2015, 16, 197–200. [Google Scholar] [CrossRef] [Green Version]
  20. Xie, J.; Wu, X.; Tang, J.J.; Zhang, J.E.; Luo, S.M.; Chen, X. Conservation of traditional rice varieties in a Globally Important Agricultural Heritage System (GIAHS): Rice-fish coculture. Agric. Sci. China. 2011, 10, 101–105. Available online: http://www.fao.org/giahs/giahs-home/en/ (accessed on 10 March 2022). [CrossRef]
  21. Ren, W.; Hu, L.; Guo, L.; Zhang, J.; Tang, L.; Zhang, E.; Zhang, J.; Luo, S.; Tang, J.; Chen, X. Preservation of the genetic diversity of a local common carp in the agricultural heritage rice–fish system. Proc. Natl. Acad. Sci. USA 2018, 115, E546–E554. [Google Scholar] [CrossRef] [Green Version]
  22. Xie, J.; Hu, L.; Tang, J.; Wu, X.; Li, N.; Yuan, Y.; Yang, H.; Zhang, J.; Luo, S.; Chen, X. Ecological mechanisms underlying the sustainability of the agricultural heritage rice–fish coculture system. Proc. Natl. Acad. Sci. USA 2011, 108, E1381–E1387. [Google Scholar] [CrossRef] [PubMed] [Green Version]
  23. Hedges, L.V.; Gurevitch, J.; Curtis, P.S. The meta-analysis of response ratios in experimental ecology. Ecology 1999, 80, 1150–1156. [Google Scholar] [CrossRef]
  24. Li, Q.; Ling, Q.F.; Wang, L.; Wang, D.P.; Tong, G.J. Study on the morphological differences of four common carp populations. J. Anhui Agric. Sci. 2011, 39, 15404–15405. [Google Scholar]
  25. Crooijmans, R.P.M.A.; Bierbooms, V.A.F.; Komen, J.; VanderPoel, J.J.; Groenen, M.A.M. Microsatellite markers in common carp (Cyprinus carpio L.). Anim. Genet. 1997, 28, 129–134. [Google Scholar] [CrossRef]
  26. David, L.; Rajasekaran, P.; Fang, J.; Hillel, J.; Lavi, U. Polymorphism in ornamental and common carp strains (Cyprinus carpio L.) as revealed by AFLP analysis and a new set of microsatellite markers. Mol. Genet. Genom. 2001, 266, 353–362. [Google Scholar] [CrossRef]
  27. Wei, D.W.; Lou, Y.D.; Sun, X.Y.; Shen, J.B. Screening of microsatellite markers in common carp. Zool. Res. 2001, 223, 238–241. [Google Scholar]
  28. Wang, D.; Liao, X.L.; Cheng, L.; Yu, X.M.; Tong, J.G. Development of novel EST-SSR markers in common carp by data mining from public EST sequences. Aquaculture 2007, 271, 558–574. [Google Scholar] [CrossRef]
  29. Yue, G.H.; Ho, M.Y.; Orban, L.; Komen, J. Microsatellites within genes and ESTs of common carp and their applicability in silver crucian carp. Aquaculture 2004, 234, 85–98. [Google Scholar] [CrossRef]
  30. Oosterhout, C.V.; Hutchinson, W.F.; Wills, D.P.; Shipley, P. MICRO-CHECKER: Software for identifying and correcting genotyping errors in microsatellite data. Mol. Ecol. 2004, 4, 535–538. [Google Scholar] [CrossRef]
  31. Peakall, R.; Smouse, P.E. GenAlEx 65: Genetic analysis in excel population genetic software for teaching and research an update. Bioinformatics 2012, 28, 2537–2539. [Google Scholar] [CrossRef] [Green Version]
  32. Do, C.; Waples, R.S.; Peel, D.; Macbeth, G.; Tillett, B.J.; Ovenden, J.R. NeEstimator v2: Re-implementation of software for the estimation of contemporary effective population size (Ne) from genetic data. Mol. Ecol. Resour. 2014, 14, 209–214. [Google Scholar] [CrossRef] [PubMed]
  33. Luikart, G.; Allendorf, F.; Cornuet, J.; Sherwin, W. Distortion of allele frequency distributions provides a test for recent population bottlenecks. J. Hered. 1998, 89, 238–247. [Google Scholar] [CrossRef] [PubMed]
  34. Piry, S.; Luikart, G.; Cornuet, J.M. Bottleneck: A computer program for detecting recent reductions in the effective population size using allele frequency data. J. Hered. 1999, 90, 502–503. [Google Scholar] [CrossRef]
  35. Luikart, G.; Cornuet, J.M. Empirical evaluation of a test for identifying recently bottlenecked populations from allele frequency data. Conserv. Biol. 1998, 12, 228–237. [Google Scholar] [CrossRef]
  36. Excoffier, L.; Lischer, H.E. Arlequin suite ver 35: A new series of programs to perform population genetics analyses under Linux and Windows. Mol. Ecol. Resour. 2010, 10, 564–567. [Google Scholar] [CrossRef]
  37. Pritchard, J.K.; Stephens, M.; Donnelly, P. Inference of population structure using multilocus genotype data. Genetics 2000, 155, 945–959. [Google Scholar] [CrossRef]
  38. Earl, D.A.; vonHoldt, B.M. STRUCTURE HARVESTER: A website and program for visualizing STRUCTURE output and implementing the Evanno method. Conserv. Genet. Resour. 2012, 4, 359–361. Available online: http://taylor0.biology.ucla.edu/structureHarvester/ (accessed on 27 March 2022). [CrossRef]
  39. Sundqvist, L.; Keenan, K.; Zackrisson, M.; Prodöhl, P.; Kleinhans, D. Directional genetic differentiation and relative migration. Ecol. Evol. 2016, 6, 3461–3475. Available online: https://popgen.shinyapps.io/divMigrate-online/ (accessed on 29 March 2022). [CrossRef] [Green Version]
  40. Oksanen, J.; Kindt, R.; O’Hara, B. Vegan: R functions for vegetation ecologists. Date Access 2005, 15, 2014. [Google Scholar]
  41. Abdelrahman, H.; ElHady, M.; Alcivar-Warren, A.; Allen, S.; Al-Tobasei, R.; Bao, L.; Beck, B.; Blackburn, H.; Bosworth, B.; Buchanan, J.; et al. Aquaculture genomics, genetics and breeding in the United States: Current status, challenges, and priorities for future research. BMC Genom. 2012, 18, 1–23. [Google Scholar]
  42. Reading, B.J.; McGinty, A.S.; Clark, R.W.; Hopper, M.S.; Woods III, L.C.; Baltzegar, D.A. Genomic enablement of temperate bass aquaculture (family Moronidae). In Breeding and Culture of Perch and Bass; Science China Press (Chinese Academy of Sciences): Beijing, China, 2018. [Google Scholar]
  43. Andersen, L.K.; Clark, R.W.; Hopper, M.S.; Hodson, R.G.; Schilling, J.; Daniels, H.V.; Woods, L.C., III; Kovach, A.I.; Berlinsky, D.L.; Kenter, L.W.; et al. Methods of domestic striped bass (Morone saxatilis) spawning that do not require the use of any hormone induction. Aquaculture 2021, 533, 736025. [Google Scholar] [CrossRef]
  44. Gibson, J.; Gamage, S.; Hanotte, O.; Iñiguez, L.; Maillard, J.; Rischkowsky, B.; Semambo, D.; Toll, J.; Gibson, J. Options and Strategies for the Conservation of Farm Animal Genetic Resources: Report of an International Workshop, AGROPOLIS, Montpellier, France, 7–10 November 2005; CGIAR System-Wide Genetic Resources Programme (SGRP)/Bioversity International: Rome, Italy, 2006; Volume 5. [Google Scholar]
  45. Harvey, B. Blue Genes: Sharing and Conserving the World’s Aquatic Biodiversity; Routledge: London, UK, 2013. [Google Scholar]
  46. Norris, A.T.; Bradley, D.G.; Cunningham, E.P. Microsatellite genetic variation between and within farmed and wild Atlantic salmon (Salmo salar) populations. Aquaculture 1999, 180, 247–264. [Google Scholar] [CrossRef]
  47. Machado-Schiaffino, G.; Dopico, E.; Garcia-Vazquez, E. Genetic variation losses in Atlantic salmon stocks created for supportive breeding. Aquaculture 2007, 264, 59–65. [Google Scholar] [CrossRef]
  48. Fazzi-Gomes, P.F.; Aguiar, J.D.P.; Marques, D.; Fonseca Cabral, G.; Moreira, F.C.; Rodrigues, M.D.N.; Silva, C.S.; Hamoy, I.; Santos, S. Novel microsatellite markers used for determining genetic diversity and tracing of wild and farmed populations of the Amazonian giant fish Arapaima gigas. Genes 2021, 12, 1324. [Google Scholar] [CrossRef]
  49. Danzmann, R.G.; Ferguson, M.M.; Allendorf, F.W. Genetic variability and components of fitness in hatchery strains of rainbow trout. J. Fish Biol. 1989, 35, 313–319. [Google Scholar] [CrossRef]
  50. Koehn, R.K.; Diehl, W.J.; Scott, T.M. The different contribution by individual enzymes of glycolysis and protein catabolism to the relationship between heterozygosity and growth rate in the coot clam Milinia lateralis. Genetics 1988, 118, 121–130. [Google Scholar] [CrossRef]
  51. Tiira, K.; Laurila, A.; Peuhkuri, N.; Piironen, J.; Ranta, E.; Primmer, C.R. Aggressiveness is associated with genetic diversity in landlocked salmon (Salmo salar). Mol. Ecol. 2003, 12, 2399–2407. [Google Scholar] [CrossRef]
  52. Ponzoni, R.W.; Nguyen, N.H.; Khaw, H.L.; Ninh, N.H. Accounting for genotype by environment interaction in economic appraisal of genetic improvement programs in common carp Cyprinus carpio. Aquaculture 2008, 285, 47–55. [Google Scholar] [CrossRef]
  53. Ninh, N.H.; Ponzoni, R.W.; Nguyen, N.H.; Woolliams, J.A.; Taggart, J.B.; McAndrew, B.J.; Penman, D.J. A comparison of communal and separate rearing of families in selective breeding of common carp (Cyprinus carpio): Responses to selection. Aquaculture 2013, 408, 152–159. [Google Scholar] [CrossRef]
  54. Gjerde, B. Design of breeding programs. In Selection and Breeding Programs in Aquaculture; Gjedrem, T., Ed.; Springer: Dordrecht, The Netherlands, 2005; pp. 173–195. [Google Scholar]
  55. Loughnan, S.R.; Smith-Keune, C.; Jerry, D.R.; Beheregaray, L.B.; Robinson, N.A. Genetic diversity and relatedness estimates for captive barramundi (Lates calcarifer, Bloch) broodstock informs efforts to form a base population for selective breeding. Aquac. Res. 2016, 47, 3570–3584. [Google Scholar] [CrossRef]
  56. Abebe, A.T.; Kolawole, A.O.; Unachukwu, N.; Chigeza, G.; Gedil, M. Assessment of diversity in tropical soybean (Glycine max (L.) Merr.) varieties and elite breeding lines using single nucleotide polymorphism markers. Plant Genet. Resour. 2021, 19, 20–28. [Google Scholar] [CrossRef]
  57. Ren, W.Z. The Genetic Diversity in Traditional Rice-Fish System. Ph.D. Thesis, Zhejiang University, Hangzhou, China, 2016. [Google Scholar]
  58. Rahman, M.L.; Shahjahan, M.; Ahmed, N. Tilapia farming in Bangladesh: Adaptation to climate change. Sustainability 2021, 13, 7657. [Google Scholar] [CrossRef]
  59. Ji, D.; Su, X.; Yao, J.; Zhang, W.; Wang, R.; Zhang, S. Genetic Diversity and Genetic Differentiation of Populations of Golden-Backed Carp (Cyprinus carpio var. Jinbei) in Traditional Rice Fields in Guizhou, China. Animals 2022, 12, 1377. [Google Scholar] [CrossRef] [PubMed]
  60. Pusadee, T.; Jamjod, S.; Chiang, Y.C.; Rerkasem, B.; Schaal, B.A. Genetic structure and isolation by distance in a landrace of Thai rice. Proc. Natl. Acad. Sci. USA 2009, 106, 13880–13885. [Google Scholar] [CrossRef] [PubMed] [Green Version]
  61. Alvarez, N.; Garine, E.; Khasah, C.; Dounias, E.; Hossaert-McKey, M.; McKey, D. Farmers’ practices, metapopulation dynamics, and conservation of agricultural biodiversity on-farm: A case study of sorghum among the Duupa in sub-sahelian Cameroon. Biol. Conserv. 2005, 121, 533–543. [Google Scholar] [CrossRef] [Green Version]
  62. Leclerc, C.; D’Eeckenbrugge, G.C. Social organization of crop genetic diversity. The G × E × S Interaction Model. Diversity 2011, 4, 1–32. [Google Scholar] [CrossRef] [Green Version]
  63. Labeyrie, V.; Thomas, M.; Muthamia, Z.K.; Leclerc, C. Seed exchange networks, ethnicity, and sorghum diversity. Proc. Natl. Acad. Sci. USA 2016, 113, 98–103. [Google Scholar] [CrossRef] [Green Version]
  64. Delêtre, M.; McKey, D.B.; Hodkinson, T.R. Marriage exchanges, seed exchanges, and the dynamics of manioc diversity. Proc. Natl. Acad. Sci. USA 2011, 108, 18249–18254. [Google Scholar] [CrossRef] [Green Version]
  65. Bashir, M.A.; Liu, J.; Geng, Y.; Wang, H.; Pan, J.; Zhang, D.; Rehim, A.; Aon, M.; Liu, H. Co-culture of rice and aquatic animals: An integrated system to achieve production and environmental sustainability. J. Clean. Prod. 2020, 249, 119310. [Google Scholar] [CrossRef]
Publisher’s Note: MDPI stays neutral with regard to jurisdictional claims in published maps and institutional affiliations.

Article Metrics

Citations

Article Access Statistics

Multiple requests from the same IP address are counted as one view.