Article

Experimental Study on Droplet Characteristics of Rotating Sprinklers with Circular Nozzles and Diffuser

1
Research Center of Fluid Machinery Engineering and Technology, Jiangsu University, Zhenjiang 212000, China
2
New Huaishu River Administration Office of Jiangsu Province, Huai’an 223005, China
*
Author to whom correspondence should be addressed.
Agriculture 2022, 12(7), 987; https://doi.org/10.3390/agriculture12070987
Submission received: 22 May 2022 / Revised: 30 June 2022 / Accepted: 6 July 2022 / Published: 8 July 2022
(This article belongs to the Special Issue Water-Saving Irrigation Technology and Strategies for Crop Production)

Abstract

:
The characteristics of spray droplets are important for calculating the hydraulic performance of sprinklers. In order to evaluate the effects of working pressure and nozzle diameter on the near ground droplet characteristics of the Nelson R33 sprinkler, an experiment was conducted to test the droplet size and velocity by using a two-dimensional video disdrometer (2DVD). Based on the water application rate, droplet diameter and velocity, the kinetic energy was calculated. The results show that there is an exponential positive correlation between the range and the volume-weighted mean particle size of droplets (VMD). The average kinetic energy of a single droplet fits well with the power function model. Under the minimum pressure of 200 kPa, the diameter and kinetic energy of droplets are large, and the peak values are 5.67 mm and 0.0092 J, which are 1.14 to 1.62 times and 1.18 to 5.68 times those of other working conditions, respectively. When the nozzle diameter is the smallest (4.4 mm), the droplet diameter and peak kinetic energy are 1.12 to 1.58 times and 1.02 to 1.26 times higher than 4.8 and 5.2 mm. Therefore, it is not recommended to work under the condition of less than 250 kPa, and a small-diameter nozzle should be selected while ensuring uniform kinetic energy.

1. Introduction

At present, two major challenges facing the world are water scarcity and the energy crisis. The low irrigation water utilization coefficient and the increase in the consumption of industrial water further aggravate the shortage of agricultural water. The sustainable development of agriculture is restricted, especially in arid areas, which account for 42% of the earth’s surface [1]. Considering these challenges, many studies have focused on improving the irrigation water use efficiency by developing modern, efficient and water-saving irrigation technologies.
Sprinkler irrigation is commonly used worldwide in agricultural production due to its water-saving ability, low price, convenient installation, strong adaptability and ability to maintain soil and water balance [2,3,4]. Compared with the traditional surface irrigation, sprinkler irrigation can reduce water consumption by 50% [5]. Sprinkler irrigation also consumes a large amount of energy. Lal et al. [6] estimated that 23% of the on-farm energy use for crop production in the US was for pumping. For example, in California, 19% of the annual power consumption, 30% of the total natural gas consumption and 3.3 billion gallons of diesel oil were used for pump pressurization [7]. Therefore, reducing the operating pressure of an irrigation system while maintaining high irrigation quality is an important way to save water and energy to increase production.
The common way to reduce energy consumption is to reduce the working pressure of a sprinkler system. Based on the findings of the current studies, however, it is inevitable that decreasing the working pressure will decrease the degree of jet flow breakup, further aggravating the nonuniform distribution of applied water. In order to solve the problem, many studies have been conducted to improve the hydraulic performance by optimizing the sprinkler structure. Wang et al. [8] designed nine kinds of sub-nozzles for impact sprinklers with different elevation angles and positions to obtain the best structural parameters according to water distribution near the sprinkler. Zhang et al. [9] improved the flow channel structure of a Nelson D3000 sprinkler and obtained the optimal number of flow channels and exit angles through experiments. Solomon et al. [10] confirmed that the performance of the rotating sprinkler with multiple flow channels is better than the scattering sprinkler with the same range, and the water conservation performance is better. Meanwhile, many irrigation equipment manufacturers such as Nelson and Senninger have committed to developing low-pressure sprinklers, including Quad-Spray sprinklers, rotating sprinklers and pivot sprinklers, among others [11,12].
The core component for realizing low-pressure irrigation is the sprinkler [13]. Another way to avoid low irrigation uniformity problem is to use a diffuser to enhance the jet breakup in addition to the natural motion dispersion to obtain a uniform water application rate. The design concept uses a diffuser to disperse the jet more evenly. The main jet dispersion can be divided into motion dispersion and disturbance dispersion. When the sprinkler operates at a low pressure, the flow rate decreases. In addition to the motion dispersion of the water flow, the uniformity should be ensured by dispersing the jet with the help of the diffuser. Issaka et al. [14] studied the effects of different forms of diffusers on jet breaking through the combination of high-speed photography experiments and computational fluid dynamics simulations to obtain better structural parameters. Chen et al. [15] determined the spray characteristics of a low-pressure rotating non-circular sprinkler with a diffuser. However, commercially available low-pressure rotating sprinklers with diffusers are scare. The hydraulic performance of such types of sprinklers remains to be studied.
Distributions of droplet diameter and velocity are closely related to the water application rate, uniformity, atomization degree, utilization coefficient, kinetic energy, soil structure, runoff and other parameters, which means the droplet characteristics determine the hydraulic performance of sprinklers; this has been emphasized by many studies. Bautista et al. [16] proposed an optical particle tracking velocimetry technology to determine the droplets’ velocity, diameter and angle and compared the effects of different experimental schemes on the distribution of droplet diameter. Kincaid et al. [17] and Montero et al. [18] proposed the upper limit lognormal distribution and exponential function model of droplet diameter distribution. Liu et al. [19] used a laser precipitation monitor to test the complete fluidic sprinkler and obtained the distribution of droplet diameter, frequency and other parameters. Zhang et al. [20] studied the volume, energy distribution and diffusion of the Nelson R3000 sprinkler under different pressures and considered that the diameter and kinetic energy of droplets are related to the droplet velocity and the form of water application rate. A large number of studies indicate that (1) the average diameter of droplets gradually increased along the radial direction; (2) when the sprinkler operated under low pressure, the range was shortened, the droplet diameter increased, and the volume spray near the sprinkler decreased; and (3) the distribution of droplet diameter was related to the sprinkler structure. The abovementioned studies are confined to complete fluidic sprinklers and pivot sprinklers without a diffuser. Since the diffuser may improve the hydraulic performance by enhancing the breakup of the main jet flow, the droplet characteristics are especially important for the design of such rotating sprinklers. Regretfully, the related research is rarely reported. The understanding of characteristics of spraying droplets not only helps to avoid uneven distribution of kinetic energy under low working pressure conditions but may also propose an appropriate pressure range to reduce energy waste.
Therefore, the objective of this paper is to determine and comprehensively evaluate the droplet characteristics of a rotating sprinkler with a diffuser under low pressure, including droplet diameter and velocity. The experiments were conducted under different pressure conditions using a two-dimensional video disdrometer (2DVD) with a no-wind condition in order to determine whether characteristics will be affected by different factors, especially working pressure and nozzle size. The equation for calculating the kinetic energy intensity of the sprinkler is proposed, which provides a reference for further research on the droplet-breaking mechanism and the numerical simulation of the external flow field and also helps to achieve the best economic benefits.

2. Materials and Methods
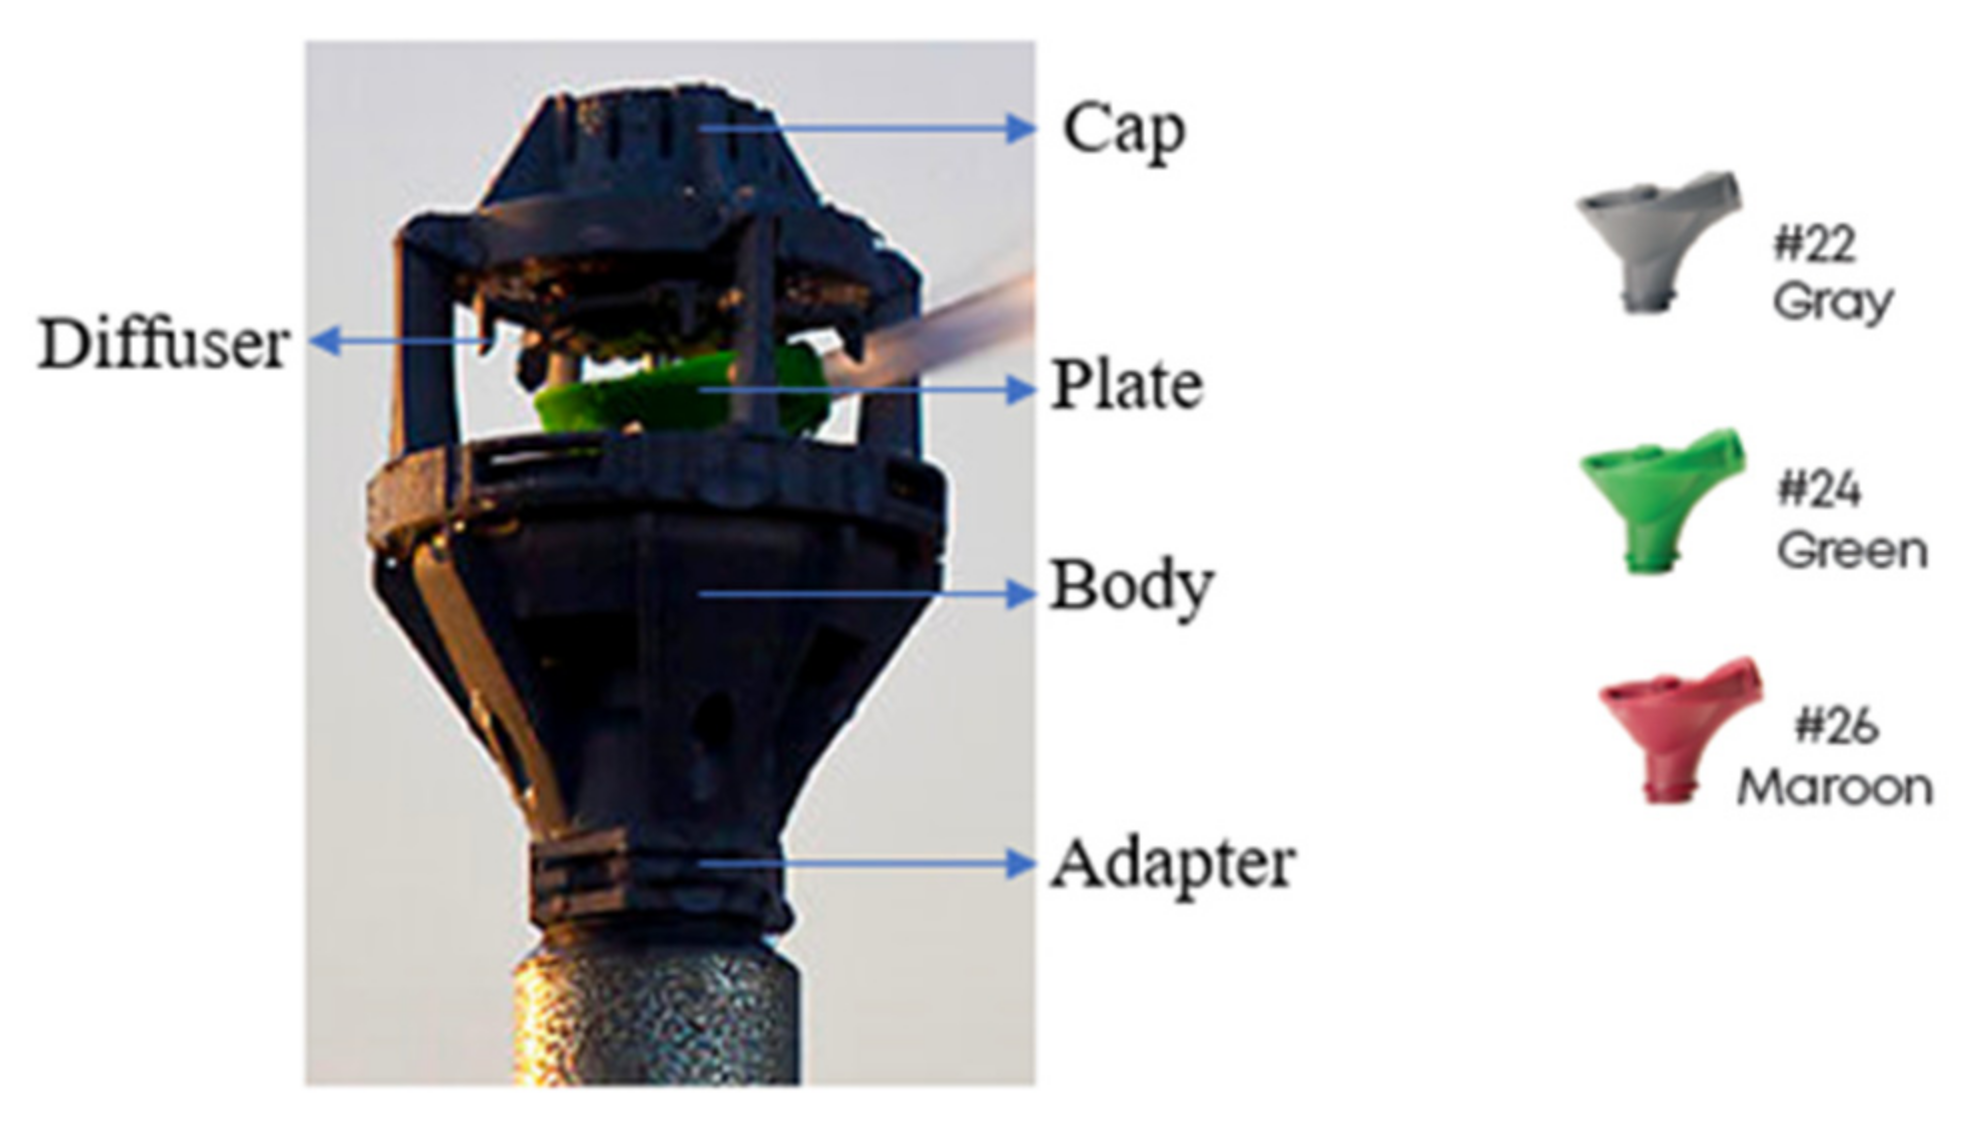
2.1. Sprinkler

The Nelson R33 sprinkler (manufactured by Nelson Irrigation Co., Walla Walla, WA, USA) used in this study is shown in Figure 1. Its main components include a diffuser, spray plate, nozzle, body and adapter. Three sizes of nozzles with diameters of 4.4, 4.8 and 5.2 mm correspond to the manufacturer’s nozzle reference numbers #22, #24 and #26. The working pressures were 200, 250, 300, 350 and 400 kPa during the droplet size and velocity test.

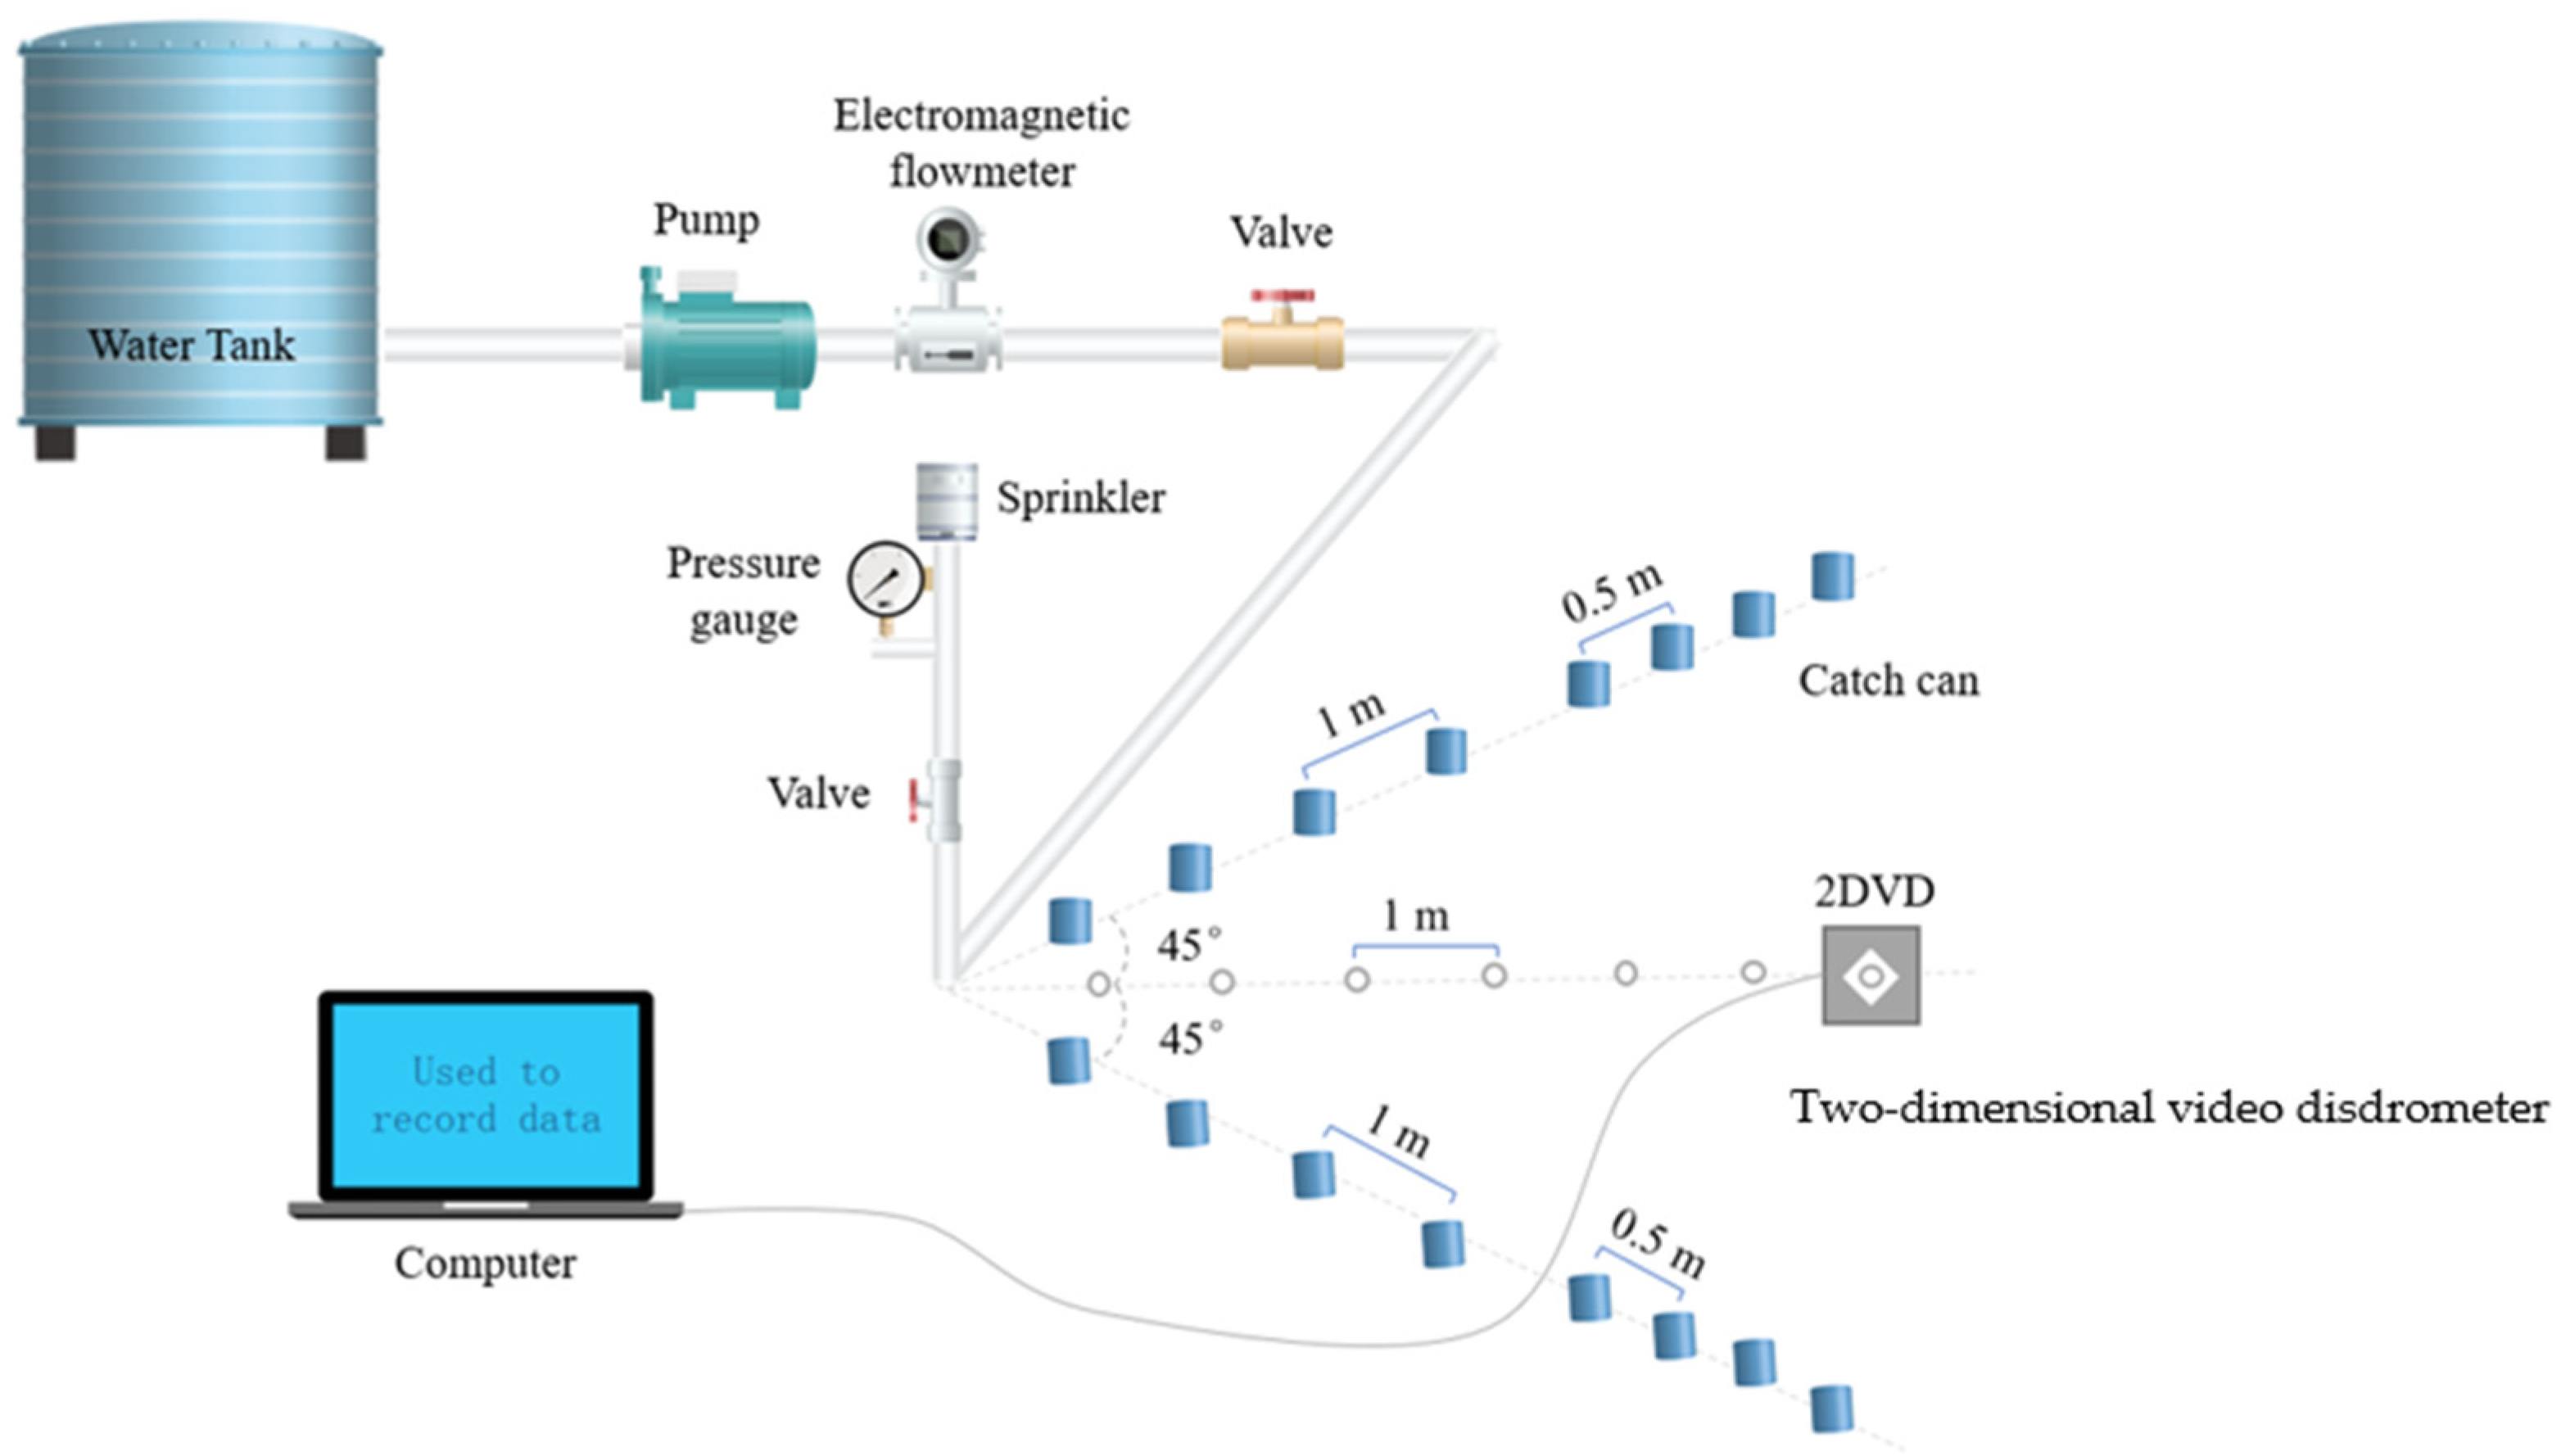
2.2. Experimental Setup and Procedure

The test equipment included a Nelson R33 sprinkler, pipeline system, pump unit, 2DVD (Joanneum Research Co., Graz, Styria, Austria), etc. The experimental layout is shown in Figure 2. The water reservoir with a constant water level was used to supply water to the sprinkler after being pressurized by the frequency conversion pump (5 m3 h−1, 580 kPa, NB-40, Grundfos Co., Ltd., Shanghai, China). The sprinkler discharge flow rate was measured by a level 0.5 electromagnetic flowmeter (LD-50, Shengjie Co., Ltd., Hefei, China). The installation height of the sprinkler was 1.5 m. A pressure gauge (range 0–600 kPa, accuracy 0.4%) and a valve were installed 0.1 m below the sprinkler to control the pressure. The experimental device was in accordance with ASAE S398.1 (ASAE standard, 1985) and ISO 15886-3 (2016) standard design.
As droplets passed through the test area, the widths of their shadows were scanned and recorded by the photodetector of the line-scan cameras. The shadow widths were used to reconstruct each droplet’s shape in two dimensions. In this experiment, the 2DVD was used to measure the droplet size, angle and velocity of droplets near the surface [21]. Ge et al. [22] and Chen et al. [23] have also explained the use of the 2DVD technology.
The experiment was conducted at the Irrigation Laboratory of the Fluid Machinery Engineering and Technology Research Center (Jiangsu University, Zhenjiang, China). The indoor temperature was 20 °C. 2DVD was used to measure the radial droplets data to replace the full wetting area. The working pressure was set at five levels of 200, 250, 300, 350 and 400 kPa. Within the whole wetting radius, 2DVD was used to measure the diameter, velocity and quantity of droplets at a spacing of 1 m. The measurement time at each position was more than 5 min, and no less than 5000 droplets were collected. The catch cans for determining the radial water application rate were placed along the two radius directions, with the sprinkler as the center, with an angle of 90°. When catch cans were closed to the sprinkler, the interval was 1 m. The cans were plastic rain gauges with an opening diameter of 20 cm and a height of 54 cm. Obvious changes of droplet characteristics usually occur at the edge of the wet area. When the distance increased to 8 m, the interval between the catch cans decreased to 0.5 m in order to improve the measurement accuracy. The water depth measured by each catch can was recorded after each test. The radial water application rate was taken as the average value of the two radial depth data.

2.3. Data Analysis

2.3.1. Droplet Diameter and Velocity

The pressurized water flow was ejected from the spray plate, nozzle and diffuser. The jet was aerated and collided in the air to break into irregular droplets. Within the spraying range, the droplet diameter varied greatly at the same position. Therefore, the volume-weighted mean particle size of droplets (VMD) was used to represent the original diameter. Three common methods for calculating the average diameter of droplets were arithmetic mean diameter, volumetric mean diameter and number median diameter. Salvador et al. [24] and Ge et al. [22] analyzed the three methods and found that the variation of droplet diameter calculated by VMD much closer to the actual situation. Equation (1) was used to calculate the VMD of the sampling point according to the measured droplet diameter [25]. The vertical velocity vt of a single droplet and two perpendicular horizontal velocities vh1 and vh2 can be measured through 2DVD, and the combined velocity v can be calculated by Equation (2).
D v = i = 1 n d i 4 i = 1 n d i 3
v = v t 2 + v h 1 2 + v h 2 2
where Dv is the VMD value (mm), di is the diameter of the i-th droplet (mm), and i is the serial number of the diameter.
The volume frequency of droplets is the percentage of the weight of droplets with a certain diameter in the total sprayed water weight at the measuring point. Equations (3) and (4) are as follows:
W i = n i ρ ω π d i 3 6
p i = W i i = 1 n W i
where W i is the droplet weight corresponding to diameter di (kg), and ρ ω   is the mass density of water (kg m−3).

2.3.2. Kinetic Energy

The kinetic energy ( E s d ) of each droplet was calculated using Equation (5). Equation (6) was used to calculate the kinetic energy per unit sprinkler discharge ( K E d i ), at the i-th radial position, representing the average kinetic energy per liter of droplets falling at the position [26].
E s d = 1 12 π ρ ω d 3 v d 2
K E d i = j = 1 N d i E s d 1000 j = 1 N d i π d j 3 6
where Esd is the kinetic energy of the single droplet (J), d is the droplet diameter (m), v d is the velocity of the droplet with a diameter of d m (m s−1), N d i   is the number of droplets measured at the i-th radial location, and d j is the measured diameter of the j-th droplet (m).
The specific power ( S P i , W m−2) at the i-th radial position was calculated using Equation (7) [27].
S P i = K E d i × A R i 3600
where A R i is the application rate associated with the i-th radial location (mm h−1). Specific power (SP) represents the rate at which kinetic energy is transferred to the surface.

2.3.3. Irrigation Uniformity

The irrigation uniformity affects crop yield and is crucial for the design of sprinkler irrigation systems. Based on the water application patterns of a single sprinkler, the irrigation uniformity of four adjacent sprinklers with different combined spacing was predicted by simulating the water overlap on the spraying profile. The simulation was based on the cubic-spline interpolation method, which was explained by Chen et al. [23]. The Christiansen uniformity coefficient (CU) was used to evaluate the combined sprinkler irrigation uniformity.
C U = 100 1 j = 1 n A R c , i A R c ¯ j = 0 n A R c , i
where CU is the Christiansen uniformity coefficient, A R c , i is the overlapping rate associated with the i-th location in the square area (mm h−1), and A R c ¯ is the average water application rate of A R c , i (mm h−1).

2.3.4. Performance Function

The performance of the proposed empirical equation for predicting various variables was evaluated using root mean square error (RMSE), as shown in Equation (9):
R S M E = 1 n i = 1 n ( y m e a , i y c a l , i ) 2
where n is the measurement time, y m e a , i   is the VMD through measurement (mm), and y c a l , i is the VMD through the calculation (mm).

3. Results and Discussion

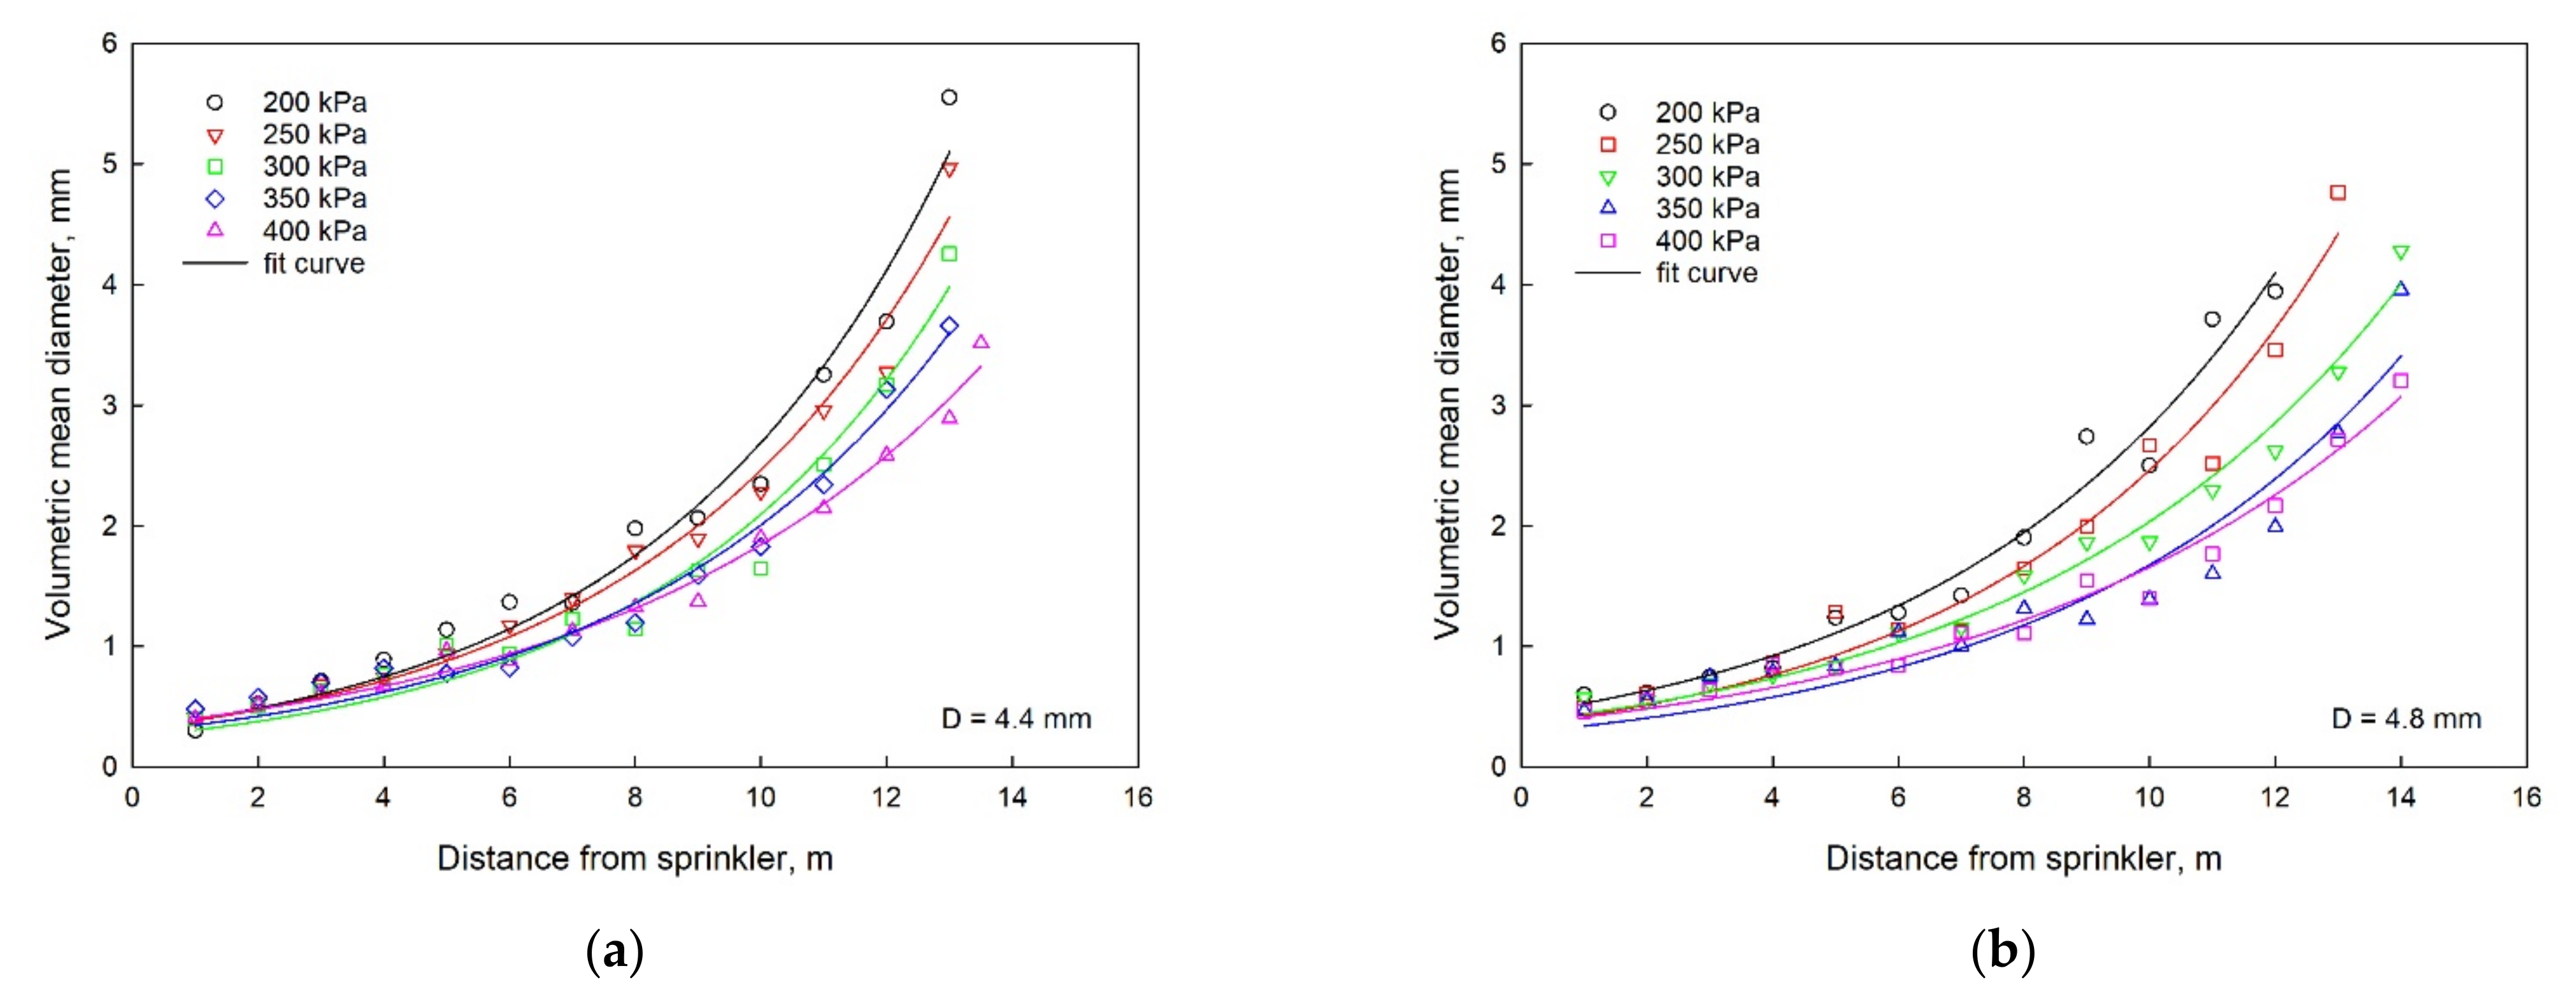
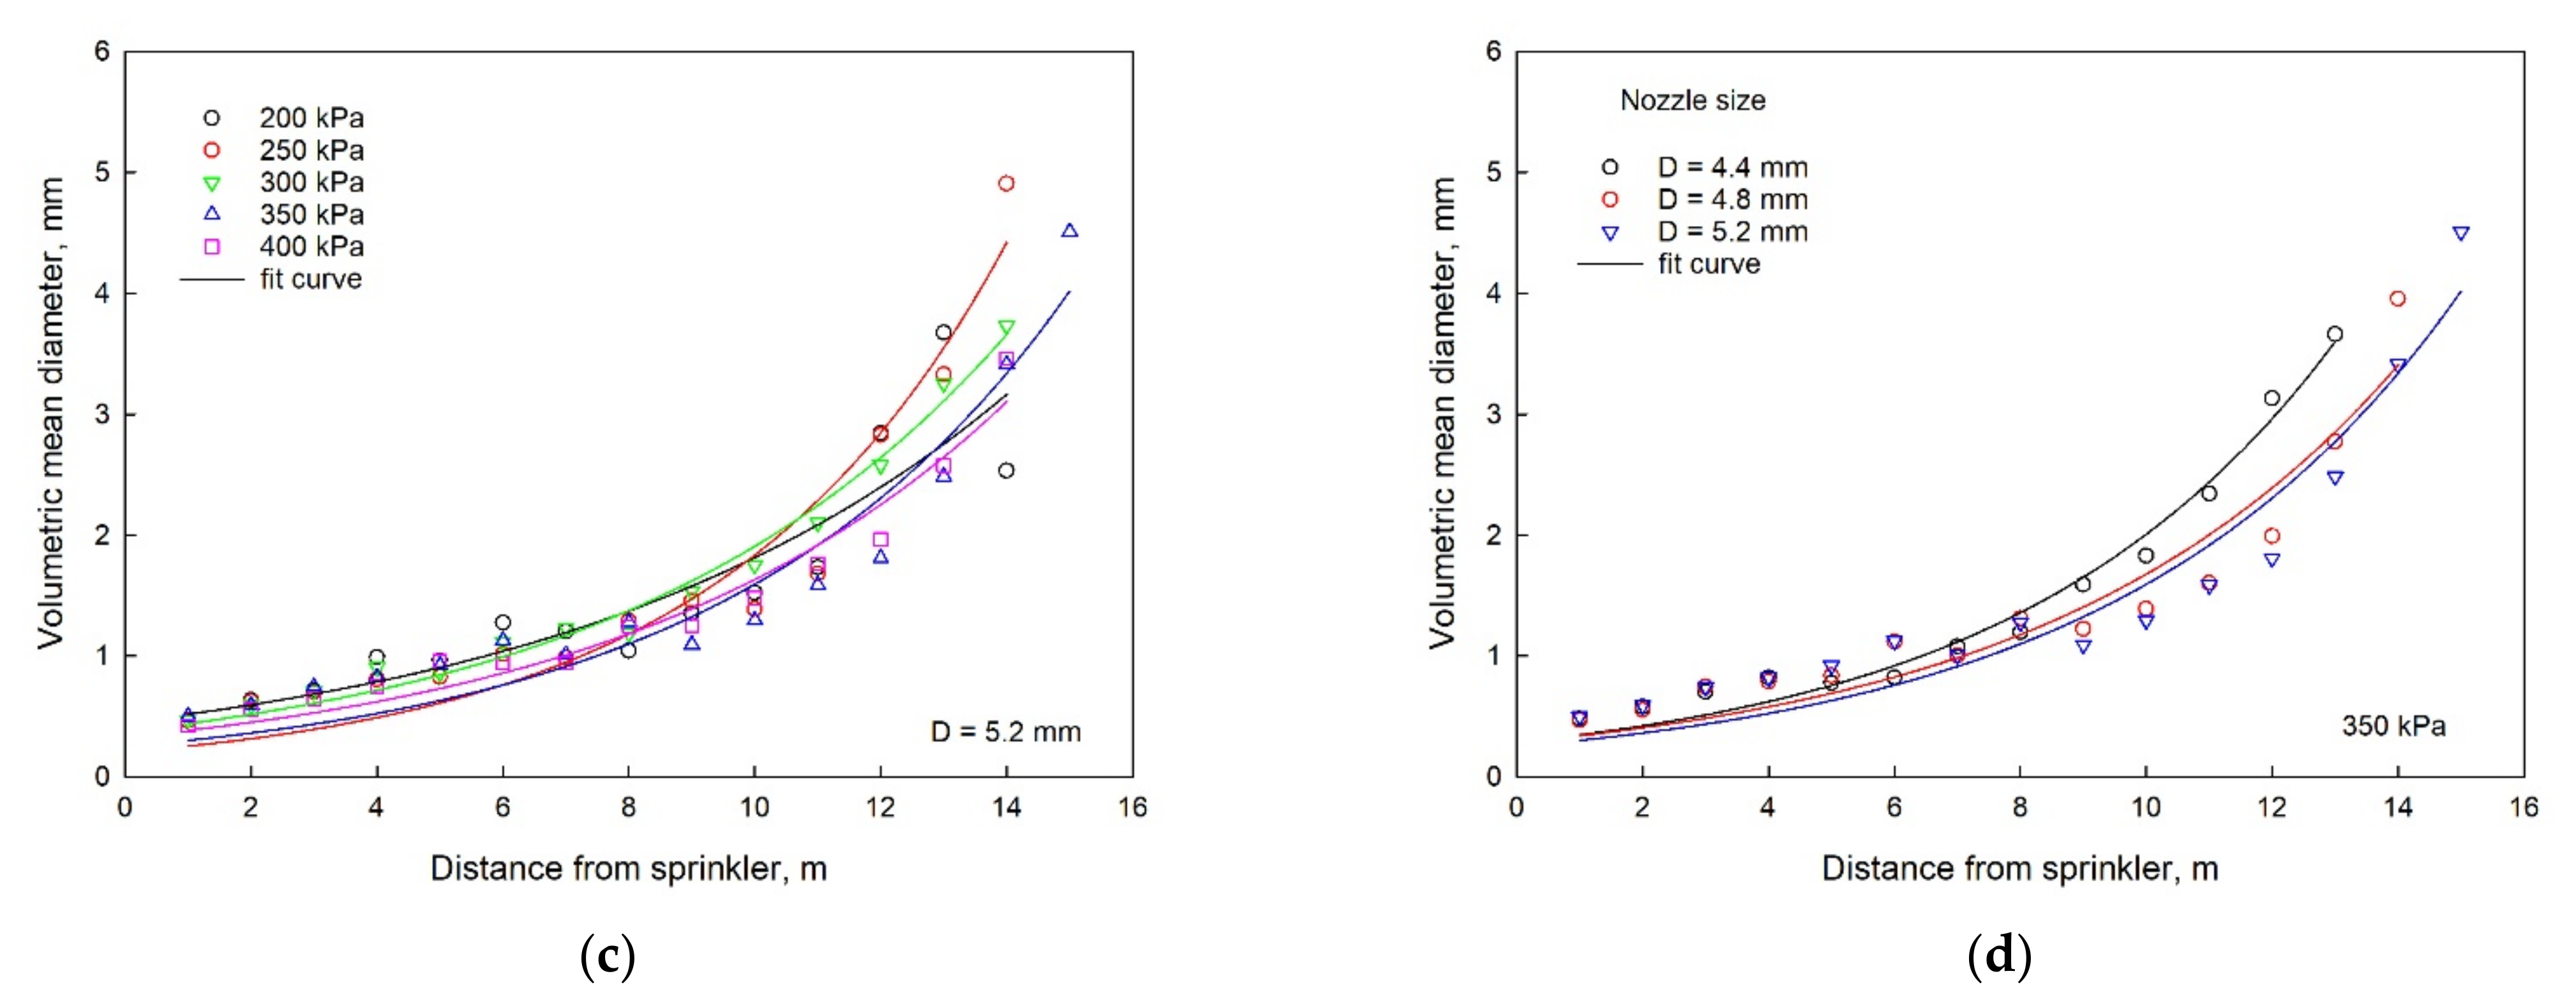
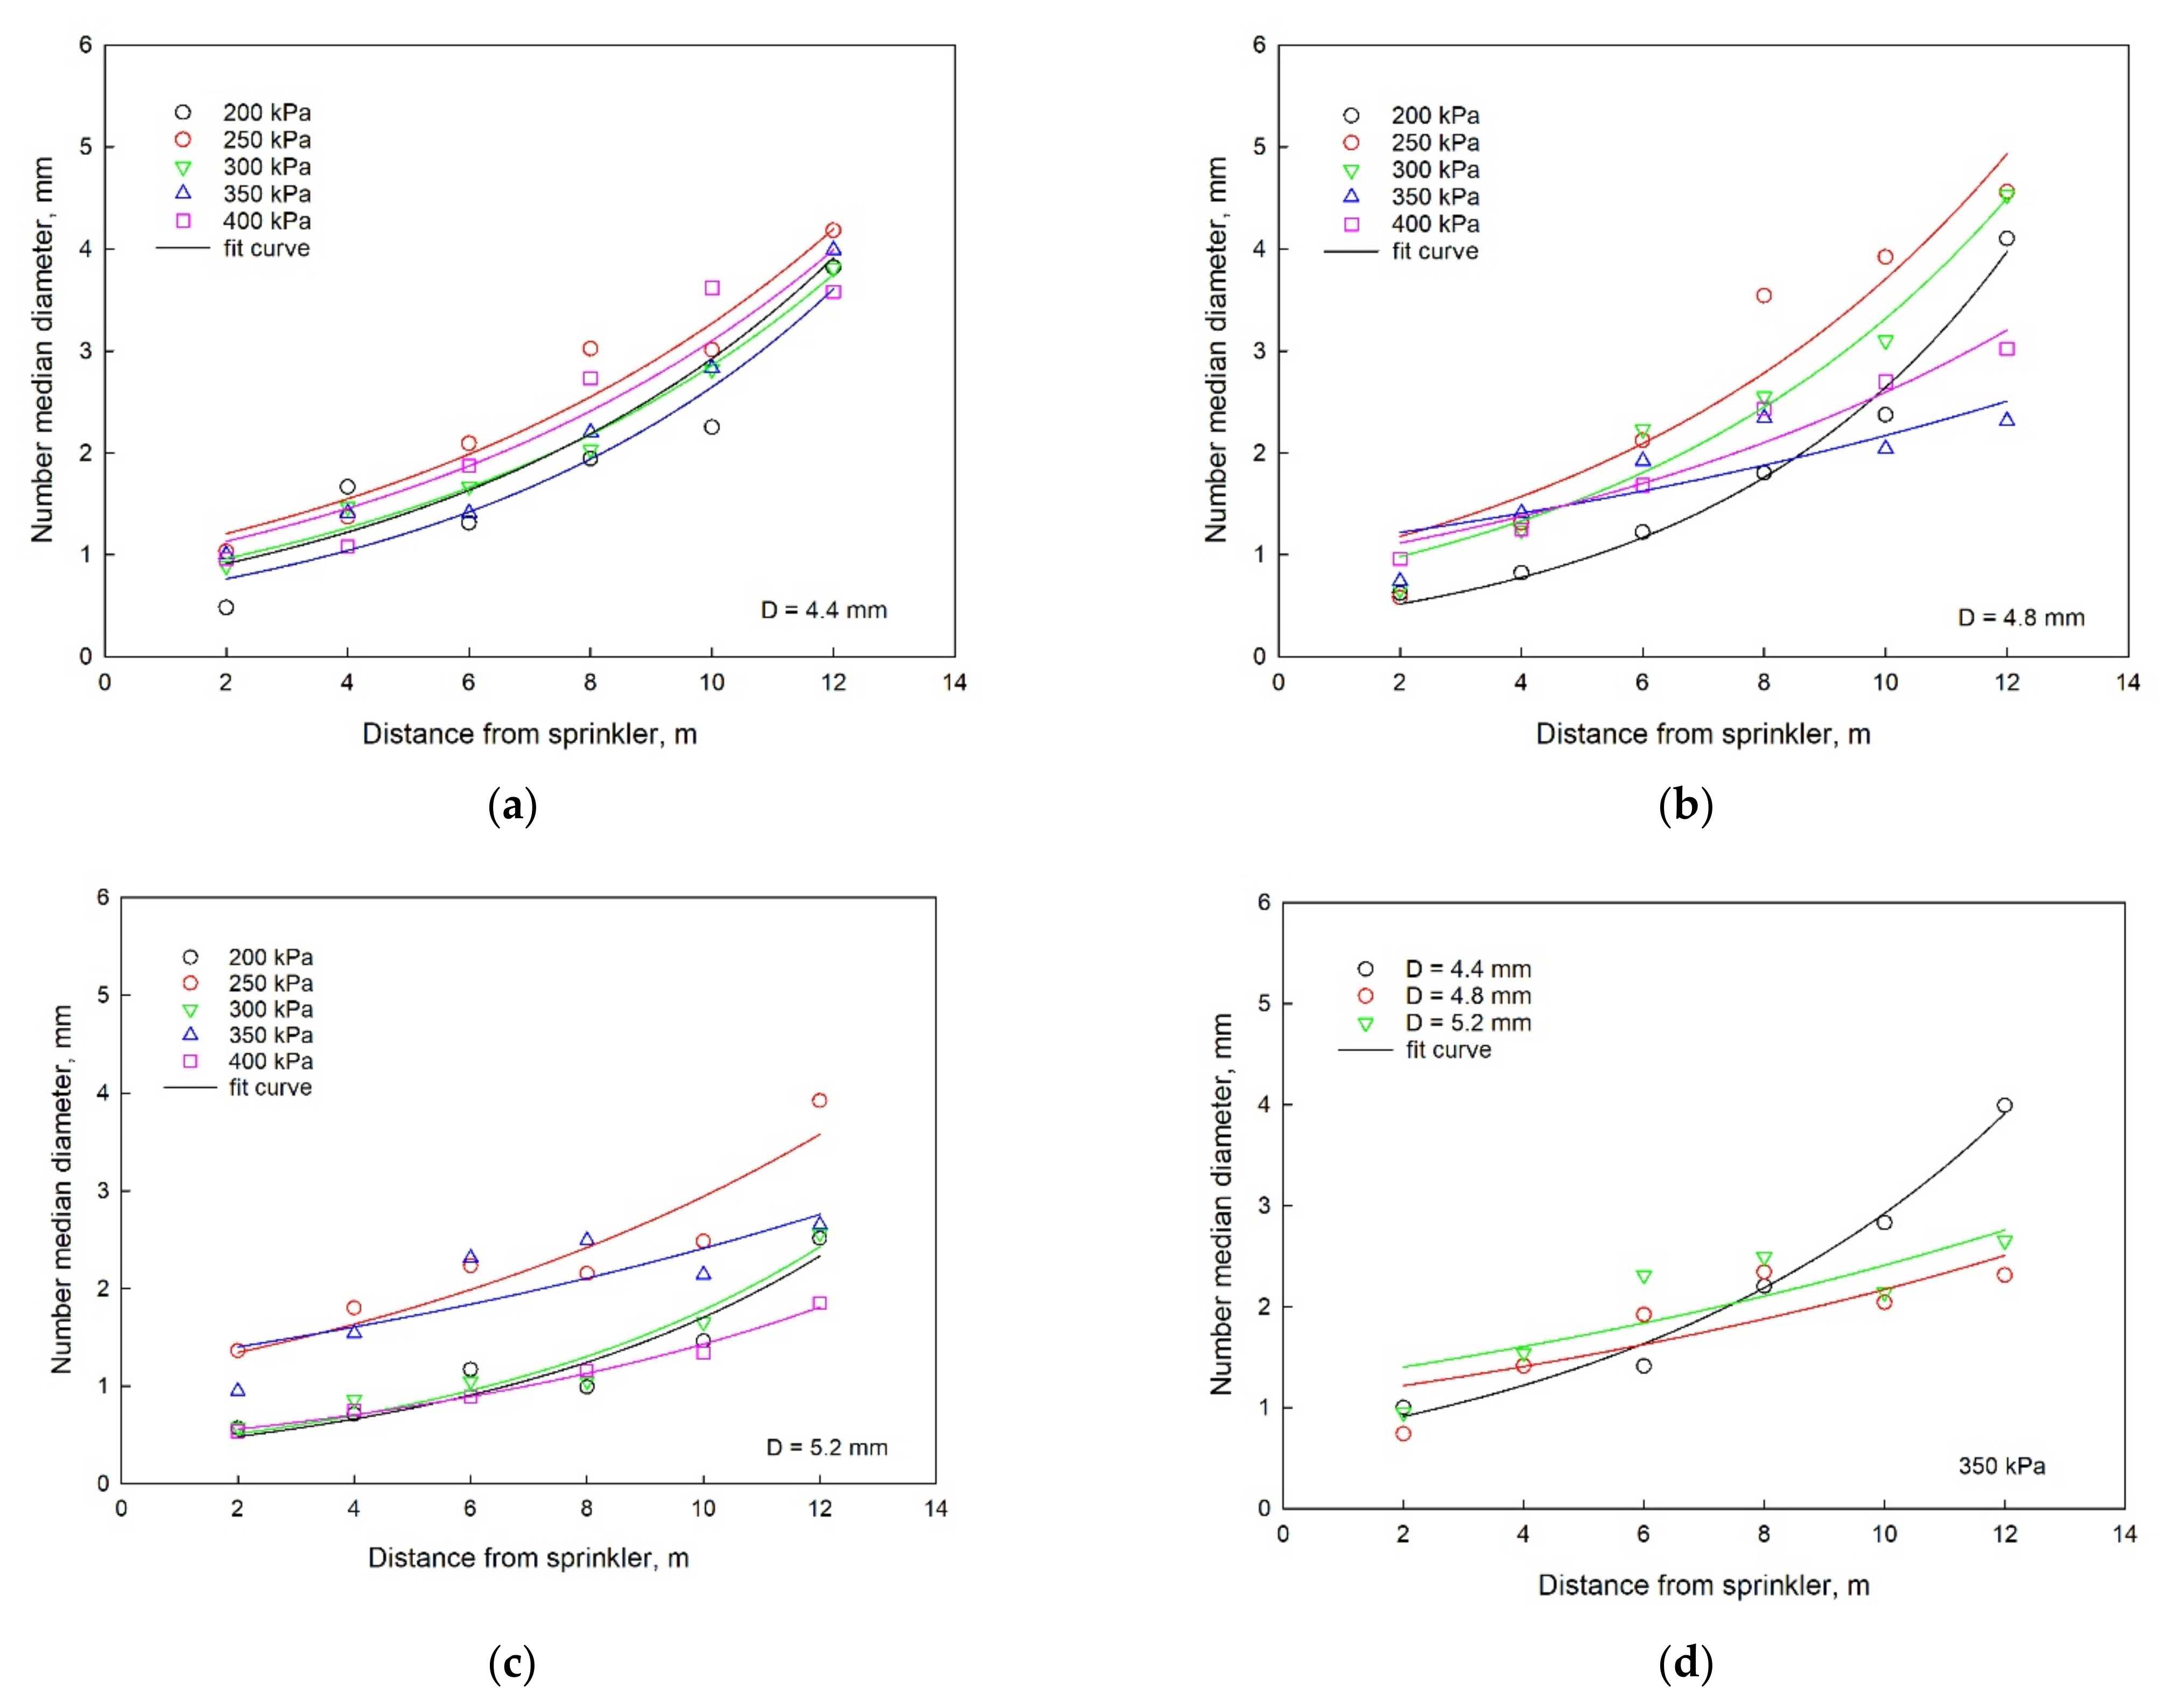
3.1. Droplet Size Distribution

The distribution of droplet diameter is usually affected by the nozzle size, working pressure, installation height and other factors. Generally, as the distance of the sprinkler increased, the droplet size also increased and reached the maximum at the farthest point. Figure 3 shows the relationship between the VMD and the distance from the sprinkler with working pressures of 200, 250, 300, 350 and 400 kPa.
As shown in Figure 3a through Figure 3c, the VMD had an exponential positive correlation with the distance from sprinkler for the different working pressures and nozzle sizes. The effect of pressure on the VMD was small for distances of up to 8 m but increased with the distances beyond 8 m. For example, when the nozzle diameter was 4.8 mm and at distances of 7 and 12 m from the sprinkler, the VMD with the pressure of 400 kPa decreased by 21.97% and 45.04% when compared with the pressure of 200 kPa. Figure 3d shows the relationship between nozzle size and the VMD values under 350 kPa. The VMD decreased slightly with the increase of nozzle diameter.
Taking the nozzle diameter, working pressure and distance from the sprinkler as variables, the empirical equation for calculating the VMD was obtained and is presented below:
D v = 0.399 + 1.221 D 1.975 H 0.724 e 0.24 x
where Dv is the VMD value (mm), D is the nozzle size (mm), H is the working pressure (MPa), and x is the distance from the sprinkler (m). The accuracy between the measured and calculated VMD values was evaluated using Equation (9). The RMSE value was 0.307, and the R2 was 0.9104, indicating that the VMD observed value was in good agreement with the estimated value.
The number median diameter (NMD) refers to the corresponding droplet diameter when the total cumulative volume frequency of droplets reaches 50%; this value was used in previous studies to estimate the average diameter of droplets in addition to VMD [19]. Figure 4a through Figure 4c shows the relationship between NMD and distance from the sprinkler under five different working pressures. Generally, NMD was positively correlated with the distance from the sprinkler, which was consistent with the trend of VMD. For nozzle sizes of 4.8 and 5.2 mm (Figure 4b,c), the increase of NMD with the increase of distance was small under pressures of 350 and 400 kPa when compared with the other pressures. Since the NMD is affected not only by the droplet diameter but also by the number of droplets, the relationship between the pressure and NMD was not identical for different nozzles. The increase of pressure could result in the increase or decrease of NMD, which was different from that of VMD. One possible explanation was that, although higher pressure enhanced the breakup of a jet flow and resulted in a higher number of small droplets, the cumulative volume of small droplets was still small, which could not dominate the total cumulative volume. Figure 4d shows the relationship between nozzle size and NMD value at 350 kPa. The difference of NMD between nozzle sizes of 4.8 and 5.2 mm was small for each location. The variation of NMD for 4.4 mm was much higher than that of 4.8 and 5.2 mm, which was also in agreement with the trend of VMD.

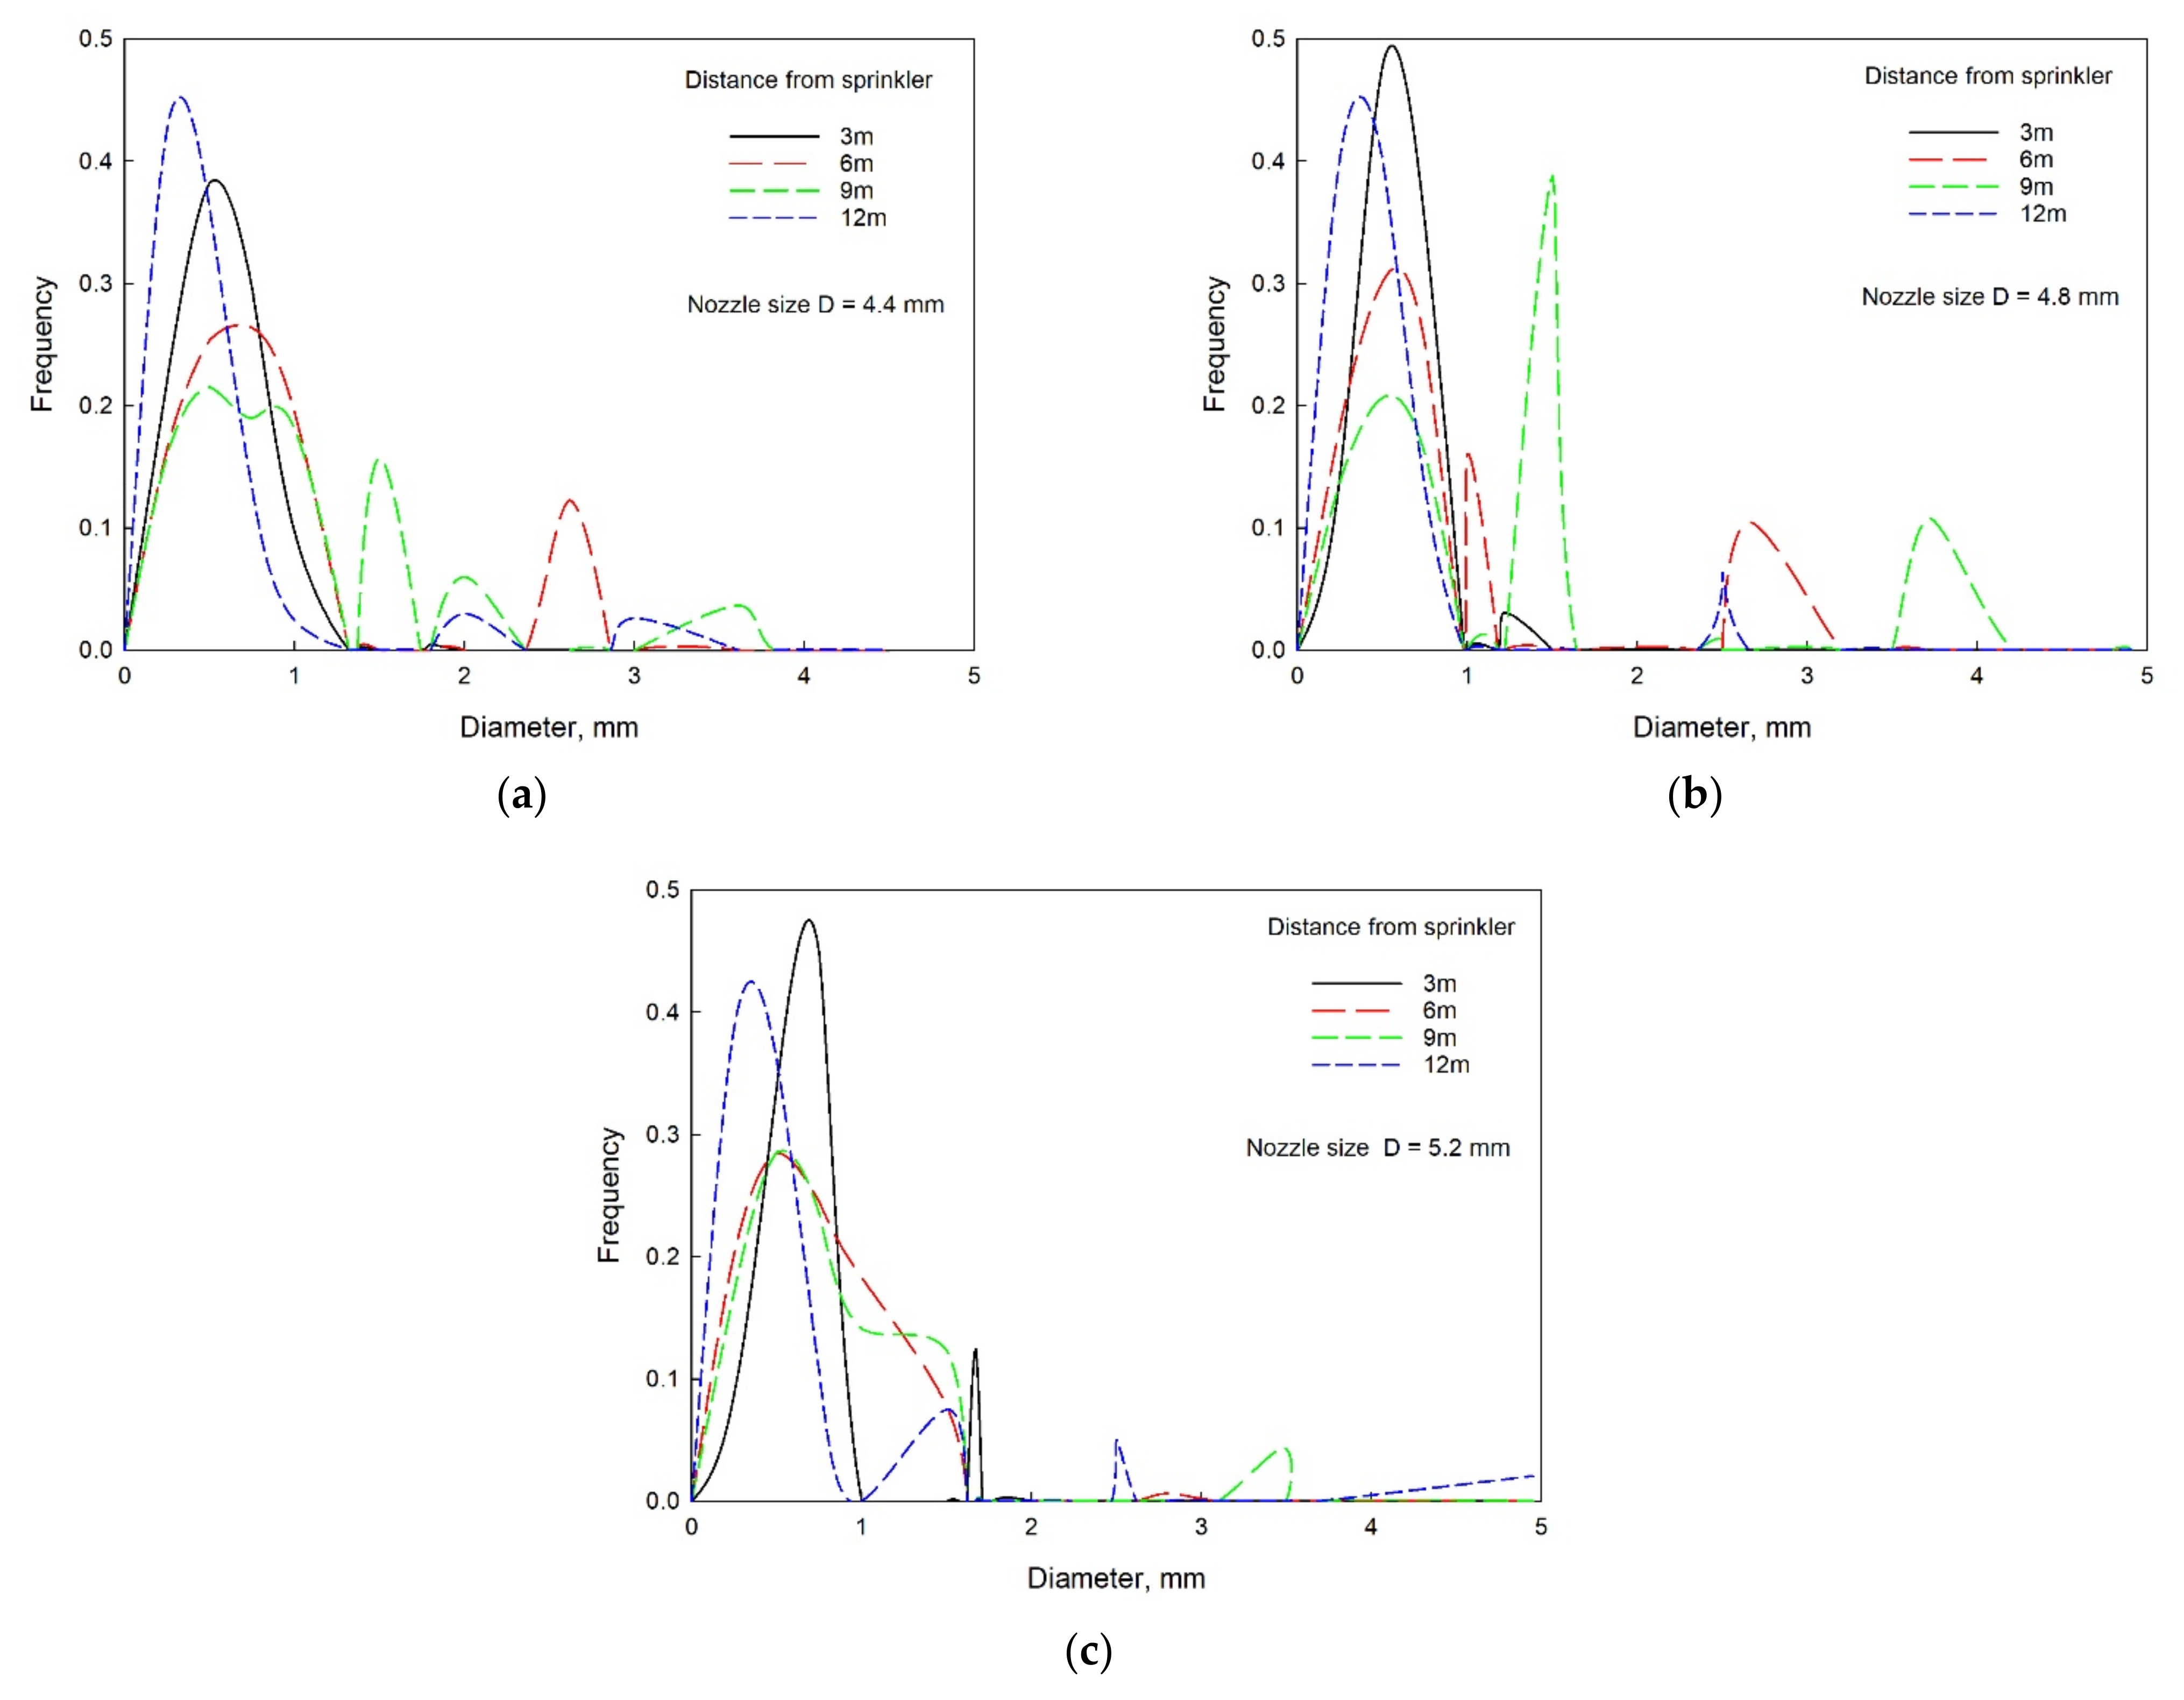
3.2. Droplet Frequency Distribution

3.2.1. Frequency Distribution of Droplets under Different Pressures

The quantity frequency of different droplet diameters at a given distance from the sprinkler are presented in Figure 5 when the nozzle size is 5.2 mm for the five different pressure conditions. Since the number of small-diameter droplets was relatively large, the diameter division interval with a diameter less than 1 mm was set as 0.25 mm, while the interval of diameter greater than 1 mm was 0.5 mm.
Yan et al. [28] proposed that large-diameter spraying droplets will increase the destruction of the soil surface structure, which is not conducive to soil and water conservation and crop growth. Wu et al. [29] found that the appropriate spray droplet diameter range should be maintained between 1 and 3 mm. Taking the #26 nozzle as an example, under five pressure levels, the average percentage of droplets with a diameter of 1 to 3 mm in the whole spraying area was 99.37%, 99.12%, 98.18%, 98.23% and 97.93%, respectively. It is clear that with the increase of pressure, the number of large-diameter droplets increases slightly, making the proportion of appropriate diameter droplets decrease slightly. In order to determine the influence of working pressure on droplet quantity frequency distribution, the droplet diameter under each working pressure was evaluated by one-way analysis of variance (ANOVA) at the significance level of 5%, and the calculation result p was 1.0. The result showed that the impact of working pressure on quantity frequency distribution was not significant.
At different positions from the sprinkler, the variation of droplet quantity frequency was more obvious. When the distance was between 1 and 5 m or more than 12 m, the diameter was distributed within 0 to 1 mm. When the diameter was more than 1.5 mm, the distance was almost between 6 and 12 m. The distance was divided into four sections: front, middle front, middle rear and rear. Within the wetting range formed by one-time sprinkler irrigation, the frequency of small-diameter droplets in the front, middle front and rear sections was high, while there were more large-diameter droplets in the middle and middle rear section of the range.

3.2.2. Frequency Distribution of Droplets with Different Nozzle Sizes

As shown in Figure 6, the distribution of droplet diameter at the distances of 3 and 12 m was broadly similar. Most of the droplets were concentrated between 0 and 1 mm. The diameter at the distance of 12 m was much smaller than at 3 m. This is because larger droplets are more likely to break, resulting in an increase in the spray distance of small droplets generated after fragmentation, which was proved by the small-diameter droplets observed at the end of the wetted radius. For droplets that landed at 6 and 9 m, the proportion of small-diameter droplets (0–1 mm) was dramatically lower than the former two. For the droplets landing at 6 m, the diameters were concentrated between 2 and 3 mm. Similarly, the diameter of droplets landing at 9 m was mostly concentrated between 1 and 2 mm. This phenomenon shows that the droplets in the middle of the range do not undergo secondary breaking but only passively crush through the sprinkler’s own diffuser. This process will reduce the velocity of droplets so that they can only fall in the middle of the range.
It can be observed that under the same pressure of 250 kPa, the quantity frequency of the nozzle size of 5.2 mm was better than 4.4 and 4.8 mm; that is, more than 92% of the droplets were concentrated in the diameter range of 0 to 2 mm. Therefore, when the pressure is the same, it is better to choose the sprinkler with the larger nozzle size whenever possible.

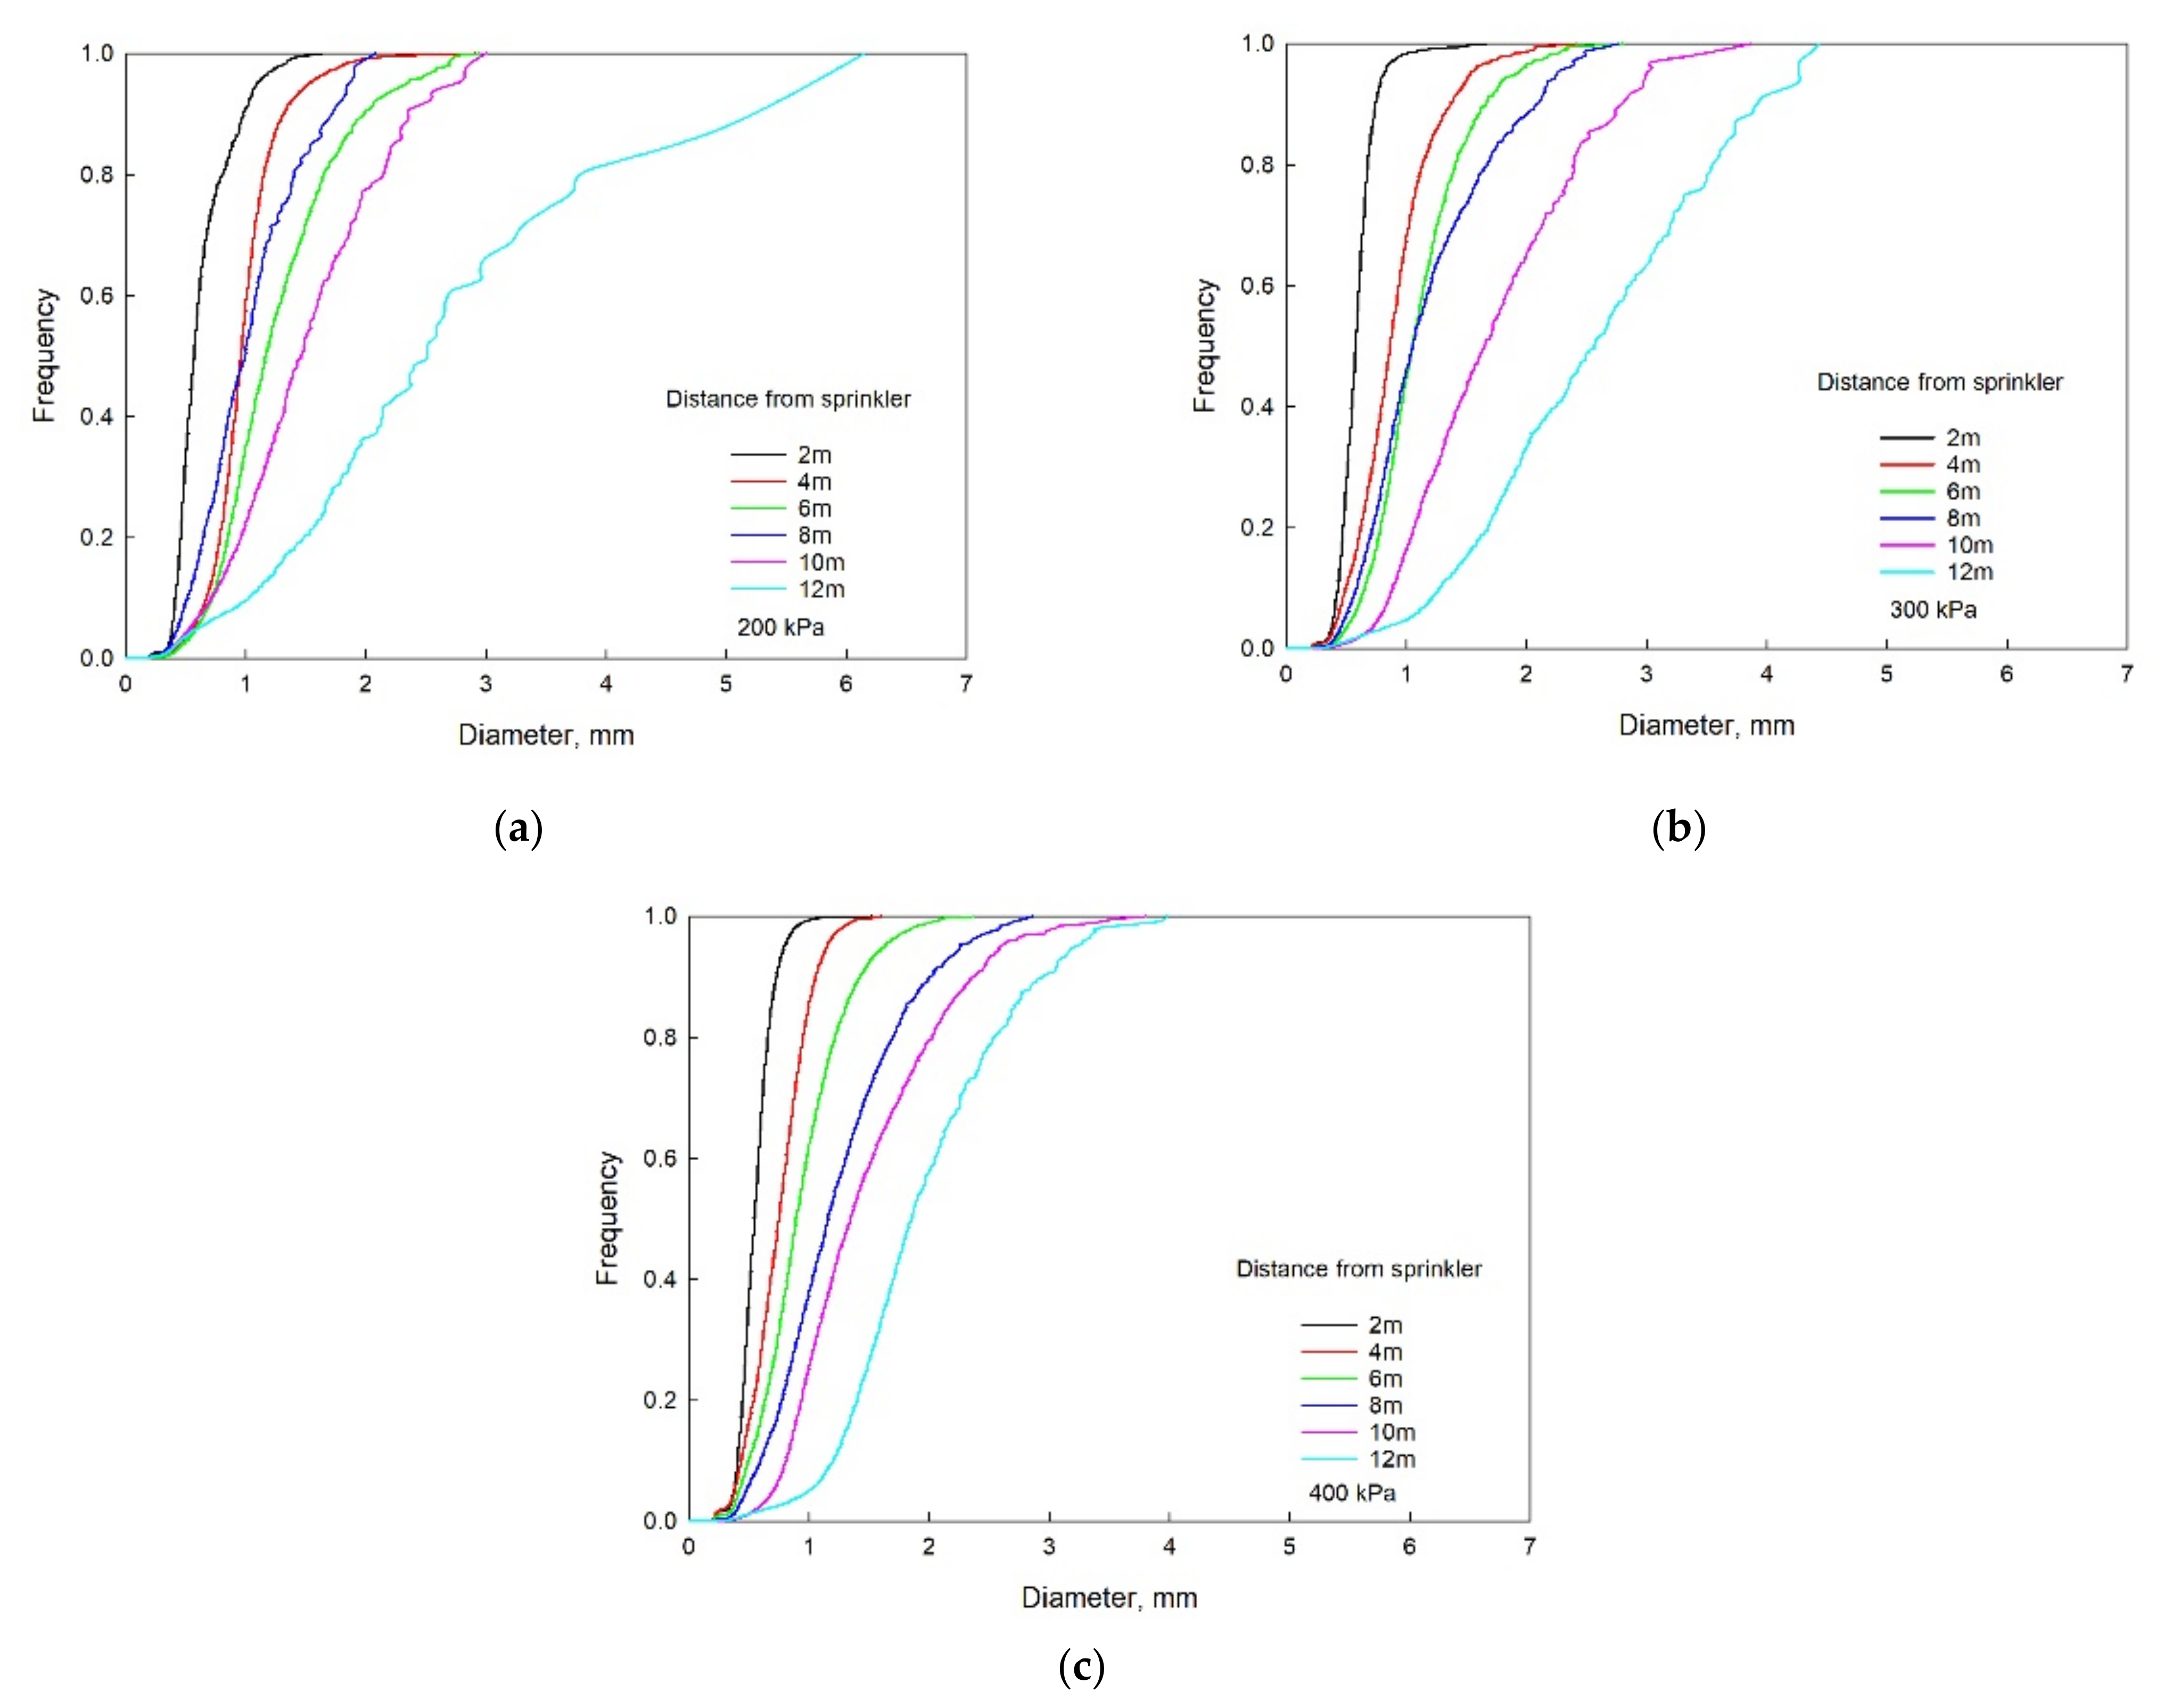
3.3. Droplet Cumulative Volume Distribution

The cumulative frequency of droplet volume refers to the cumulative value of the proportion of the volume less than a certain droplet diameter in the total volume of sprayed droplets, which can clearly reflect the volume distribution of droplets at different positions. Taking the nozzle size of 5.2 mm for example, the cumulative curve of volume frequency distribution of droplet diameter at different distances from the sprinkler under each working pressure is shown in Figure 7.
The pressure had a great influence on the cumulative curve. With the increase of pressure, the difference between the slope of the curve at each measuring point became smaller. Taking the frequency of 0.5 as an example, the abscissa difference of the curve under the three pressures was 1.98, 1.94 and 1.31 mm, respectively. When the distance from the sprinkler was close, the number of small-diameter droplets was large, which accounted for a large volume percentage. With the increase of spraying distance, the number of large-diameter droplets increased, the proportion increased and the slope decreased.
As shown in Figure 8, the percentage of small droplets decreased with the distance from the sprinkler, which Figure 5 explains. When the pressure was 200 kPa for three different nozzles, with the increase in the distance from sprinkler, the percentage of large droplets increased, which led to the decrease of the slope of the frequency. When the distance was 8, 10 and 12 m, the droplets with diameter greater than 3 mm accounted for 16.9%, 21.65% and 73.26% of droplets, respectively.
The increase in the nozzle diameter resulted in a higher degree of atomization and a corresponding increase in the number of small-diameter droplets. The slope of the frequency curve became large with the increase of nozzle diameter. For example, the droplets with diameters greater than 3 mm accounted for 16.9%, 8.8% and 0%, respectively. In contrast to the change caused by the increase of nozzle size to the droplets at 12 m, the slope of the front section of the curve also increased. Although the quantity of individual droplets with large diameter produced by the large nozzle size was small, the volume was large, which reduced the slope of the rear section of the 12 m curve. The number of these droplets was small, and the impact was negligible.

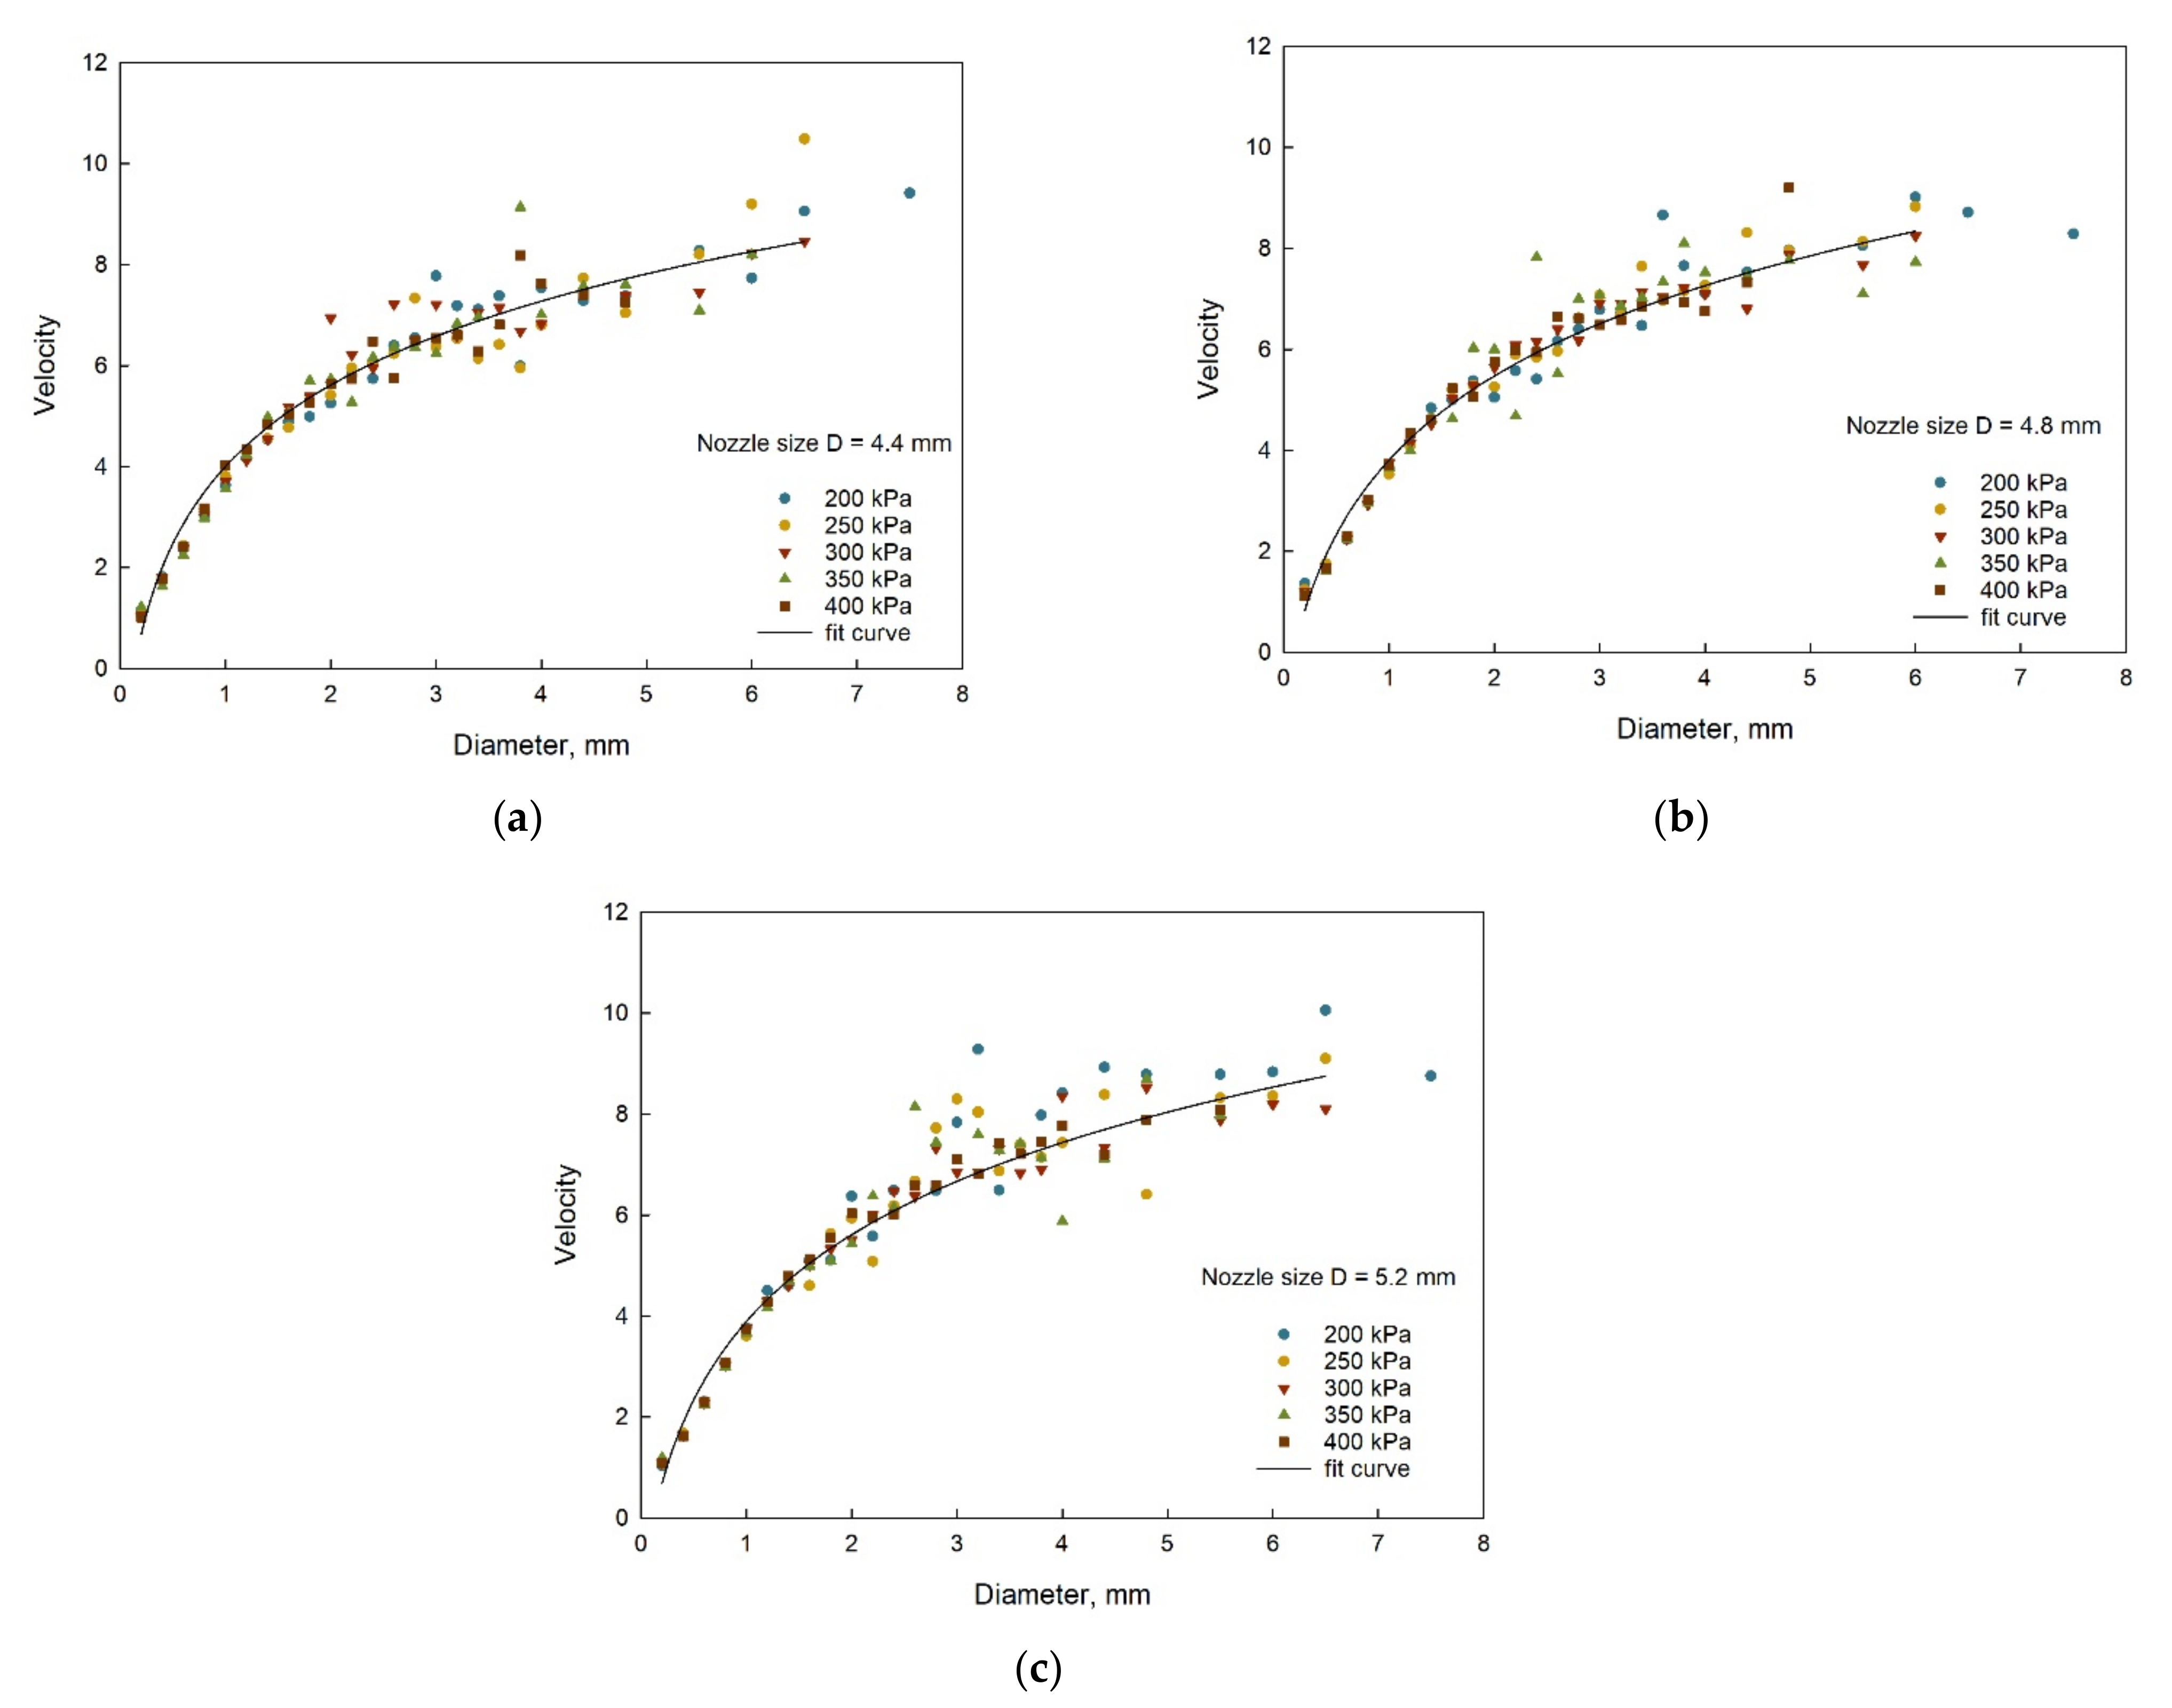
3.4. Droplet Velocity

Droplet velocity is not only an important parameter in the characteristics of droplets but also a key index to measure the kinetic energy. Therefore, we used 2DVD to measure the vertical and horizontal velocities of a single droplet falling to the ground and calculated the combined velocity. Figure 9 shows the relationship between the diameter and the velocity of droplets under five pressures.
As shown in Figure 9, there was a logarithmic relationship between droplet velocity and diameter. In Table 1, all R2 values were greater than 0.906. The velocity increased gradually with the increase of diameter and ultimately reached the maximum, which shows that the droplet diameter is an important factor for determining the droplet velocity. When the droplet diameter was less than 2 mm, the working pressure had little effect on the average velocity, and the relationship between the two was in good agreement with the logarithmic function model. However, as the diameter increased to more than 2 mm, the impact of the working pressure increased. To research the comprehensive influence of working pressures, the average velocity under different working pressures was at the significance level of 5% and the result of the one-way ANOVA was 0.953, which proved that the influence of working pressure on velocity was not significant. With the increase of pressure, the droplet diameter decreased, as did the velocity range, which was consistent with the effect of pressure on the range. These results were in agreement with those reported by other researchers [30,31,32]. However, due to the existence of the diffuser, the data fluctuation was not obvious. Even if the working pressure was increased, the impact on velocity was small, and the gap was within 11%. According to the logarithmic relationship between the droplet diameter and the mean droplet velocity derived by Sayyadi et al. [25], the calculation equation of the mean droplet velocity under each working condition was fitted as shown in Table 1.

3.5. Kinetic Energy Distribution

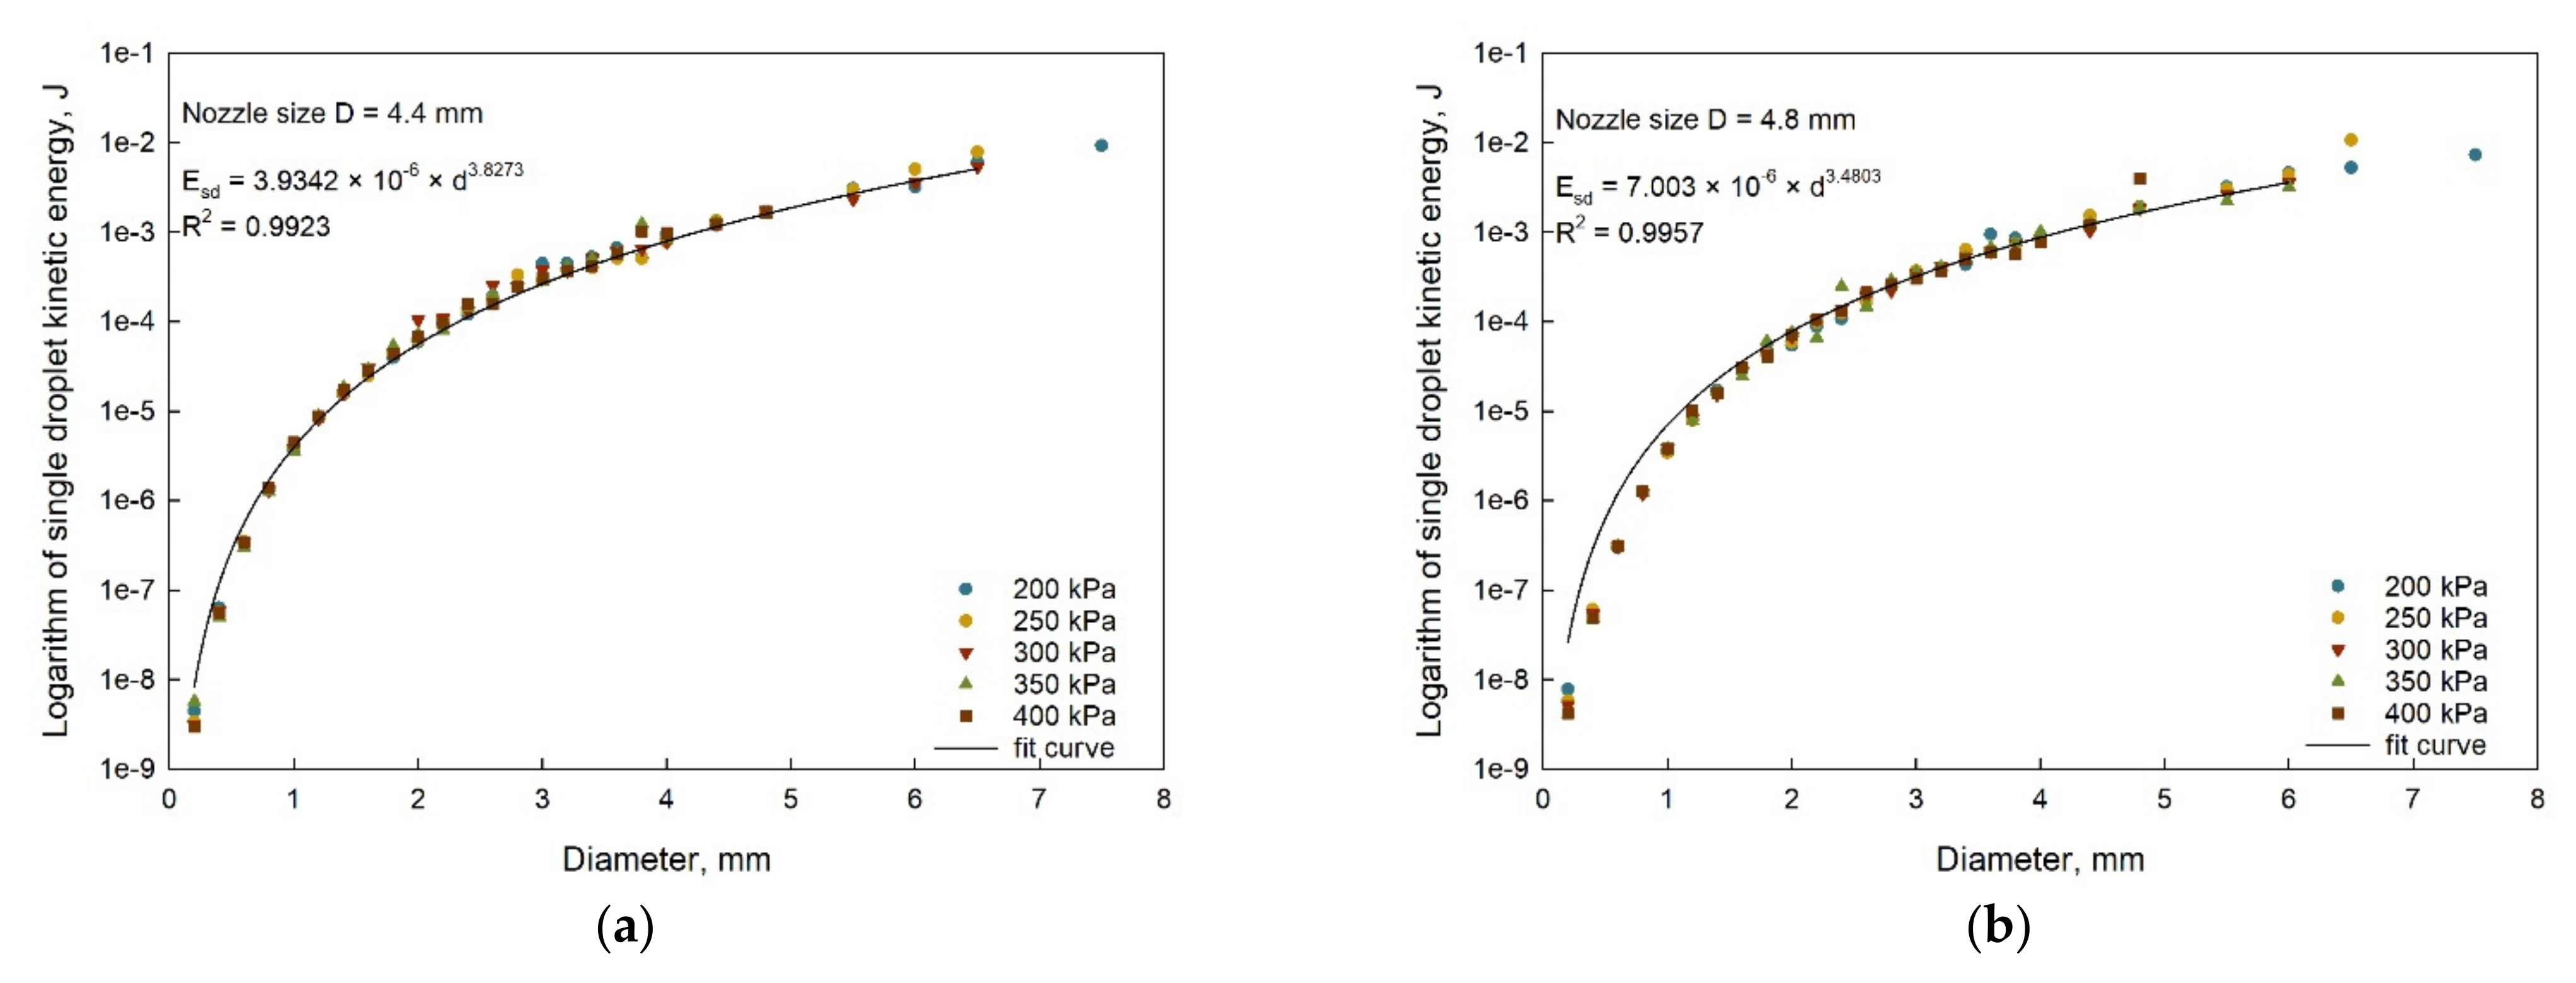
3.5.1. Droplet Kinetic Energy

The mean droplet kinetic energy is the key parameter to determine the precipitation distribution of irrigation systems and predict surface runoff [32]. Based on the droplet diameter and velocity data at each measuring point, the actual value of average kinetic energy at each position could be calculated by Equation (5). The calculated values along the radial direction under different pressure values are shown in Figure 10.
As shown in Figure 10a through Figure 10c, when the diameter increased, the kinetic energy of a single droplet increased, and the slope of the curve decreased. The impact of pressure was less than that of droplet diameter. The relationship between the diameter and kinetic energy of each nozzle was well fitted with the power function model. The correlation coefficients (R2) were 0.9923, 0.9957 and 0.9875. In order to evaluate the kinetic energy distribution under operating factors, the relationship among droplet diameter, nozzle diameter and kinetic energy was explored and is presented in Equation (11).
E = 7.3954 × 10 6 D 0.0488 d 3.5806
where E is the droplet kinetic energy (J), D is the nozzle size (mm), and d is the droplet diameter (mm).

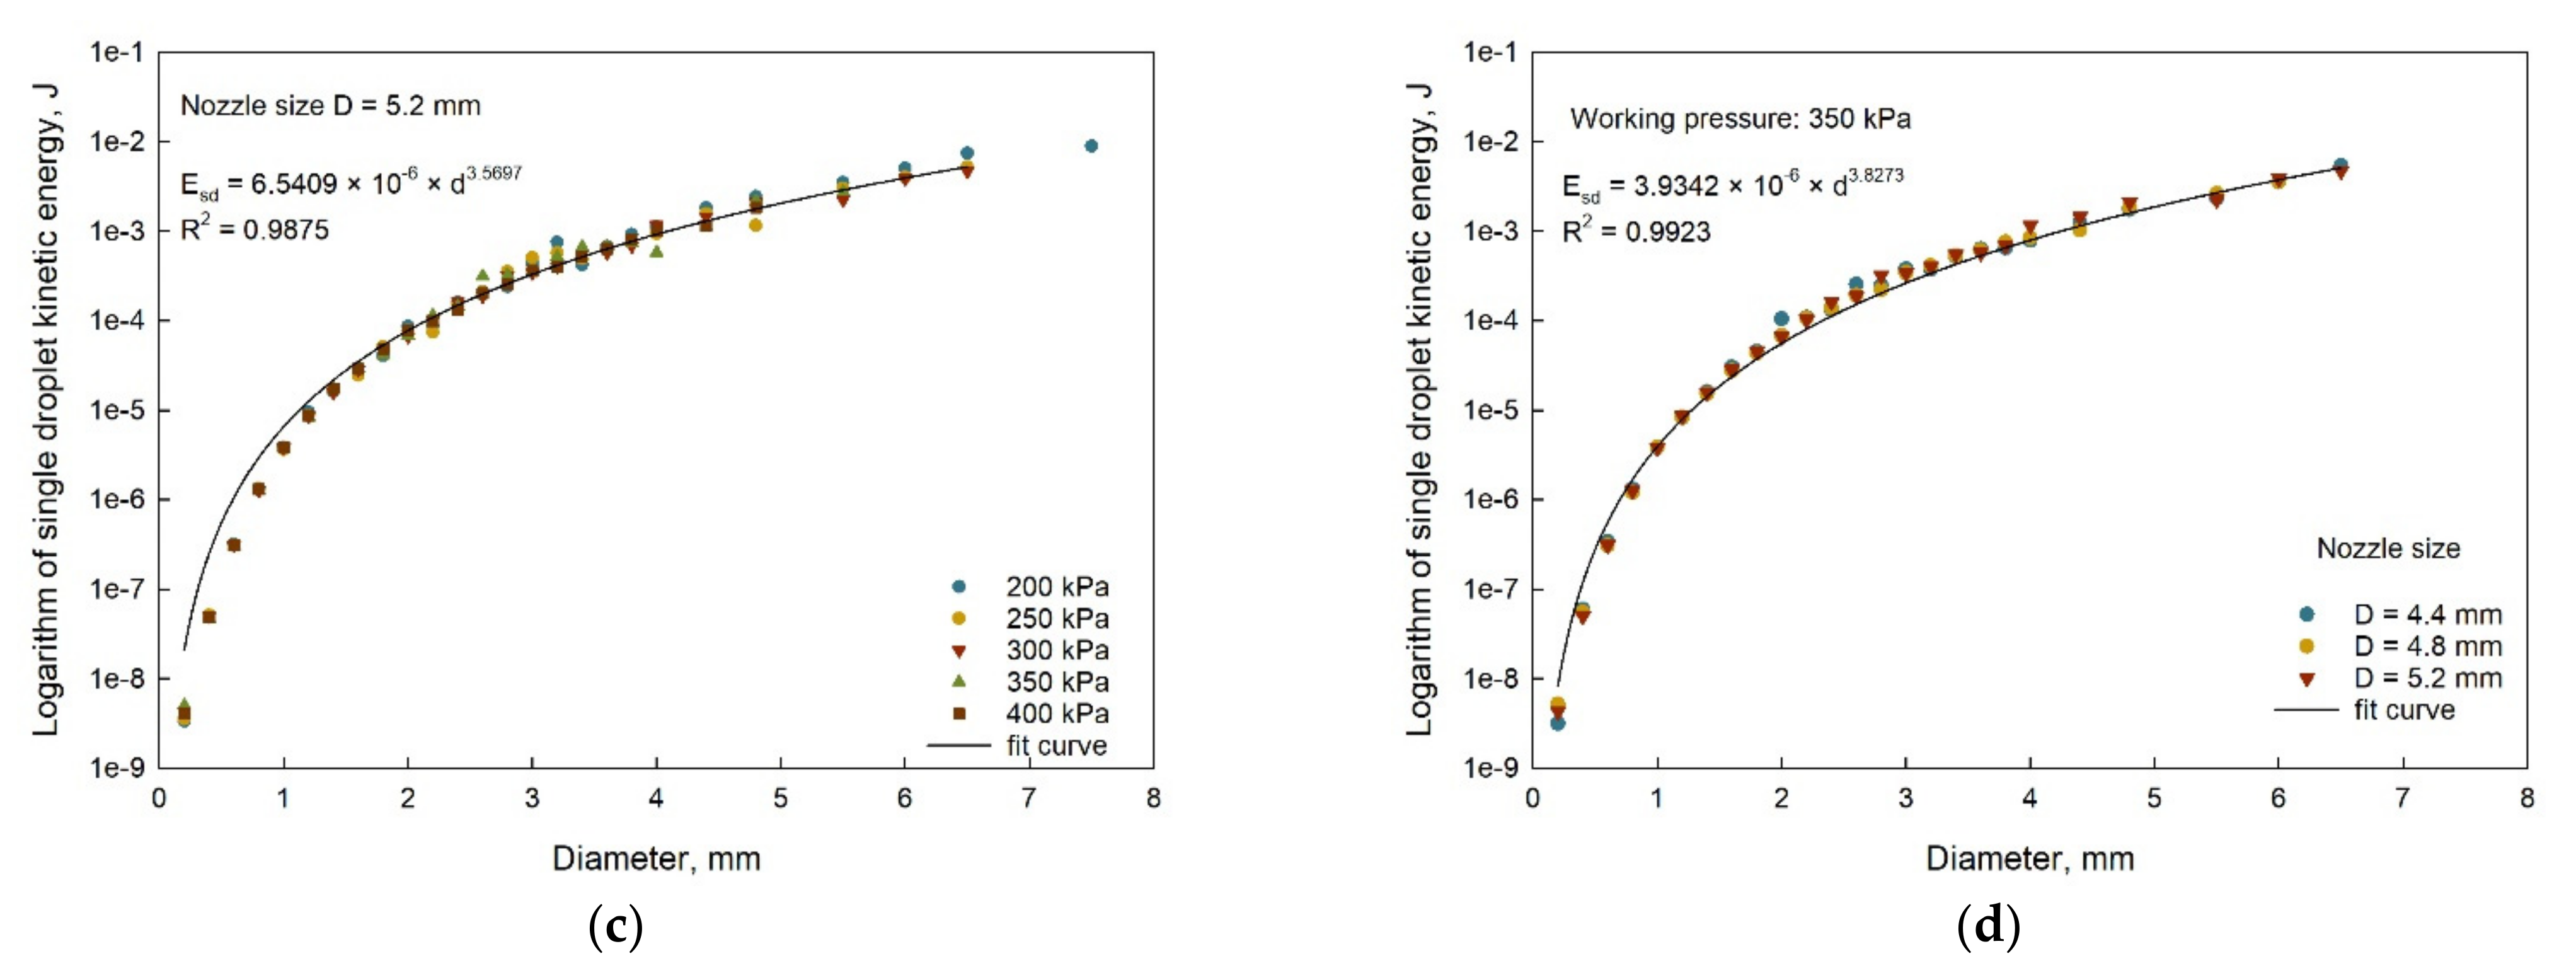
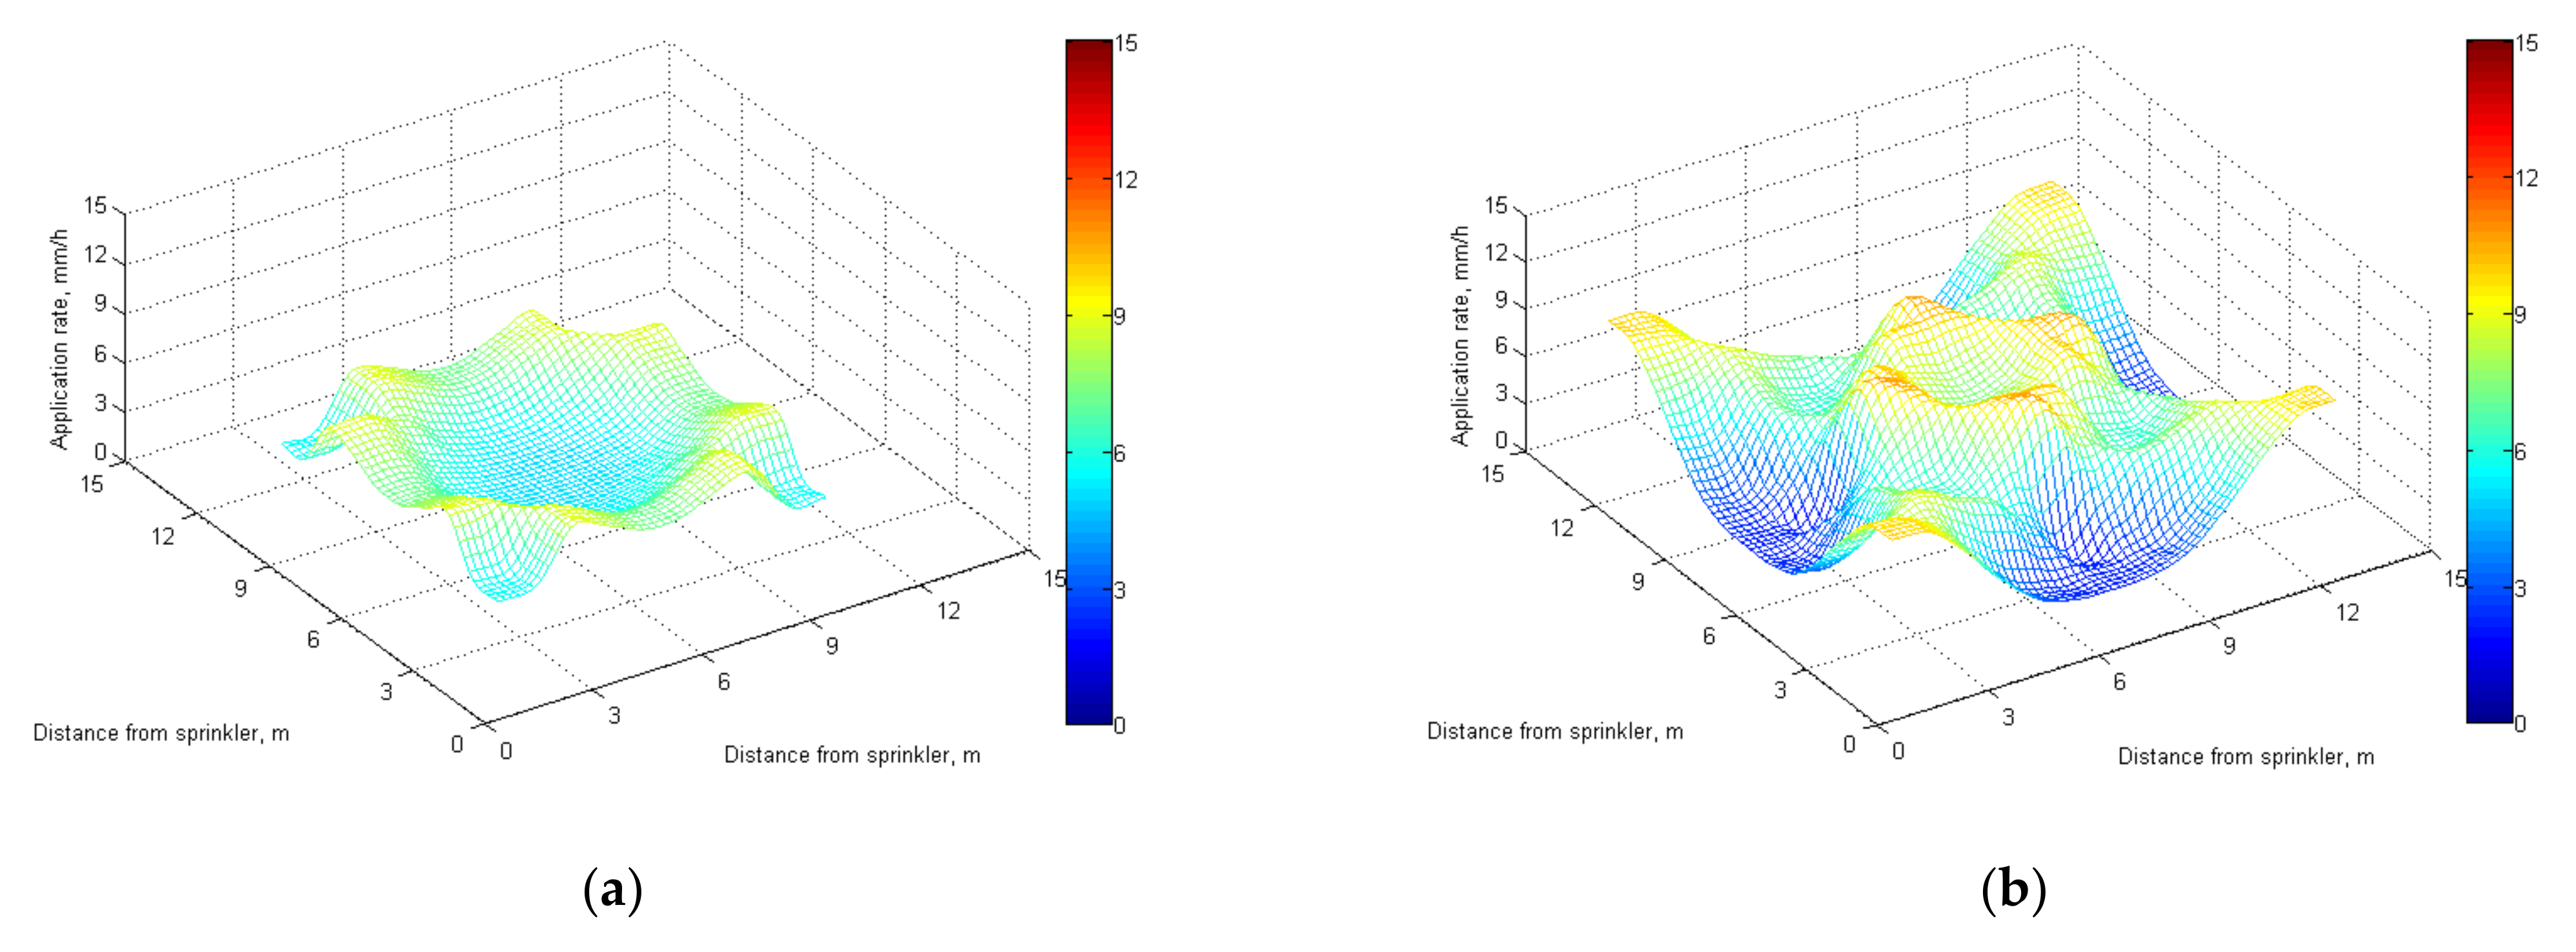
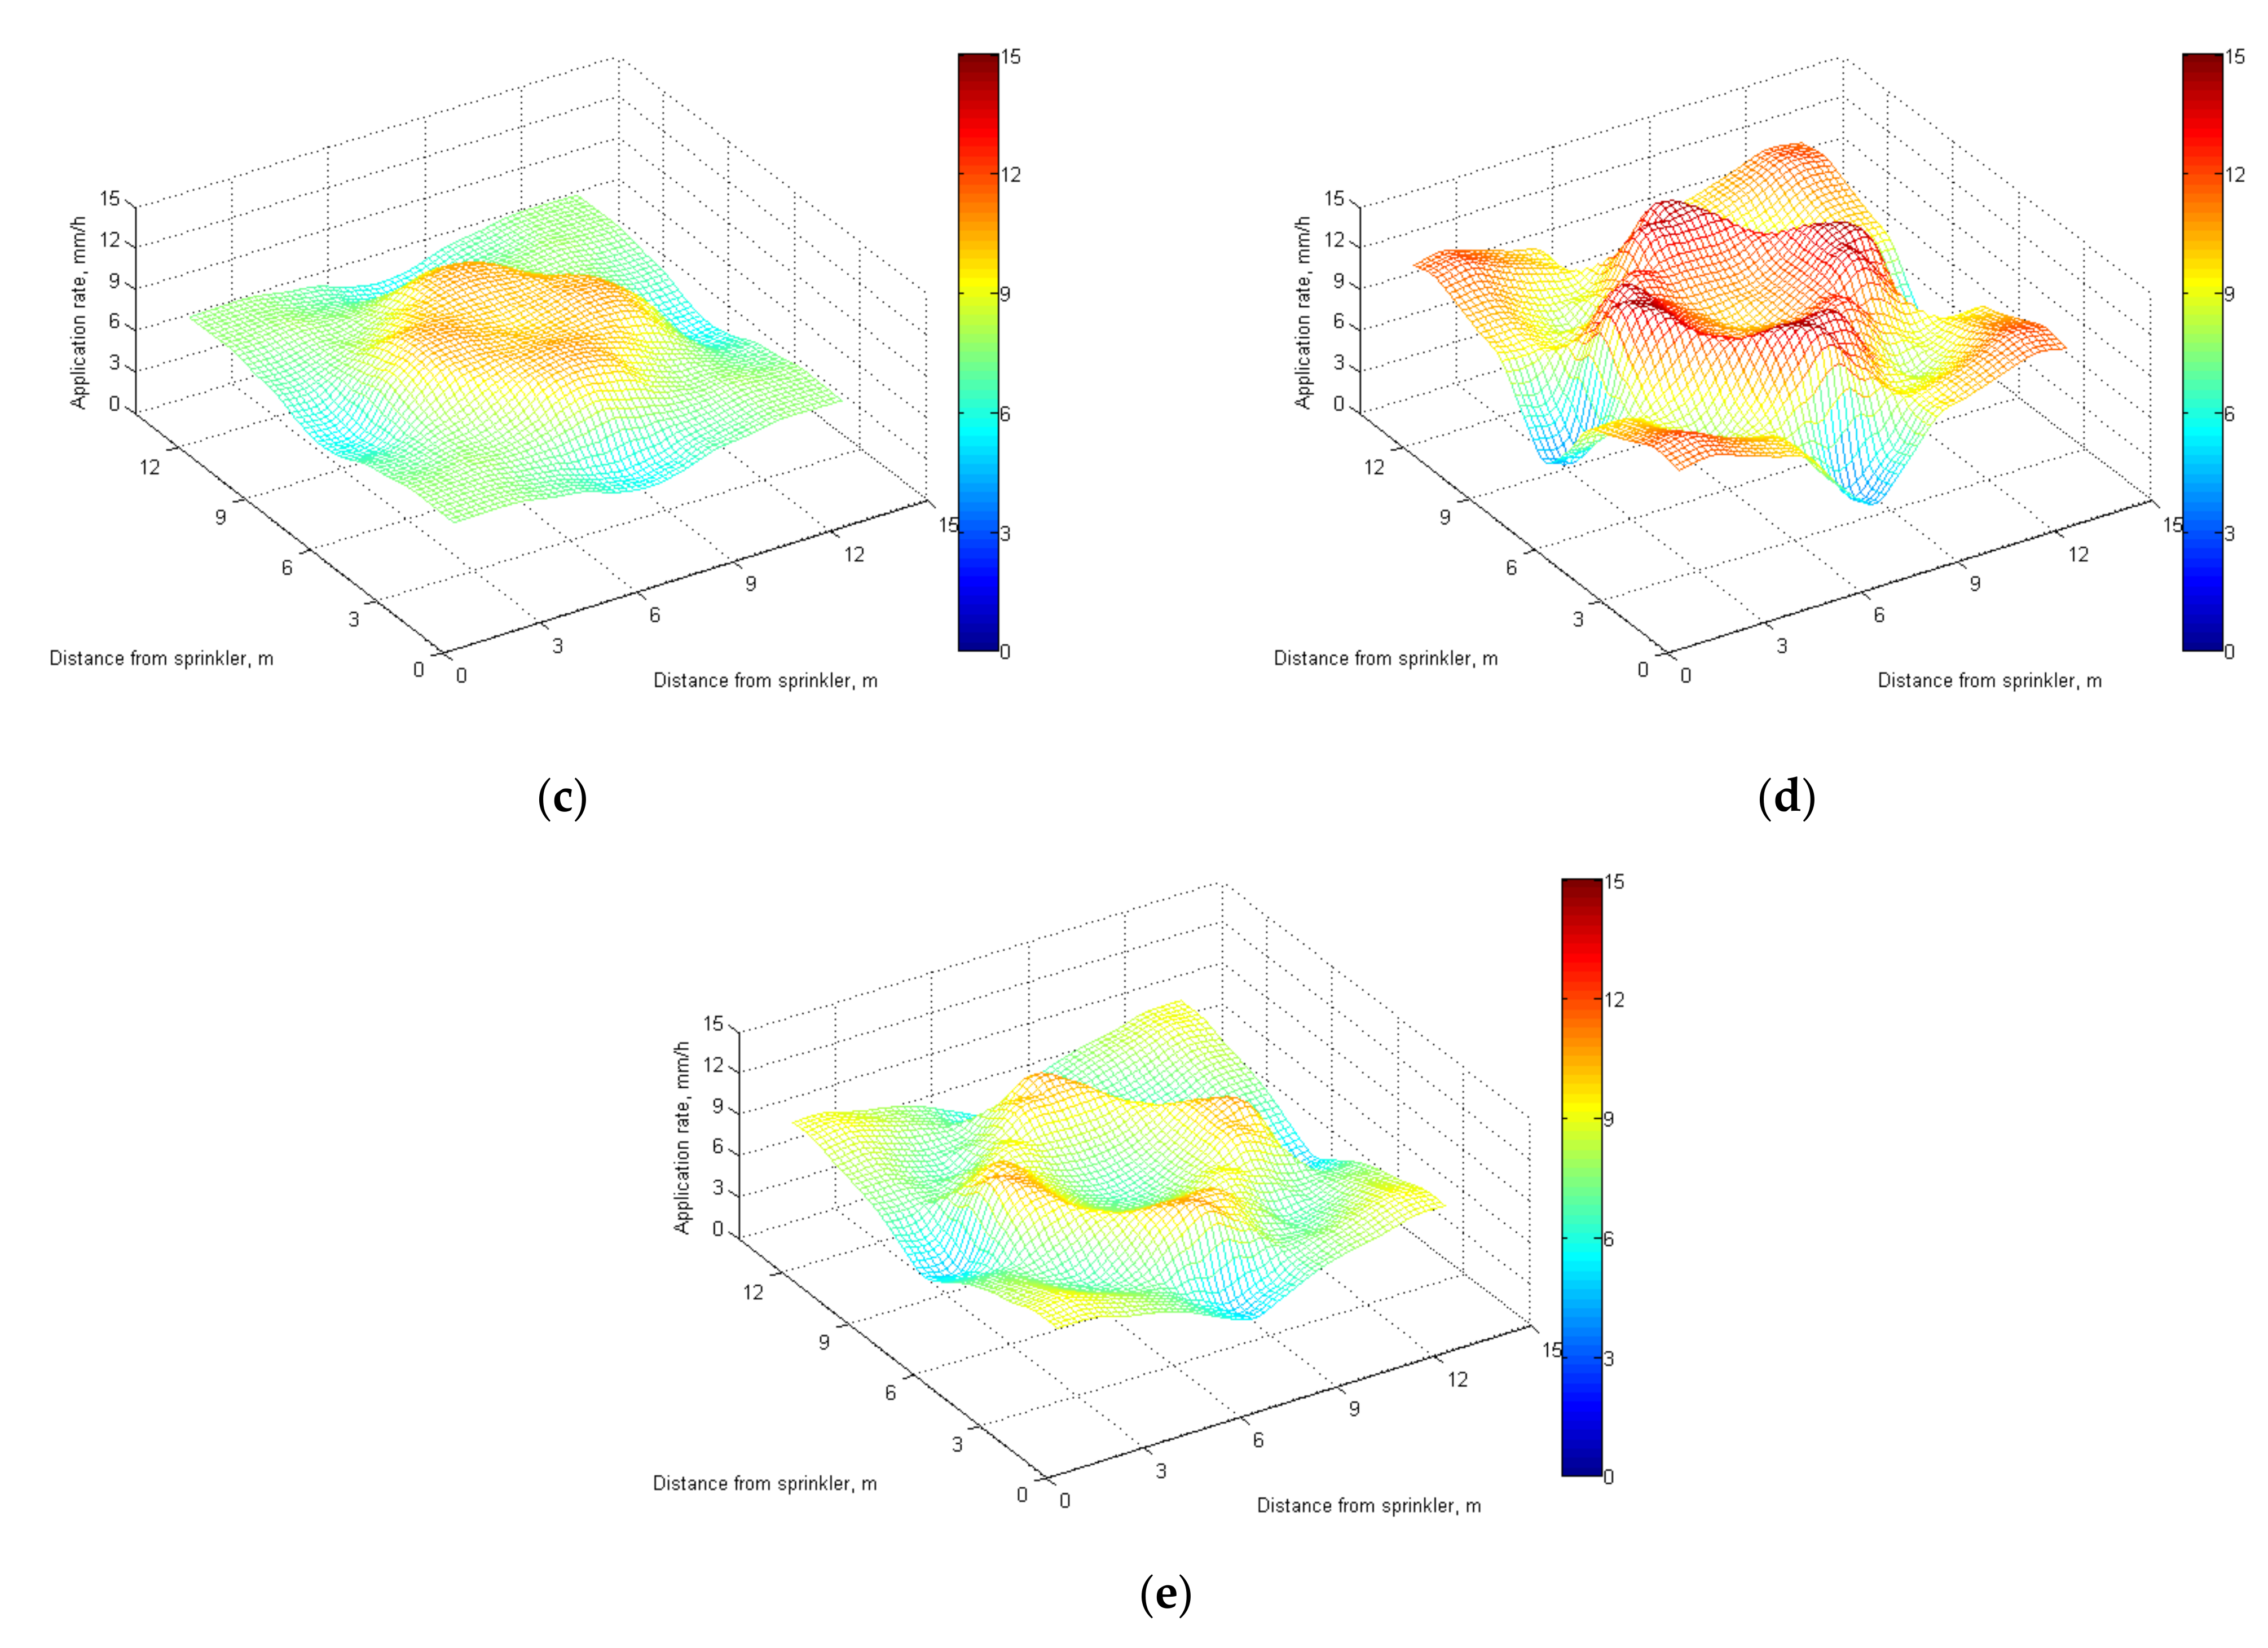
3.5.2. Radial Kinetic Energy

Table 2 presents the values of unit droplet volume kinetic energy (KEdi) at different distances from the sprinkler. Under the same pressure level, the KEdi value closer to the sprinkler was lower and increased with the increase of spraying distance. Through the analysis of variance, we found that the working pressure and nozzle size have no significant effect on KEdi (p = 0.737, 0.981). When the spaying distance was the same, the pressure increased gradually. The KEdi value conforms to the variation of decreasing and then increasing, and the range decreased, which was similar to the effect of working pressure on droplet frequency. The maximum values under the three different nozzle sizes were 34.92, 32.81 and 32.09 J L−1. A larger nozzle diameter caused a lower KEdi value.
SP refers to the rate at which the kinetic energy is transferred to the surface in unit time. According to the above kinetic energy value per unit droplet volume and the AR, the SP value distributed along the radial direction was calculated by Equation (7), as shown in Figure 11.
In the wetting radius, the SP value first increased and then decreased; the peak appeared at the edge of the range. When the working pressure was reduced to 200 kPa, the impact kinetic energy intensity at the end of the range reached the maximum. With the increase of pressure, the peak value decreased continuously, and the radial distribution was more uniform. When the distance from the sprinkler was less than 10 m, the SP value was less than 0.012 W m−2, which was the same as the trend of the VMD distribution. The average diameter and velocity of droplets were smaller, since they were closer to the sprinkler.
Table 3 shows the peak values and distances from the peak points to the sprinkler of SP and AR. When the sprinkler operated at a low pressure, the value of AR and the peak point of SP almost coincide. When the nozzle size was 5.2 mm, the distance completely coincided. Although the maximum values of droplet diameter and velocity appeared at the range edge, the peak value of SP did not appear at the outermost layer of the wetting radius. This is because the rapid decrease of AR led to the decrease of the SP value. According to the general situation, the peak value of SP appears only when the droplet diameter, velocity, and AR remain at a high level [15]. However, due to the special structure of the Nelson R33 sprinkler used in this study, the device used to aggravate the droplet breakage was added, which significantly reduced the impact of working pressure on the droplet characteristics.
The radial distribution of the droplet diameter and velocity under different pressures were analyzed. The conclusion was that the influence of pressure on the velocity of droplets can be ignored, but the droplet diameter decreased with the increase of pressure. Furthermore, the SP value of this sprinkler is jointly determined by the AR and the diameter of droplets. When the application rate and droplet diameter remained at a high level, SP peaked. If the SP value is too high, the concentrated spray droplets would erode the surface, reduce the infiltration rate of spraying water and produce surface runoff, which would not only waste water resources but also seriously damage the soil structure. For example, Thompson et al. [33] studied the influence of SP on the development of surface runoff and sediment yield of a silt loam soil and proposed that runoff may occur when SP is above 0.095 W m−2. For SP less than 0.04 W m−2, the infiltrated depth was extremely sensitive [32]. Yan et al. [28] studied the effects of droplet kinetic energy flux density produced by a D3000 series sprinkler on surface runoff, bulk density, sediment yield and infiltration depth prior to runoff of a sandy loam soil. King et al. [27] proposed a sprinkler potential runoff index independent of soil infiltration characteristics and applied it to different sprinklers, flow rates and operating pressures.
Moreover, in actual field sprinkler irrigation, the soil surface is covered by crop canopy. The redistribution of droplets will cause the spatial variability of the soil infiltration process [34]. Taking the maize canopy as an example, at the mature stage (the maximum height of 2.5 m), 79% of the irrigation water was intercepted by maize leaves and then converted into runoff. The rest of the droplets penetrated the canopy and retained kinetic energy. When the irrigation water flows through the crop canopy, the dissipation of SP increases [35]. However, the existence of the canopy cannot completely change the droplets’ velocity and kinetic energy. The canopy sealing of maize at the jointing stage is poor, and more droplets will reach the soil surface directly [36]. The effect of canopy on the droplet characteristics should be further studied.

3.5.3. Irrigation Uniformity

The effects of pressure, combined spacing and nozzle diameter on the irrigation uniformity were examined. The results can be explained in the following three aspects. Firstly, when the nozzle diameter and working pressure were the same (4.4 mm, 200 kPa), the variation of water application rate became intensive as the sprinkler spacing increased (Figure 12a,b). Secondly, for the sprinklers with the same nozzle diameter and spacing (4.4 mm, 12 m), the distribution of water application rate became even, and the corresponding Cu increased from 63.83 to 85.57% when the pressure increased from 200 to 400 kPa (Figure 12b,c). Finally, when the working pressure and spacing were the same (200 kPa, 12 m), the irrigation uniformity increased as the nozzle diameter increased. The irrigation uniformity was 63.83, 82.72 and 86.61%, respectively, for the nozzle diameter of 4.4, 4.8 and 5.2 mm (Figure 12b,d,e). Generally, higher pressure, larger nozzle diameter and smaller spacing resulted in higher uniformity. When the sprinkler operates at low pressure, the large nozzle diameter should be selected to obtain a higher Cu value.
The quality and yield of crops are affected by the uniformity of the sprinkler irrigation system. Many researchers use the concept of minimum uniformity coefficient to unify the system design criteria [37,38]. In most research, the value of Cu is maintained between 80 and 90%. More than 90% will lead to a significant increase in the cost of the whole system [39]. As shown in the Table 4, the Cu value increased with the increase of nozzle working pressure and the reduction of layout spacing. When the spacing was less than 9 m, the Cu value remained above 80%. The last column of Table 4 indicates the recommended values of the sprinkler spacing for different conditions.

4. Conclusions

The research on the spray characteristics of the Nelson R33 sprinkler has had great significance for the design of low-pressure irrigation systems in the field. In this paper, an indoor experiment was conducted to obtain droplet size distribution and radial application patterns of a sprinkler fitted with various nozzle sizes and working pressures. The 2DVD was used to monitor the data of sprayed droplets in real time. The experimental results show that the working pressure and nozzle size of the sprinkler have different constraints on the characteristics of droplets. Based on the experimental data, the equations for calculating VMD, average velocity and kinetic energy at different measuring points were established.
The VMD and NMD were distributed exponentially along the radial direction. As the nozzle size and spraying distance increased, the average diameter of the droplets also increased. The VMD at the same measuring point decreased with the increase of pressure, and the further the distance from the sprinkler, the faster it decreased. The overall distribution of droplet velocity had little relationship with the change of pressure. A logarithmic function model describing droplet velocity and diameter was established. The correlation coefficient of the model was as high as 0.9 using different pressures and nozzle sizes.
An empirical equation for calculating the kinetic energy per unit droplet volume at different distances from the sprinkler was established. When the nozzle was the same and the working pressure was less than 250 kPa, the peak value of SP at the end of the range was the highest. Although the highest value of SP in this study was lower than the threshold value that would cause the runoff in the literature due to a good hydraulic performance of the sprinkler with a diffuser, the sprinkler should not operate below 250 kPa, especially when using a large nozzle, because the uniformity of SP distribution will be further reduced.
The irrigation uniformity of four adjacent sprinklers with different combined spacing, nozzle diameter and working pressure was calculated. The results showed that, where the sprinkler worked under low pressures, CU can be increased by increasing the nozzle diameter or decreasing the spacing. This can alleviate the problem of high cost and energy consumption during high-pressure operation and can provide a basis for the design of sprinkler irrigation systems for low-pressure operations.

Author Contributions

The authors contributed to the research in the following ways. Conceptualization, R.C. and J.W.; methodology, J.W. and Z.S.; validation, R.C., T.Y. and J.W.; formal analysis, J.W. and Z.S.; data curation, Z.S.; writing—original draft preparation, J.W. and Z.S.; writing—review and editing, Z.S. and Z.T.; visualization, Z.S. and T.Y.; supervision, J.W.; funding acquisition, J.W. and R.C. All authors have read and agreed to the published version of the manuscript.

Funding

This study was financially supported by the National Natural Science Foundation of China (51709130), National Natural Science Foundation of China (51939005) and Jiangsu Agricultural Science and Technology Innovation Fund (CX(21)3078).

Institutional Review Board Statement

Not applicable.

Informed Consent Statement

Not applicable.

Data Availability Statement

The data presented in this study are available on request from the co-author, Rui Chen.

Conflicts of Interest

The authors declare no conflict of interest.

References

  1. Tal, A. Rethinking the sustainability of Israel’s irrigation practices in the Drylands. Water Res. 2016, 90, 387–394. [Google Scholar] [CrossRef] [PubMed]
  2. Carrión, P.; Tarjuelo, J.; Montero, J. SIRIAS: A simulation model for sprinkler irrigation. Irrig. Sci. 2001, 20, 73–84. [Google Scholar] [CrossRef]
  3. Zhang, L.; Merkley, G.P.; Pinthong, K. Assessing whole-field sprinkler irrigation application uniformity. Irrig. Sci. 2011, 31, 87–105. [Google Scholar] [CrossRef]
  4. Xu, Y.; Ge, J.; Tian, S.; Li, S.; Nguy-Robertson, A.L.; Zhan, M.; Cao, C. Effects of water-saving irrigation practices and drought resistant rice variety on greenhouse gas emissions from a no-till paddy in the central lowlands of China. Sci. Total Environ. 2015, 505, 1043–1052. [Google Scholar] [CrossRef] [PubMed]
  5. Li, Y.; Bai, G.; Yan, H. Development and validation of a modified model to simulate the sprinkler water distribution. Comput. Electron. Agric. 2015, 111, 38–47. [Google Scholar] [CrossRef]
  6. Lal, R. Carbon emission from farm operations. Environ. Int. 2004, 30, 981–990. [Google Scholar] [CrossRef]
  7. Pelletier, N.; Audsley, E.; Brodt, S.; Garnett, T.; Henriksson, P.; Kendall, A.; Kramer, K.J.; Murphy, D.; Nemecek, T.; Troell, M. Energy Intensity of Agriculture and Food Systems. Annu. Rev. Environ. Resour. 2011, 36, 223–246. [Google Scholar] [CrossRef]
  8. Wang, X.; Li, G.; Guo, C. Optimization of impact sprinkler sub-nozzle parameters of elevation angle and position. Trans. Chin. Soc. Agric. Eng. 2015, 31, 85–95. [Google Scholar]
  9. Gong, X.; Zhu, D.; Zhang, L. Drop Size Distribution of Fixed Spray-plate Sprinklers with Two-dimensional Video Disdrometer. Trans. Chin. Soc. Agric. Mach. 2014, 45, 128–133. [Google Scholar]
  10. Solomon, K.H.; Kissiinger, J.A.; Farrens, G.P.; Borneman, J. Performance and Water Conservation Potential of Multi-Stream, Multi-Trajectory Rotating Sprinklers for Landscape Irrigation. Appl. Eng. Agric. 2006, 23, 153–163. [Google Scholar] [CrossRef]
  11. Hanson, B.R.; Orloff, S.B. Rotator nozzles more uniform than spray nozzles on center-pivot sprinklers. Calif. Agric. 1996, 50, 32–35. [Google Scholar] [CrossRef]
  12. Ribeiro, M.S.; Lima, L.A.; Colombo, A.; Caldeira, A.C.D.M.; Faria, F.H.D.S. Water distribuition characteristics and soil loss of LEPA Quad-Spray emitter nozzles. Eng. Agric. 2013, 33, 223–236. [Google Scholar] [CrossRef] [Green Version]
  13. Dukes, M.D.; Perry, C. Uniformity testing of variable-rate center pivot irrigation control systems. Precis. Agric. 2006, 7, 205–218. [Google Scholar] [CrossRef]
  14. Issaka, Z.; Li, H.; Jiang, Y. Simple theory, numerical simulation of jet impact forces and water dispersion on the fixed dispersion device for impact sprinkler. In Proceedings of the ASABE 2018, Annual International Meeting, Detroit, MI, USA, 29 July–1 August 2018. [Google Scholar]
  15. Chen, R.; Li, H.; Wang, J.; Guo, X. Effects of Pressure and Nozzle Size on the Spray Characteristics of Low-Pressure Rotating Sprinklers. Water 2020, 12, 2904. [Google Scholar] [CrossRef]
  16. Bautista-Capetillo, C.; Robles, O.; Salinas, H.; Playán, E. A particle tracking velocimetry technique for drop characterization in agricultural sprinklers. Irrig. Sci. 2014, 32, 437–447. [Google Scholar] [CrossRef] [Green Version]
  17. Kincaid, D.C. Spraydrop kinetic energy from irrigation sprinklers. Trans. ASAE 1996, 39, 847–853. [Google Scholar] [CrossRef] [Green Version]
  18. Montero, J.; Tarjuelo, J.M. Sprinkler droplet size distribution measured with an optical spectropluviometer. Irrig. Sci. 2003, 22, 47–56. [Google Scholar] [CrossRef]
  19. Liu, J.; Liu, X.; Zhu, X.; Yuan, S. Droplet characterisation of a complete fluidic sprinkler with different nozzle dimensions. Biosyst. Eng. 2016, 148, 90–100. [Google Scholar] [CrossRef]
  20. Zhang, Y.; Zhu, D.; Zhang, L. Spatial Variation of Application Rate and Droplet Kinetic Energy for Fixed Spray Plate Sprinkler. Trans. Chin. Soc. Agric. Mach. 2015, 46, 85–90. [Google Scholar]
  21. Kruger, A.; Krajewski, W.F. Two-Dimensional video Disdrometer: A Description. Am. Meteorol. Soc. 2002, 19, 602–617. [Google Scholar] [CrossRef]
  22. Ge, M.; Wu, P.; Zhu, D.; Zhang, L. Comparisons of spray characteristics between vertical impact and turbine drive sprinklers—A case study of the 50PYC and HY50 big gun-type sprinklers. Agric. Water Manag. 2020, 228, 105847. [Google Scholar] [CrossRef]
  23. Chen, R.; Li, H.; Wang, J.; Guo, X.; Song, Z. Comparisons of Spray Characteristics between Non-circular and Circular Nozzles with Rotating Sprinklers. Appl. Eng. Agric. 2022, 38, 61–75. [Google Scholar] [CrossRef]
  24. Salvador, R.; Bautista-Capetillo, C.; Burguete, J.; Zapata, N.; Serreta, A.; Playán, E. A photographic method for drop characterization in agricultural sprinklers. Irrig. Sci. 2009, 27, 307–317. [Google Scholar] [CrossRef]
  25. Sayyadi, H.; Nazemi, A.H.; Sadraddini, A.A.; Delirhasannia, R. Characterising droplets and precipitation profiles of a fixed spray-plate sprinkler. Biosyst. Eng. 2014, 119, 13–24. [Google Scholar] [CrossRef]
  26. King, B.A.; Bjorneberg, D.L. Characterizing Droplet Kinetic Energy Applied by Moving Spray-Plate Center-Pivot Irrigation Sprinklers. Trans. Asabe 2010, 53, 137–145. [Google Scholar] [CrossRef]
  27. King, B.A. Moving Spray-Plate Center-Pivot Sprinkler Rating Index for Assessing Runoff Potential. Trans. ASABE 2016, 59, 225–237. [Google Scholar]
  28. Yan, H.; Bai, G.; He, J.; Lin, G. Influence of droplet kinetic energy flux density from fixed spray-plate sprinklers on soil infiltration, runoff and sediment yield. Biosyst. Eng. 2011, 110, 213–221. [Google Scholar] [CrossRef]
  29. Wu, P.; Zhu, D.; Zhang, L. Hydraulics problems in farmland irrigation. J. Drain. Irrig. Mach. Eng. 2012, 30, 726–732. [Google Scholar]
  30. Chen, D.; Wallender, W.W. Droplet Size Distribution and Water Application with Low-Pressure Sprinklers. Trans. ASAE 1985, 28, 511–516. [Google Scholar] [CrossRef]
  31. Kohl, R.A. Drop size distribution from medium-sized agricultural sprinklers. Trans. ASAE 1974, 17, 690–693. [Google Scholar] [CrossRef]
  32. Thompson, A.L.; James, L.G. Water Droplet Impact and its Effect on Infiltration. Trans. ASAE 1985, 28, 1506–1510. [Google Scholar] [CrossRef]
  33. Thompson, A.L.; Regmi, T.P.; Ghidey, F.; Gantzer, C.J.; Hjelmfelt, A.T. Influence of kinetic energy on infiltration and erosion. Soil Eros. 2001. [Google Scholar]
  34. Zheng, J.; Fan, J.; Zhang, F.; Yan, S.; Wu, Y.; Lu, J.; Guo, J.; Cheng, M.; Pei, Y. Throughfall and stemflow heterogeneity under the maize canopy and its effect on soil water distribution at the row scale. Sci. Total Environ. 2019, 660, 1367–1382. [Google Scholar] [CrossRef] [PubMed]
  35. Zapata, N.; Robles, O.; Playán, E.; Paniagua, P.; Romano, C.; Salvador, R.; Montoya, F. Low-pressure sprinkler irrigation in maize: Differences in water distribution above and below the crop canopy. Agric. Water Manag. 2018, 203, 353–365. [Google Scholar] [CrossRef]
  36. Zhu, Z.; Zhu, D.; Ge, M. The Spatial Variation Mechanism of Size, Velocity, and the Landing Angle of Throughfall Droplets under Maize Canopy. Water 2021, 13, 2083. [Google Scholar] [CrossRef]
  37. Robles, O.; Playán, E.; Cavero, J.; Zapata, N. Assessing low-pressure solid-set sprinkler irrigation in maize. Agric. Water Manag. 2017, 191, 37–49. [Google Scholar] [CrossRef] [Green Version]
  38. Playán, E.; Zapata, N.; Faci, J.M.; Tolosa, D.; Lacueva, J.L.; Pelegrín, J.; Salvador, R.; Sánchez, I.; Lafita, A. Assessing sprinkler irrigation uniformity using a ballistic simulation model. Agric. Water Manag. 2006, 84, 89–100. [Google Scholar] [CrossRef] [Green Version]
  39. Li, J.S. Modeling crop yield as affected by uniformity of sprinkler irrigation system. Agric. Water Manag. 1998, 38, 135–146. [Google Scholar] [CrossRef]
Figure 1. Components of the Nelson R33 rotating sprinkler.
Agriculture 12 00987 g001
Figure 2. Layout of the experimental system.
Agriculture 12 00987 g002
Figure 3. Relationships between the VMD and distance from the sprinkler under three different nozzle sizes of (a) D = 4.4 mm, (b) D = 4.8 mm, (c) D = 5.2 mm, and nozzle size of (d) under the working pressure of 350 kPa.
Agriculture 12 00987 g003aAgriculture 12 00987 g003b
Figure 4. Relationships between the NMD and distance from the sprinkler under three different nozzle sizes of (a) D = 4.4 mm, (b) D = 4.8 mm, (c) D = 5.2 mm, and nozzle size of (d) under the working pressure of 350 kPa.
Agriculture 12 00987 g004
Figure 5. Droplet quantity frequency of the sprinkler with the nozzle size of 5.2 mm under the working pressures of (a) 200 kPa, (b) 250 kPa, (c) 300 kPa, (d) 350 kPa and (e) 400 kPa.
Agriculture 12 00987 g005
Figure 6. Relationships between frequency and droplet diameter with a nozzle size of (a) D = 4.4 mm, (b) D = 4.8 mm and (c) D = 5.2 mm under 250 kPa of pressure.
Agriculture 12 00987 g006
Figure 7. Droplet cumulative volume of the sprinklers with the nozzle sizes of 5.2 mm under (a) 200 kPa, (b) 300 kPa and (c) 400 kPa of pressure.
Agriculture 12 00987 g007
Figure 8. Droplet cumulative volume of the sprinklers with nozzle sizes of (a) D = 4.4 mm, (b) D = 4.8 mm and (c) D = 5.2 mm under 200 kPa of pressure.
Agriculture 12 00987 g008
Figure 9. Relationships between droplet mean velocity and droplet diameter with nozzle sizes of (a) D = 4.4 mm, (b) D = 4.8 mm and (c) D = 5.2 mm under different pressures.
Agriculture 12 00987 g009
Figure 10. Relationships between the mean droplet kinetic energy and the droplet diameter with nozzle sizes of (a) D = 4.4 mm, (b) D = 4.8 mm, (c) D = 5.2 mm under different pressures and (d) under the working pressure of 350 kPa.
Agriculture 12 00987 g010aAgriculture 12 00987 g010b
Figure 11. Specific power as a function of radial distance from the sprinkler with nozzle sizes of (a) D = 4.4 mm, (b) D = 4.8 mm and (c) D = 5.2 mm under different pressures.
Agriculture 12 00987 g011
Figure 12. Water application rate for the three nozzle sizes under the different conditions. (a) D = 4.4 mm, 200 kPa, 9 m; (b) D = 4.4 mm, 200 kPa, 12 m; (c) D = 4.4 mm, 400 kPa, 12 m; (d) D = 4.8 mm, 200 kPa, 12 m; (e) D = 5.2 mm, 200 kPa, 12 m.
Agriculture 12 00987 g012aAgriculture 12 00987 g012b
Table 1. Logarithmic relationships between droplet mean velocity and diameter under different working pressures and their R2 values.
Nozzle Size
(mm)
Working PressureRelational ExpressionR2
(kPa)
D = 4.4
(#22)
200vd = 3.0535ln(x + 0.3283) + 2.85950.959
250vd = 3.6336ln(x + 0.6382) + 1.79770.931
300vd = 2.4674ln(x + 0.0821) + 3.80440.949
350vd = 2.7609ln(x + 0.1990) + 3.33140.932
400vd = 2.7404ln(x + 0.1934) + 3.37380.967
D = 4.8
(#24)
200vd = 3.1151ln(x + 0.3611) + 2.76470.957
250vd = 3.4795ln(x + 0.4807) + 2.29830.983
300vd = 2.7787ln(x + 0.2166) + 3.26040.979
350vd = 2.7162ln(x + 0.1540) + 3.47820.906
400vd = 3.2443ln(x + 0.3760) + 2.67950.964
D = 5.2
(#26)
200vd = 3.3912ln(x + 0.2921) + 3.03990.938
250vd = 2.9791ln(x + 0.2131) + 3.30890.920
300vd = 2.7996ln(x + 0.1756) + 3.43500.965
350vd = 2.9930ln(x + 0.2277) + 3.26160.907
400vd = 2.9415ln(x + 0.2183) + 3.29560.984
D is the nozzle diameter. vd is the droplet mean velocity. x is the distance from sprinkler.
Table 2. Kinetic energy per unit droplet volume (J L−1).
Nozzle DiameterWorking PressureDistance from Sprinkler (m)
(mm)(kPa)123456789101112131415
4.42000.002.704.625.737.789.899.5613.5514.7620.7322.5926.0534.75
2501.932.664.734.676.128.4010.4112.2413.5216.5920.0221.9334.92
3001.912.533.854.917.466.8610.258.9214.0113.9218.7522.1929.40
3501.972.913.915.394.805.318.1710.2511.5013.3216.7721.6024.98
4001.892.643.734.626.406.438.179.3810.8114.4517.6419.2720.40
4.82002.593.184.795.328.909.409.2213.6017.5016.6822.6027.34
2501.993.063.515.259.037.917.5811.4914.2218.4519.4523.8132.81
3002.612.143.904.605.258.188.2311.7413.4015.0816.8820.1823.5329.08
3501.772.524.334.555.848.998.5310.0710.5811.5113.3018.3720.4526.52
4001.822.743.495.675.265.698.568.1511.8511.2713.9717.0619.7723.96
5.22001.913.234.367.076.5210.4310.748.7910.5814.3015.5123.1437.4616.59
2502.003.244.225.525.367.927.3011.1013.0712.1013.8320.8225.0532.09
3001.862.774.085.456.218.029.618.6212.4413.9215.7119.3522.8926.21
3502.022.674.254.536.697.758.1111.638.9911.2013.9415.6319.4124.0329.84
4001.622.653.634.586.456.727.3110.868.9512.0314.7515.4520.4426.05
Table 3. Distance of peak points and peak values of SP and AR from the sprinkler.
Nozzle Size (mm)Working Pressure (kPa)ARm_i (m)SPm_i (m)ARm (mm h−1)SPm (W m−2)
4.420012124.3440.031
25012122.9440.018
30012122.7650.017
35012132.6700.017
40012122.7850.015
4.820013125.0500.035
25013133.3170.030
30013133.3000.022
35013135.0500.029
4009123.1850.014
5.220013133.9090.041
25013133.5810.025
30013133.3150.021
35013133.2250.017
40013133.2300.018
ARm_i is the distance of the peak point of the application rate from the sprinkler. SPm_i is the distance of the peak point of specific power from the sprinkler. ARm is the peak value of the application rate. SPm is the peak value of the specific power.
Table 4. Christiansen uniformity coefficient (CU) of combined sprinkler irrigation under square arrangement.
Nozzle
Diameter (mm)
Working Pressure (kPa)CU under Square Combination (%)Recommended Sprinkler
Spacing (m)
Combination Spacing between Sprinklers (m)
789101112131415
4.420095.5587.7383.5178.4685.7363.8353.32//9 to 11
30098.3296.7395.8390.1588.0584.3474.5270.54/12
40098.8898.6498.1391.1788.5185.5778.6675.71/12 to 13
4.820096.3492.7787.8585.2784.7582.7266.0159.35/12
30098.2197.7295.8993.7287.5286.1978.1269.58/12
40098.4499.0996.8989.7186.1283.9977.8078.00/12
5.220098.5093.8888.2784.9284.9186.6170.9962.84/10 to 12
30098.9198.5897.3795.7790.8089.0285.6976.7571.7513
40098.7498.6698.2295.6790.4688.4286.3080.1677.7014
Publisher’s Note: MDPI stays neutral with regard to jurisdictional claims in published maps and institutional affiliations.

