Abstract
Though increasing food supply in order to meet the rising demand for nutrition is a global social imperative, reducing the dependence on imports of essential food commodities is both an economic and a geo-political imperative for national governments. However, in light of the Sustainable Development Goals, although Zero Hunger (SDG2) and Good Health and Well-Being (SDG3) can be ensured within a country when the inhabitants are well-nourished and staple food items remain affordable to one and all, oftentimes, there are trade-offs in the process, with the environmental dimensions—SDGs 13 (Climate action), 14 (Life below water) and 15 (Life on Land). In this paper, using a combination of Environmental-Life Cycle Assessment (E-LCA) and Data Envelopment Analysis (DEA), the authors have evaluated the eco-efficiency of 169 wheat cultivation systems in the Golestan province in the north of Iran. Benchmarking performance based on the best-performing wheat farms and optimizing (decreasing essentially) the consumption of resources, will enable an average reduction of between 10% and 16% in global warming, acidification, eutrophication, and non-renewable energy usage of the wheat cultivation systems in the case study region. The authors recommend the use of this combination not only for wheat cultivation in other regions of the world, but also for other agricultural systems.
1. Introduction
In the developing countries of the world, approximately 70% of food-derived energy intake by humans can be attributed to cereals. Among cereals, wheat consumption has increased at a rapid rate since the Green Revolution, or the so-called Third Agricultural Revolution of the period 1950–1970, registering a cumulative rise in yield of 208% per hectare [1]. The Food and Agricultural Organisation of the United Nations had forecast that global wheat utilisation would reach 731 million tonnes in 2018 [2], but this figure was overshot by over 30 million tonnes. It has increased steadily over the last two years and stands at around 772 million tonnes for the 2020–2021 period [3]. In Iran, the case study country of this paper, wheat is a key source of food for the population, the most-commonly consumed final product derived from it being bread. In 2020, Iran harvested about 14 million tonnes of wheat, registering a steady increase in cultivation over time. However, it has also been relying on imports to satisfy the local demand for the cereal, as reported by the FAO [2]. The country now has an on-going self-sufficiency strategy to reduce the percentage of imported wheat in domestic consumption by striving to improve the yield of the domestic production of the same wheat. At the time of writing, wheat is cultivated all across Iran. Irrigated fields span 6.9 million ha, and dryland fields encompass 5.1 million ha of cropping area. These are, respectively, 38% and 62% of the total arable land in the country [4]. The mechanisation and technology level for wheat cultivation is high in Iran, and an efficiency of 84% has been reported by Lak [5].
If improving yields is the only priority, and an unbounded one at that, it may very well be from a socio-economic point of view, satisfying the sustainable development goals—SDG 2 (Zero Hunger) and SDG 3 (Good Health and Well-being), but there is a risk that the environmental dimension of sustainability (SDGs 13, 14 and 15) is overlooked, unless it is consciously factored into the equation.
In regions like the Golestan province of Iran, where intensive agriculture is practiced, it is imperative to investigate the contribution of farming systems to environmental degradation (soil erosion, etc.) further. This has been the result of the use of redundant quantities of chemicals, synthetic fertilizers, and pesticides over the years [6,7]. Since the 1990s, as part of environmental risk assessments, researchers have been studying the impact of resource inputs to agriculture on global warming, acidification, eutrophication (due to leaching of nitrogenous fertilisers), water pollution, and eco-toxicities of different types [8,9,10].
Environmental-Life Cycle Assessment (E-LCA; as differentiated from its social equivalent, S-LCA) has, over the years, enabled decision-makers to assess the environmental performance of systems (adopting a range of processes to yield products and services for end-users) in the anthroposphere [11]. This method can very well be applied to wheat cultivation as well, in order to provide a holistic outlook of the sustainability of increasing yield in Iran and reducing import dependence. Evaluating the environmental impacts of wheat production in general has been the focus of a handful of publications over the previous two decades [10,12,13,14], whereas the environmental impacts of wheat production in Iran in particular has been the focus of a couple of publications [15,16]. Heidari, et al. [17] quantified the spatial and technological variability in the carbon footprints of Iranian wheat systems and observed that the footprints were, as expected, sensitive to the material and energy input into the cultivation systems. These, if carefully studied and managed, according to the authors of that paper, would lead to a truncation in the environmental footprints.
When several wheat fields are included in an E-LCA, the evaluation becomes challenging, owing to the possibly large variations in the data from different fields. If the standard deviation of the values in the datasets is large, there are obvious limitations to the interpretations made by using the averages of the values in the analysis. Results with stark limitations are misleading and not of practical significance to decision-makers [18]. Researchers have tried to tide over this obstacle by combining E-LCA with non-life-cycle-based independent economic and social analyses [18,19].
The eco-efficiency of a process (or a system of processes) can be assessed by factoring in a host of dimensions—safety-related, economic, and environmental, which may even be weighted (based on relevance and importance) and aggregated subsequently to indicate the eco-efficiency by a single numerical index [20,21,22,23]. The rationale behind the choice of the hybrid-method—E-LCA and DEA [24]—for this analysis is clearly the previously successful application to rice paddy and soybean cultivation in Iran [25,26]. It must be emphasized here that although research avails of tried-and-tested methods, it adopts them to systems which have not previously been studied. Moreover, wheat cropping systems are discrete and different from rice and soybean cultivation in many ways. A precedent here is the evaluation done by Masuda [14] for wheat cultivation in Japan, which resulted in the calculation of an environmental impact index (which factored in two impact categories—global warming and aquatic eutrophication).
DEA is a linear programming method used for estimating the efficiency of multiple similar entries, known as decision-making units (DMU), using various inputs and outputs [27]. This combination has come in handy to many analysts [25,26,28,29], who have been able to easily work with a large inventory of data from several DMUs.
This is sufficient motivation for the authors of this paper to evaluate the eco-efficiency of wheat cultivation in developing countries (using Iran as a case study), by applying E-LCA and DEA, and provide inputs thereby to operational benchmarking and guidelines for improvement through optimization of the yield and the associated adverse environmental impacts.
2. Materials and Methods
In this section we present the five-step hybrid-method of LCA + DEA, applied to a case study of wheat production systems in Iran. This method, which was first presented by Vázquez-Rowe et al. [30], proposes the application of the DEA model to the operational variables using an input orientation (maintaining production while minimizing resource use). An environmental assessment is performed after the operational efficiency assessment. This yields environmental benchmarks directly associated with an optimized operational performance of the DMUs.
2.1. Data Gathering from the Case-Study Site
Data were collected directly from 169 wheat farmers in Golestan province in the north of Iran (36°50′21.48″ N, 54°26′39.84″ E) with the aid of a standard questionnaire. The collected information is about the energy and material inputs to the fields, cropping patterns adopted by the farmers, the yields of wheat, the operational schedules, and other relevant economic details. All the studied farms with minimum, average, and maximum sizes of 0.7 hectares (ha), 5.2 ha, and 21.6 ha, respectively, were irrigated. This province, located to the south of the Caspian Sea, thanks to the Mediterranean climate it enjoys and the favourable ecological conditions it is endowed with, is one of the leading agricultural regions in Iran, accounting for a sizable share of its cereals and oilseeds production. It can veritably be called the ‘bread-basket’ of the country, while recalling that most of the wheat is consumed as bread by Iranians. It receives, on average, over 440 mm rainfall per year, and has an average annual temperature of 18 °C.
Cronbach’s alpha (α) [31] was used to verify the reliability of the answers given by the farmers to the questions, with the value of α ranging from 0 to 1. The closer the value of α is to unity, the greater the degree of reliability of the answer given. The authors ended up with a Cronbach’s alpha value of 0.76 for this study, which indicates a reasonable degree of reliability.
2.2. The DEA Model and the DMUs
Data envelopment analysis (DEA) provides an efficiency score for every DMU (or simply wheat farm, in this case). This score is a ratio of an output vector to an input vector. The weightages used in order to aggregate the inputs and outputs were determined through a mathematical optimisation exercise, which compared the performance of each DMU with those of the theoretically most efficient ones in the chosen sample of 169 wheat farms. This entails having to differentiate between more and less efficient, or efficient and non-efficient DMUs. For this purpose, an input-oriented slack-based model (SBM) with constant returns to scale (CRS) was selected [32]. This model is especially useful when there is a many-to-one relationship between inputs and output, and the driving purpose of the analysis is a reduction in the quantities of the inputs and, thereby, their associated environmental impacts [33]. The input and output data for the 169 DMUs are tabulated in Table S1 in Supplementary Information (SI).
In the analysis, the operational items were assumed to be independent of each other. Environmental emissions to the air, water, and soil are directly proportional to the quantities of the different inputs to the systems, and, thereby, were not incorporated into the DEA matrix directly. They were indirectly accounted for by the entries which denote the magnitudes of the different inputs to the DMUs [34]. To retain the holistic nature of the sustainability assessment, inputs such as labour (socio-economic) were included as a separate input to the matrix, as advocated by [29]. It goes without saying that although increases in the yield benefit the end-consumers on the downstream, they also ought to benefit the farmers on the upstream. This can happen by the generation of more employment on the one hand, and augmenting incomes on the other, diminishing in the process the overall social life-cycle footprint of the wheat consumed.
2.3. Technical Efficiency and Super Efficiency (TE and SE)
The Technical Efficiency (TE) score of each DMU is defined based on the performance of the sample to which it belongs [35]. Calculated as the ratio of the sum of weighted outputs to the sum of weighted inputs, it confers a numerical value to the ability of the DMU to maximise its output, given a set of inputs and technology level, and can be determined by using the following functions [26,36].
where, θ is the TE of the DMU under consideration; x and y are the amounts of inputs and outputs respectively; v and u are the weightages of the inputs and outputs respectively; s is the number of inputs (s = 1, 2, …, m); r is number of outputs (r = 1, 2, …, n); and j denotes the jth DMUs (j = 1, 2, …, k). The measure of efficiency θ, is bounded between 0 and 1. If the value of θ equals unity, the DMU is considered to be efficient, whereas any value less than unity depicts inefficiency.
The Super Efficiency (SE) method ranks efficient DMUs by weighting the inputs thereto. Subsequently, efficient DMUs are assigned efficiencies greater than or equal to unity. The input-oriented CRS super efficiency model can be defined as follows [37]:
where θ0 is the SE of efficient DMUs. The DEA analysis was conducted by taking recourse to the EMS (Efficiency Measurement System) software [38].
2.4. LCA + DEA Framework
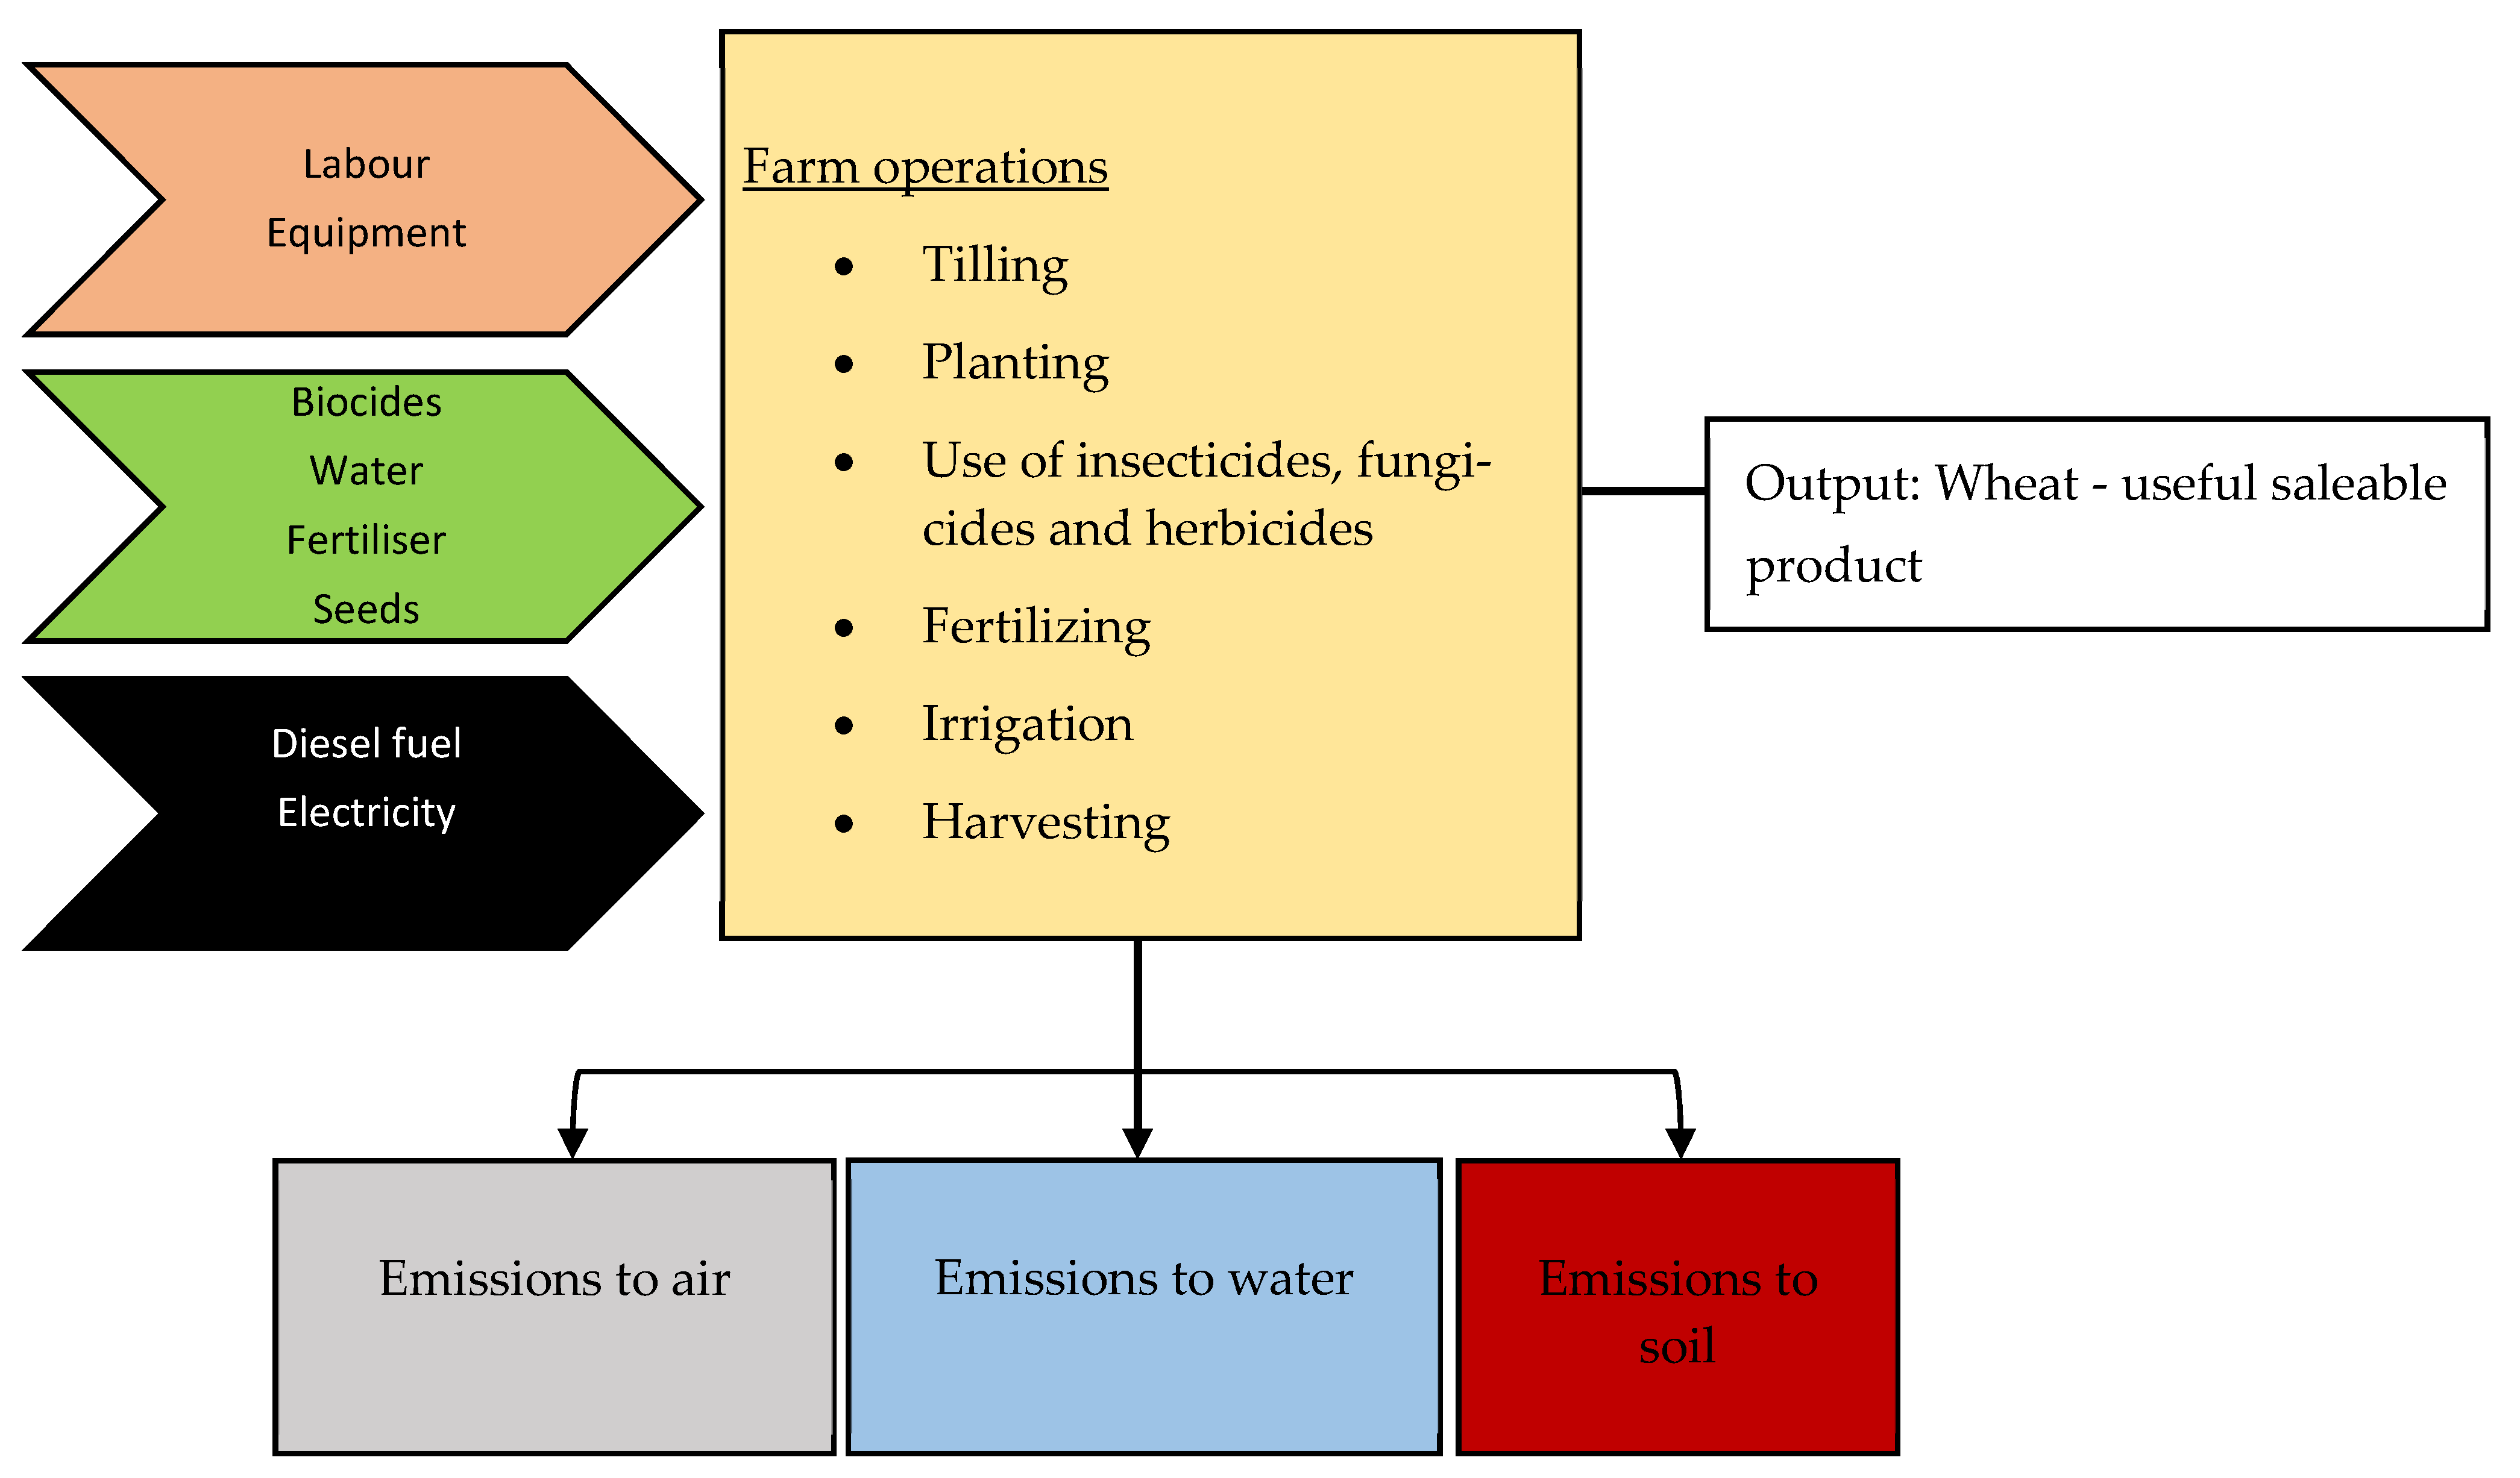
The wheat cultivation system analysed in this paper is depicted in Figure 1. The processes include irrigation, fertilisation, pesticide-spraying, and harvesting. The outflows for the E-LCA are wheat, straw, and the direct emissions to the environmental media associated with material and energy use. The output for the DEA is just wheat. Figure 2 represents the 5-step LCA + DEA approach adopted for this analysis [29,39], and it includes:
Figure 1.
LCA and DEA elements for each wheat field—DMU, in other words.
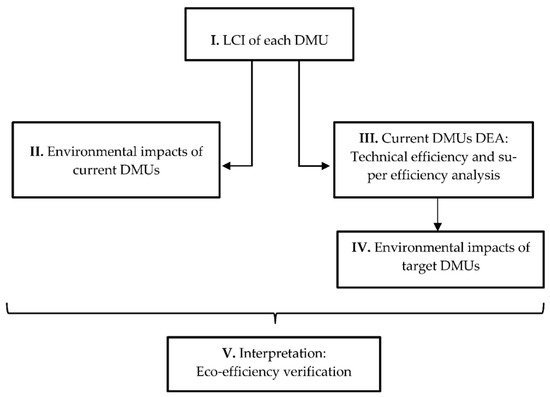
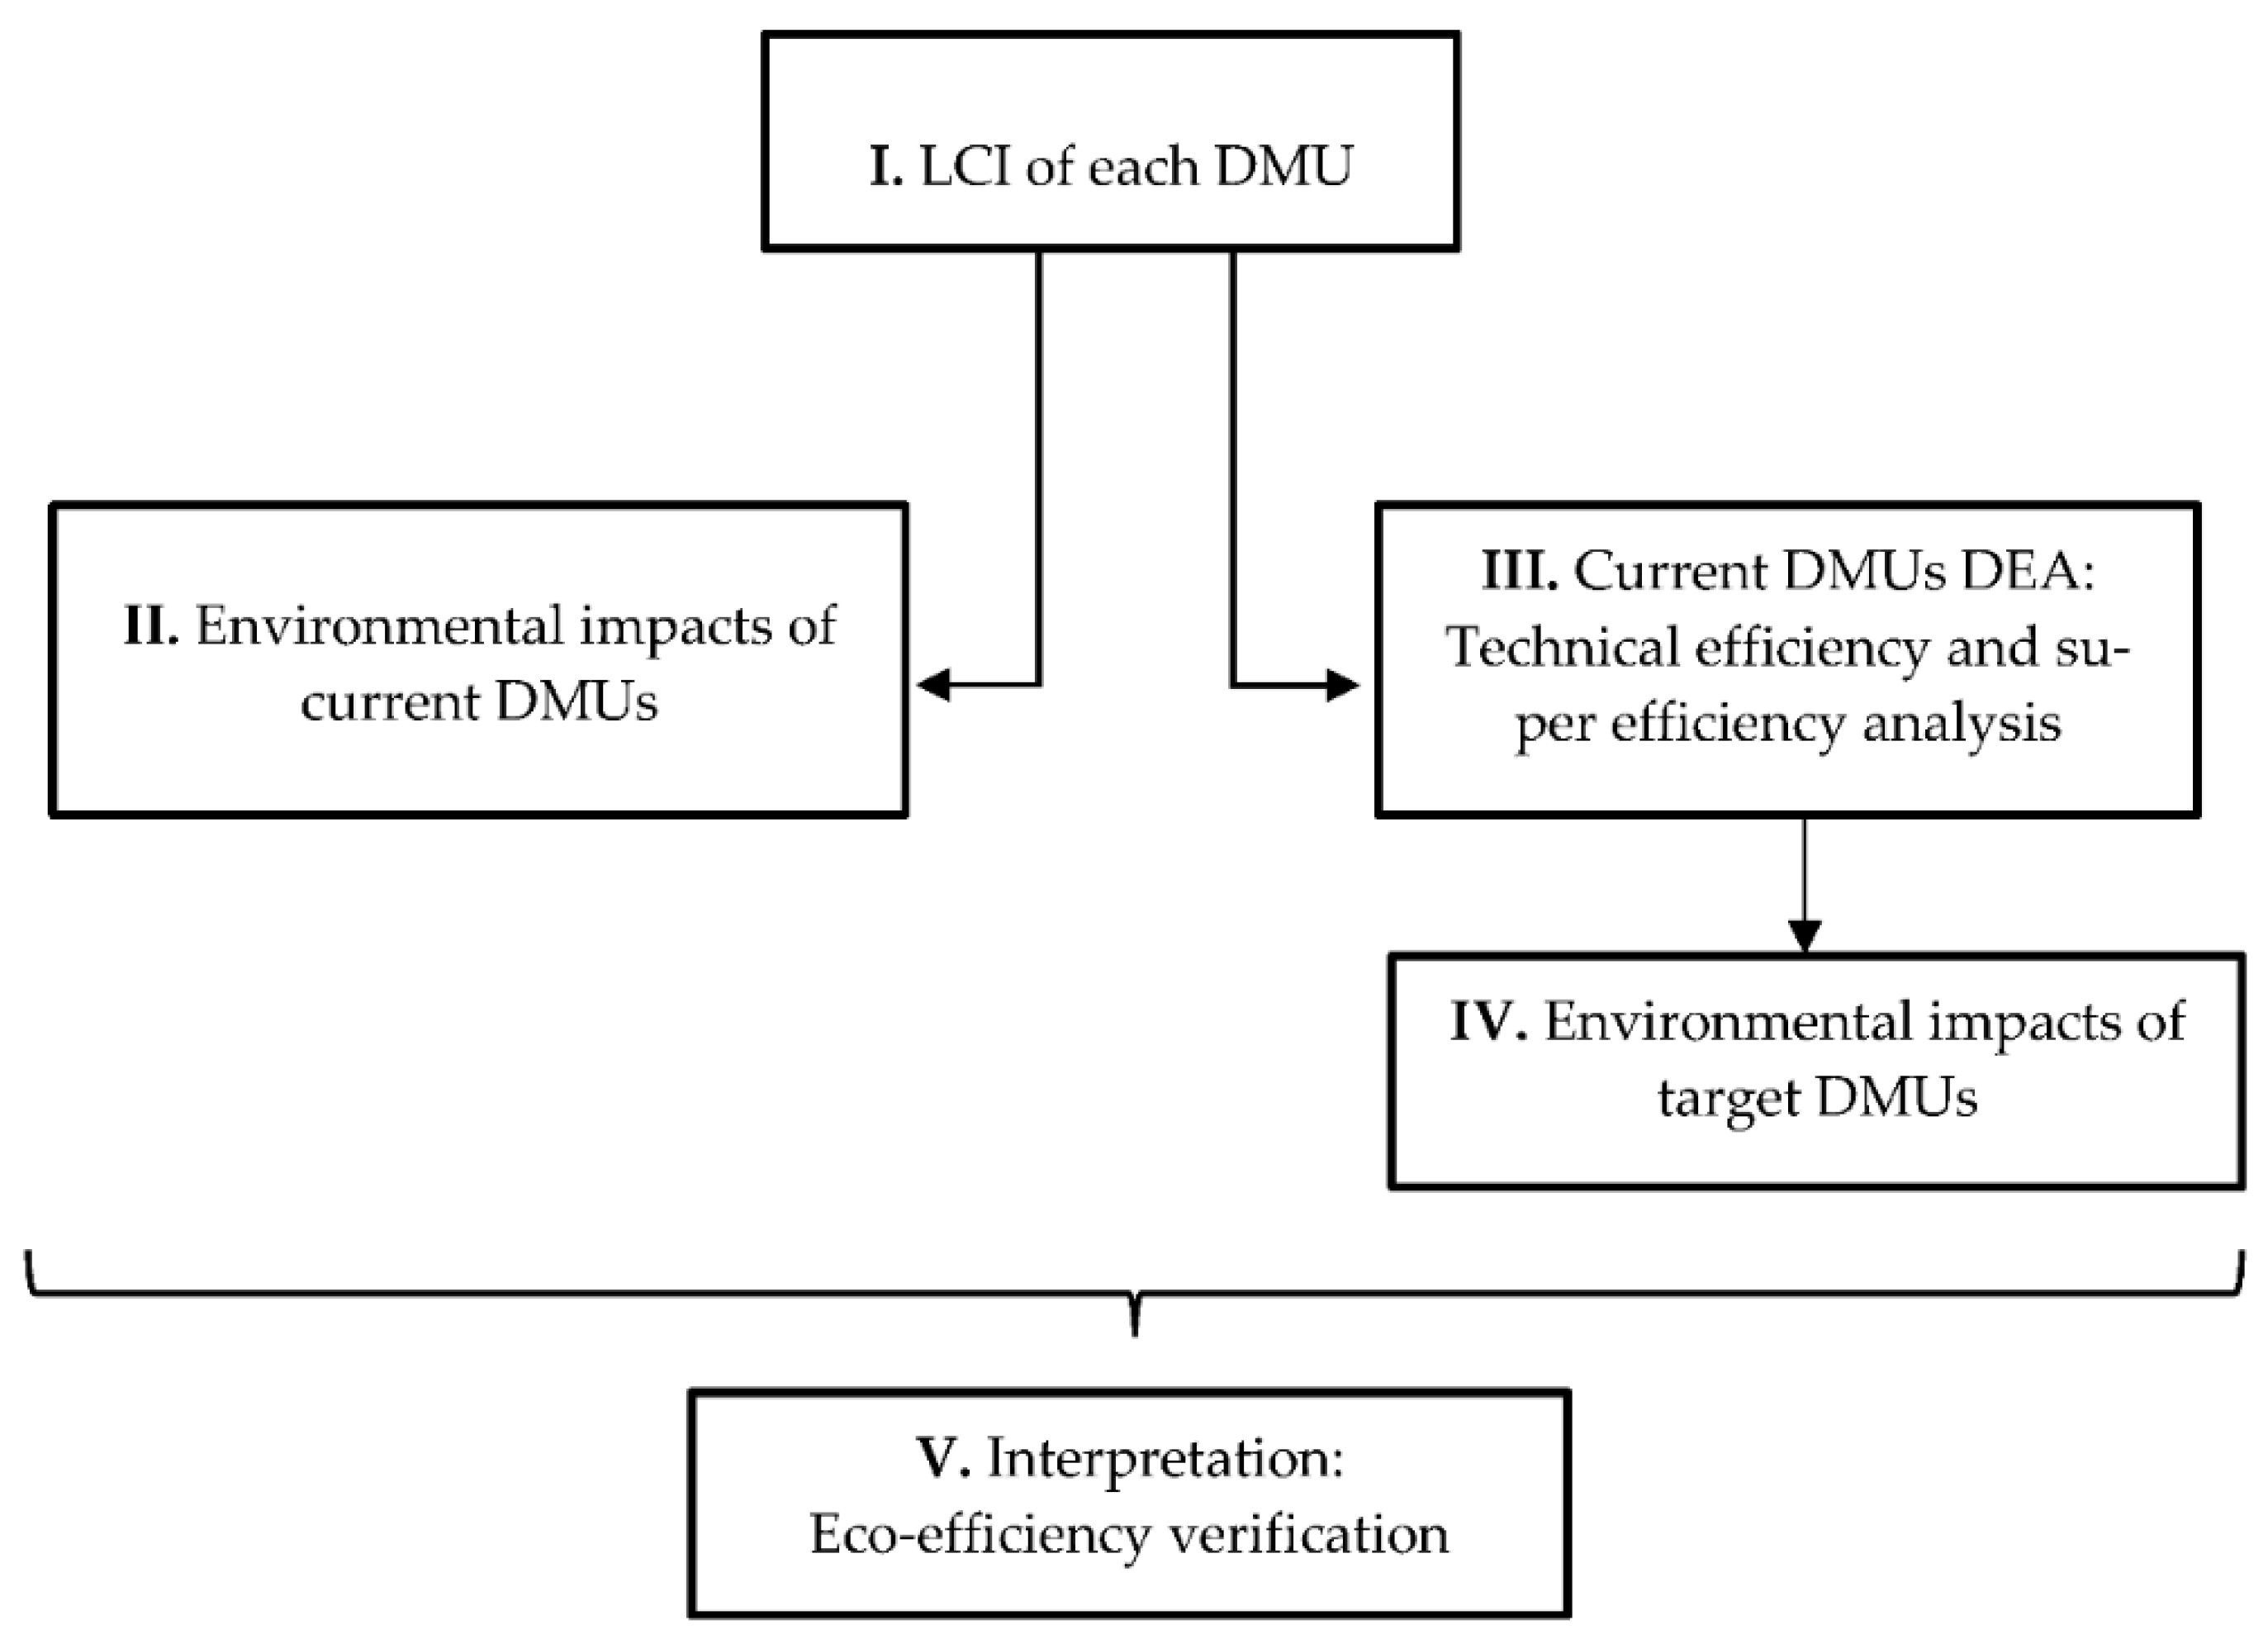
Figure 2.
Five-step LCA + DEA methodology for wheat production.
- Collection of input and output data to carry out the life cycle inventory (LCI) analysis of each DMU.
- Environmental life cycle impact assessment (LCIA) for the environmental characterization of each DMU.
- DEA study of the sample of DMUs using the environmental impact indicators obtained, as DEA inputs.
- LCIA of the target DMUs using the new LCI data.
- Interpretation of the results based on the eco-efficiency criteria.
Robust data availability for the inputs ensures the calculation of reliable eco-efficiency scores and the subsequent determination of the target (desired, acceptable or recommended) environmental impacts for the DMUs deemed inefficient. This systematic approach towards the setting of acceptable impacts makes this approach an effective and applicable tool for decision-makers in the agricultural sectors/national government bodies.
2.5. In-Situ Emissions and Environmental Impacts
Inorganic fertilizers (urea being the most common one applied to wheat fields in Iran) result in in-situ emissions into the atmosphere—ammonia (NH3), nitrous oxide (N2O), nitrogen oxides (NOx), and CO2. Owing to the difficulty of obtaining specific emission factors for the region being studied, the emissions of N2O and CO2 from urea applied to the fields were estimated using the IPCC 2006 guidelines [40], as 1% of the applied N for N2O, and 20% of the urea for CO2. The emissions of ammonia (NH3) and nitrogen oxides (NOx) were calculated using the emission factors suggested by Nemecek and Schnetzer [41]. The same publication also served as the source for the methodology used to calculate the emissions to water and soil. The former included nitrates (NO3−) from leaching, heavy metal emissions from lixiviation and erosion, phosphates (PO43−) from runoff and lixiviation, and phosphorus (P) from erosion, whereas the latter included heavy metals and pesticides. The superficial plant residues were excluded from the calculations, as these are usually removed from the fields. However, emissions of the greenhouse gas nitrous oxide (N2O) attributable to the sub-surface residues were accounted for by adhering to the IPCC 2006 guidelines [40]. The authors also considered all the electricity used in the system to be sourced from natural gas-fired thermal plants supplying to the grid, again a very reasonable assumption, considering that natural gas dominates the electricity mix in the country. Environmental impacts due to the change of land-use were not considered in this study, as the wheat fields have been in cultivation for a long time (typically over a decade).
As far as the environmental impact categories are concerned, the global warming potential (GWP-100 years), acidification potential (AP), eutrophication potential (EP), and the non-renewable energy use (NREU) of the DMUs were considered, as these are the commonly-chosen categories in E-LCA literature on cereal production [9,42]. The E-LCA for the inventory tabulated in Table S1 in Supplementary Information (SI), using ‘1 kg wheat harvested (clean grains) and delivered to the wheat flour mill’ as the functional unit, was conducted using SimaPro software [43]. Therefore, the scope of this E-LCA study is restricted to ‘cradle-to-gate’, as the ‘end-of-life’ of the cultivated wheat has not been accounted for. It focuses primarily on the consumption of materials and the use of energy associated with direct farming practices.
3. Results and Discussion
3.1. Calculated Environmental Impacts
Table 1 below lists the specific emission factors with respect to the chosen functional unit for the analysis. The average greenhouse gas (GHG) footprint, acidification, eutrophication, and non-renewable energy use were 562.6 g CO2-eq, 8.7 g SO2-eq, 17.2 g NO3-eq. and 7.1 MJ per kg wheat production, respectively (Table 1). The GWP value obtained in this analysis tallied closely with those obtained in other studies on wheat production (see Table 2). In another study in which the GHG footprint of durum wheat production was calculated to be 1.6 kg CO2-eq in Iran [17], the GHG emissions related to land use change were included in addition to fertilizer application, farm operations, and production of farm inputs.
Table 1.
Environmental characterization for the functional unit—1 kg of wheat harvested and delivered to the flour mill—Global Warming Potential (GWP), Acidification Potential (AP), Eutrophication Potential (EP) and Non-Renewable Energy (NRE) use.
Table 2.
Values of carbon footprints reported for wheat grain in earlier studies.
3.2. Interpretation of the Results
A contribution analysis, shown in Table 1 (the figures in the parentheses), revealed that the use of diesel as fuel dominates the GWP-pie with 36%, followed closely by fertilisers (30%). The emissions of ammonia from the fields account for well over 60% of the acidification and eutrophication impacts. As far as the contributions to the non-renewable energy impact-category are concerned, fertilizer and diesel accounted for 48% and 37%, respectively. Within the category—material and energy use—electricity generation for the extraction of water for irrigation was a relatively important contributor to GHG emissions (11%) and non-renewable energy use (14%). The use of chemical products (e.g., biocides) represented the smallest share of impacts in all four categories analysed.
These results concur with those reported in Ali et al. [45], Ghahderijani [16], and Sefeedpari et al. [50]. In these three publications, the authors found that chemical fertilisers and diesel fuel dominated the environmental impacts from the wheat production systems studied. As reported in Ali et al. (2017), over 52% of the total emissions were due to the upstream production and the field application of urea. A positive correlation between the nitrogen application rate and the GHG footprint was also thereby deduced in said publication.
Life-cycle GHG emissions attributable to the use of nitrogen fertilisers can be lowered by trans-materializing with organic fertilizers or soil amendments [51]. The application of biochar, a solid product of thermal decomposition of biomass, to the soil can reduce nutrient losses which occur through leaching and/or volatilization [52]. This is particularly important for nitrogen-based fertilizers, the production of which is an energy and carbon-intensive process. Biochar addition in agricultural systems can deliver a range of other co-benefits, such as the reduction of GHG emissions from soils, enhancement of soil carbon stocks, and mitigation of the GWP impact [53,54], in addition to an improvement in the soil function and crop yields, leading to greater financial benefits for the farmers [55,56]. However, further studies are recommended to determine the effect of such trans-materialisation with soil amendments on wheat productivity in the region.
If complete trans-materialisation is not possible, dematerialisation can be resorted to by consciously avoiding the use of excessive nitrogen fertilisers. Precision agriculture, whereby the synthetic fertilisers are introduced deeper into the arable soil (>5 cm deep), and practising crop rotations by cultivating legumes and availing of the symbiotic relationship they have with rhizobia to fix atmospheric nitrogen naturally into the soil, are excellent strategies which can be adopted to minimize the fertiliser-induced GHG-footprint. Farmers must be enlightened about the fact that there is no direct correlation between the use of nitrogen fertilisers and the crop-yield. Instead of the sought-after rise in crop-yield, farmers end up augmenting the environmental footprint of cultivation [57]. Upstream indirect carbon dioxide emissions aside, there are direct nitrous oxide emissions from the soil into which the fertilisers are introduced, and nitrous oxide is several times more potent as a greenhouse gas than carbon dioxide. Although annual monitoring of the soil enables researchers to obtain first-hand estimates of the release of nitrous oxide therefrom [58], such data were not available to the authors of this particular study.
3.3. DEA Performance
A DEA matrix with the most relevant inputs and outputs was set up based on the life-cycle inventory data. The DEA optimization model enables the calculation of the Technical Efficiency (TE) for each wheat farm (see Table S2 in SI) and the determination of operational targets for the inputs and outputs considered, as benchmarks. The mean TE for all the wheat farms was calculated to be 73%. Those facilities with technical efficiency TE = 1 (in other words, the efficient farms) were excluded from the listing in the Table. Based on the analysis, 27 farms (16% of the sample) were deemed to be efficient. The remaining are inefficient owing to the wasteful usage of energy (diesel and electricity) and chemical fertilizers. Therefore, it is mandatory to modify the pattern of usage of input resources on these inefficient farms to enable them to transition towards operational efficiency.
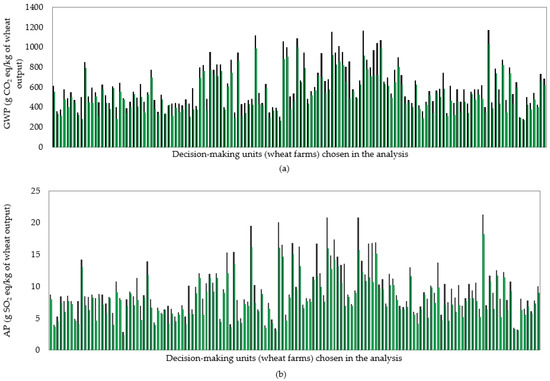
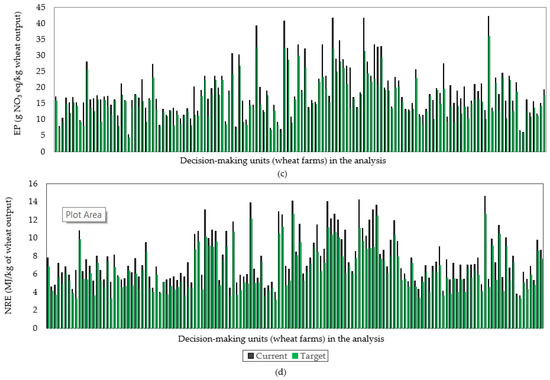
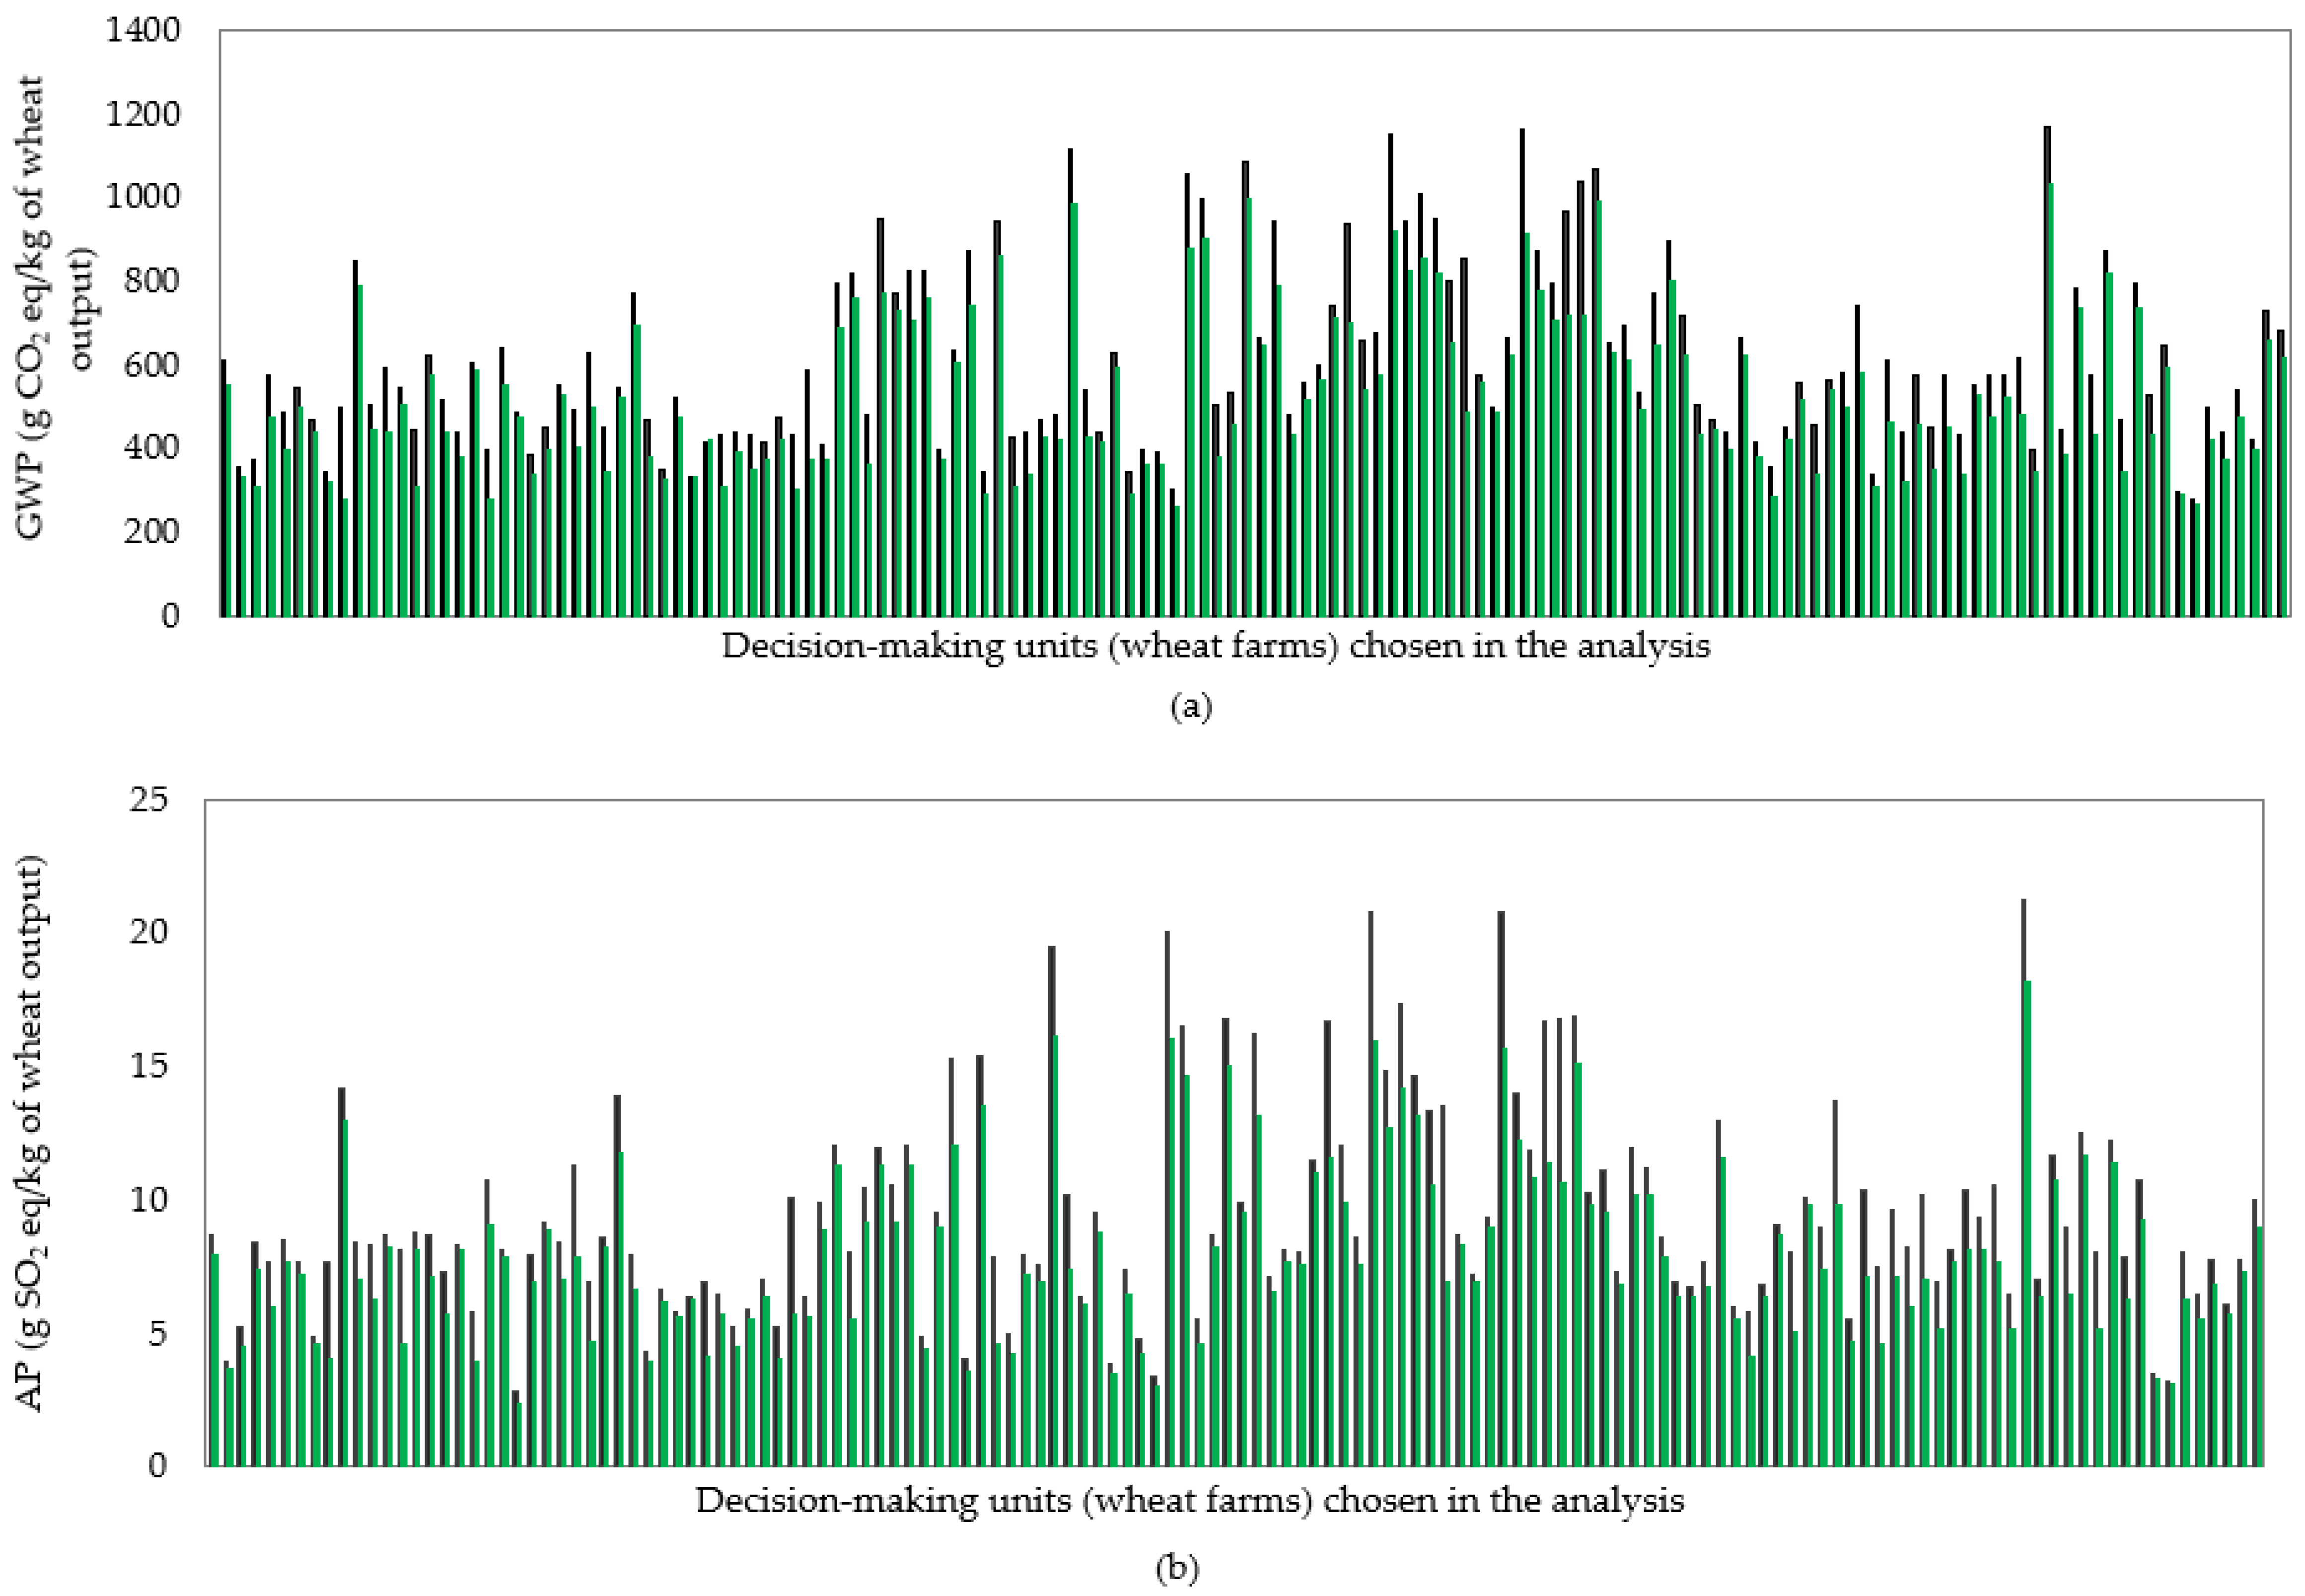
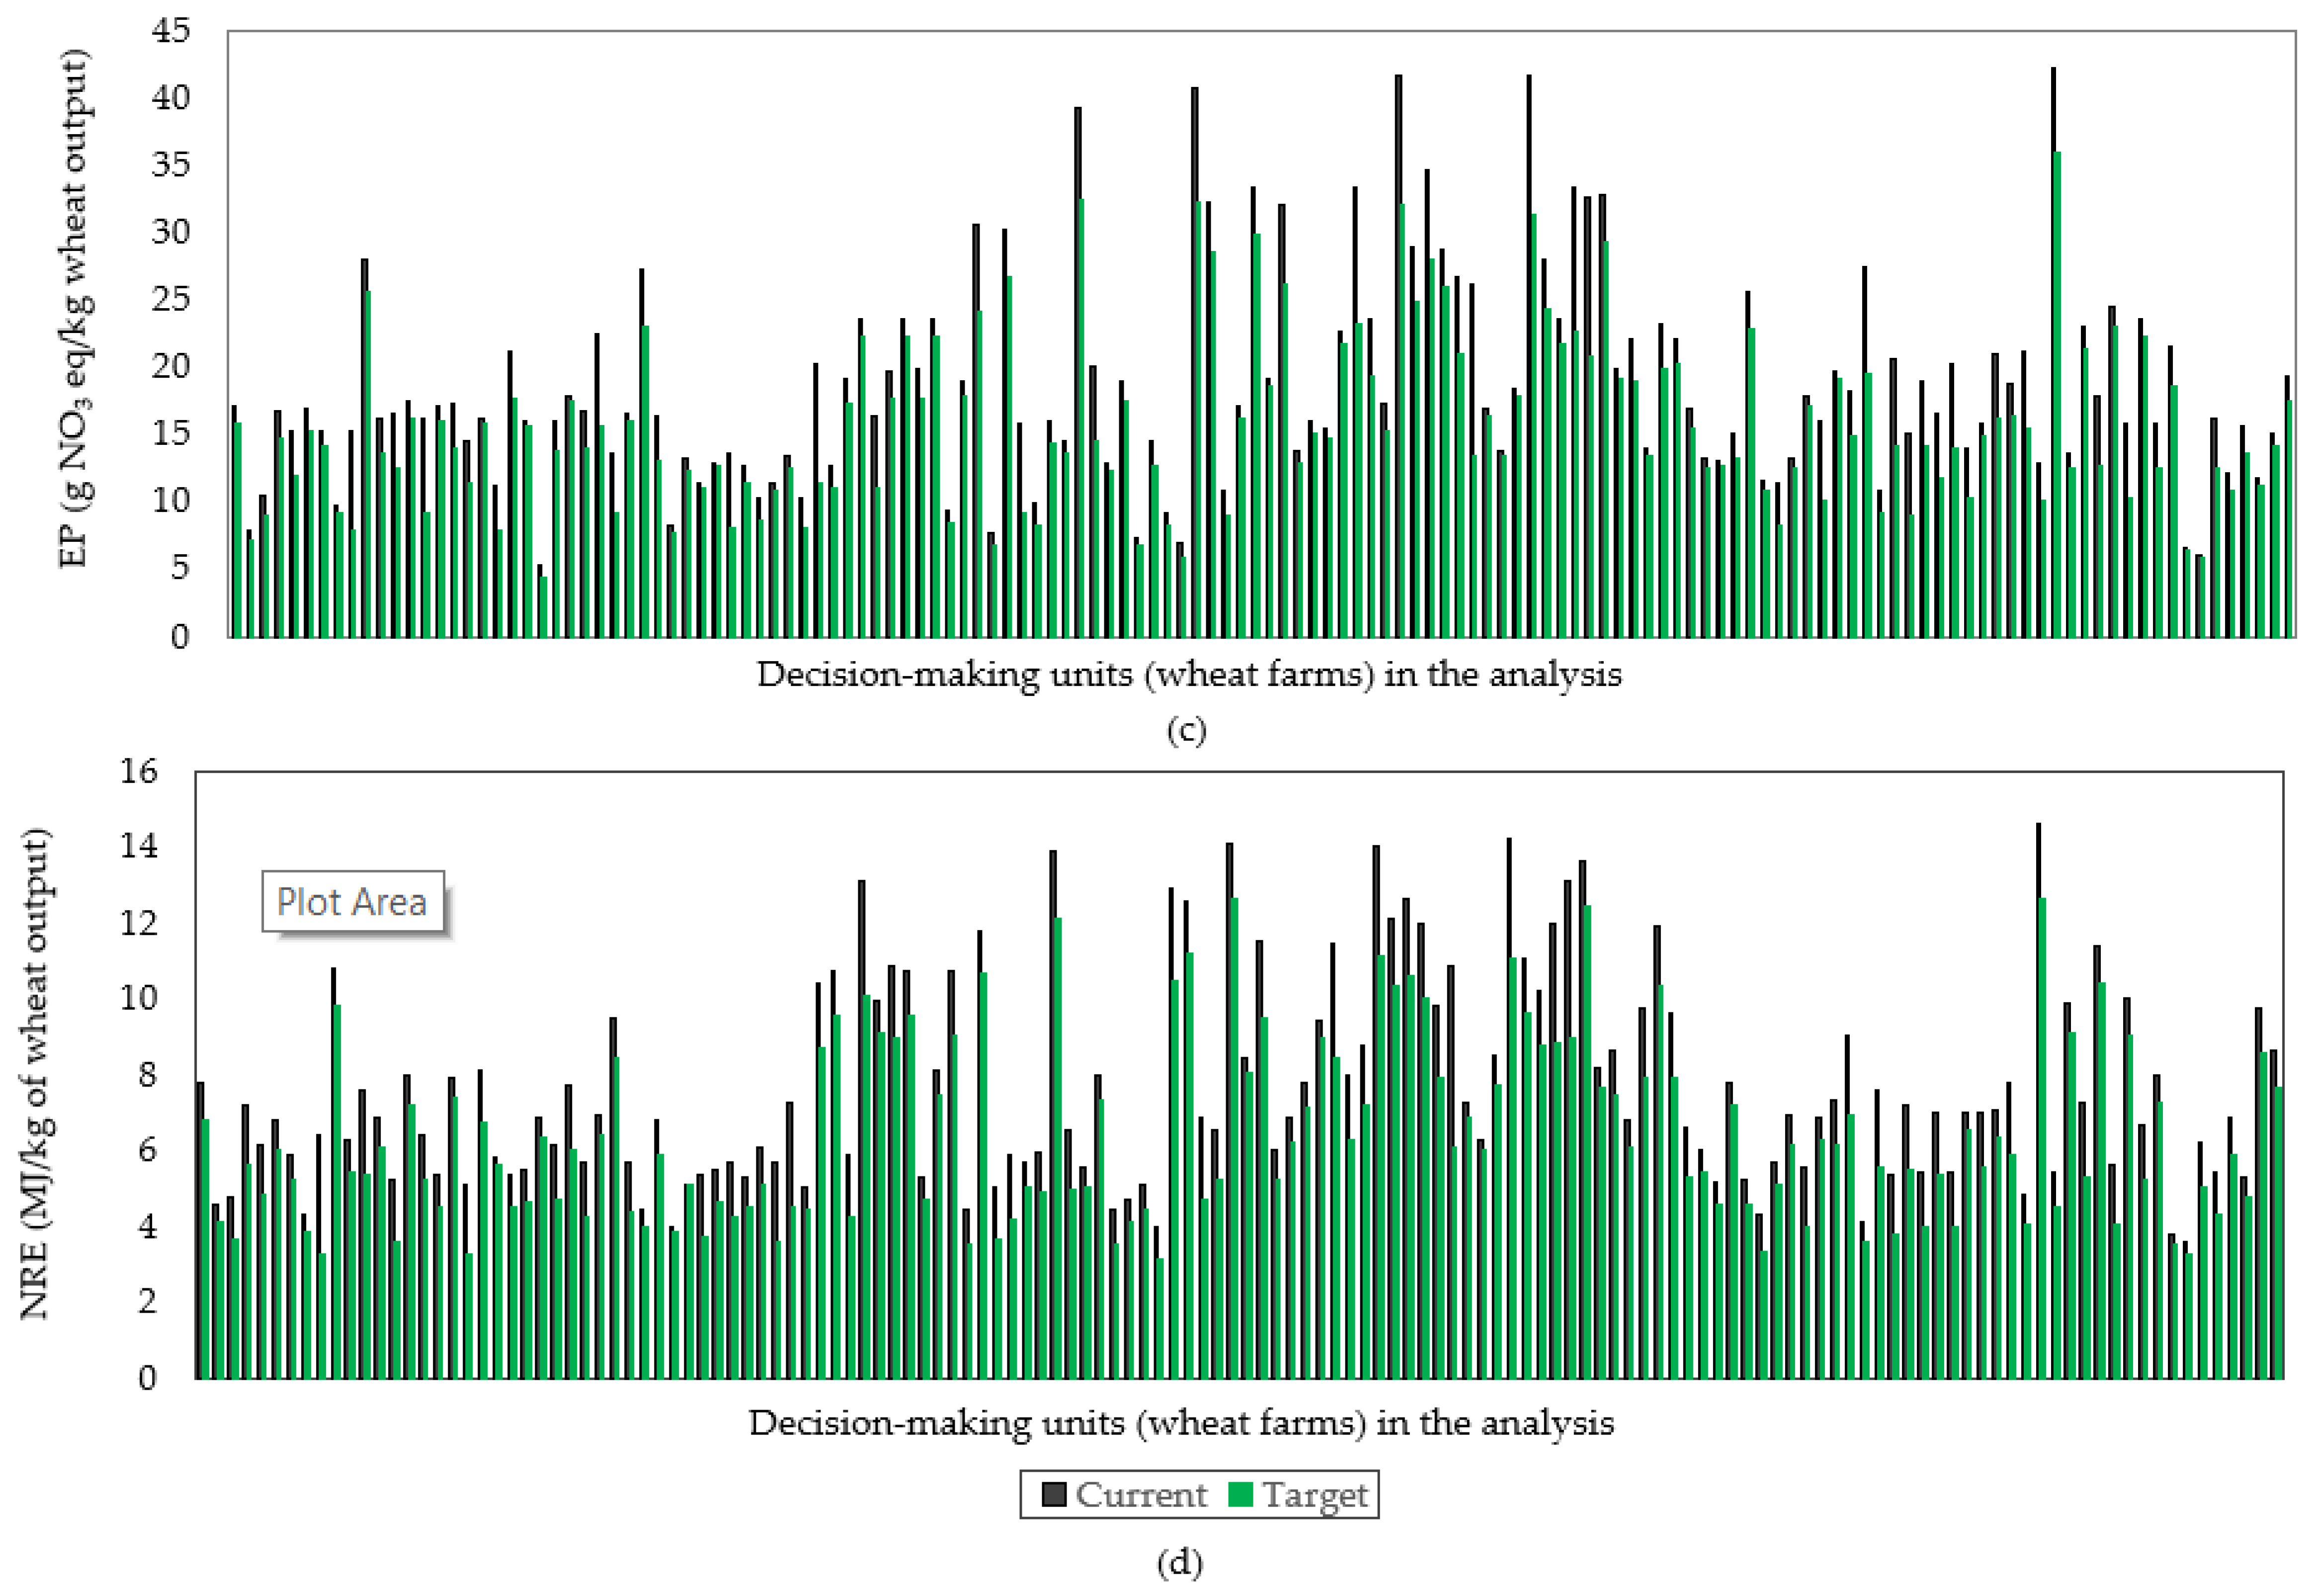
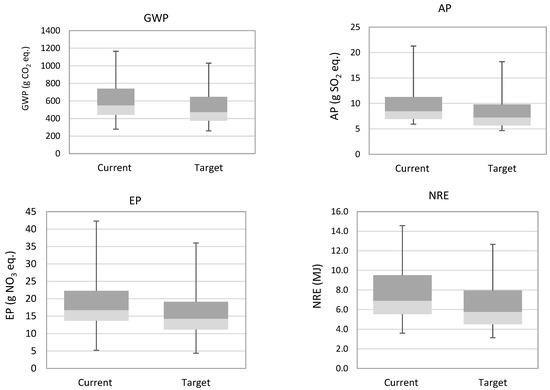
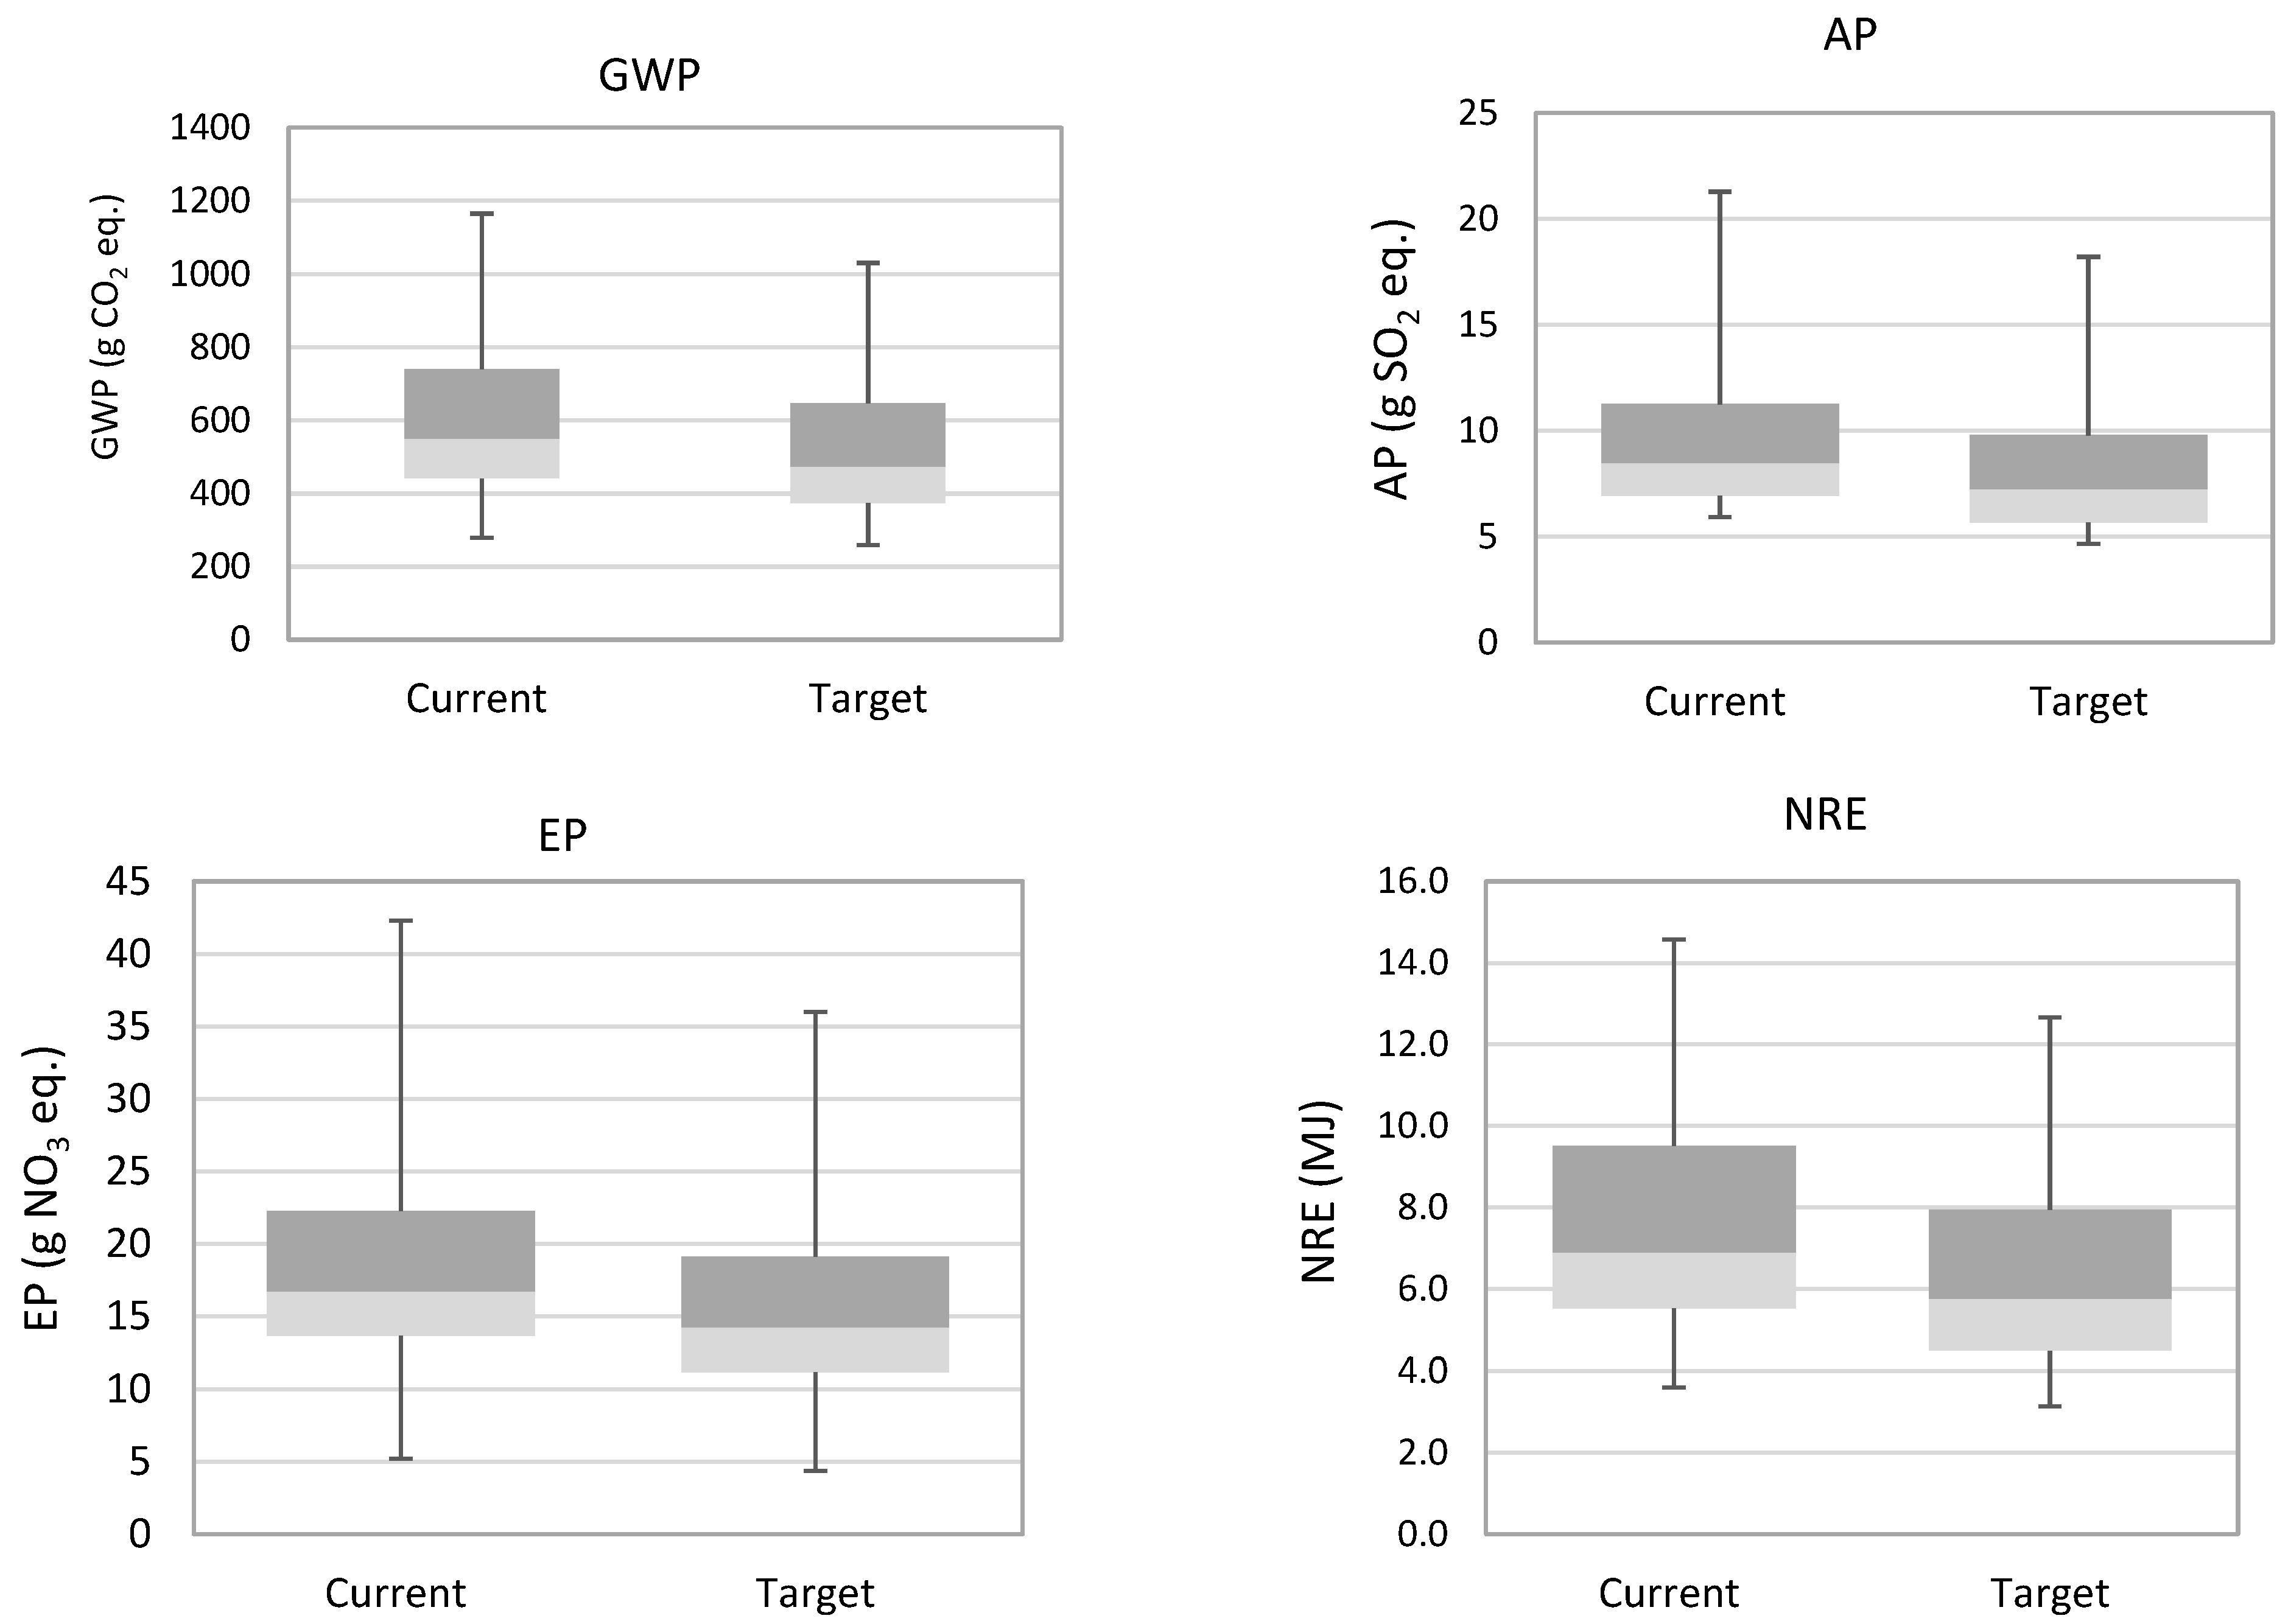
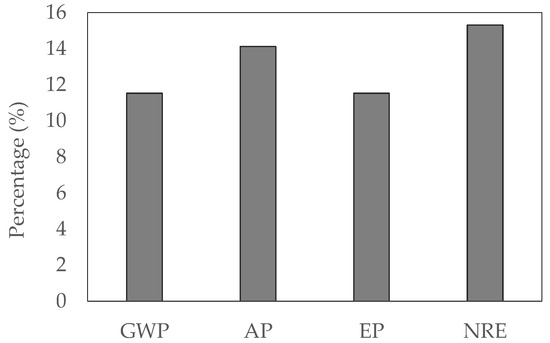
The target operating inputs (courtesy the DEA in the fourth step) led to new LCIAs involving the modified LCI data for the inefficient farms. Subsequently, a new environmental characterization was computed for these inefficient farms, under an efficient-operation scenario. Figure 3 and Figure 4 chart the environmental impacts per kg of wheat output of the original inefficient DMUs and their distribution vis-à-vis those associated with their virtual targets. As seen, and quite obviously, the environmental impacts in these ‘virtual targets’ are lower than those in the original DMUs, thanks to the optimization of the operational inputs. Figure 5 graphically shows the average reduction in the environmental impacts for the four environmental impact categories considered in this analysis. The reductions are 11% each for GWP and EP, and 14% and 15%, respectively, for AP and NRE.
Figure 3.
Environmental impact-potentials of inefficient farms and virtual targets for 1 kg wheat production ((a) GWP: Global Warming Potential, (b) AP: Acidification Potential, (c) EP: Eutrophication Potential, (d) NRE: Non-renewable Energy Use).
Figure 4.
Distribution of environmental impacts of inefficient farms in the current and target situations for 1 kg wheat production.
Figure 5.
Average possible reductions for GWP (Global Warming Potential), AP (Acidification Potential), EP (Eutrophication Potential), and NRE (Non-Renewable Energy) use for the inefficient DMUs.
With respect to the improvement in environmental performance, by resorting to operational benchmarking, important insights were obtained. The results confirm that an optimization of resource use must be planned for the wheat production units in Iran if the environmental footprint has to be truncated. This has also been advocated strongly by other researches who have applied the LCA + DEA method to agricultural production systems [59,60,61]. In other words, the crux of the LCA + DEA method is the eco-efficiency concept—Units operating inefficiently must learn from the best practices of the efficient units in the region and adopt those in order to reduce their adverse environmental impacts. It provides clearly communicable quantitative results and target operational and environmental benefits [24,33].
3.4. Super-Efficiency Analysis
A hybrid LCA + DEA analysis enables the identification of a set of best-performing units for environmental bench-marking. When DEA was applied to the sample of 169 wheat farms, the authors identified 27 efficient farms. A further whittling-down enables the identification of a smaller set of ‘best-performing units’. This simplifies the determination of the best-operating practices, which can be emulated by the inefficient DMUs in the sample. The application of a super-efficiency analysis by assigning scores greater than unity was recommended by Iribarren et al. [24].
Table S2 in SI tabulates the potential reductions which the DMUs can effect, as far as the consumption of resources is concerned, while emulating the top performers in the pack—refer to Table 3 which lists the top-27 efficient DMUs with super-efficiency scores greater than unity. In the present study, an input-oriented slack-based measure of the SE model with CRS was selected [32]. As observed, the SE lies between 1.0 and 1.53. If a cut-off criterion of Ψ > 1.2 is adopted, 13 wheat farms emerge as potential benchmarks. Pollard et al. [62] has remarked that studies of this type may be interesting and useful for policymakers and regulators.
Table 3.
Super-efficiency scores for the efficient DMUs (DMU numbers correspond to the ones in Table S2 in SI).
Benchmarking within a region is practical from a decision-making point of view as the DMUs here, by far, operate within similar socio-economic and ecological constraints and are exposed to similar weather and climatic conditions. On the basis of the recommended possible reductions in the consumption of inputs, Figure 5 estimates the average reduction in the four environmental impact categories considered in this analysis. SDG 17—Partnership for the Goals—entails learning and sharing, both intra-regional and inter-regional. Improving (and helping to improve) economic and environmental performance, by knowledge sharing and emulating best practices, is indispensable for sustainable development. However, there are some lock-ins, like the electricity (or in general, the energy) mix which a country like Iran adopts. It is composed almost entirely of fossil fuels (dominated by natural gas, which one may consider to be a lesser evil than coal), owing to its local availability. Farmers, therefore, do not have much of a choice if they wish to switch to alternatives. For this reason, as seen in Figure 5, the greatest possible reduction is seen in the non-renewable energy use if farmers resort to optimising the consumption of resources—be they fertilisers, pesticides, diesel, or electricity. Organic fertilisers may be considered if circular-economy concepts catch up in the country and are promoted top-down.
4. Conclusions
This research based itself on the premise that an increase in wheat yields is very much necessary in countries like Iran, as a socio-economic goal on the one hand, and as a geopolitical one on the other, in order to attain self-sufficiency in the production of a staple food commodity. However, the authors have argued in favour of sustainability, whereby multiple SDGs can be targeted—Zero Hunger, Good Health and Well-Being, Life on Land, and Life Below Water and Climate Change. Using E-LCA and DEA, 169 wheat farms—referred to as Decision-Making Units—were selected for the analysis in the Golestan region in north-eastern Iran. Farmers were contacted directly for data regarding the inputs to, and outputs from their farms.
In a 2-step process, the technical efficiencies of the DMUs were calculated, and on the basis of the subsequent calculation of the Super Efficiency, 27 efficient wheat farms were identified. These were used for the benchmarking of performance. The potential reductions in the consumption of resources and, thereby, in the environmental foot-prints of the DMUs (if the inefficient DMUs would strive to adopt the best practices of the efficient farms in the sample) were determined. Although this may seem like a simplified analysis, the use of DEA in combination with E-LCA tides over several limitations that the results of an E-LCA performed on an ‘average wheat farm’ will have. However, the proposed methodology shows a possible reduction of between 10% and 16% in global warming, acidification, eutrophication, and non-renewable energy usage of the wheat cultivation systems in alignment with sustainable development guidelines. Some of the findings are summarized hereunder, as recommendations for farmers and policymakers in Iran:
- Benchmarking within a region is practical from a decision-making point of view.
- Policymakers—as stakeholders—must pay attention to prevalent lock-ins, like the electricity/energy-mix in Iran, which is dominated by fossil fuels, and attempt to ‘green’ it, going forward, towards achieving the SDGs set for year-2030.
- Farmers at the heart of the wheat value chain here, must be encouraged to optimize (dematerialize) the utilization of resources—be they fertilizers, water, pesticides or energy.
- Organic fertilizers must be promoted (trans-materialization) through a combination of top-down (policy-oriented) and bottom-up (learning and sharing knowledge) approach, which may encourage farmers to use crop residues in a better way for their material value.
- Crop rotation can be recommended/mandated in order to retain the fertility of the arable soil and minimize the requirement for synthetic fertilizers.
In addition to working towards the five social and environmental SDGs named above, learning from others and sharing knowledge about best practices—SDG 17—is indispensable for the attainment of the other 16 SDGs, in general. The authors would like to recommend this approach for the eco-efficiency analysis of agricultural systems around the world.
Supplementary Materials
The following supporting information can be downloaded at: www.mdpi.com/article/10.3390/agriculture12071031/s1, Table S1: The farm input and output data (quantity per ha-annual) for DEA matrix for 169 wheat farms; Table S2: Technical efficiency (TE) and operational reduction (%) of inputs for the inefficient wheat fields.
Author Contributions
Conceptualization, A.M. and S.R.; methodology, A.M.; software, A.M.; validation, A.M. and S.R.; formal analysis, A.M.; investigation, A.M.; resources, S.R.; data curation, A.M.; writing—original draft preparation, A.M. and S.E.; writing—review and editing, G.V. and S.E.; visualization, A.M.; supervision, S.R.; project administration, A.M.; All authors have read and agreed to the published version of the manuscript.
Funding
This research received no external funding.
Institutional Review Board Statement
Not applicable.
Informed Consent Statement
Not applicable.
Data Availability Statement
Not applicable.
Acknowledgments
The authors would like to thank the wheat growers for taking the time to complete the questionnaires.
Conflicts of Interest
The authors declare no conflict of interest.
References
- Kearney, J. Food consumption trends and drivers. Philos. Trans. R. Soc. B Biol. Sci. 2010, 365, 2793–2807. [Google Scholar] [CrossRef] [PubMed]
- FAO. Global Information and Early Warning System on Food and Agriculture. Available online: http://www.fao.org. (accessed on 30 March 2022).
- GmbH, S. 2021. Available online: www.statista.com (accessed on 30 March 2022).
- Rafiee, H.; Aminizadeh, M.; Hosseini, E.M.; Aghasafari, H.; Mohammadi, A. A cluster analysis on the energy use indicators and carbon footprint of irrigated wheat cropping systems. Sustainability 2022, 14, 4014. [Google Scholar] [CrossRef]
- Lak, M. Estimation of wheat cultivation mechanization status in Iran. Asian J. Agric. Sci. 2011, 3, 51–55. [Google Scholar]
- Namdari, M.; Mohammadi, A.; Ghasemi Mobtaker, H. Assessment of energy requirements and sensitivity analysis of inputs for watermelon production in Iran. Int. J. Plant Anim. Environ. Sci. 2011, 1, 102–110. [Google Scholar]
- Fantin, V.; Righi, S.; Rondini, I.; Masoni, P. Environmental assessment of wheat and maize production in an Italian farmers’ cooperative. J. Clean. Prod. 2017, 140, 631–643. [Google Scholar] [CrossRef]
- Ghasemi-Mobtaker, H.; Kaab, A.; Rafiee, S. Application of life cycle analysis to assess environmental sustainability of wheat cultivation in the west of Iran. Energy 2020, 193, 116768. [Google Scholar] [CrossRef]
- Lares-Orozco, M.F.; Robles-Morúa, A.; Yepez, E.A.; Handler, R.M. Global warming potential of intensive wheat production in the Yaqui Valley, Mexico: A resource for the design of localized mitigation strategies. J. Clean. Prod. 2016, 127, 522–532. [Google Scholar] [CrossRef]
- Gasso, V.; Oudshoorn, F.W.; Sørensen, C.A.G.; Pedersen, H.H. An environmental life cycle assessment of controlled traffic farming. J. Clean. Prod. 2014, 73, 175–182. [Google Scholar] [CrossRef]
- ISO. Environmental Management. Life Cycle Assessment—Principles and Framework. Geneva. 2006. Available online: http://www.iso.org/iso/catalogue_detail?csnumber=37456 (accessed on 30 March 2022).
- Nemecek, T.; Huguenin-Elie, O.; Dubois, D.; Gaillard, G.; Schaller, B.; Chervet, A. Life cycle assessment of Swiss farming systems: II. Extensive and intensive production. Agric. Syst. 2011, 104, 233–245. [Google Scholar] [CrossRef]
- Tidåker, P.; Mattsson, B.; Jönsson, H. Environmental impact of wheat production using human urine and mineral fertilisers—A scenario study. J. Clean. Prod. 2007, 15, 52–62. [Google Scholar] [CrossRef]
- Masuda, K. Measuring eco-efficiency of wheat production in Japan: A combined application of life cycle assessment and data envelopment analysis. J. Clean. Prod. 2016, 126, 373–381. [Google Scholar] [CrossRef]
- Fallahpour, F.; Aminghafouri, A.; Ghalegolab Behbahani, A.; Bannayan, M. The environmental impact assessment of wheat and barley production by using life cycle assessment (LCA) methodology. Environ. Dev. Sustain. 2012, 14, 979–992. [Google Scholar] [CrossRef]
- Ghahderijani, M.; Komleh, S.H.P.; Keyhani, A.; Sefeedpari, P. Energy analysis and life cycle assessment of wheat production in Iran. Afr. J. Agric. Res. 2013, 8, 1929–1939. [Google Scholar]
- Heidari, M.D.; Mobli, H.; Omid, M.; Rafiee, S.; Jamali Marbini, V.; Elshout, P.M.F.; Van Zelm, R.; Huijbregts, M.A.J. Spatial and technological variability in the carbon footprint of durum wheat production in Iran. Int. J. Life Cycle Assess. 2017, 22, 1893–1900. [Google Scholar] [CrossRef]
- Reap, J.; Roman, F.; Duncan, S.; Bras, B. A survey of unresolved problems in life cycle assessment. Int. J. Life Cycle Assess. 2008, 13, 374. [Google Scholar] [CrossRef]
- Sala, S.; Farioli, F.; Zamagni, A. Life cycle sustainability assessment in the context of sustainability science progress (part 2). Int. J. Life Cycle Assess. 2013, 18, 1686–1697. [Google Scholar] [CrossRef]
- Benoit, S.; Margni, M.; Bouchard, C.; Pouliot, Y. A workable tool for assessing eco-efficiency in dairy processing using process simulation. J. Clean. Prod. 2019, 236, 117658. [Google Scholar] [CrossRef]
- Mousavi-Avval, S.H.; Rafiee, S.; Mohammadi, A. Development and evaluation of combined adaptive neuro-fuzzy inference system and multi-objective genetic algorithm in energy, economic and environmental life cycle assessments of oilseed production. Sustainability 2021, 13, 290. [Google Scholar] [CrossRef]
- Pereira, C.P.; Prata, D.M.; Santos, L.d.S.; Monteiro, L.P. Development of eco-efficiency comparison index through eco-indicators for industrial applications. Braz. J. Chem. Eng. 2018, 35, 69–90. [Google Scholar] [CrossRef]
- Vázquez, D.; Guillén-Gosálbez, G. Process design within planetary boundaries: Application to CO2 based methanol production. Chem. Eng. Sci. 2021, 246, 116891. [Google Scholar] [CrossRef]
- Iribarren, D.; Vázquez-Rowe, I.; Moreira, M.T.; Feijoo, G. Further potentials in the joint implementation of life cycle assessment and data envelopment analysis. Sci. Total Environ. 2010, 408, 5265–5272. [Google Scholar] [CrossRef]
- Mohammadi, A.; Rafiee, S.; Jafari, A.; Keyhani, A.; Dalgaard, T.; Knudsen, M.T.; Nguyen, T.L.T.; Borek, R.; Hermansen, J.E. Joint life cycle assessment and data envelopment analysis for the benchmarking of environmental impacts in rice paddy production. J. Clean. Prod. 2015, 106, 521–532. [Google Scholar] [CrossRef]
- Mohammadi, A.; Rafiee, S.; Jafari, A.; Dalgaard, T.; Knudsen, M.T.; Keyhani, A.; Mousavi-Avval, S.H.; Hermansen, J.E. Potential greenhouse gas emission reductions in soybean farming: A combined use of Life Cycle Assessment and Data Envelopment Analysis. J. Clean. Prod. 2013, 54, 89–100. [Google Scholar] [CrossRef]
- Cooper, W.W.; Seiford, L.M.; Tone, K. Data Envelopment Analysis: A Comprehensive Text with Models, Applications, References and DEA-Solver Software; Springer Science & Business Media: New York, NY, USA, 2007. [Google Scholar]
- Rebolledo-Leiva, R.; Angulo-Meza, L.; Iriarte, A.; González-Araya, M.C. Joint carbon footprint assessment and data envelopment analysis for the reduction of greenhouse gas emissions in agriculture production. Sci. Total Environ. 2017, 593–594, 36–46. [Google Scholar] [CrossRef] [PubMed]
- Vázquez-Rowe, I.; Villanueva-Rey, P.; Iribarren, D.; Teresa Moreira, M.; Feijoo, G. Joint life cycle assessment and data envelopment analysis of grape production for vinification in the Rías Baixas appellation (NW Spain). J. Clean. Prod. 2012, 27, 92–102. [Google Scholar] [CrossRef]
- Vázquez-Rowe, I.; Iribarren, D.; Moreira, M.T.; Feijoo, G. Combined application of life cycle assessment and data envelopment analysis as a methodological approach for the assessment of fisheries. Int. J. Life Cycle Assess. 2010, 15, 272–283. [Google Scholar] [CrossRef]
- Cronbach, L.J. Coefficient alpha and the internal structure of tests. Psychometrika 1951, 16, 297–334. [Google Scholar] [CrossRef] [Green Version]
- Tone, K. A slacks-based measure of efficiency in data envelopment analysis. Eur. J. Oper. Res. 2001, 130, 498–509. [Google Scholar] [CrossRef] [Green Version]
- Vázquez-Rowe, I.; Tyedmers, P. Identifying the importance of the “skipper effect” within sources of measured inefficiency in fisheries through data envelopment analysis (DEA). Mar. Policy 2013, 38, 387–396. [Google Scholar] [CrossRef]
- Laso, J.; Hoehn, D.; Margallo, M.; García-Herrero, I.; Batlle-Bayer, L.; Bala, A.; Fullana-i-Palmer, P.; Vázquez-Rowe, I.; Irabien, A.; Aldaco, R. Assessing energy and environmental efficiency of the Spanish agri-food system using the LCA/DEA Methodology. Energies 2018, 11, 3395. [Google Scholar] [CrossRef] [Green Version]
- Pardo Martínez, C.I.; Silveira, S. Analysis of energy use and CO2 emission in service industries: Evidence from Sweden. Renew. Sustain. Energy Rev. 2012, 16, 5285–5294. [Google Scholar] [CrossRef]
- Mousavi Avval, S.H.; Rafiee, S.; Jafari, A.; Mohammadi, A. Improving energy productivity of sunflower production using data envelopment analysis (DEA) approach. J. Sci. Food Agric. 2011, 91, 1885–1892. [Google Scholar] [CrossRef] [PubMed]
- Lee, H.-S.; Zhu, J. Super-efficiency infeasibility and zero data in DEA. Eur. J. Oper. Res. 2012, 216, 429–433. [Google Scholar] [CrossRef]
- Barr, R.S. Dea software tools and technology. In Handbook on Data Envelopment Analysis; Cooper, W.W., Seiford, L.M., Zhu, J., Eds.; Springer: Boston, MA, USA, 2004; pp. 539–566. [Google Scholar] [CrossRef]
- Lorenzo-Toja, Y.; Vázquez-Rowe, I.; Chenel, S.; Marín-Navarro, D.; Moreira, M.T.; Feijoo, G. Eco-efficiency analysis of Spanish WWTPs using the LCA + DEA method. Water Res. 2015, 68, 651–666. [Google Scholar] [CrossRef] [PubMed]
- IPCC. Guidelines for National Greenhouse Gas Inventories. Intergovernmental Panel of Climate Change (IPCC) (National Greenhouse Gas Inventories Programme); IPCC: Geneva, Switzerland, 2006. [Google Scholar]
- Nemecek, T.; Schnetzer, J. Methods of Assessment of Direct Field Emissions for LCIs of Agricultural Production Systems; Agroscope Reckenholz-Tänikon Research Station ART: Zurich, Switzerland, 2011. [Google Scholar]
- Houshyar, E.; Grundmann, P. Environmental impacts of energy use in wheat tillage systems: A comparative life cycle assessment (LCA) study in Iran. Energy 2017, 122, 11–24. [Google Scholar] [CrossRef]
- PRè Consultants. SimaPro 8.0.4; Environmental Database: Amersfoort, The Netherlands, 2014. [Google Scholar]
- Hayer, F.; Kägi, T.; Casado, D.; Czembor, E.; Delval, P.; Gaillard, G.; Jensen, J.; Otto, S.; Strassemeyer, J.O. 53-Life cycle assessment of wheat and apple production systems within the ENDURE project. In Proceedings of the ENDURE International Conference, La Grande-Motte, France, 12–15 October 2008. [Google Scholar]
- Ali, S.A.; Tedone, L.; Verdini, L.; De Mastro, G. Effect of different crop management systems on rainfed durum wheat greenhouse gas emissions and carbon footprint under Mediterranean conditions. J. Clean. Prod. 2017, 140, 608–621. [Google Scholar]
- Mondani, F.; Aleagha, S.; Khoramivafa, M.; Ghobadi, R. Evaluation of greenhouse gases emission based on energy consumption in wheat Agroecosystems. Energy Rep. 2017, 3, 37–45. [Google Scholar] [CrossRef]
- Syp, A.; Faber, A.; Borzęcka-Walker, M.; Osuch, D. Assessment of greenhouse gas emissions in winter wheat farms using data envelopment analysis approach. Pol. J. Environ. Stud. 2015, 24, 2197–2203. [Google Scholar] [CrossRef]
- Audsley, E.; Brander, M.; Chatterton, J.C.; Murphy-Bokern, D.; Webster, C.; Williams, A.G. How Low Can We Go? An Assessment of Greenhouse Gas Emissions from the UK Food System and the Scope Reduction by 2050. Report for the WWF and Food Climate Research Network; WWF-UK: Surrey, UK, 2010. [Google Scholar]
- Jalali, A.; Maysami, M. Environmental life cycle assessment (LCA) of wheat cultivation in agro industry company of Iranian Novin (Aq-Qala). Nveo-Nat. Volatiles Essent. Oils J. NVEO 2021, 8, 5905–5916. [Google Scholar]
- Sefeedpari, P.; Ghahderijani, M.; Pishgar-Komleh, S. Assessment the effect of wheat farm sizes on energy consumption and CO2 emission. J. Renew. Sustain. Energy 2013, 5, 23131. [Google Scholar] [CrossRef]
- Sadaf, J.; Shah, G.A.; Shahzad, K.; Ali, N.; Shahid, M.; Ali, S.; Hussain, R.A.; Ahmed, Z.I.; Traore, B.; Ismail, I.M. Improvements in wheat productivity and soil quality can accomplish by co-application of biochars and chemical fertilizers. Sci. Total Environ. 2017, 607, 715–724. [Google Scholar] [CrossRef] [PubMed]
- Mohammadi, A.; Sandberg, M.; Venkatesh, G.; Eskandari, S.; Dalgaard, T.; Joseph, S.; Granström, K. Environmental analysis of producing biochar and energy recovery from pulp and paper mill biosludge. J. Ind. Ecol. 2019, 23, 1039–1051. [Google Scholar] [CrossRef]
- Mohammadi, A.; Khoshnevisan, B.; Venkatesh, G.; Eskandari, S. A critical review on advancement and challenges of biochar application in Paddy fields: Environmental and life cycle cost analysis. Processes 2020, 8, 1275. [Google Scholar] [CrossRef]
- Mohammadi, A.; Cowie, A.L.; Mai, T.L.A.; Brandao, M.; de la Rosa, R.A.; Kristiansen, P.; Joseph, S. Climate-change and health effects of using rice husk for biochar-compost: Comparing three pyrolysis systems. J. Clean. Prod. 2017, 162, 260–272. [Google Scholar] [CrossRef]
- Khan, Z.; Haider, G.; Amir, R.; Ikram, R.M.; Ahmad, S.; Schofield, H.K.; Riaz, B.; Iqbal, R.; Fahad, S.; Datta, R. Chemical and biological enhancement effects of biochar on wheat growth and yield under arid field conditions. Sustainability 2021, 13, 5890. [Google Scholar] [CrossRef]
- Mohammadi, A.; Cowie, A.L.; Cacho, O.; Kristiansen, P.; Mai, T.L.A.; Joseph, S. Biochar addition in rice farming systems: Economic and energy benefits. Energy 2017, 140, 415–425. [Google Scholar] [CrossRef]
- Wójcik-Gront, E. Variables influencing yield-scaled Global Warming Potential and yield of winter wheat production. Field Crops Res. 2018, 227, 19–29. [Google Scholar] [CrossRef]
- Zhou, M.; Zhu, B.; Wang, X.; Wang, Y. Long-term field measurements of annual methane and nitrous oxide emissions from a Chinese subtropical wheat-rice rotation system. Soil Biol. Biochem. 2017, 115, 21–34. [Google Scholar] [CrossRef]
- Payandeh, Z.; Jahanbakhshi, A.; Mesri-Gundoshmian, T.; Clark, S. Improving energy efficiency of barley production using joint data envelopment analysis (DEA) and life cycle assessment (LCA): Evaluation of greenhouse gas emissions and optimization approach. Sustainability 2021, 13, 6082. [Google Scholar] [CrossRef]
- Angulo-Meza, L.; González-Araya, M.; Iriarte, A.; Rebolledo-Leiva, R.; de Mello, J.C.S. A multiobjective DEA model to assess the eco-efficiency of agricultural practices within the CF+ DEA method. Comput. Electron. Agric. 2019, 161, 151–161. [Google Scholar] [CrossRef]
- Pishgar-Komleh, S.H.; Zylowski, T.; Rozakis, S.; Kozyra, J. Efficiency under different methods for incorporating undesirable outputs in an LCA+ DEA framework: A case study of winter wheat production in Poland. J. Environ. Manag. 2020, 260, 110138. [Google Scholar] [CrossRef] [PubMed]
- Pollard, S.J.; Davies, G.J.; Coley, F.; Lemon, M. Better environmental decision making—recent progress and future trends. Sci. Total Environ. 2008, 400, 20–31. [Google Scholar] [CrossRef] [PubMed]


Publisher’s Note: MDPI stays neutral with regard to jurisdictional claims in published maps and institutional affiliations. |
© 2022 by the authors. Licensee MDPI, Basel, Switzerland. This article is an open access article distributed under the terms and conditions of the Creative Commons Attribution (CC BY) license (https://creativecommons.org/licenses/by/4.0/).