1. Introduction
One of humanity’s current priorities is to ensure global food security, but a growing population necessitates more food. Food producers must produce greater quantities at lower prices [
1,
2]. Non-renewable resources are shrinking and their cost is increasing [
3]. Pressure on non-renewable resources such as labor will increase. Employees have to work more efficiently to allow a cost reduction per unit of produced food [
4]. Employees are overworked and dissatisfied because they are asked to work more and the benefits are insufficient in comparison to the effort put into increasing labor productivity [
5].
Improving human resource management in Romania is particularly important due to communist relics, a still deficient education system, and the unprecedented global economic dynamics in which Romanian companies now compete [
6]. On top of this, there is a massive migration of labor to countries in Western Europe. This is resulting in a decrease in the labor supply but also an increase in employee expectations of jobs in Romania [
7]. In the Romanian food industry, particularly the bakery industry, employees are subjected to harsh working conditions (high temperatures, dust, fumes, and noise) and must maintain the sector’s characteristically rapid pace. Under these conditions, particularly during critical periods, these employees abandon their jobs and migrate to other industries or countries [
8]. Increasing employee satisfaction in the food industry, and specifically in the bakery industry, is a top priority for both private and public decision-makers under the current conditions. Current scientific research provides compelling arguments for the need to determine specific levels of satisfaction by industry and even by economic unit. It also indicates that there are significant differences between the perceived levels of different aspects of satisfaction. The significance and necessity of the research presented in this scientific paper, as indicated in the paper’s title, is that it enables the determination of employee satisfaction by aspects according to the perceived intensity of each. All of these are monitored in relation to labor costs and the economic performance of companies that employ individuals. The European Foundation for the Improvement of Living and Working Conditions conducted a nationally representative study on job satisfaction in Romania [
9] from 1994 to 2004 to assist Romanian employers. Governments, via the relevant ministries, have also developed strategies for the development of the agri-food sector, with the goal of improving working conditions in food companies and boosting employee satisfaction in this sector [
10]. However, these measures are intended for all employees, regardless of branch, and their overall satisfaction. Managers in Romania recognize the significance of job satisfaction and the correlation between job satisfaction and economic performance, but believe that pay and physical working conditions reduce job satisfaction. They are also unaware of the degree to which their employees perceive the aspects of job satisfaction, nor do they have examples of how to analyze it [
11]. Basically, there is a significant gap between research in the field of human resource management and the practices of food industry managers [
12]. The use of the questionnaire presented in this article enables human resource management in food companies to be based on employees’ differentiated motivations. Managers can use these strategies to determine the employee motivation system and develop strategies to increase labor productivity. The failure to understand the employee motivation system has resulted in a labor crisis in the Romanian food industry, because the jobs offered by companies do not meet the expectations of potential employees [
9].
The primary purpose of this study was to analyze employee satisfaction in bakery companies in order to enhance their economic performance and the quality of their work processes. The mixed quantitative and qualitative design of the research methodology was implemented through an online questionnaire survey of employees and a Focus group meeting with 17 managers of the sample companies.
The analysis of employee satisfaction analysis in the bakery business in order to improve economic performance in the present study was structured into four objectives: (1) to asses employees’ motivational preferences; (2) to measure employee satisfaction; (3) to determine the impact of employee satisfaction on labor expenditure, and (4) to identify the impact of employee satisfaction on labor productivity. The first three objectives derive from the first hypothesis: If employees enjoy a high level of job satisfaction, the labor cost per unit of output is reduced. The last objective is necessary to verify the second hypothesis: if employees have a high level of job satisfaction, their labor productivity increases.
2. Literature Review
The research hypotheses examined the relationship between employee satisfaction, labor expenses, and labour output. First, if employees are highly satisfied with their jobs, labor costs per unit of output are reduced. The second hypothesis is that if employees are satisfied with their jobs, their labor productivity will increase.
Fisher, C.D. (2010) reports that a comprehensive measure of happiness at the individual level could include work engagement, job satisfaction, and affective organizational commitment. Some previous research has tended to underestimate the importance of workplace happiness [
13]. Collective well-being is positively connected with collective performance across a number of samples, industries, regions, and cultures. The research studies on group satisfaction and group effects explain the link between collective well-being and performance [
14]. Furthermore, unequivocal data on the strong direct association between job unhappiness and mental and physical health has been discovered. The discovered correlations are large and highly significant. The findings are important because they show that there could be problems, like burnout, low self-esteem, anxiety, and depression [
15].
Correct and practical evaluation of the motivation system structure allows the creation of a more relevant and effective reward system for employees [
16]. Only employee motivation is subjective, as it is dependent on the context and changes over time. Employee motivation is difficult to determine due to the complexity of factors [
12]. Employees that are happy and competent are more productive and contribute to the success of the company. As a result, it is necessary to identify their motivating system [
17]. The value chain has to meet the employees’ and customers’ needs [
18].
Research on motivation generally encompasses the causes of why people behave in a certain way. People choose a certain action process over others and continue with the chosen action for a long time despite difficulties [
19,
20,
21]. Motivations are also very important for an organization’s innovation process [
22,
23].
In terms of the motivation register, some researchers emphasize employees’ primary needs while others emphasize higher-order needs; some researchers believe that changing perceptions of social reality is necessary, while others believe that employers should conform to the system of employee motivation. Most of the time, managers analyze employees’ motivations and seek the best means of reward, leadership, and organizational context [
24]. Neglecting the needs of even one person in a system can reduce the organization’s potential [
25,
26]. However, more emphasis should be placed on cognitive foundations, biases, and education [
27].
Davidson M. et al. (2010) believe that financial benefits are an important component of employee motivation, but the tools to combat labor migration include teamwork, management support, professional development, and recognition of one’s efforts. The destabilizing factors appear to be the unsatisfactory work environment, inadequate staff, and ineffective management [
28]. According to socioeconomic news, maintaining ethical treatment of employees is becoming a central principle of organizational responsibility and a component of an employee incentive package [
29]. Organizations must be cognizant of cultural techniques, organizational principles, and job-related competencies when hiring new personnel [
30]. Stimulating pleasant conduct can be a favorable performance climate in coordinating employee relations by encouraging new employees’ guidance through mentors and friendly coworkers [
31]. Today’s egalitarian societal standards have altered the conventional family structure in which males are entrenched and women are subordinate. Nowadays, both women and men require a balance between professional and personal responsibilities. Ultimately, employer respect for personal time and life is critical to professional and personal well-being [
32].
Managing employee motivation and rewarding work requires an understanding of the unique characteristics conferred by innate characteristics, the development of competencies, and the requirement for differentiated rewards [
33]. In terms of age, various studies indicate that older employees behave less ethically than younger employees [
34], or that there is a correlation between employee age and employee requirements. The correlation appears to be stronger among older workers than among younger workers [
35].
Reward-oriented management based on a dynamic and individualized motivation system has a positive impact on employee satisfaction, self-image, trust, loyalty, teamwork, need for belonging, morale, and employee commitment [
36]. Another way to ensure that an employee’s work is efficient is to assist them in developing new skills [
37].
Job satisfaction has been reviewed in the literature in relation to work schedules, distribution of work duties, active self-regulation of own work speed [
38], active aging programs, healthy lifestyles, flexible work [
39,
40], work–life balance [
40,
41,
42,
43,
44], intergenerational cooperation and work distribution [
44,
45], working conditions, own work, interpersonal relations in the workplace, leadership in the company [
46], ensuring equitable sharing of work tasks [
47,
48], and methods to motivate employees in the workplace [
49]. These latter qualities of work environments, which are rated as employee satisfaction, are a response to prior needs or motivations.
The grouping and restructuring of all of these categories resulted in a set that included: autonomy, self-paced work, the ability to work from home, extended holidays [
40], diverse activities [
44], the possibility of a good career [
49,
50], equal treatment of employees, respect among employees [
8], the possibility of cooperating with other employees and work allocation, intergenerational cooperation [
51], higher pay, good interpersonal relations [
52], and compliments from employees for good work, flexibility, training, and education [
53].
Job satisfaction research in the food industry is infrequent at best. However, several characteristics of the motivation–employee satisfaction link in the Lithuanian food sector have been uncovered, where it was discovered that there is neither an integrated employer perspective on this subject nor employee motivation models. Individual methods of incentives are used to inspire personnel in state-owned firms at best [
54]. Some studies emphasize the link between food and creativity, enjoyment, and productivity. They show that sensory information from all sensory modalities can enhance creativity in many ways, such as modifying emotions, priming creativity, and creating unexpected connections [
55]. On the other hand, creativity might lead to more refined eating habits. Haute cuisine research reveals that some service and food enterprises are oriented toward innovation and co-innovation in collaboration with customers [
56].
The European Foundation for the Improvement of Living and Working Conditions performed a nationally representative study on work satisfaction in Romania [
57] for the period 1994–2004 and used a technique based on a scale from 1 (completely unsatisfied) to 10 (completely satisfied) and 11 facets of satisfaction, each of which was prioritized by two important or unimportant questions and the most significant facet, respectively [
58]. The findings provided an overall estimate of the population’s degree of satisfaction, but this study was too broad to be used by socioeconomic entities. Furthermore, Rose M. (2005) believes that additional study is needed to discover the relationship between the components of satisfaction and overall job satisfaction in her paper on job satisfaction in the UK [
59]. According to the Working in Britain (WiB) survey [
59], the following categories of motivation (facets) were used in this study: promotion prospects; total pay; relations with supervisor; job security; use of abilities; opportunity to show initiative; ability/efficiency of management; hours worked; fringe benefits; work itself; amount of work; variety of work; training provided; coworker friendliness. Previous research indicates that the results of single-item measurement (overall satisfaction) tend to indicate a more favorable picture of job satisfaction than the results of multi-item measurement and the facet-based or component-based job satisfaction measurement technique; thus, the cost of overall satisfaction, which is the ratio of labor expenditure to satisfaction level, was used [
60,
61].
3. Materials and Methods
In the literature, the theoretical frameworks supporting the well-being-performance relationship, the so-called happy-productive worker thesis, are based on the following: recognizing the role of satisfaction in enhancing employee performance; developing a relevant satisfaction system; identifying factors that determine differences between satisfaction systems, and creating tools to manage employee satisfaction.
The mixed quantitative and qualitative design of the research methodology presented in this study was implemented through an online questionnaire survey of employees and a Focus group online meeting with managers of the sample companies.
As part of the quantitative research conducted in the fourth quarter of 2021, 254 individuals were given 30 days to complete a three-part online questionnaire on Google Forms. The subjects were contacted by managers of the companies researched, who explained the purpose of the study and the relevance of the findings to their current work. They provided the email addresses of their employees and informed them of the need to complete the surveys. They indicated that such a survey has a positive impact on both company objectives and employee satisfaction. Emails were sent out with invitations to participate in the survey and links to the Google Forms platform.
The first section (questions 1–14) gave information regarding the importance of each type of motivation in the perspectives of employees. The second section (questions 15–28) was developed to assess employee satisfaction based on each form of incentive. The final section (questions 29–34) profiled employees based on their job experience, skill level, gender, net financial benefits, and employer.
Questionnaires were distributed to a representative sample of 254 employees from 60 companies in Romania’s NE and SE regions. At a 95% confidence level, the maximum allowable error in the data was 2.9%. In order to ensure representativeness, the stratified random sampling method was used in this research [
62].
The variables of job satisfaction and motivation that were included in the research design were chosen based on models found in the literature. Thus, gender, job experience, and skill level were extracted from the model used by the Global Employee Engagement Index, a global survey conducted by Effectory International that analyzed the work-related opinions of employees in 56 countries, including Romania [
63]. Given the traditional family structure in which men and women have fixed responsibilities, the gender of the employee can considerably influence both the perceived relevance of each facet of satisfaction and the level of satisfaction on each facet [
32]. According to Phelan et al. [
64], it is probable that women are treated differently in the workplace compared to men. Literature reveals significant differences between employees’ perceptions of job satisfaction, its components, and motivation based on job experience [
65]. Employee perceptions of job safety are influenced by education level [
66], employee productivity in relation to benefits [
67], and employee expectations in relation to company opportunities [
68].
Other factors used in the Global Employee Engagement Index model, such as full-time/part-time option, type of entity (profit/non-profit), industry, and type of work, were deemed less important than three factors specific to the Romanian economy: net financial benefit of employees, economic size of the employer, and belonging to a development region. Financial benefits have a significant impact on employees’ perceptions of overall job satisfaction and their willingness to value other aspects of satisfaction. The low level of wages earned by Romanian employees tends to diminish the significance of other aspects of job satisfaction [
69]. The level of technology and quality of work processes are affected by the economic size of the employing unit. Small economic units employ more primitive technological flows than large economic units, which have easier access to capital and, consequently, competitive technology [
70]. In Romania, the level of company development and employee incomes vary significantly by development region [
71]. Consequently, the model applied in this study was based on global determinants used in this type of research, which were supplemented by determinants unique to the area under study:
- -
Development region: NE and SE;
- -
Skill level: unskilled; medium skilled; high skilled;
- -
Job experience: a. 0–10 years; b. 10–20 years; c. 20–30 years; d. 30–40 years; e. over 40 years;
- -
Gender: female (F) and male (M);
- -
Net financial benefits: under 2000 RON/month; 2000–4000 RON/month; 4000–6000 RON/month; 6000–8000 RON/month; over 8000 RON/month; for data processing, the values in national currency (RON) were converted into euros at the exchange rate from 11 December 2021 = 4.95 RON/EUR [
72];
- -
Size of employing unit: 1. turnover less than 100 thousand euros; 2. turnover between 100 and 250 thousand euros; 3. turnover between 250 and 500 thousand euros; 4. turnover between 500 and 750 thousand euros; 5. turnover greater than 1 million euros.
The subjects’ skill level was divided into three categories: unskilled employees (with primary education and no specialist training), who primarily perform physical activities; medium-skilled employees (with a medium level of training), such as technicians, laboratory workers, and mechanics, and high-skilled employees (with higher education), who organize technological processes, ensure marketing, manage human resources, and monitor product quality. Job experience was divided into five categories: (a) 0–10 years; (b) 10–20 years; (c) 20–30 years; (d) 30–40 years, and (e) over 40 years. Employees in managerial positions were excluded from the representative sample.
The sample is representative of the five categories based on company turnover. There were a significant number of small bakeries. Incorporating this weighting into the sampling quota would have diminished the utility of the research findings for the other companies, which have the most employees. The sample is instead representative within each interval. The five ranges of economic size presented above were used to sample the companies from which the study’s subjects were drawn. For each of the five turnover ranges, twelve companies were chosen at random. Thirty businesses, five from each county and one from each turnover range, were chosen from each development region (NE and SE). The NE Region includes Bacău, Botoșani, Iași, Neamț, Suceava, and Vaslui, while the SE Region includes Brăila, Buzău, Constanța, Galați, Tulcea, and Vrancea.
Professional and trade union associations were used to distribute questionnaires. The research methodology as well as the actual research were carried out in accordance with the law regarding personal data protection. Pearson Correlation Analysis (2-tailed), Regression Analysis, and ANOVA were used to process the data using MS Office Excel and IBM SPSS Statistics 23 software applications.
In the first half of 2022, a qualitative online Focus group survey was conducted with 17 managers from sample companies as the final stage of this research. At least two participants from each economic size category; at least four participants from each development region; at least two participants from companies with all employee categories, and at least four food engineering technologists were chosen to represent the diversity of the studied sample. They were provided with the preliminary results of the quantitative research and asked for their opinions on them, as well as their own interpretations and explanations of the contributing factors.
Thus, the objectives of the Focus group research were to establish the concordance between the research results and the participants’ own perceptions of the activities in their own companies, to interpret and explain the phenomena explained by the research results, and to find ways to implement the research results in the participants’ own organizations. These goals have been applied to all four research objectives. The moderation guide for the Focus group included the session’s topic, objectives, guiding questions, alternate modes of interaction, working procedure, and resource organization (human resources and logistics). Following the discussions, lists of opinions were compiled for each research objective (12 lists), and participants were then asked to select the components with which they most agreed. Participants were given a restricted number of options (3 per list). The session lasted three hours with two 15 min breaks and was moderated by the paper’s lead author and two other members of the research team who recorded information and observed the interaction and behavior of the participants, respectively. After the debates ended, the research team conducted a debriefing in which the results were centralized, correlated with the observations, and the final results were determined.
3.1. Using Employee Perception to Determine the Importance of Each Type of Motivation
The first section of the survey was designed to find out how employees felt about their own motivation system. Subjects were asked to rate each category of satisfaction on a Likert scale from 1 to 7, with 1 being the highest and 7 being the lowest. A score of 1 indicates the least important factor, while a score of 7 indicates the most important factor. In order to obtain the most accurate data possible, each question’s introduction explained which motivations were covered and how the marks were to be awarded.
As previous researches shows that the results of single-item measurement (overall satisfaction) tend to indicate a more favorable picture of job satisfaction than multi-item measurement, the technique of measuring job satisfaction based on facets or components was used at the expense of overall satisfaction [
60,
61].
The results of the individual importance of each facet were converted into numerical values in the base 100, and pondered coefficients (whose sum is 100) for the relative importance of each need within the overall needs were calculated. The level of satisfaction with each category of motivation was then pondered using these coefficients.
3.2. Measuring Employee Job Satisfaction
The second section of the questionnaire consisted of an assessment of how well each motivation is met by the current job. Subjects gave ratings ranging from 1 to 7 on this form. A score of 1 indicates the minimum level of satisfaction, while a score of 7 indicates the highest level of satisfaction [
73]. To ensure the necessary correlation between employees’ motivations and their satisfaction, the same set of 11 characteristics (facets) as in the first stage was used, but this time, employees were asked to indicate how satisfied they were with their current job in each of these categories [
59].
The level of satisfaction of needs was assessed by assigning a score from 1 to 7 on the Likert scale to each category of motivation evaluated in relation to the others. A score of 1 represents the lowest level of satisfaction, while a score of 7 represents the highest level of satisfaction. Employees’ nominal satisfaction is represented by the results. The importance coefficients obtained in the previous step were applied to these values, yielding an actual satisfaction level. The obtained results were transformed into values ranging from 1 to 100 to ensure consistency and replicability with other studies with similar goals.
3.3. Determining the Impact of Employee Job Satisfaction on Labour Expenditure
The subjects’ responses on net salary were used in this stage, and the labor expenditure was calculated by converting to euros [
72] and applying contributions to salaries (Social Insurance (CAS)—25%; Social Health Insurance (CASS)—10%; Income Tax (IV)—10%; Labor Insurance Contribution (CAM)—2.25%) [
74]. The labor expenditure per year was calculated in the first step using the employee categories specified in the sample structure.
The research team then assumed that there was an inverse relationship between the level of satisfaction provided by the employer and labor expenditure in the second step. On the total sample and on characteristic groups, the Pearson coefficient (PCC) was used to determine possible correlation.
3.4. Determining the Impact of Employee Job Satisfaction on Labour Productivity
This stage was designed to validate the procedure for evaluating the motivation system and to highlight its correlation with the economic performance of the companies surveyed. As a result, the relationship between employee satisfaction and employee turnover per employee was determined for the 60 companies that employed the research participants. The ratio of turnover to the number of employees is used to calculate turnover per employee, which is a measure of employee work performance or productivity The correlation between the degree of satisfaction and the labor expenditure efficiency rate was also determined. This was calculated as the ratio between turnover and the average labor expenditure per employee [
75]. Model evaluation was performed with SPSS, Cronbach’s α analysis, composite reliability (CR), and average variance extracted (AVE).
The sampled units’ turnover was derived from the Ministry of Finance’s public database, section Tax information and Balance Sheets [
76], based on each company’s unique registration code in the section “Information on public institutions, economic agents, insurance companies, brokers, and NGOs.” The average value for the last five fiscal years (2017–2021) was used in the calculations. A qualitative research component was also included in this stage, which was conducted through an online Focus group with 17 managers from sampled companies.
4. Results
In the quantitative research, online questionnaires were collected from 254 people and a response rate of 82% was obtained within 30 days. The sample structure was as follows:
- -
Development region: NE (54.3%) and SE (45.7%);
- -
Skill level: unskilled (36.6%); medium skilled (50.8%); high skilled (12.6%);
- -
Job experience: (a) 0–10 years (26.8%); (b) 10–20 years (22.8%); (c) 20–30 years (20.5%); (d) 30–40 years (11.4%); (e) over 40 years (18.5%);
- -
Gender: female (F: 44.1%) and male (M: 55.9%);
- -
Net financial benefits: under 2000 RON/month (49.2%); 2000–4000 RON/month (31.9%); 4000–6000 RON/month (10.6%); 6000–8000 RON/month (5.5%); over 8000 RON/month (2.8%);
- -
Size of employing unit: (1) turnover less than 100 thousand euros (14.2%); (2) turnover between 100 and 250 thousand euros (28.3%); (3) turnover between 250 and 500 thousand euros (26.4%); (4) turnover between 500 and 750 thousand euros (16.5%); (5) turnover greater than 1 million euros (14.6%).
The model evaluation results permit us to retain the 14 variables with a factor loading of at least 0.60. The factor loadings fall between 0.741% and 0.892%. Cronbach’s alpha coefficients for construct variables range between 0.736 and 0.912, indicating a high level of reliability (BP with a value of 0.844, SP with a value of 0.912, for FP it is 0.824, for IP it is 0.771, and for ATT it is 0.856). The obtained composite reliability values are between 0.815 and 0.904, indicating that the selected variables represent latent constructs. All latent constructs satisfied convergent validity (AVE values are between 0.612 and 0.732, thus greater than 0.5).
The relationship between employees’ preferences regarding their work motivations, their level of satisfaction, and the main performance indicators of the employing units was used to identify sustainable means of reducing labor expenditure and improving company economic performance.
4.1. Prioritizing Motivations Based on Employee Perception
Current research that is limited to single-item measurement tends to paint a more positive picture of job satisfaction than multidimensional measurement, which is why the cost of overall satisfaction was utilized. This is the ratio between labor costs and satisfaction [
74]. To achieve this objective, labor expenses were determined and then correlated with the results of the satisfaction analysis by facet and according to the weight that employees place on each facet.
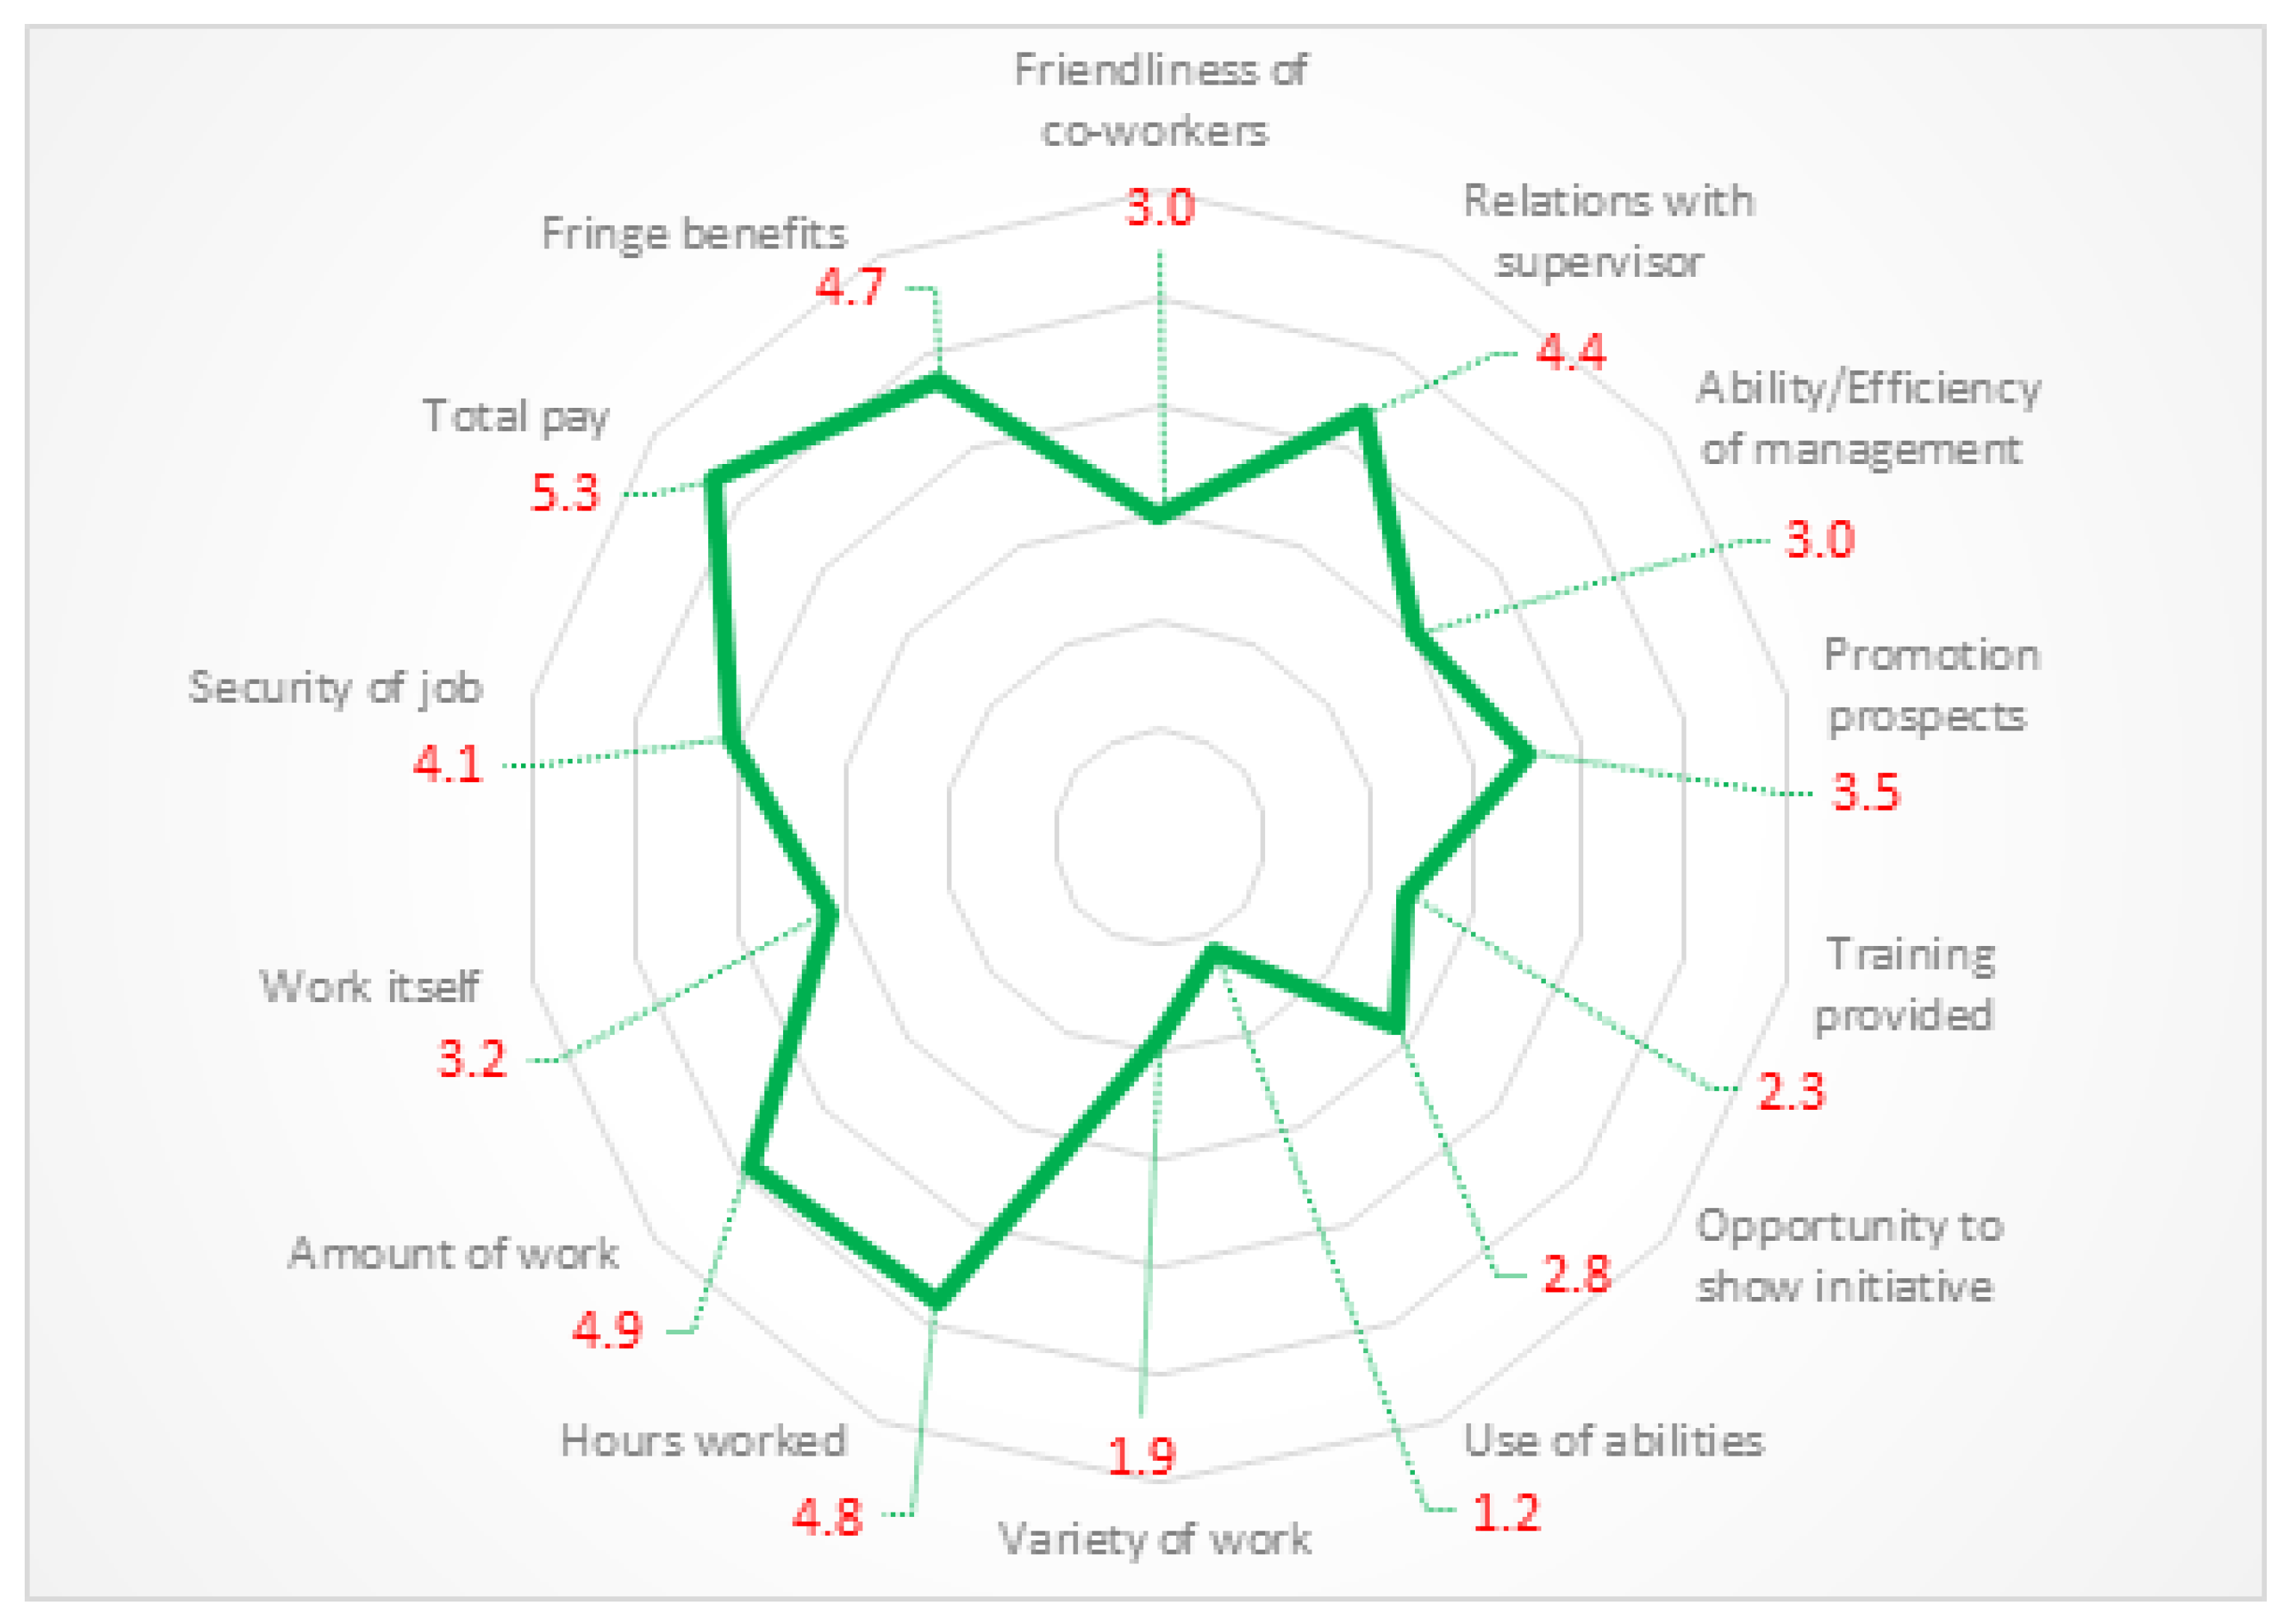
Total pay is the most important motivation, accounting for 10.9% (5.3 points; on a 1–7-point scale) of total motivations, according to comparative importance analysis (
Figure 1). Workload and number of working hours come in second and third, with 9.9% (4.9 points) and 9.7% (4.8 points), respectively. The use of one’s own skills, which accounted for 2.4% (1.2 points) of the total, and the variety of work, which accounted for 3.9% (1.9 points), were found to be the least important factors. The motivations that characterize the quality of work are the most important. It accounts for 40.7% (20.1 points) of the total and includes the following factors: skill use, variety of work, hours worked, workload, work itself, and job security. Total compensation and fringe benefits add up to 20.5% (10.0 points) of total compensation. Opportunities for advancement accounted for 17.7% (8.6 points) of the total, and included advancement prospects, training, and opportunities to demonstrate initiative. Employees’ friendly behavior and the quality of supervisory relationships are examples of social motivations. These account for 15.0% (7.4 points) of the total, with 6.2% (3.0 points) of motivations related to management quality.
Employee priorities are unaffected by the development region in which food companies are located (
Table S1, Supplementary Materials). However, while female employees have the same first priority as male employees, namely “total pay” (5.5 points), the next value of 5.1 points corresponds to several categories of motivation: workload, working hours, and supervisory relationships (
Table S2, Supplementary Materials). For men, “total payments” (5.1 points) is the most important criterion, followed by workload (4.6 points), work duration (4.6 points), and fringe benefits (4.6 points).
The structure of motivations is significantly altered by the level of qualification (
Table S3, Supplementary Materials). Working time (6.4 points) is the most important motivation for unqualified employees, while total payments (5.6 points) is the most important motivation for medium-qualified employees. For employees with higher education, the most important motivation are promotion opportunities (5.0 points). In addition, when compared to other employee groups, employees with a higher education have a less polarized motivation regarding “total pay” criteria. The least important motivations are the same as in the total sample, but employees with higher education have a lower concern for work safety (2.8 points), compared to employees with medium education and unskilled employees, who have scores of 4.7 and 4.9 points, respectively.
Work experience has a big impact on the perspective on motivations (
Table S4, Supplementary Materials). Employees with less than 10 years of experience consider the prospect of promotion to be the most important motivation at work (5.6 points), employees with 10 to 40 years of experience consider total pay to be the most important (5.8 points for 10–20 years, 5.3 points for 20–30 years, 5.9 points for 30–40 years). Workload is the most important criterion for employees with more than 40 years of experience (6.2 points). Motivations involving the use of skills are the least valued, but they have the lowest value of 0.6 points for employees with more than 40 years of experience.
Workload (5.0 points) for companies grouped by size of employing unit 1, fringe benefits (5.0 and 6.8 points, respectively) for size of employing units 2 and 4, total payments (6.0 points) for size of employing unit 3, and number of hours worked (6.0 points) for size of employing unit 5, were determined to be the most important motivations related to the economic size of the companies (
Table S5, Supplementary Materials).
The majority of participants in the Focus group agreed that in the companies they manage, the importance of satisfaction factors such as total pay, workload, and working hours is evident. They value the fact that employees are aware of the relationship between effort, labor, and compensation levels. The managers of medium- and large-sized companies (categories 3 to 5) indicated that these categories are more significant for employees with below-average experience and qualifications. Skilled and more experienced employees organize their work processes more efficiently and have adapted to their employer’s organizational culture.
Participants in the Focus group justified the dominance of total pay and quantity of work in the employee satisfaction system by the social pressure employees face. They claim that in the current historical context, thirty years after the end of communism, employees consider themselves fulfilled if they own a home, a car, and can afford at least one vacation per year. The accumulation of real estate in the past occurred over generations. In contrast, some participants believed that they should concentrate their human resource management efforts on the other aspects of job satisfaction, as these are, collectively, much more important than pay for work and effort at work.
As for the relevance of the results, a significant proportion of managers believe that these results are useful for enhancing their work, but it would be beneficial to conduct this research at the company level with semi-annual or annual repetitions in order to highlight the dynamics of satisfaction according to the management’s actions. However, a significant proportion of participants believe that this analysis is overly complicated and that the 14 facets should be reduced to two: financial and emotional.
4.2. Employee Job Satisfaction
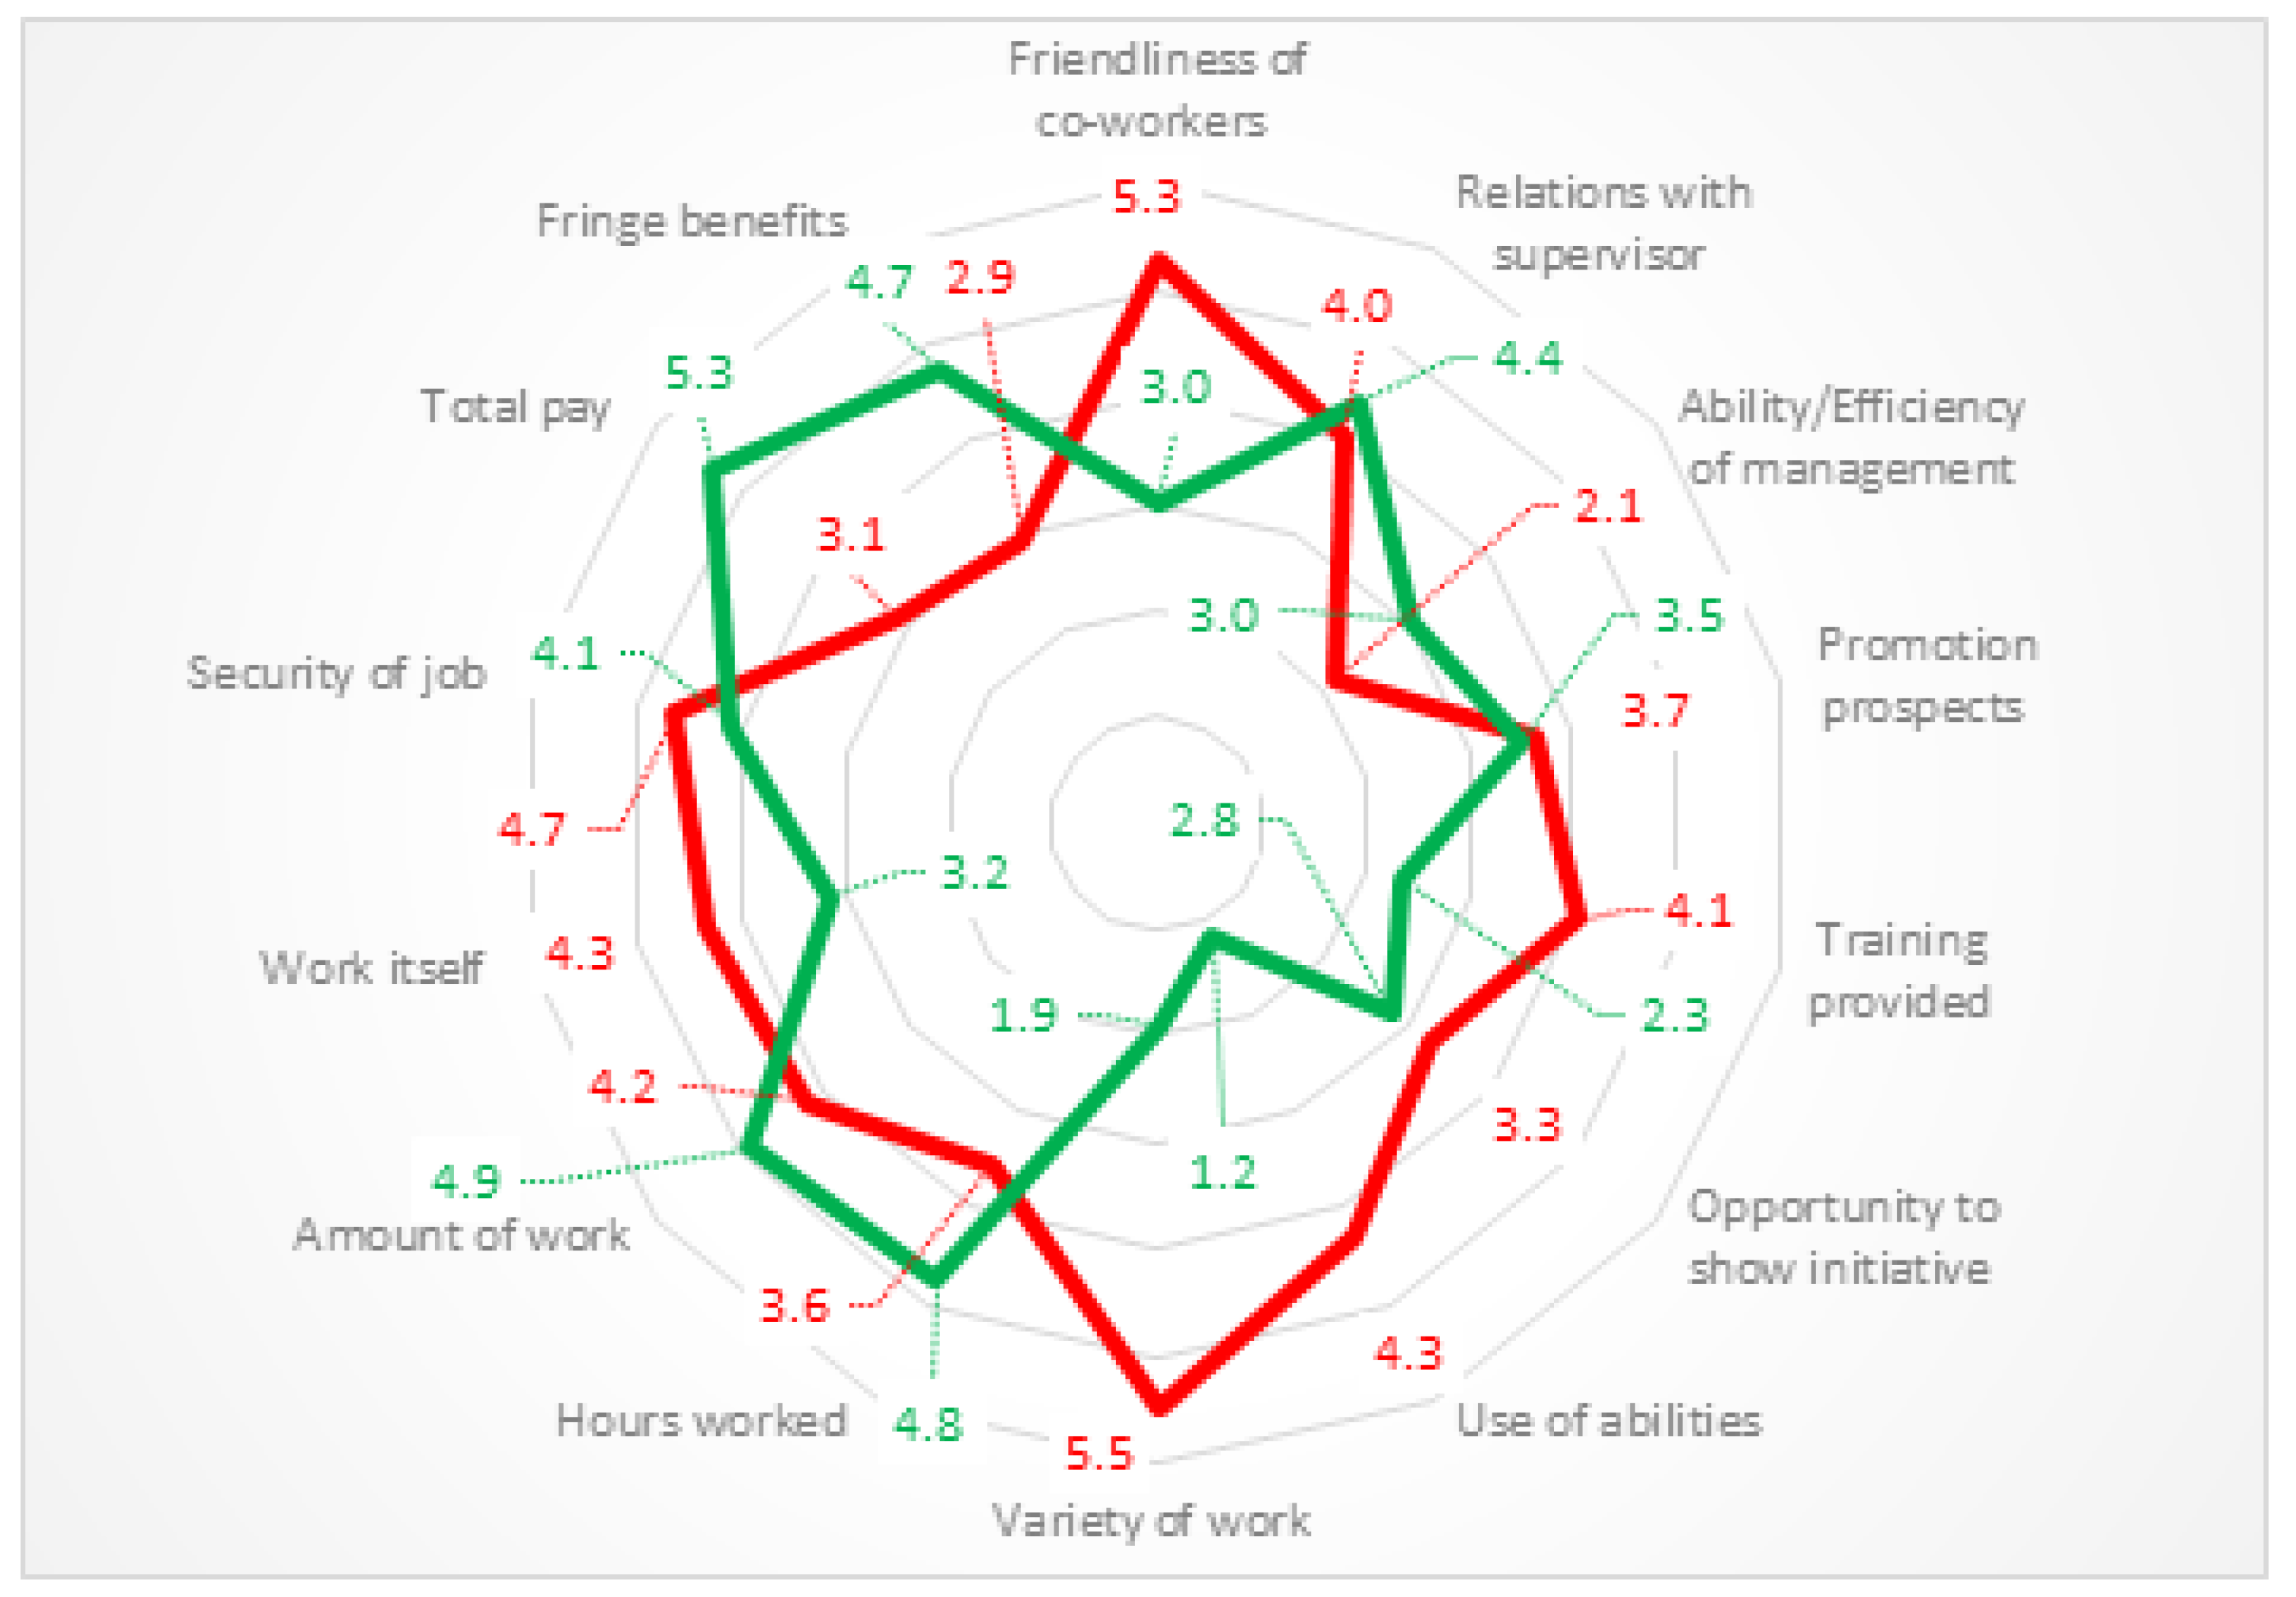
According to the analysis of overall satisfaction, the average level for the entire sample surveyed was 3.9 points (on a 1–7-point scale). Satisfaction by facets reveals that the variety of work received the highest level of satisfaction, with 5.5 points. This is followed by employee friendliness and job security, which received 5.3 and 4.7 points, respectively. The least satisfied were expectations regarding the quality of the management process, with 2.1 points, fringe benefits, with 2.9 points, and total payment, with 3.1 points. The most important group of motivations was characterized by work quality, with a satisfaction rating of 26.6 points (an average of 4.4 points). Total benefits accumulated 6.1 points (average 3.0 points), while promotion opportunities totaled 11.0 points (average 3.7 points). Social motivations scored 9.3 points (an average of 4.6 points), while motivations related to management quality received 2.1 points.
The most important differences (
Figure 2) between the level of satisfaction by facet and the importance of motivations (or employee expectations) were recorded for variety of work (−3.6 points) and skill use (−3.1 points). These discrepancies indicate that employees are satisfied, but that the category is of minor significance. Total pay showed a significant difference with a value of 2.2 points, indicating a low level of satisfaction for an important feature perceived by employees. The maximum facet dissatisfaction (calculated as the difference between facet motivation and facet satisfaction) is for financial benefits: 2.2 points are lost for total payments and 1.8 points for other benefits.
Pearson correlation analysis was used on the two sets of data, yielding a coefficient (PCC) of −0.12 for the comparative importance score of motivation and satisfaction by facet (data not shown). If this value were close to −1.00 (strong correlation), it could be appreciated that those characteristics that are not satisfied become very important expectations for employees.
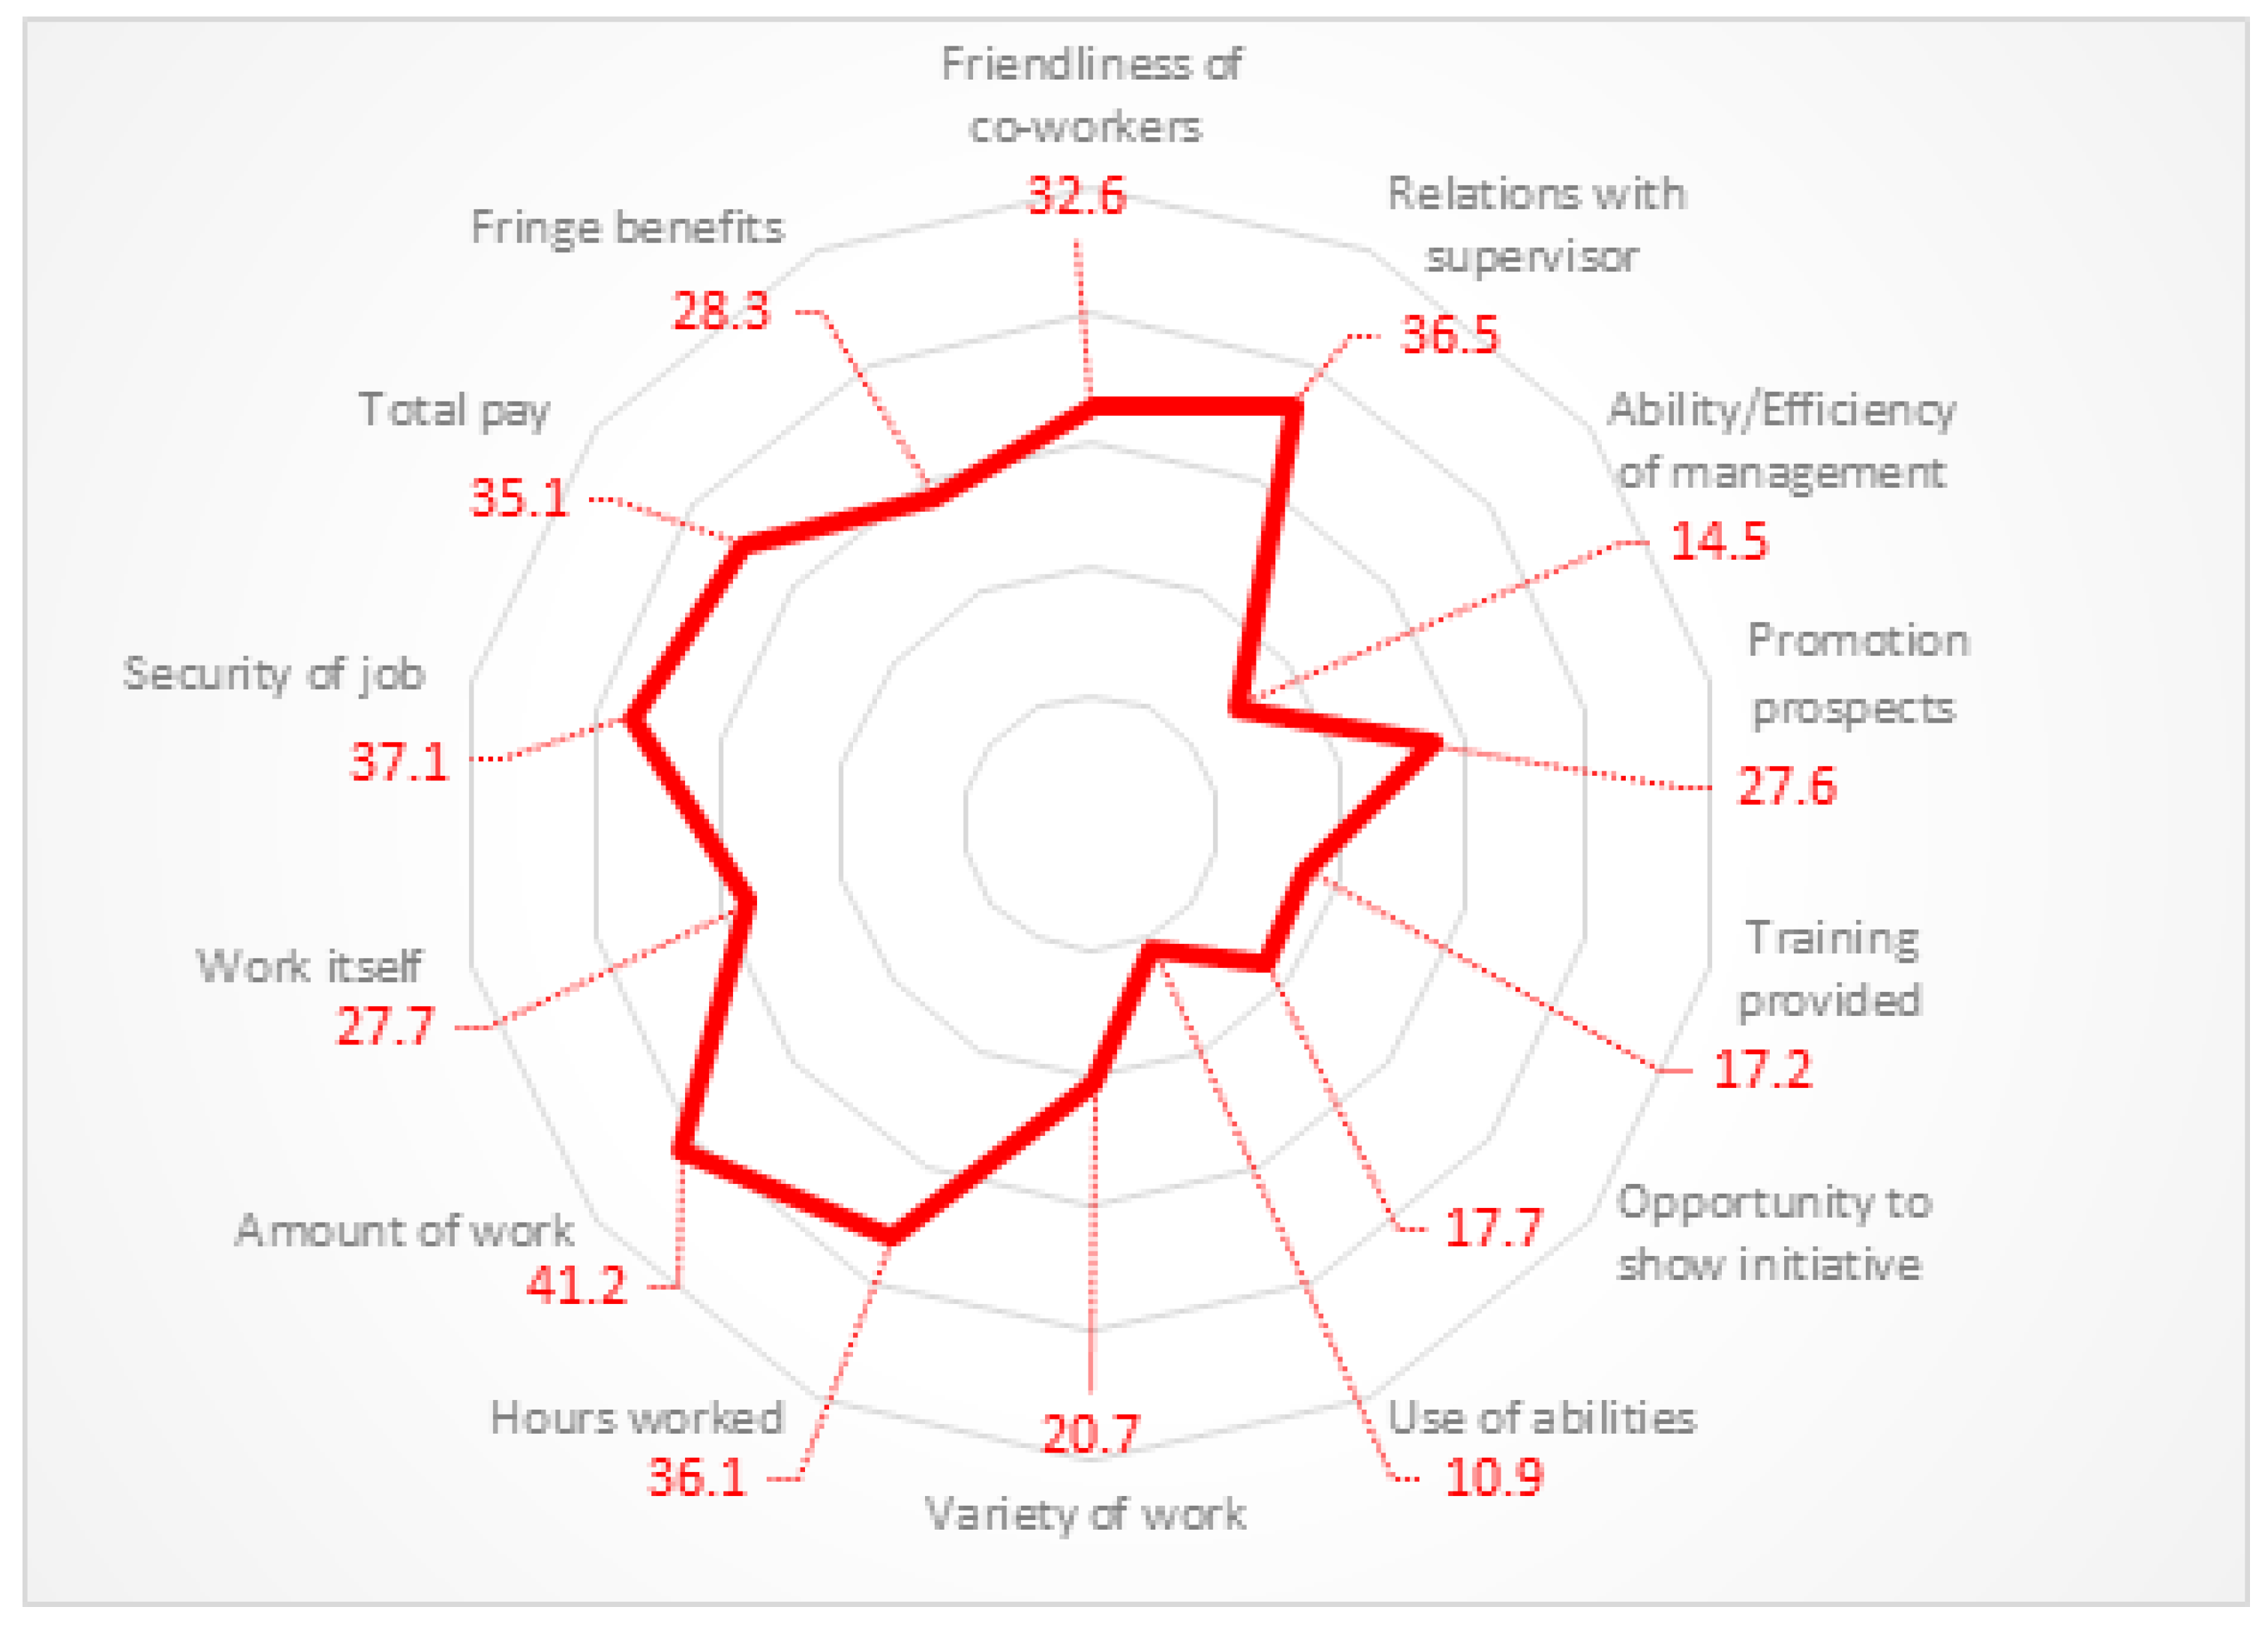
Job satisfaction as weighted values or actual satisfaction as perceived by employees (
Figure 3) was obtained by correcting the nominal satisfaction values and the level of importance of the motivations (transformed into a 1–100-point scale). This resulted in an average value of 27.4 points valid for the entire sample, with maximum values of 41.2 points for workload, 37.1 points for job security, and 36.5 points for relationships with supervisors, respectively.
The most important group of satisfaction is that which defines work quality, with a total satisfaction of 173.7 points but an average of only 28.9 points. Total benefits accumulate 63.4 points (average 31.7 points) and the possibilities of promotion have an in-sum of 62.5 points (average 20.8 points). Social satisfaction scored 69.1 points (an average of 34.6 points) and management satisfaction scored 14.5 points.
By region of development (
Table S6, Supplementary Materials), there were differences in actual satisfaction, with 32.6 points as the overall satisfaction value (the sum of differences in satisfaction by facet) and 2.3 points as the average value by facet. With a value of 6.3 points, the most significant difference was in the development prospects facet: 30.7 points for employees in the NE region and 24.4 points for employees in the SE region.
Between women and men (
Table S7, Supplementary Materials), there was a difference in overall satisfaction of 30.0 points and a mean difference per facet of 2.1 points. In the facet analysis, a maximum difference of 17.6 points was observed for the category “friendliness of co-workers”, ranging from 41.9 points for women to 24.3 points for male employees.
Skill level (
Table S8, Supplementary Materials) resulted in an overall satisfaction difference of 23.0 points (between the sum of the facet values of the two categories) and an average difference of 1.6 points (between the average of the facet values of the two categories) between unskilled (26.7 points) and medium-skilled employees (28.4 points). The greatest difference by facet was in the number of hours worked (29.5 points) between unskilled employees (48.7 points) and high-skilled employees (19.2 points).
Job experience (
Table S9, Supplementary Materials) resulted in a total satisfaction difference of 51.0 points with an overall average of 3.6 points. The overall total score was 351.3 points for employees with 0–10 years of experience and 402.3 points for employees with over 40 years of experience. The category with the largest difference by years of experience was “work itself”, with a value of 22.4 points, ranging from 19.3 points for employees with 10–20 years of experience to 41.7 points for employees with over 40 years of experience.
The biggest impact on overall satisfaction was the size of the employing unit (
Table S10, Supplementary Materials) which resulted in a summed values difference of 300.0 points (18.0 points average per facet). By size of employing unit, the value of size category 1 was 262.7 points, category 2 was 328.2 points, category 3 was 366.6 points, category 4 was 514.6 points, and category 5 was 463.5 points. When analyzed by facets, a maximum difference of 37.6 points was revealed in the work itself facet for size category 1, from 12.5 points to 50.1 points for employees in size category 5.
Diverse opinions were expressed by participants in the Focus group meeting. Some participants, particularly managers from small companies in the Southeastern Region of Romania, believe that the total pay and other benefits achieved are in excess of the actual level of employee satisfaction. They believe that in this regard, employee satisfaction is lower. Another portion of the participants, consisting primarily of managers in the food technology industry, believes that this level of satisfaction is consistent with the reality in their own organizations, but that the variability of work could be significantly reduced. A final group of participants responded favorably to the values derived from the facets concerning the application of skills and opportunities to demonstrate initiative. They believe that these factors are irrelevant and should not be a part of the employee satisfaction domain. They also believe that employees only have executive responsibilities.
The research results were interpreted and explained in a variety of ways. Some respondents stated that, in general, employees compare the gross value of their salaries in Romanian food companies to those in Western European companies. These employees’ pay is proportional to the cost of living. Additionally, they believe that inaccurate information about the quality of life and work of Romanian migrants distorts employees’ expectations. A second group of respondents who asserted that the variable nature of work is overrated defended their position by asserting that the current technological climate makes it challenging to switch jobs.
Under these aforementioned conditions, the majority of participants believe that if this situation were unique to the companies they manage, it would be appropriate to reevaluate aspects of job satisfaction such as the friendliness of coworkers, relations with the supervisor, skill/efficiency of management, promotion prospects, training provided, opportunity to demonstrate initiative, and utilization of skills. They believe that measures to improve satisfaction for these satisfaction components are necessary for both increasing overall satisfaction and the allure of jobs in this field.
4.3. Impact of Employee Job Satisfaction on Labour Expenditure
Labor expenditure averaged 27,721 euros per person and year (
Table S11, Supplementary Materials), with differences ranging from 8214 euros for unskilled workers with less than 10 years of experience in the NE region to 62,329 euros for highly skilled workers with more than 40 years of experience in the SE region. The SE Development Region’s employees cost 27.9% more than those in the NE Development Region.
It was assumed at this point that there was an inverse relationship between employer satisfaction and labor expenditure. The findings revealed a direct and strong correlation (
Table 1) between labor expenditure and employee satisfaction (PCC = 0.777 for a 95 percent confidence interval). The segment analysis, on the other hand, revealed that there was no significant correlation (PCC = 0.11) between job satisfaction and labor expenditure for unskilled labor (data not shown).
For medium-skilled employees, there was a weak inverse correlation between satisfaction and labor expenditure (PCC = −0.32), especially for employees with more than 10 years of experience (PCC = −0.38). For the highly qualified employees, there was a weak correlation for the representative group (PCC = −0.29) but a very strong correlation for employees with more than 20 years of experience (PCC = −0.84). The membership of the two development regions did not register significant results, but by size of employing unit, a strong inverse correlation was found between the level of satisfaction and labor expenditures for employing units type 4 and 5 (PCC = −0.67) (data not shown).
Regression analysis (
Table 1) for a 95% confidence interval indicates that for the majority of cases (ca. 63.5%) there is an increase in labor expenditure according to the level of employee satisfaction. After approximately 60 points, there is a slight capping of this cost to a value above the maximum score.
Dimensional constant indicates that the surveyed companies can consume 4236.9 euro/person/year while providing zero satisfaction (ES = 0). The marginal cost situated in the interval between 50.0 and 60.0 points is 2216 euro/person/year, while between 90.0 and 100.0 points it is 513 euro/person/year × satisfaction point, which is 3.32 times lower.
The results of the regression analysis carried out to measure the dependence of the average labor expenditure on the satisfaction point (
Table 1) for a 95% confidence interval indicate for most cases (61.1%) a reduction of the average labor expenditure on the level of employee satisfaction expressed by a logarithmic regression equation indicating for a satisfaction level of 50 points a cost of 4335 euro/person/year × satisfaction point and at 100 points a cost of 2527 euro. If the sample’s average satisfaction level is 27.4, the average cost per satisfaction point is 3691 euro/person/year × satisfaction point. Employers would save 27.1% if they gave their employees 100 satisfaction points, which would cost €252/person/year × satisfaction point. this phenomenon, a firm in the sample loses about 7825 euro/person/year on average due to not providing an optimal level of employee satisfaction.
Some participants in the focus group session believe that the proportion of total pay and total benefits is much higher in the employee satisfaction system, and as a result, labor costs will rise proportionally to the increase in overall satisfaction. In contrast, other participants believe that employee satisfaction in total pay and other financial benefits plateaus at low levels of experience, particularly in the middle and higher skilled workforces. A further increase in satisfaction can be achieved more effectively and affordably by enhancing employee satisfaction with regard to the work environment, promotion opportunities, recognition of employee initiative, and transparent management. In the concluding portion of the session, it was emphasized that a non-proportional increase in satisfaction-related expenditure can lead to a reduction in average costs per unit produced and marketed, and thus to an increase in economic performance. Participants view these findings as particularly useful for this reason.
4.4. Impact of Employee Job Satisfaction on Labour Productivity
The link between employee satisfaction and employee turnover was highlighted in the first part of this phase. This theory was found to be false. The Pearson correlation coefficient (PCC = 0.14) does not indicate that the two phenomena are linked.
The intensity of the dependence of labor productivity expressed as the ratio of turnover to labor expenditure (
Table 1), as determined by regression analysis with a 95% confidence interval, indicates a relatively high variability of the phenomenon. However, as employee satisfaction rises, the trend is reflected in an increase in labor productivity. Furthermore, according to the cubic regression, there is a moderate increase in marginal labor productivity up to a maximum of 50 points (an average increase of 21.8% per point), after which the increase becomes much more apparent in the 80–100 score range (an average increase of 3.3% per point, respectively, and 4.2% per point of satisfaction).
At zero employee satisfaction, the free factor indicates a level of approximately 5.86 euros in turnover per 1.0 euro spent on labor. This is most likely determined by the other production factors. Per 1.0 euro spent on labor, the average marginal increase in turnover is 4.1 euros per satisfaction point (5.5% per satisfaction point). From a cost standpoint, if the sample’s satisfaction level was 27.4 points and all of these business owners decided to spend an additional 1.0 euro in accordance with the real structure of employee motivation, they would generate more than 18.6 euros in revenue. They would get a turnover of 23.3 euros for every 1.0 euro spent on labor if they decided to increase employee satisfaction by one point (26.2% higher). However, if the employer providing 78.5 points decided to spend an extra 1.0 euro in the same way, it would generate more than 28.2 euros in revenue. And for every 1.0 euro spent on labor, they could increase employee satisfaction by one point, resulting in a turnover of 35.2 euros (24.6% higher). Total satisfaction (100 points) would result in a 55.6% reduction in labor costs.
Participants in the focus group session agreed with the results, highlighting the correlation between level of satisfaction and labor expenditure, but all agreed that for unskilled and part of the medium-skilled workforce, the only determinants are the labor market and production flows. They believe that a rise in employee satisfaction would only serve a social function and not have any significant economic effects.
In the case of higher-skilled employees, however, increased satisfaction is the primary driver of productivity growth. They believe that providing a favorable work environment and encouraging initiative, skill development, and differentiated rewards for performance can lead to an increase in the salary threshold at which employees typically lose interest in their jobs. Small business managers, particularly in the Southeastern United States, believe they lack the potential to provide an attractive career path for their employees and must accept the relative mobility of medium-and highly qualified workers who will migrate to large companies.
5. Discussion
Establishing causal relationships between employee satisfaction and labor costs per unit of output, on the one hand, and between job satisfaction and labor productivity, on the other, was the purpose of the research questions. In the initial phase, the perceived facets of employee satisfaction factors were determined.
The concern of employees in the Romanian bakery industry (NE and SE development regions) for financial benefits was evident, a phenomenon partially justified by the sector’s low contribution to the national income. This is happening at a time when the population’s expectations are gradually catching up with those in Western Europe [
77]. Take-home pay is linked to working hours and workload. Employees believe their work effort is out of proportion to their pay [
78]. Because of the polarization of the motivation system, unskilled employees have been drawn to financial benefits, which has been justified by their low pay [
79], which is insufficient for an acceptable standard of living.
The value placed on professional development by employees with higher education can be justified by the fact that many of them are young, with less than 10 years of experience, and focused on advancement. The fact that some of these employees work in bakeries in order to gain the experience and knowledge needed to move into sectors like input co-trading or services explains their relatively young average age. Another group quits their jobs and relocates to countries in Western Europe [
80]. As a result, the percentage of employees with more than half a year of experience is low, and the current state of the higher-skilled labor market in the bakery business does not indicate that this trend will change. Consistent with the findings of Cristea et al. (2021) [
81], employees are not motivated to remain in the bakery business due to the state of the labor market, but they do want to improve their skills in order to pursue a more appealing career.
The cumulative effects of motivation on the management team’s attitude and behavior, as well as employee relationships, were also significant. These findings suggest that there are psychological needs that can be managed differently than those that are directly related to financial mechanisms or production process organization. As evidenced by their economic size, employees in small and large businesses have different workloads and working hours. This suggests that small businesses have a harder time adapting work requirements to availability, resulting in an overworked workforce. Employees in medium-sized businesses, on the other hand, are concerned about financial benefits under certain work demands, a situation that is unique to the population as a whole. All of this information is necessary for bakery management to develop means of re-compensation and work coordination capable of bringing a high level of employee satisfaction and allowing an increase in work productivity.
The analysis of motivation’s significance did not resonate with all of the managers consulted during the Focus group session. Some of them are unwilling to see the results and believe that their salaries and other rewards are sufficient compensation. They view the other aspects of satisfaction as luxuries that actors in an economy such as Romania can only hope for in the future. Their actions are geared toward minimizing total costs regardless of the economic and social effects, displaying a clearly antagonistic attitude toward employees. The remainder of the focus group participants, who constitute the majority, revealed themselves to be more seasoned managers who recognize the significance of a diverse and individualized system of employee motivation. They demonstrated a willingness to implement this analysis in their own companies and attempted to enhance the research findings.
The fact that the actual level of job satisfaction was lower than the range’s average (27.4 out of 100 satisfaction points) is a concerning trend. According to previous research, national satisfaction was 52.5 points (on a scale of 1–100) in 2004, down from 69.0 in 1994 [
57]. In light of our findings, we can conclude that job satisfaction in Romania has decreased, or that job satisfaction in the bakery industry has decreased. Both statements, we believe, are at least partially true. This is also because research done at the European level during the same time shows that employee satisfaction has dropped and there are big differences between industries [
58].
The need for human resource management to be tailored to the characteristics and motivations of employees is demonstrated by the analysis of dissatisfaction by facet and by employee profile. Our findings show that it is impossible to motivate employees with more than 30 years of experience in large companies and a higher education in the same way that employees with less than 10 years of experience in small companies. Their disparate motivations will render homogeneity-based management ineffective.
This situation could explain why labor productivity is so low. Employees in small and medium-sized businesses are less satisfied with their management systems than employees in large businesses, implying that as businesses grow in size, there is a need for and consolidation of management systems. Adaptation to the quality of the work process, management, and social relations have all been shown in previous research [
82] to be levers for increasing employee performance by increasing overall satisfaction.
Most participants in the Focus group session expressed real interest in aspects (facets) of job satisfaction such as coworker friendliness, supervisor relations, management ability/efficiency, promotion prospects, training provided, opportunity to demonstrate initiative, and use of skills. They were also interested in implementing measures to enhance satisfaction for these factors.
In terms of the relationship between employee satisfaction and labor expenditure, both our own findings and the responses of the Focus group participants point to the same conclusion: providing a higher level of satisfaction for unskilled labor for reasons other than financial benefits does not lead to lower costs. On the contrary, it can improve employees’ quality of life by directing them toward a specific qualification that also provides them with financial satisfaction within the company. These findings support the study’s first hypothesis: if employees are satisfied with their jobs, the labor cost per unit of output decreases.
Increased financial benefits are attractive to the medium-skilled workforce, especially during the first ten years of employment, after which the intensity of this motivation declines. After this point, the financial rewards are shifted to other motivations, resulting in a decrease in labor expenditure. For high-skilled employees, the correlations found between labor expenditure and job satisfaction suggest that in the first 20 years, labor expenditure rises faster than the intensity of financial benefits. The increase in this cost is reduced after about 20 years of experience, but it must be supplemented by other types of satisfaction. There is a need for management geared toward ensuring professional development, respect for personal life, and a less steep increase in financial benefits for this group of employees. There is a need for much higher levels of management for employees with higher qualifications and more than about 20 years of experience, geared toward valuing their own results, achieving social satisfaction, and improving the working environment, in conjunction with favorable employee relations. The fact that companies in the over-500-thousand-euro brackets have higher correlations for this category of employees supports these considerations. The differences found are attributed to the management system’s maturity [
19].
According to this data found, employers pay more for low levels of satisfaction than for high levels of satisfaction. In other words, lower levels of satisfaction are achieved with higher costs, and higher levels with less than proportional costs, according to the relationships between labor expenditure and labour satisfaction. Thus, managers who participated in the Focus group agreed that higher levels of work are rewarded at lower costs than work that is rewarded poorly or moderately. They are skeptical of the impact of increased satisfaction on turnover, with the exception of above-average skilled and experienced staff, which yields greater than proportional returns in relation to satisfaction.
The fact that the companies surveyed can spend 4.2 thousand euros per person/year while providing zero satisfaction can be attributed to other factors influencing manufacturing process productivity, such as natural factors, technology, and so on. The variety of factors involved in turnover achievement supports the second hypothesis: if employees are satisfied with their jobs, their work productivity increases.
It has been demonstrated that employee satisfaction is correlated with employee turnover. All of these variables are linked together and form a complex system of determinants. These findings have also been highlighted by research in the service sector. Although human resources are the primary source of competitiveness [
83], economic unit performance is the result of a complex set of factors.
The process of evaluating the motivation system was validated in the majority of cases by correlating employee satisfaction with the economic performance of the companies studied, as measured by turnover in relation to labor expenditure. Statistically, providing a higher level of satisfaction resulted in an increase in the company’s performance. Furthermore, companies that provide low levels of satisfaction are significantly outperformed by companies that provide above-average levels of satisfaction. These findings are consistent with other studies in other business domains [
70,
84,
85,
86,
87,
88].
Managers feel the social pressure of employees’ expectations for the workplace, as well as the macroeconomic context in which competition in this field is intensifying and labor resources are becoming increasingly limited. The entire session of the Focus group was dominated by managers’ concerns regarding the viability of their businesses under these conditions. Nonetheless, two groups of managers emerged: concerned managers who blamed the macroeconomic environment in particular for their company’s problems, but who viewed the usefulness of the research results with skepticism, and managers who were searching for solutions within their own companies, but who viewed the presented research as an effective tool for enhancing their own performance.
We believe that, if the motivation structure is properly determined, a management system oriented toward employee satisfaction and performance can ensure significant economic performance for companies in the study area, as well as cost reduction. All of this is good for the environment because it develops alternative vectors of labor productivity growth to the traditional ones, which use a lot of non-renewable energy and have a large carbon footprint. Employees’ quality of life can also be significantly improved.
6. Research Limitations and Directions for Future Research
There were some limitations to this study. First, the one-sided measure that subjects assign to each facet of motivation limits the accuracy of the process of prioritizing motivations in employees’ perceptions. They cannot be effectively judged against one another. As a result, there is no guarantee that they contribute to total motivation to the extent that employees perceive them.
Future research could develop a survey method that allows each facet to represent the extent to which it is perceived, possibly through research on subjects’ actions rather than just opinions. Second, subjects’ subjectivity influences motivational prioritization and self-satisfaction evaluation. They can be influenced by the subjects’ conditions, the short-term socioeconomic situation, or even the data collection conditions of the researchers. Inter-disciplinary research in economics, technology, psychology, and sociology could result in the development of a methodology that allows for more objective results, even if these are the subjects’ perceptions. These methods could be used to develop application models or even computer applications that can provide complete information in an efficient manner to support decision-making.
7. Conclusions
The diversity of employee characteristics calls for a differentiated approach to motivations to ensure job satisfaction and increase performance. The results of our research indicate a general preference of subjects towards financial benefits, followed by the quality of work process, but different employee profiles indicate different secondary priorities. Employees in bakery companies in the NE Region, especially those in above-medium-sized companies, are concerned about supervising relations and working time. Women are also sensitive to workloads, in addition to their previous ones. Employees with higher education and those with less than 10 years of experience place greater importance on promotion opportunities. Job satisfaction is therefore determined by these coordinates.
Overall satisfaction across the representative group was quantified at a level of 27.4 points (on a scale of 1–100). Dissatisfaction by facet is in descending order for total pay, fringe benefits, workload, and promotion prospects.
With the exception of unskilled labor, increasing job satisfaction determines the progressive reduction in costs. Above-average skills, low job experience, and membership in above-average-sized companies are labor force characteristics that accentuate the inverse correlation between labor expenditure and job satisfaction. These elements also underlie the phenomenon whereby the performance of the surveyed companies decreases with low satisfaction.
The qualitative research component highlighted the social pressure exerted on the managers of the companies surveyed by the level of employee expectations in this sector and the competitive macroeconomic context in the face of limited labor resources. In contrast, the majority of managers recognized the significance of a diverse and individualized employee satisfaction system. They are eager to implement this analysis within their respective organizations. The procedures and results shown can lead to the development of applied models for the management of employee motivation and satisfaction in order to grow the Romanian bakery industry in a way that is long-term profitable.


 ,
, 

