Article

Nutrient Utilization and Double Cropping Rice Yield Response to Dense Planting with a Decreased Nitrogen Rate in Two Different Ecological Regions of South China

Ministry of Education and Jiangxi Key Laboratory of Crop Physiology, Ecology and Genetic Breeding, Jiangxi Agricultural University, Nanchang 330045, China
*
Author to whom correspondence should be addressed.
Agriculture 2022, 12(6), 871; https://doi.org/10.3390/agriculture12060871
Submission received: 3 May 2022 / Revised: 11 June 2022 / Accepted: 14 June 2022 / Published: 16 June 2022
(This article belongs to the Section Crop Production)

Abstract

:
An increased planting density and decreased nitrogen (N) rate combination may obtain a stable yield and enhance N utilization. However, the effects of an increased planting density and decreased N rate combination on the yield and nutrient utilization in different ecological regions are unclear. The aim of this research was to assess the interactive impacts of the N rates and planting densities on double cropping rice yields and nutrient utilization in two ecological regions in field experiments during 2018 and 2019. The results showed that, at Shanggao, increased planting densities of 67% and 200% compensated for the biomass, nutrient uptake and yield losses from N application reductions of 20% and 27% and increased the nutrient utilization of the early and late seasons. However, at Xingguo, compared with the N2D1 treatment (165 kg ha−1 with 57 plants per m2), the late rice yield under the N1D2 treatment (120 kg ha−1 with 114 plants per m2) decreased by 6.71% and 5.02% in 2018 and 2019, respectively. The photosynthetic rate and nutrient uptake were likely related to the positive interaction on the double cropping rice yield in the two ecological regions. Our results indicate that dense planting is a feasible cultivation strategy to decrease N inputs for double cropping rice, but the low soil nutrient supplies negatively affect stable yields in different ecological regions.

1. Introduction

Rice is one of most important food crops worldwide, and more than 60% of China’s population lives on rice [1]. Double cropping rice is a typical rice production system that can effectively increase the multiple cropping index and rice yield in South China [2,3]. With the progress of cultivation technology, the improvement of varieties and the sufficient supply of chemical fertilizers, the crop production capacity has increased steadily. China feeds 14% of the world’s population with only 7% of the world’s arable field [4]. In China, grain production still faces the challenges of global warming [5], greenhouse gas emissions [6], heavy metal pollution [7] and other environmental problems. With the improvement of socioeconomic conditions and living standards, rice production has shifted from high-yield to high-quality types [8]. Therefore, high-quality, efficient and sustainable development has become an important goal of food security production.
Nitrogen (N) is an important element required in rice and has an important effect on the leaf area index, leaf photosynthesis and biomass formation and distribution. N application can effectively promote rice productivity [9]. At present, to obtain higher yields, rice farmers apply excessive N fertilizer. Excessive N fertilizer application not only leads to the lodging of rice [10], the prolongation of the growth period [11] and a low seed setting rate [12] but also to changes in the soil acidification [13], N runoff [14], water eutrophication [15] and soil microbial diversity [16]. Many cultivation technologies have been studied to reduce N loss and increase N utilization efficiency in paddy fields, such as real-time and site-specific N fertilizer management [17], controlled-release N fertilizer management [18], deep lateral N fertilizer management [19] and N fertilizer management in different growth periods [20]. To sum up the appeal, the scientific and rational N application is conducive to the high yield and N utilization for rice production.
Plant density is an important factor in the formation of rice populations and affects canopy formation and yield [21]. Sparse planting promotes the development of individual rice plants but reduces the population canopy productivity and cannot give full play to the yield potential of the variety [22]. Appropriate dense planting promotes the interception of solar radiation and increases canopy productivity and dry matter accumulation [23]. Reasonably increased planting density increases the panicle number, leaf area index, biomass and yield in double cropping rice systems [24]. The high planting density of the rice population results in fierce interspecific competition, unbalanced population development and easy lodging [25]. In short, an appropriate planting density can obtain the best rice canopy productivity and yield.
The N fertilizer management and plant density together play an important role in rice yield and N utilization [26,27]. Increasing the N rate and plant density enhances the population structure, leaf area index, solar radiation interception efficiency and crop growth rate and has a consistent positive effect on aboveground biomass [28]. Zhu et al. [29] found that, compared with a low seedling number and high N rate treatment, an increased seedling number and a decreased basal fertilizer N application rate treatment increased rice yield and N use efficiency. Hou et al. [30] showed that a reasonably increased plant density and amount of N fertilizer enhanced the photosynthetically active radiation and N utilization that could promote an increase in crop productivity. Huang et al. [31] indicated that dense planting enhanced N uptake and utilization in rice, which effectively avoided the yield reduction caused by N application reduction. These studies include many reports on the response of the yield to N application and plant density at a single ecological region, but the cooperative relationship between N application and plant density on the yield, N, phosphorus and potassium utilization in different ecological regions is not clear. The purposes of this study are to (1) clarify the differences in the response of double cropping rice yield and nutrient utilization to increased planting density with reduced N application in different ecological regions and (2) identify the key factors affecting the difference.

2. Materials and Methods

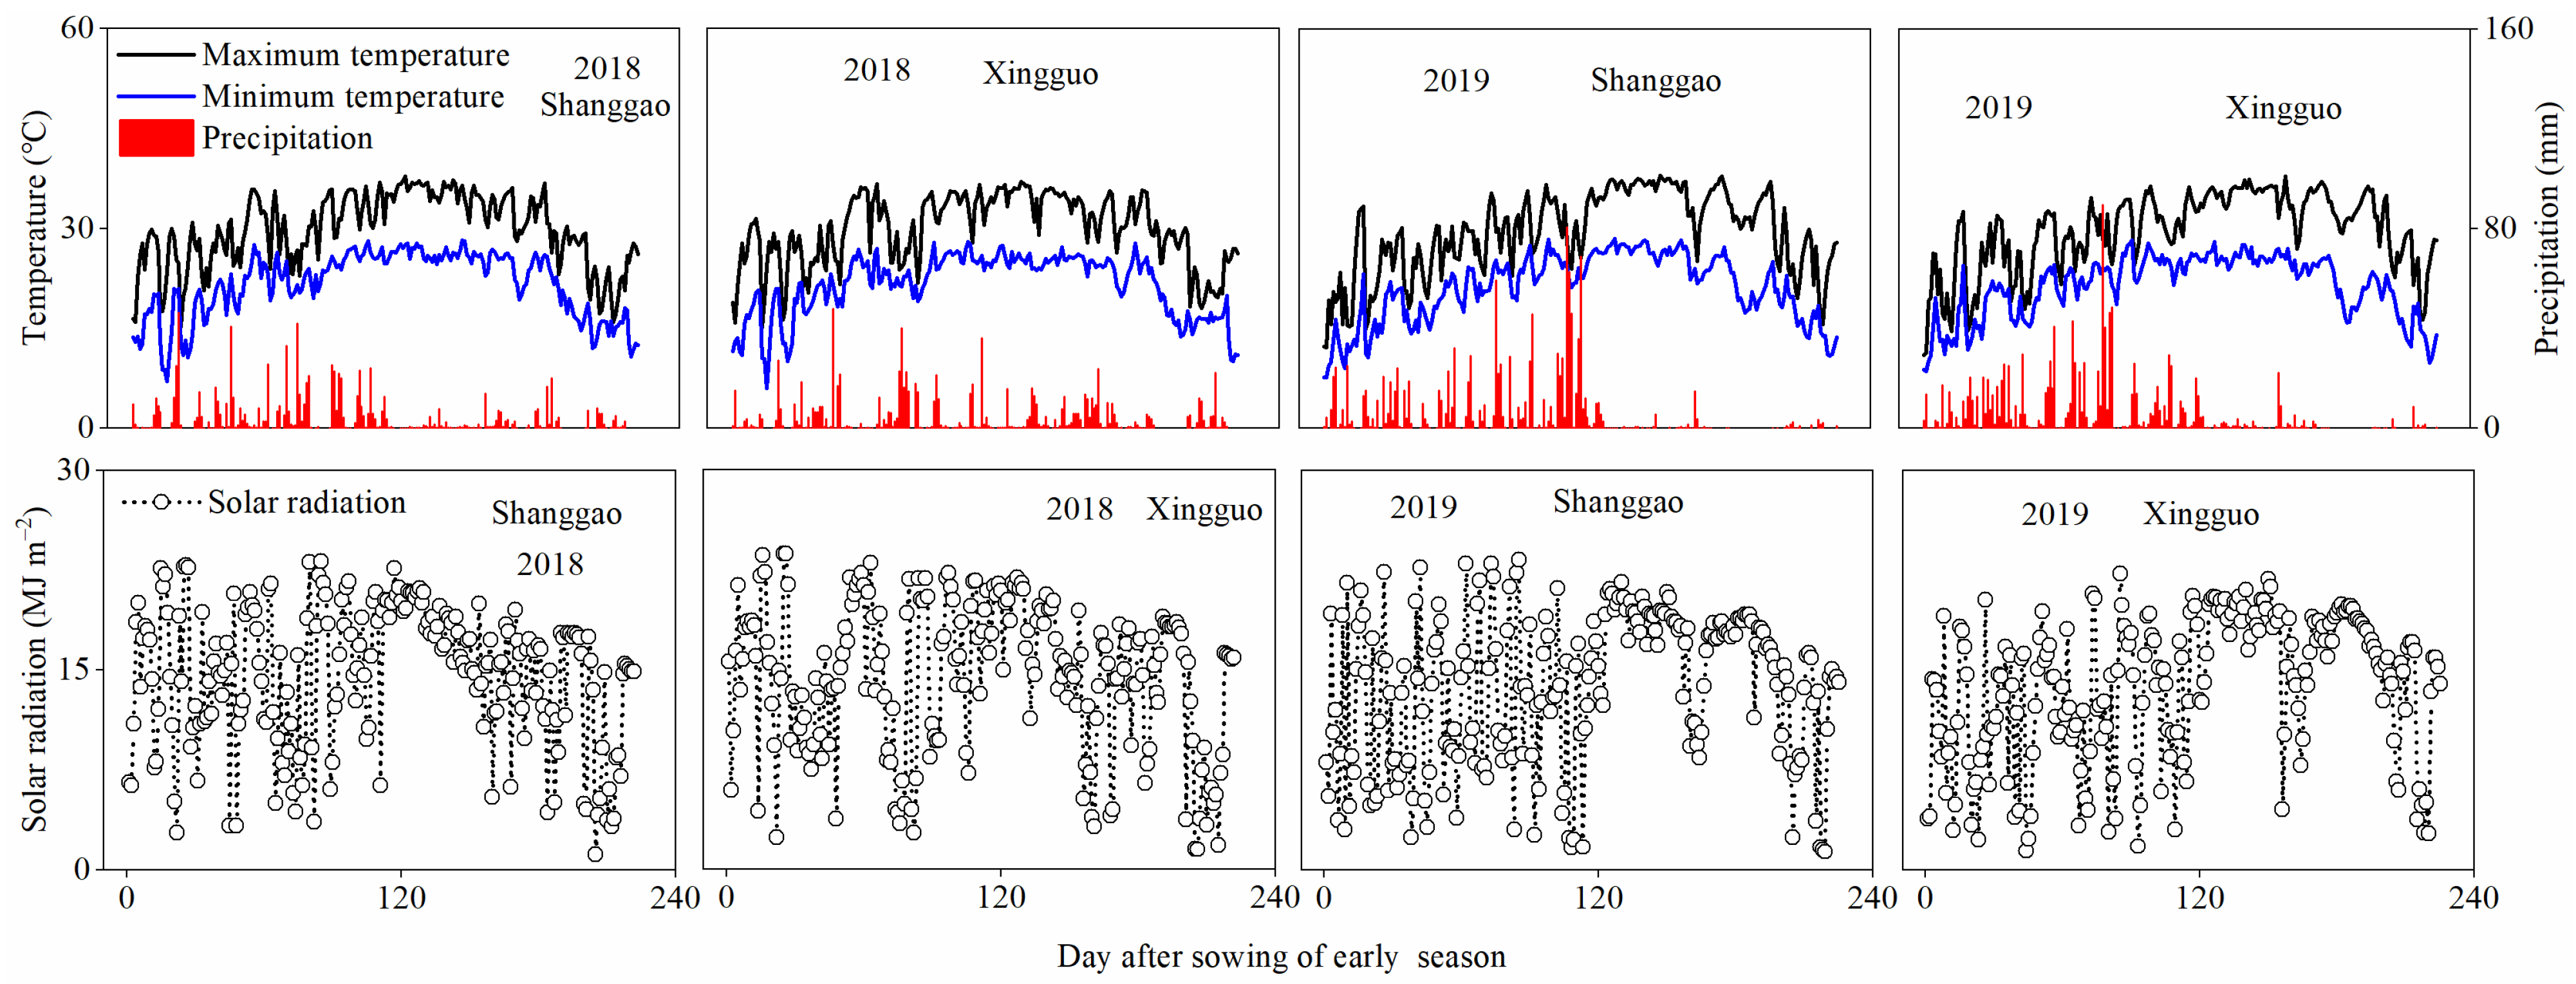
2.1. Site Description

The field experiment was carried out with a two-factor randomized trial of double cropping rice in Zengjia village, Shanggao County (28.28′ N, 115.12′ E) and Gaohu village, Xingguo County (26.48′ N, 115.32′ E), Jiangxi Province, China, during 2018 and 2019. The mean annual solar radiation, annual maximum temperature, annual minimum temperature and precipitation were 4270.54 and 4401.69 MJ m−2, 23.36 and 24.33 °C, 15.81 and 16.28 °C and 1486.90 and 1532.34 mm at Shanggao and Xingguo, respectively, and the two ecological regions are characterized by a subtropical monsoon climate. The Shanggao and Xingguo soil types are classified as red acid soils. The soil organic matter, total N, total phosphorus, total potassium, pH, available N, available phosphorus and available potassium for the 15 cm layer of Shanggao and Xingguo are 32.9 and 21.3 g kg−1, 1.99 and 1.35 g kg−1, 0.83 and 0.54 g kg−1, 22.2 and 14.9 g kg−1, 5.41 and 5.23, 154.8 and 103.5 mg kg−1, 14.4 and 8.8 mg kg−1 and 124.6 and 65.8 mg kg−1, respectively. The main nutrient demands of rice consist of four elements: carbon, N, phosphorus and potassium. Eight rice field soil nutrient parameters, including soil organic matter, total N, total phosphorus, total potassium, available N, available phosphorus, available potassium and pH, were selected as the indicators for the comprehensive evaluation of soil fertility [32,33]. The soil fertilities of Shanggao and Xingguo are high and medium, respectively, among the rice fields of South China. The solar radiation, maximum and minimum temperatures and precipitation in the double cropping rice seasons at Shanggao were 3277.35 and 3087.36 MJ m−2, 29.23 and 29.08 °C, 20.91 and 20.68 °C and 876.55 and 1238.57 mm in 2018 and 2019, respectively. The solar radiation, maximum and minimum temperatures and precipitation in the double cropping rice seasons at Xingguo were 3243.23 and 3113.48 MJ m−2, 30.71 and 30.64 °C, 20.96 and 21.17 °C and 887.42 and 1239.21 mm in 2018 and 2019, respectively (Figure 1).

2.2. Experiment Design and Field Management

Qiliangyou 2012 and Meixiangzhan 2 (high-quality rice) were selected for sowing in the early and late seasons. Two N application levels (120 and 150 kg ha−1 (N1 and N2) for early rice and 120 and 165 kg ha−1 (N1 and N2) for late rice) and three planting densities (86, 143 and 200 plants per m2 (D1, D2 and D3) for the early season and 57, 114 and 172 plants per m2 (D1, D2 and D3) for the late season) were applied to Shanggao and Xingguo. The N application rates and plant densities were selected based on the local recommendations of rice production. Treatments with 150 kg ha−1 and 86 plants per m2 (N2D1) and 165 kg ha−1 and 57 plants per m2 (N2D1) represented the rice farmers’ high-yield models and control plots in the early and late seasons. Models with 120 kg ha−1 and 143 or 200 plants per m2 (N1D2 and N1D3 in early season) and 120 kg ha−1 and 114 or 172 plants per m2 (N1D2 and N1D3 in late season) represented an increased plant density with a decreased N rate. The area of a plot was 30 m2, the treatments were conducted in triplicate and the planting spacing was 25 cm × 14 cm. The treatments were divided by the field ridge covered with plastic film and were drained and irrigated separately. The sowing dates of the early season in 2018 and 2019 were 24 March and 23 March, respectively, and the sowing dates of the late season in 2018 and 2019 were 23 June and 25 June. In the N1 treatment, 30, 36 and 54 kg ha−1 was divided into basal, tiller and panicle fertilizer in the early season. In the N2 treatment, 60, 36 and 54 kg ha−1 was divided into basal, tiller and panicle fertilizer in the early season. In the N1 treatment, 15, 42 and 63 kg ha−1 was divided into basal, tiller and panicle fertilizer in the late season. In the N2 treatment, 60, 42 and 63 kg ha−1 was divided into basal, tiller and panicle fertilizer in the late season. The application rates of the phosphorus and potassium fertilizers in each plot were the same. The application rates of the phosphorus (P) fertilizer were 75 and 80 kg ha−1 P in the early and late season, respectively, all of which were applied as basal fertilizer. The application rates of the potassium (K) fertilizer were 150 and 165 kg ha−1 K in the early and late season, respectively, which were divided into basal and panicle fertilizers in the same amount. Other management practices were operated according to conventional high-yield cultivation measures and were consistent in the two ecological regions.

2.3. Data Collection

2.3.1. The Soil Properties

Before the transplanting of the early season, 15 cm soil layer samples were taken according to the method (five soil cores per plot), and the soil organic matter, total N, available N, total phosphorus, available phosphorus, total potassium, available potassium and pH of eight parameters were measured by the methods [34]. The soil organic matter was measured with the potassium dichromate oxidation-oil bath heating method (digested by potassium dichromate and sulfuric acid) [34]. The total N was measured by the Kjeldahl method (digested by sulfuric acid) with a instrument (Kjeldahl 8400, Foss, Beijing, Denmark), and the available N was measured with a microdiffusion technique after alkaline hydrolysis (digested by sodium hydroxide) [35]. The total phosphorus and potassium were measured with the molybdenum blue colorimetry method (digested by sulfuric acid and perchloric acid) and the flame photometry method (digested by sodium hydroxide), respectively [35]. The available phosphorus and available potassium were determined by the Olsen method and by the flame photometry method (extracted by ammonium acetate), respectively [34,36]. The pH instrument (Qiwei, Hangzhou, China) determined the pH [35].

2.3.2. Yield and Yield Compositions

At maturity, 10 plants were taken diagonally in each plot, and after threshing, the panicle number, 1000-grain weight and spikelet filling percentage were measured by the water-bleaching method [37]. The panicle number and yield were determined through the 4 m2 acreage in the center of each plot, and the actual yield was calculated with a conversion factor of 13.5% fresh weight.

2.3.3. Biomass and N, Phosphorus and Potassium Uptake

At the mid-tillering, panicle differentiation II period, heading and maturity, 10 plants were collected from each plot according to a diagonal method. For the samples, the stem, leaves and panicle (heading and mature stage) were separated and packed in kraft paper bags. The plants were oven dried at 105 °C for 30 min, after which the temperature was lowered to 80 °C until the constant weight was reached, and the biomass was weighed by a balance scale. The aboveground plants from the four growth periods were pulverized with a pulverizer, the plant nitrogen content was measured by the micro Kjeldahl digestion method with a instrument (Kjeldahl 8400, Foss, Beijing, Denmark) and the plant phosphorus and potassium contents were measured by the flame photometry and the molybdenum-blue colorimetric methods in accordance with Fang et al. [38] and Dinh et al. [39].
The following parameters [40] are calculated:
Nutrient (N, Phosphorus and Potassium) uptake (kg ha−1) = Nutrient (N, Phosphorus and Potassium) content of plant × Biomass
Grain production per kg nutrient (GPN, GPP, GPK) (kg) = Yield/Nutrient (N, Phosphorus and Potassium) uptake
Nutrient (N, Phosphorus and Potassium) utilization (PFPN, PFPN, PFPN) (kg kg−1) = Yield/N, Phosphorus and Potassium fertilizer application rate

2.3.4. Photosynthetic Rate

At the heading stage, 10 flag leaves with the same growth were selected from each plot, and the photosynthetic rate was measured from 9:00 AM to 11:00 AM by a photosynthetic apparatus (Li-6400, Li-cor, Lincoln, NE, USA) in triplicate.

2.4. Data and Analysis

The data analysis was processed with SPSS 25 software (SPSS, Chicago, IL, USA), the figures were generated with Origin 9 (Origin Lab Corporation, Northampton, MA, USA) and the significance testing used the least significant difference method (p < 5%).

3. Result

3.1. Yield and Yield Compositions

The N rate and plant density had different effects on the double cropping rice yields at Shanggao and Xingguo, respectively (Table 1 and Table 2). In the two ecological regions, compared with the N1 treatment, the yields under the N2 treatment in the double cropping rice increased significantly; compared with the D1 treatment, the yields under the D2 and D3 treatments increased. There were no differences in the double cropping yields among three treatments (the N2D1, the N1D2 and the N1D3 treatment) at Shanggao. At Xingguo, the yields under the N2D1 treatment were 6.24% and 6.25% higher than those under the N1D2 and N1D3 treatments for late rice.
In the two ecological regions, an increased N application rate and planting density increased the panicle number in the early and late rice. The increase in the panicle number from the increased N application was lower than that from the increased planting density; the panicle numbers under the N1D2 and N1D3 treatments increased compared with those under the N2D1 treatment. The grain number per panicle decreased with the increased plant density; the highest value occurred in the D1 treatment, and the lowest value occurred in the D3 treatment. The trend in the seed setting rate was inconsistent among the treatments. There were no significant differences in the impacts of the plant density and the N application rate on the 1000-grain weight.

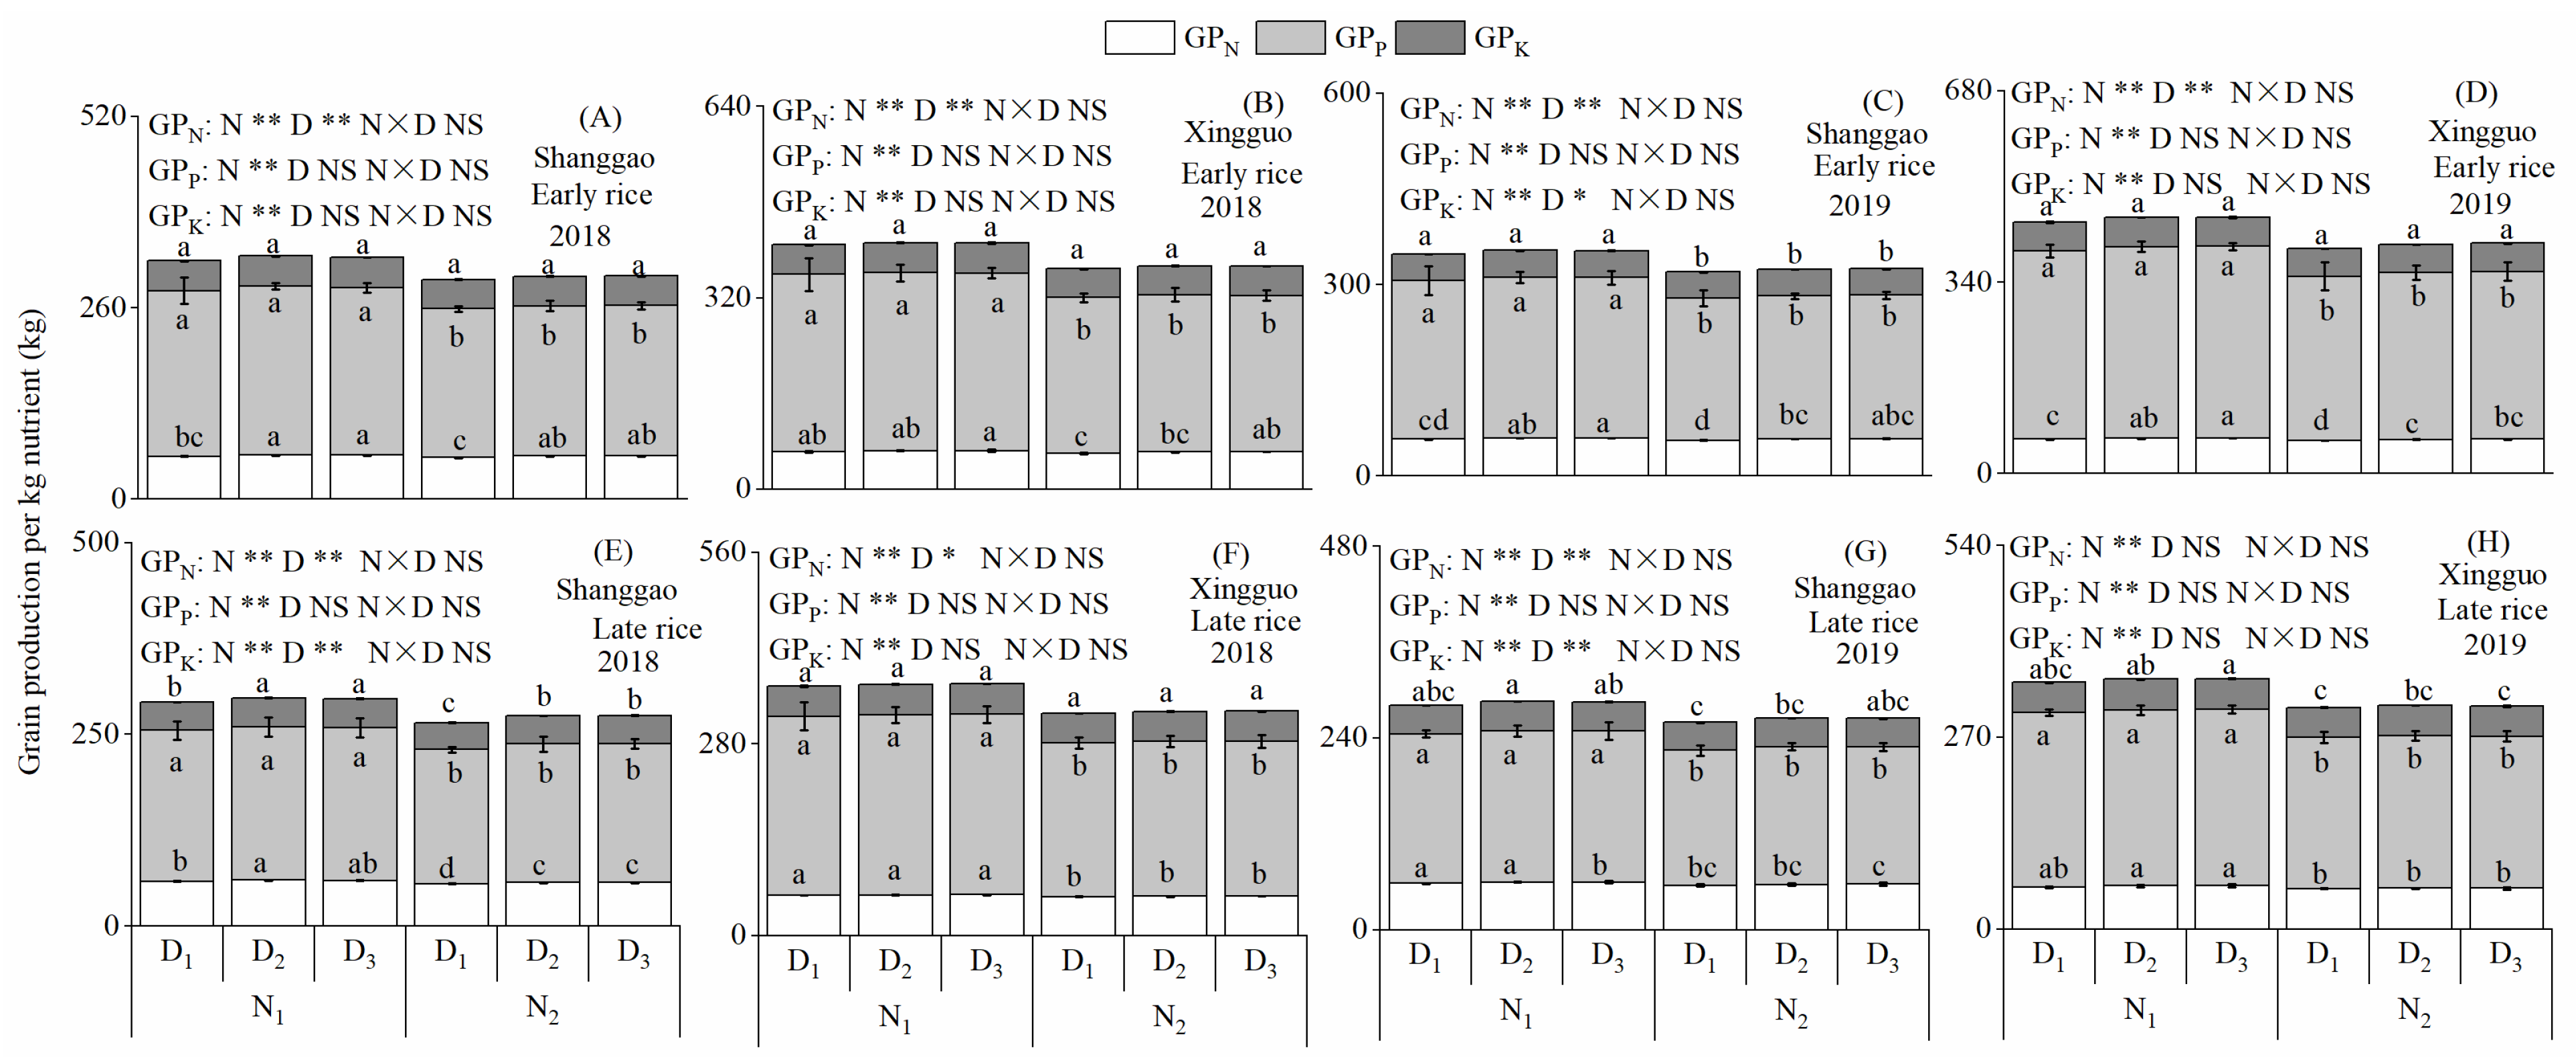
3.2. GPN, GPP and GPK

In the two ecological regions of the double cropping rice, a higher N application rate reduced the GPN, GPP and GPK, and the GPN, GPP and GPK under the D2 and D3 treatment were slightly higher than those under the D1 treatment (Figure 2). Compared with the N2D1 treatment, the GPN, GPP and GPK under the N1D2 treatment of early rice at Shanggao increased by 6.10%, 13.17% and 3.85%, respectively, and those at Xingguo increased by 7.11%, 15.47% and 4.00%, respectively. Compared with the N2D1 treatment, the GPN, GPP and GPK under the N1D2 treatment of late rice at Shanggao increased by 7.45%, 13.21% and 6.69%, respectively, and those at Xingguo increased by 5.36%, 16.91% and 3.01%, respectively. There were no differences in the GPN, GPP and GPK between the N1D2 treatment and the N1D3 treatment of the double cropping rice in the two ecological regions.

3.3. PFPN, PFPp and PFPk
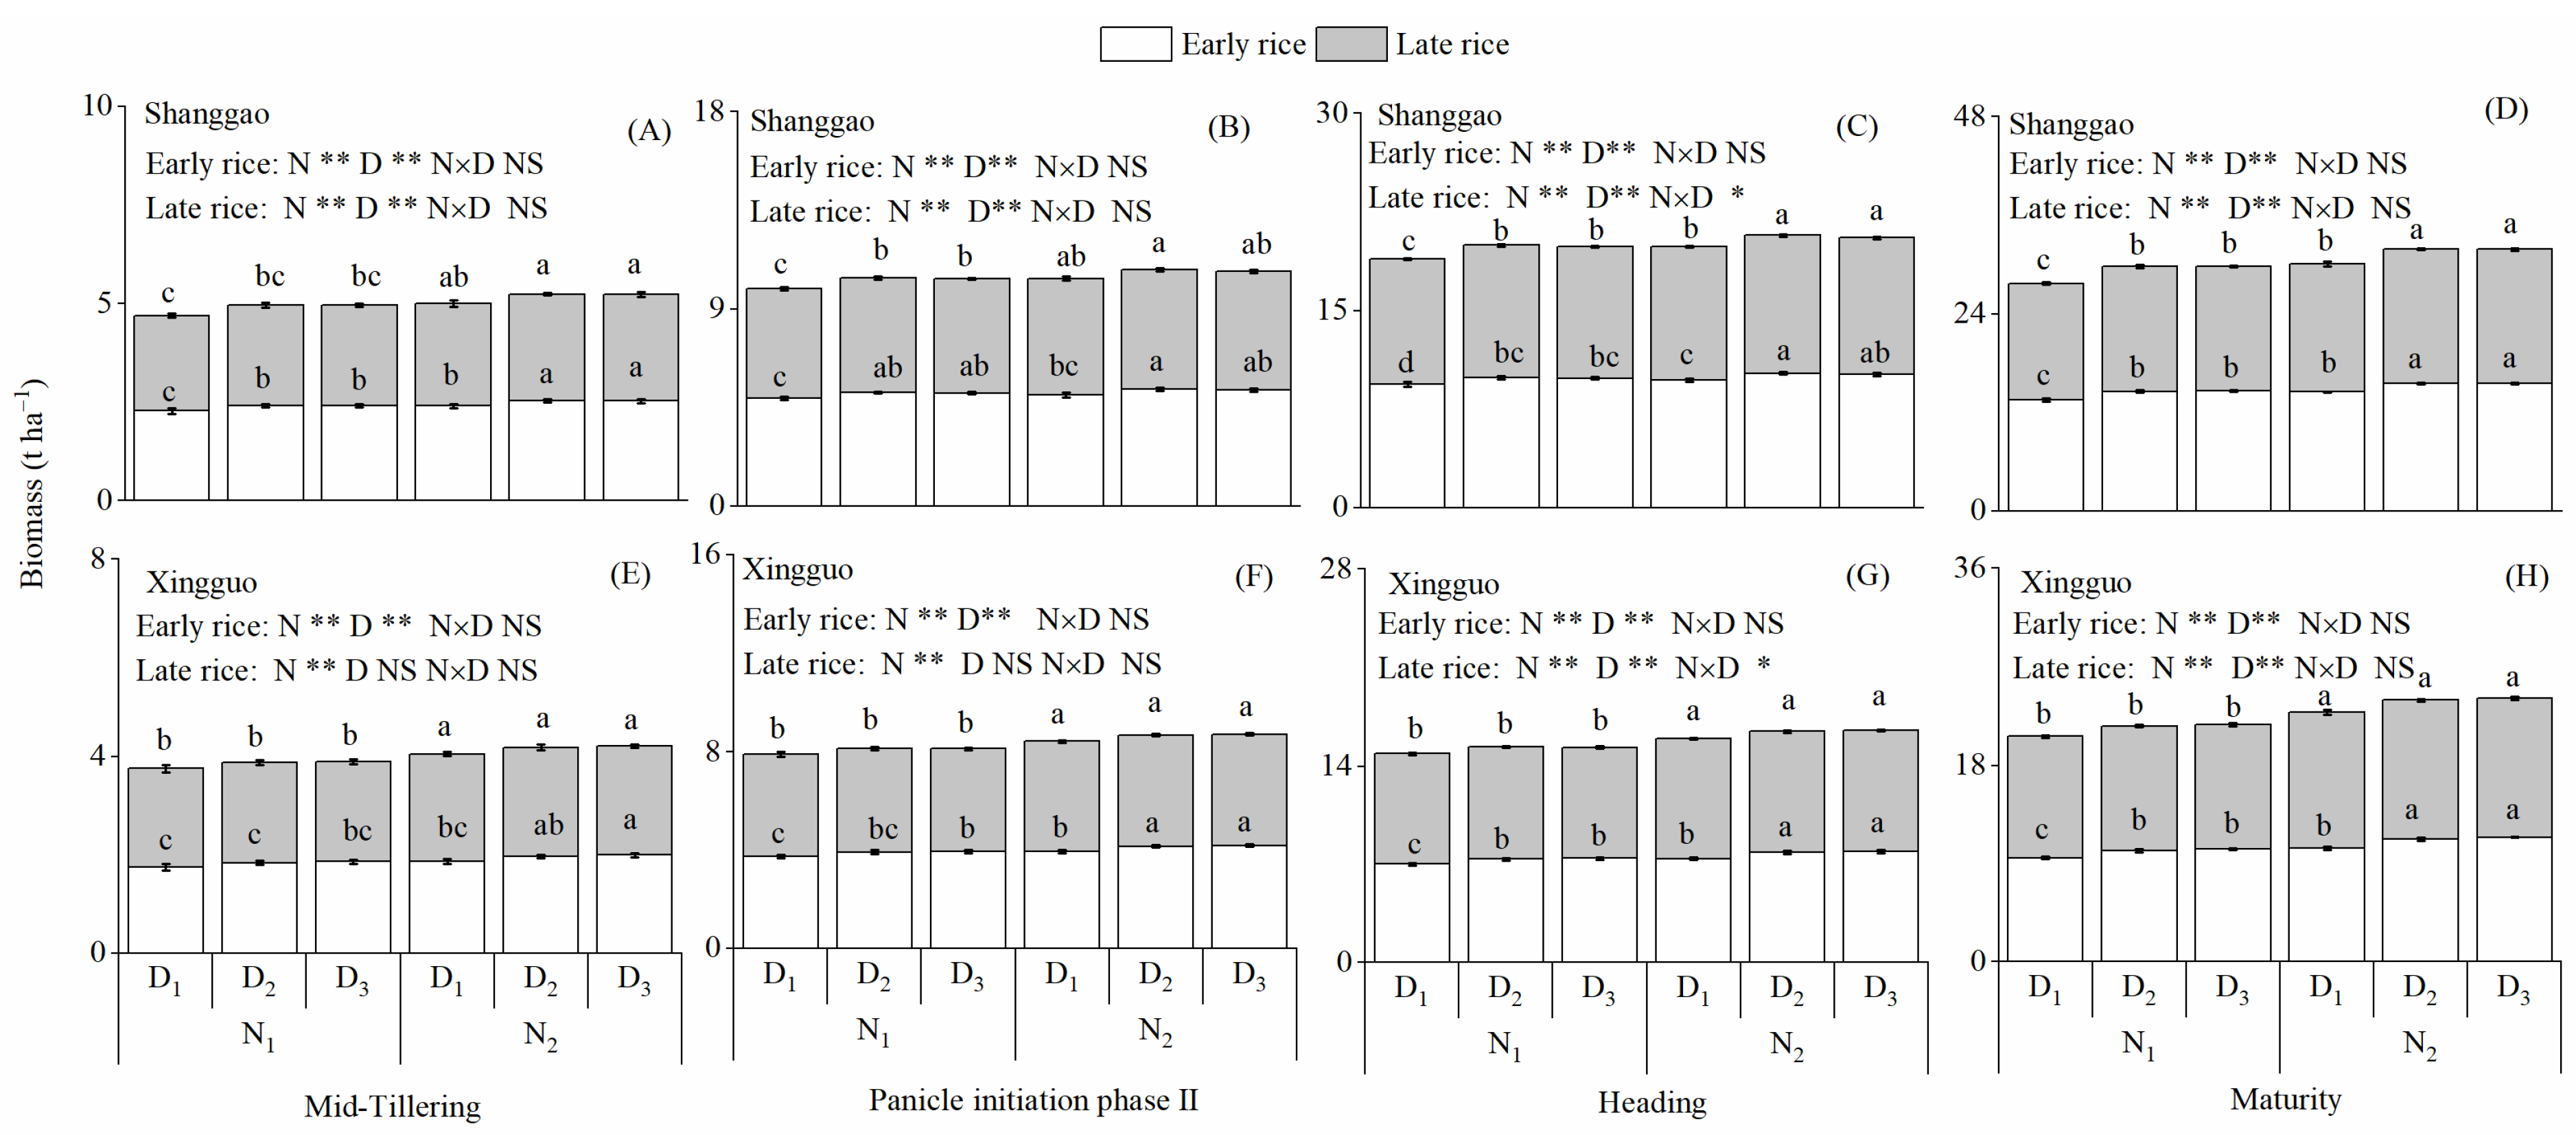
In the two ecological regions of the early and late seasons, the PFPN under the N1 treatment was higher than that under the N2 treatment, but the PFPp and PFPk under the N1 treatment were lower than those under the N2 treatment (Figure 3); the PFPN, PFPp and PFPk under the D1 treatment were lower than those under the D2 and D3 treatments. At Shanggao, compared with the N2D1 treatment, the PFPN under the N1D2 treatment of early and late rice increased by 29.49% and 40.52%, respectively; the PFPp and PFPk under the N1D2 treatment of early and late rice increased slightly. At Xingguo, compared with the N2D1 treatment, the PFPN under the N1D2 treatment of early and late rice increased by 26.17% and 29.43%, respectively; the PFPp and PFPk under the N1D2 treatment of early rice increased slightly, and those of the late rice decreased by 5.86% and 5.87%, respectively.

3.4. Biomass

In the two ecological regions, increased nitrogen application and planting density increased the biomass at four stages for the early and late seasons (Figure 4). In the two ecological regions, the biomass under the N2 treatment at the mid-tillering, panicle differentiation II, heading and maturity in the early and late season was higher than that under the N1 treatment; the biomass under the D2 and D3 treatment at the mid-tillering, panicle differentiation II, heading and maturity of the early and late season was higher than that under the N1 treatment. There was no difference in the biomass between the N1D2, N1D3 and N2D1 treatment of the double cropping rice at Shanggao and of the early rice at Xingguo. At Xingguo, compared with the N2D1 treatment, the N1D2 treatment for the late season at the mid-tillering, panicle differentiation II, heading and maturity decreased by 6.42%, 6.25%, 6.68% and 8.51%, respectively; there was no difference in the biomass between the N1D2 and N1D3 treatments. Among the N rate and plant density treatments, the highest biomass at maturity for the double cropping rice season in the two ecological regions was obtained under the N2D2 treatment (15.53, 16.36, 11.26 and 12.69 t ha−1), and a consistent trend was obtained at the mid-tillering stage.

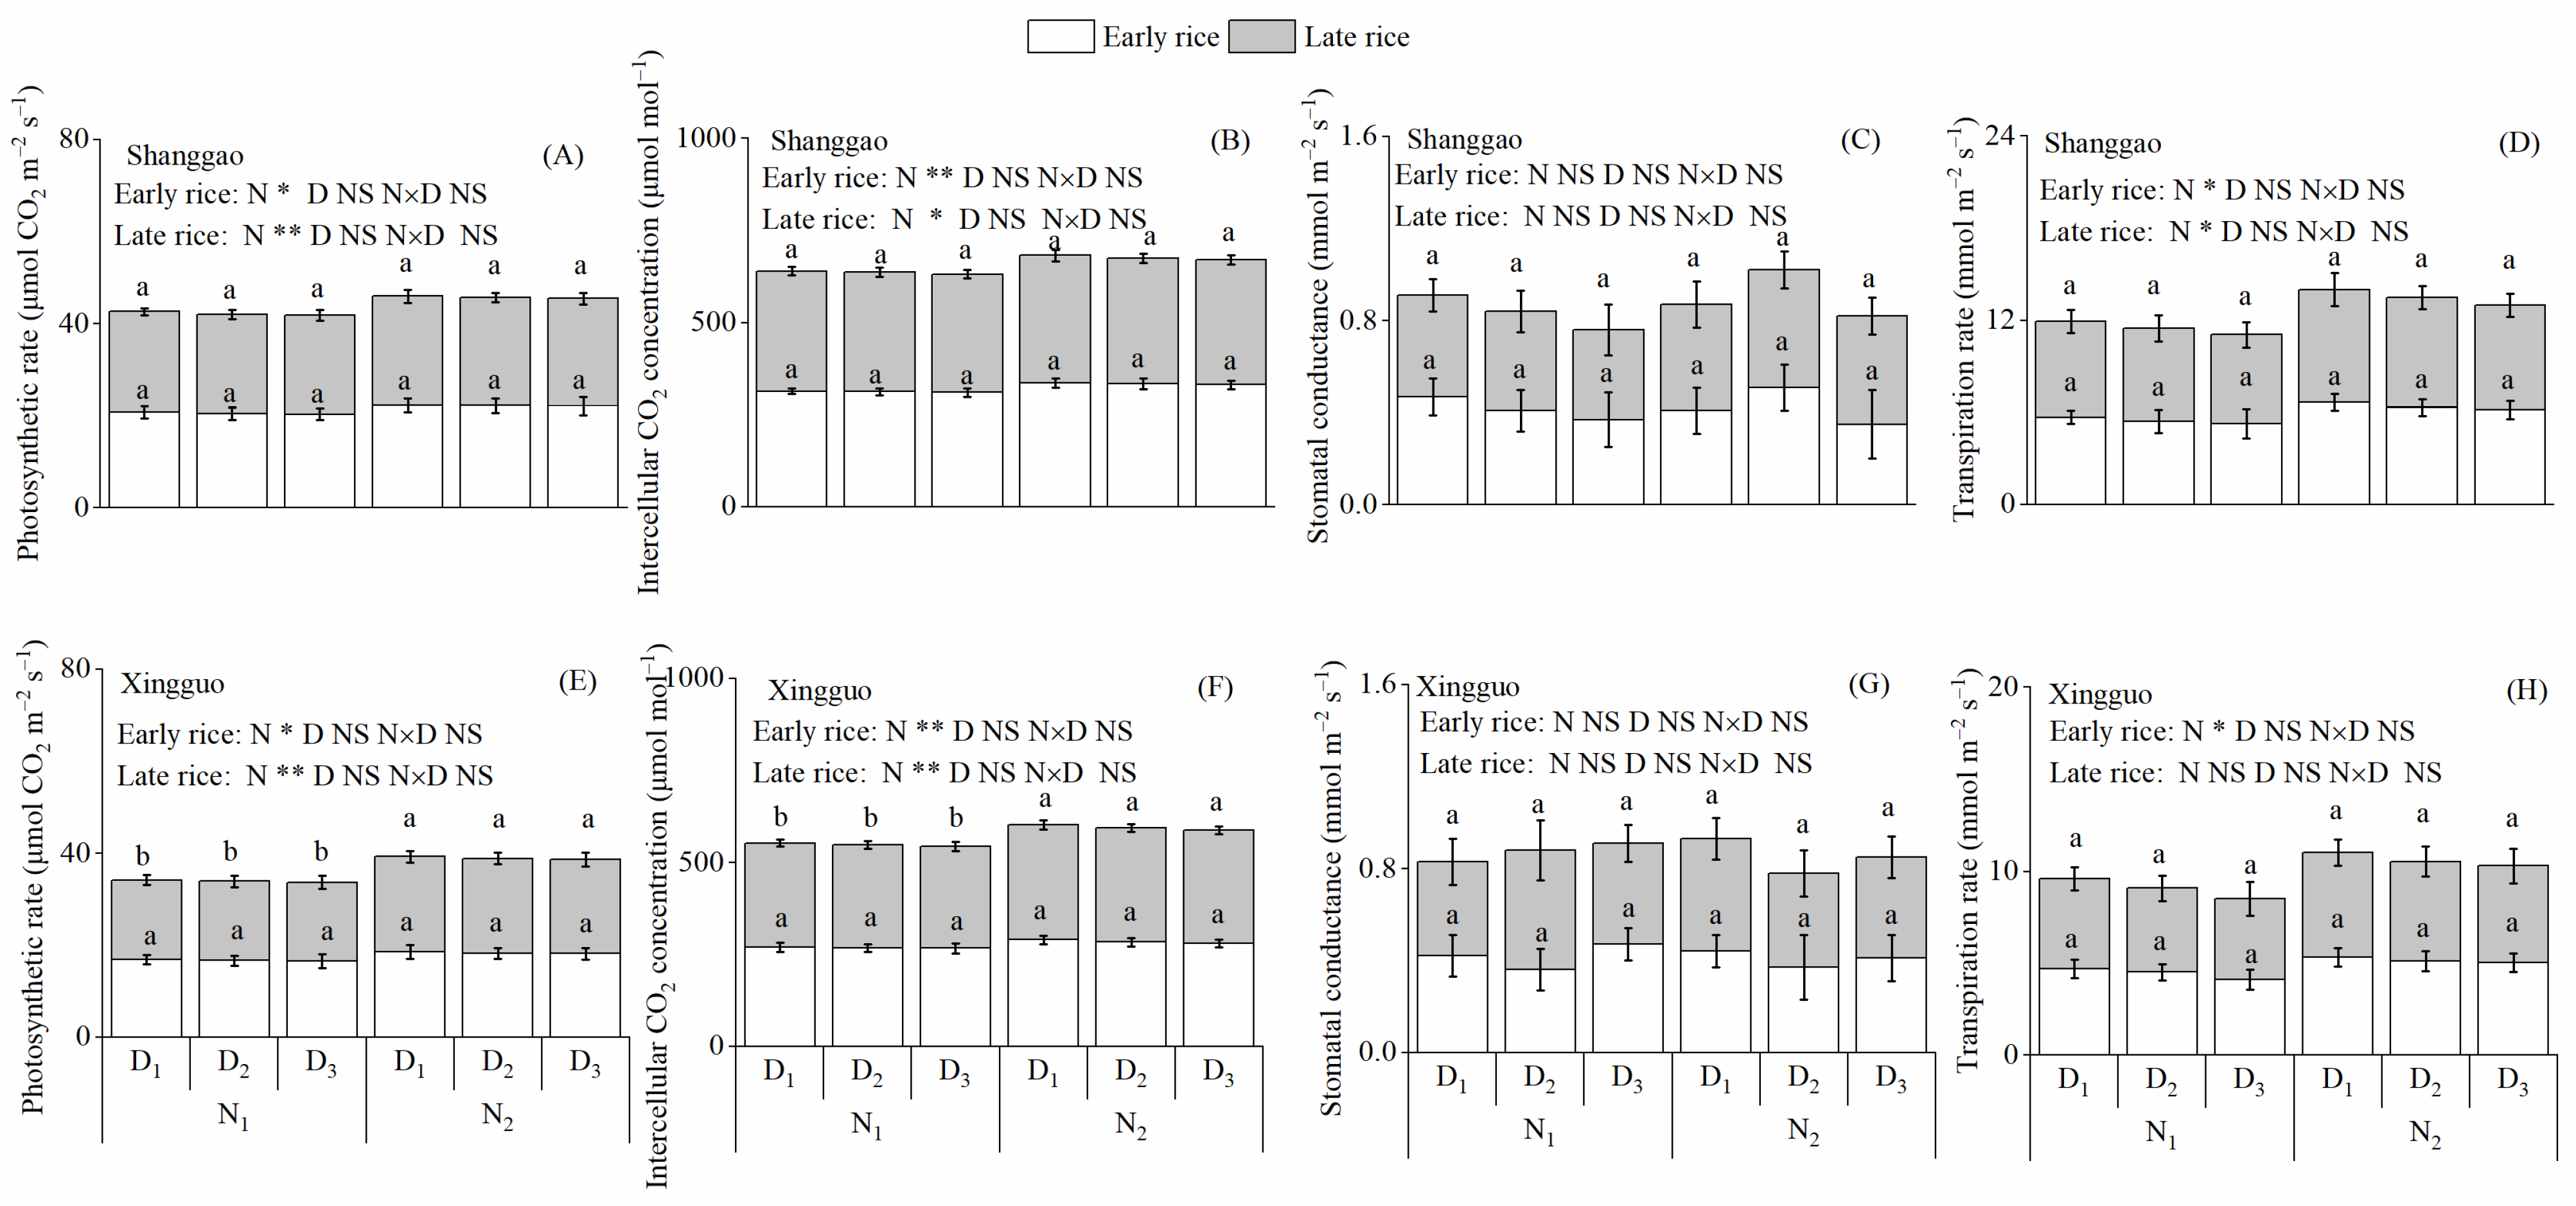
3.5. Photosynthetic Characteristics

In the two ecological regions, the planting density did not affect the photosynthetic characteristics for the early and late season; the photosynthetic rate and intercellular CO2 concentration for the early and late season under the N2D1 treatment were higher than those under the N1D2 treatment (Figure 5). At Shanggao, the photosynthetic rate and intercellular CO2 concentration of early rice under the N1D2 treatment were 8.52% and 7.14% lower than those under the N2D1 treatment, and those of the late rice were 8.86% and 6.36% lower than those under the N2D1 treatment. At Xingguo, compared with the N2D1 treatment, the photosynthetic rate in early and late rice under the N1D2 treatment decreased by 10.27% and 16.27%, respectively, and the intercellular CO2 concentration under the N1D2 treatment decreased by 7.61% and 10.22%, respectively.

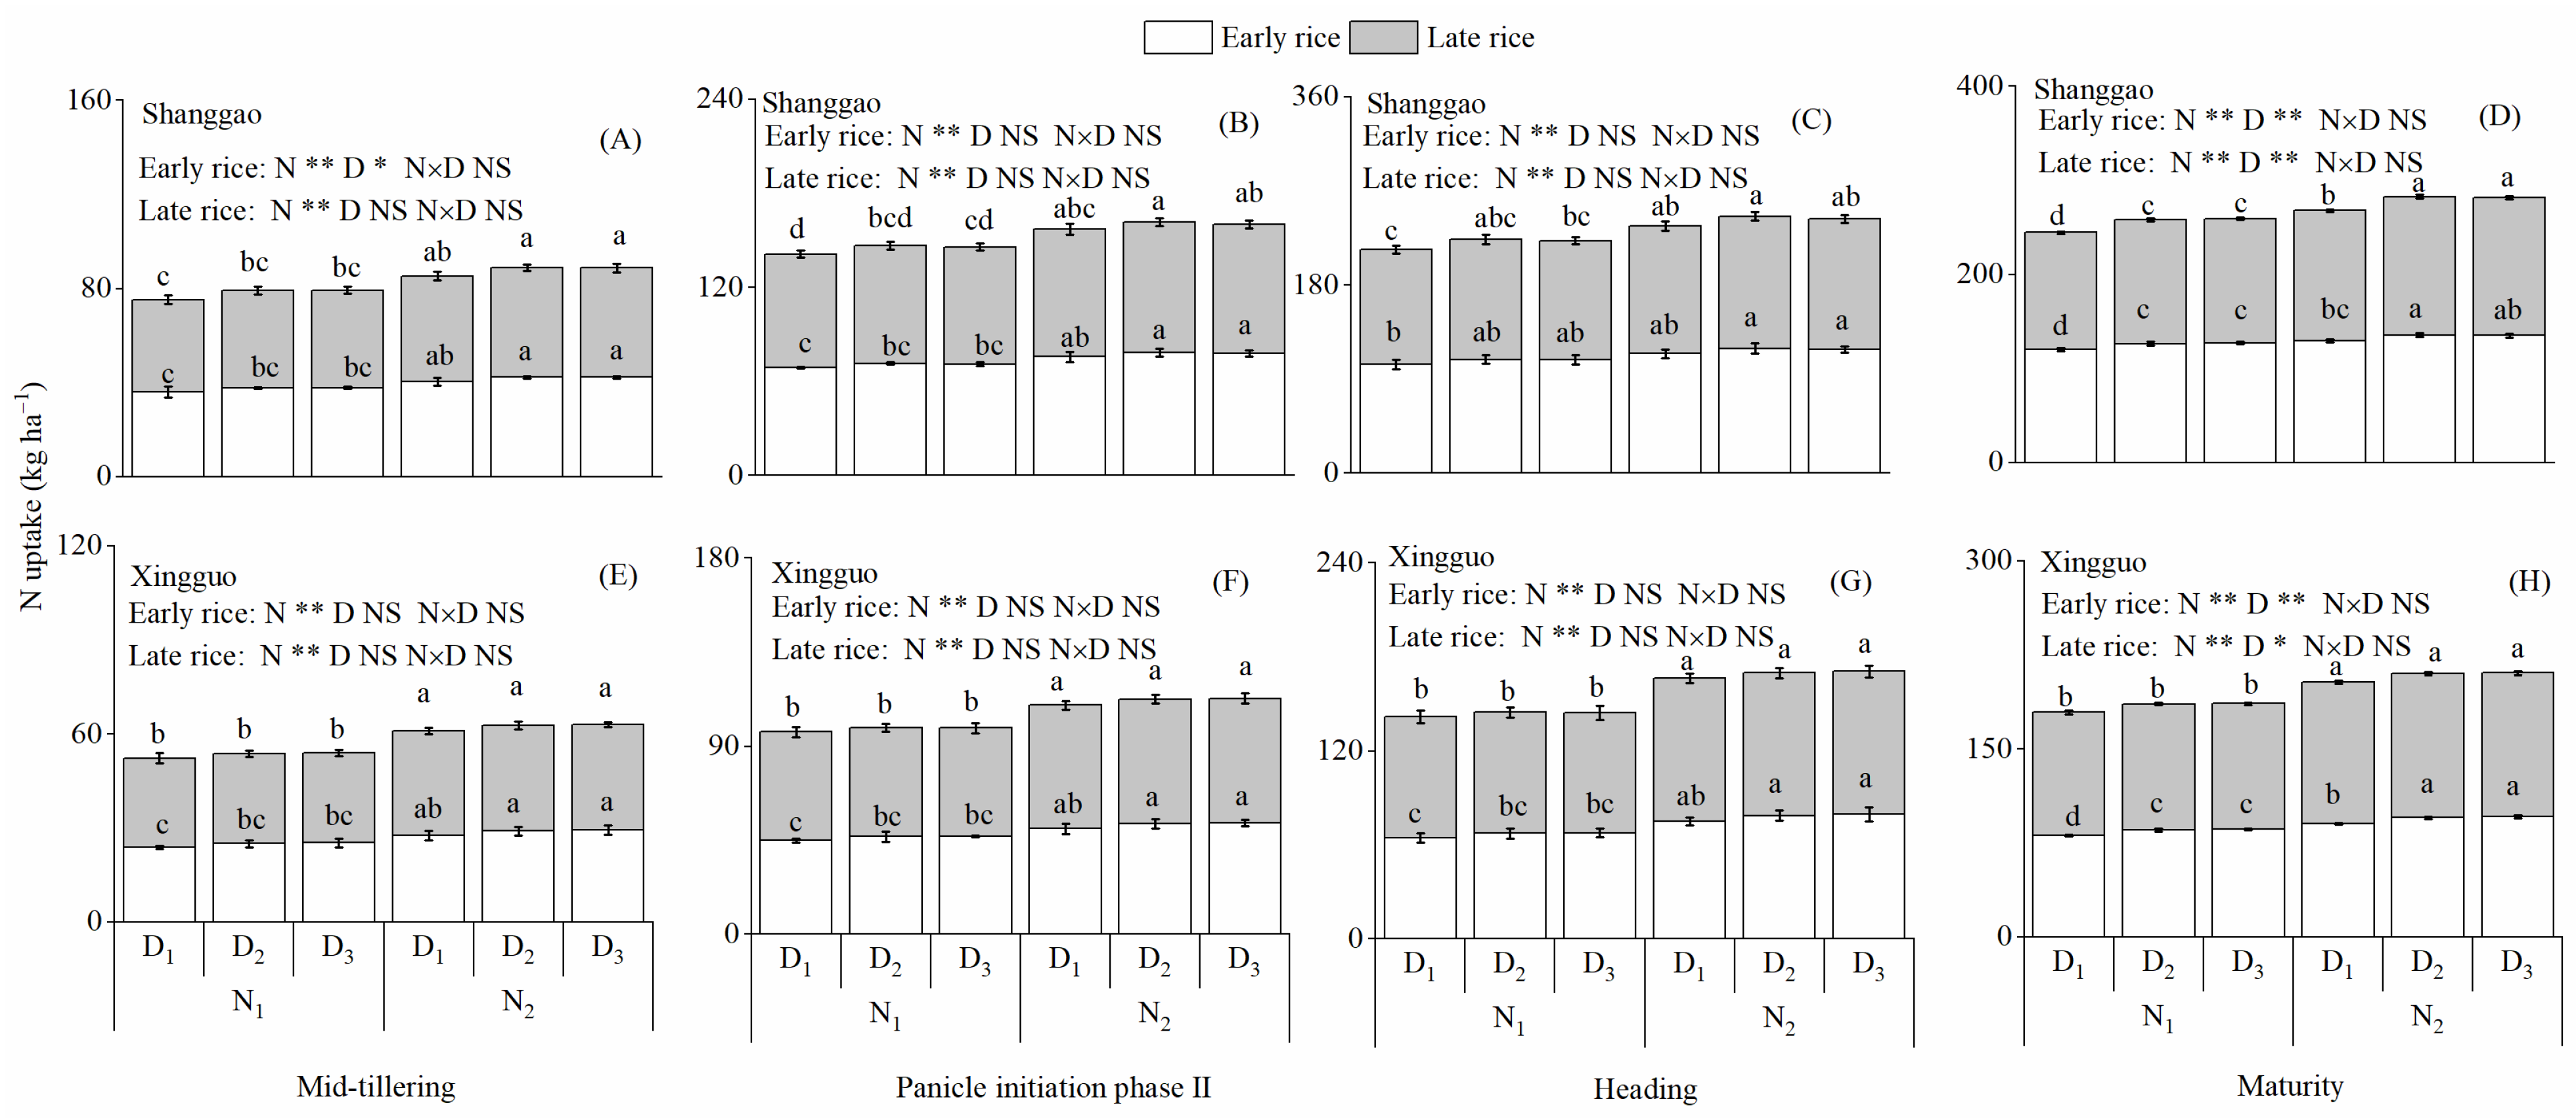
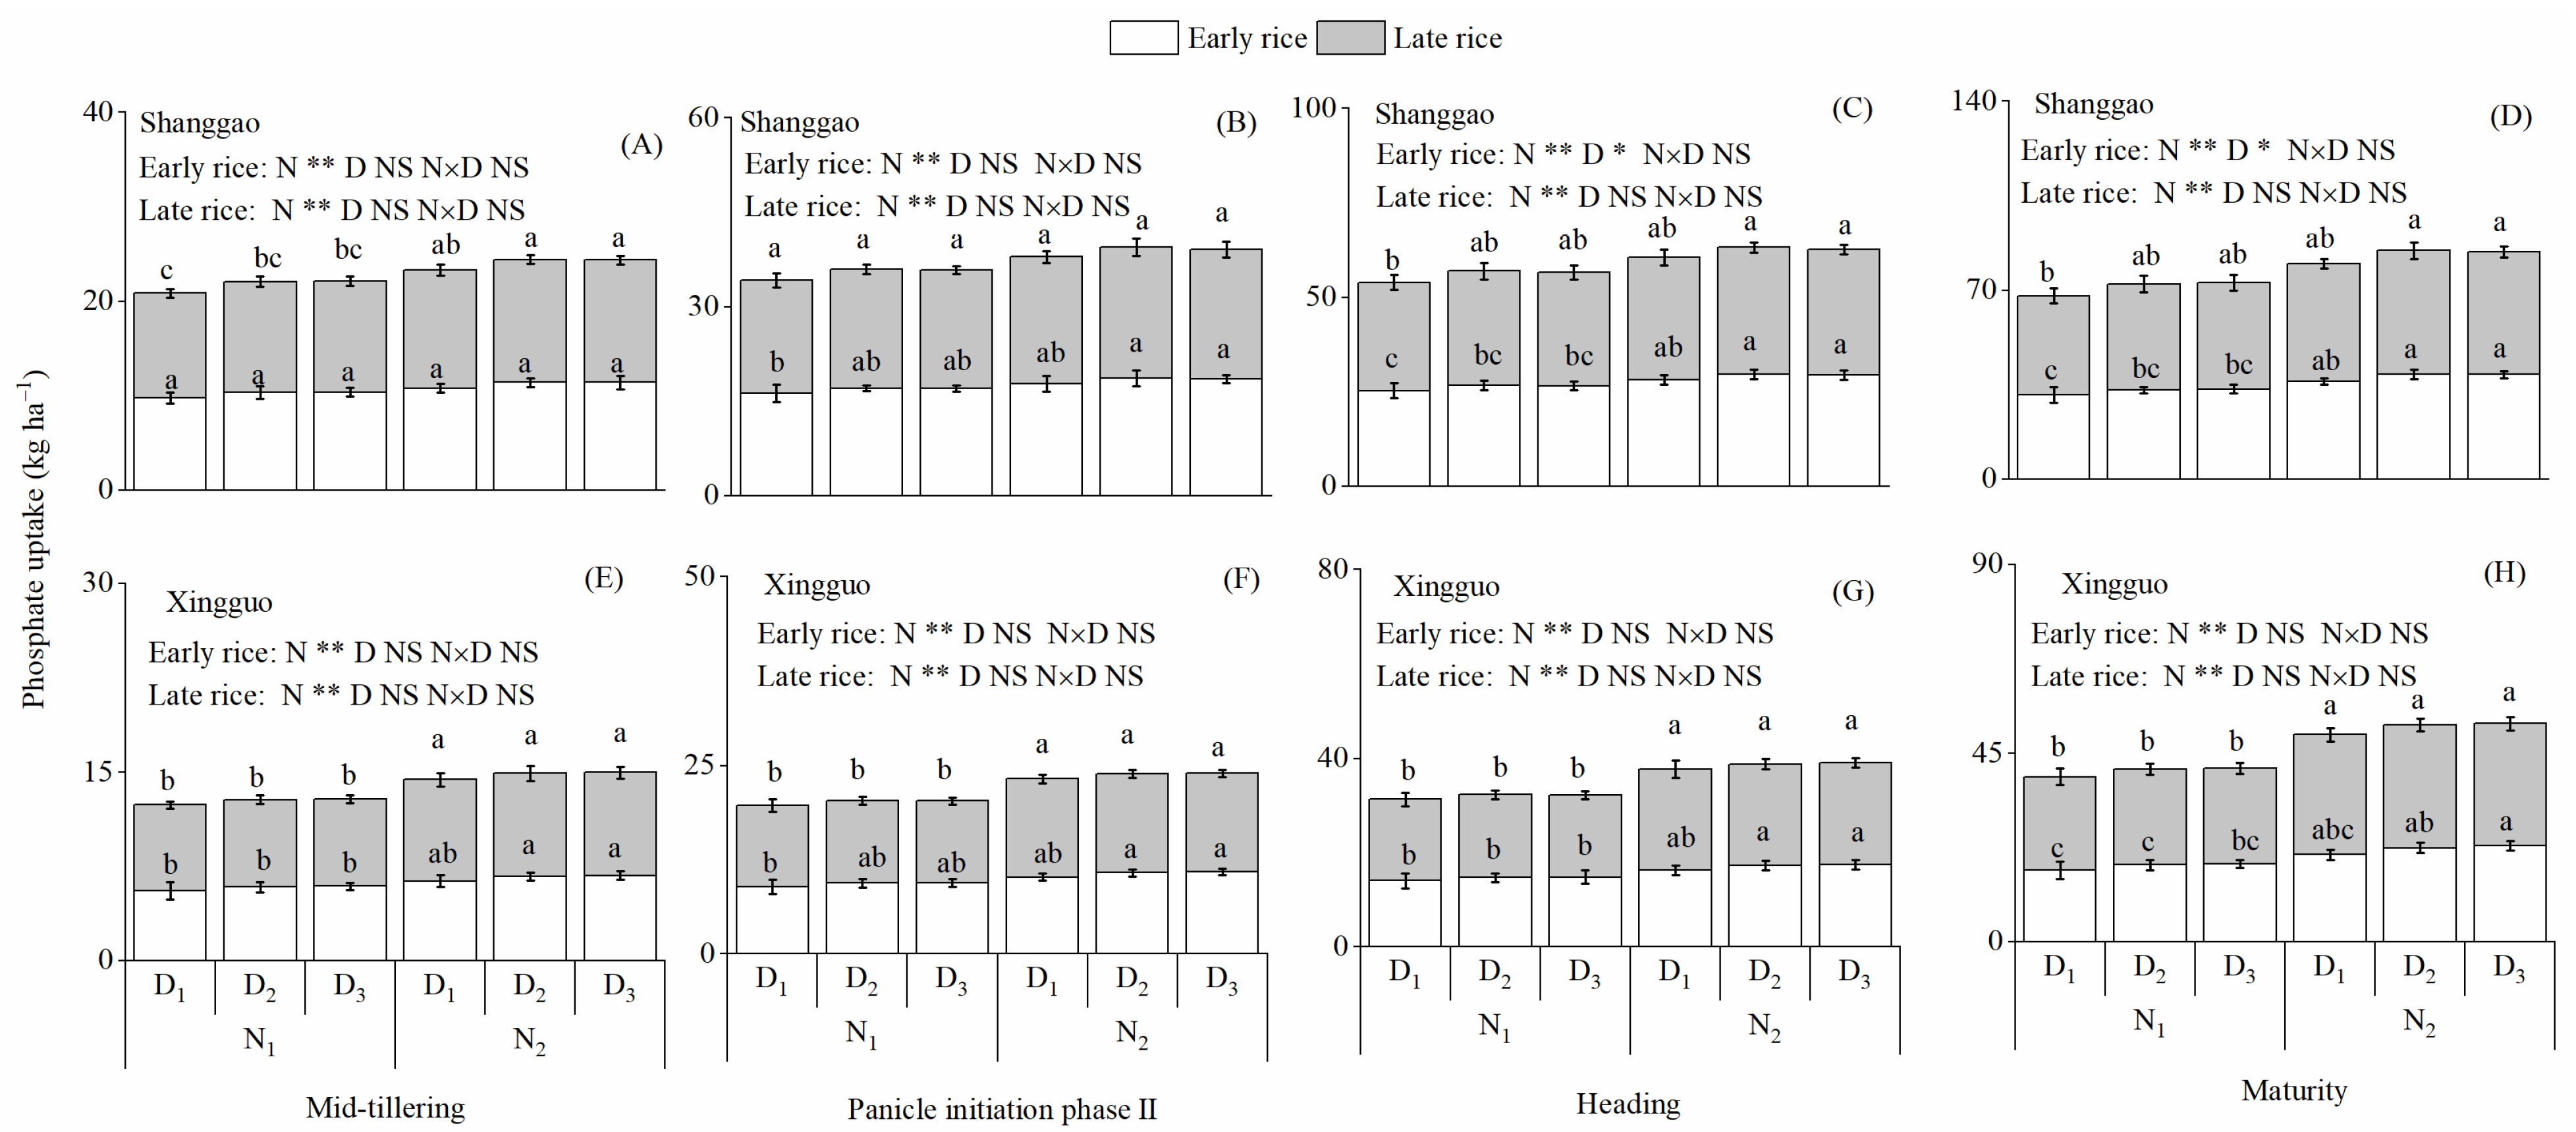
3.6. N, Phosphorus and Potassium Uptake

In the two ecological regions, the N, phosphorus and potassium uptake under the D2 and D3 treatments at the mid-tillering, panicle differentiation II period, heading and maturity for the double cropping rice season were slightly higher than those under the D1 treatment, and there was no difference between the D2 and D3 treatments. Compared with the N1 treatment, the N, phosphorus and potassium uptake under the N2 treatment at the mid-tillering, panicle differentiation II period, heading and maturity of the double cropping rice significantly increased (Figure 6, Figure 7 and Figure 8). There were no differences in the N, phosphorus and potassium uptake between the N1D2, N1D3 and N2D1 treatments at the mid-tillering, panicle differentiation II period, heading and maturity of the double cropping rice at Shanggao and the early rice at Xingguo. At Xingguo, compared with the N2D1 treatment, the N uptake under the N1D2 treatment at the mid-tillering, panicle differentiation II period, heading and maturity for late season decreased by 13.87%, 11.96%, 15.38% and 10.71%; the phosphorus uptake under the N1D2 treatment at the mid-tillering, panicle differentiation II period, heading and maturity for late season decreased by 14.11%, 15.98%, 17.87% and 20.43%; the potassium uptake under the N1D2 treatment at the mid-tillering, panicle differentiation II period, heading and maturity for the late season decreased by 6.96%, 6.28%, 7.25% and 9.23%, respectively. There were no differences in the N, phosphorus and potassium uptake between the N1D2 and N1D3 treatments at the mid-tillering, panicle differentiation II period, heading and maturity for the late season at Xingguo.

3.7. Correlation between the Different Parameters and the Yield

In the two ecological regions, the double cropping rice yield was significantly positively (p < 1% or p < 5%) related to the leaf photosynthetic rate and the N, phosphorus and potassium uptake (Figure 9).

4. Discussion

4.1. Response of Double Cropping Yield to the N Rate and Plant Density in Different Ecological Regions

N fertilizer is an important limiting factor affecting crop yield [41]. Increasing the N application rate can enhance the rice yield [42]. The results showed that, in the two ecological regions, the yields in the early and late season under the N2 treatment enhanced compared with those under the N1 treatment. The reason for this was that the higher N application increased the biomass, the panicle number and the photosynthetic rate at the heading stage, which led to enhanced rice productivity. A consistent result was discovered by a previous study [43]. This study found that the yield increases in double cropping rice that were achieved by changing the N application rate from N1 to N2 at Shanggao were lower than those at Xingguo, and the soil organic matter and available nutrient contents of Shanggao were higher than those of Xingguo. The ecological region with high soil fertility had a high soil available nutrient content, which led to a decrease in the dependence of the rice yield on inorganic N fertilizer [44,45]. Therefore, the high N fertilizer input decreased the yield remuneration of double cropping rice in the ecological region with high soil fertility.
Planting density affects the rice population structure, yield components and dry matter [25,46]. Xie et al. [47] showed that reasonably dense planting reduced the number of individual tillers but increased the panicle number of the population, which was more conducive to achieving full rice yield potential. The current results showed that, in the two ecological regions, compared with the D1 treatment, the biomass and nutrient uptake of double cropping rice under the D2 treatment increased because of the good complementarity between the panicle number, the grains per panicle and the seed setting rate. The result is similar to that observed through the previous study [31]. When the planting density was too high and the population was too large at the early growth stage, fierce intraspecific competition and unbalanced yield components occurred [28,48]. The results showed that, compared with the D2 treatment, the D3 treatment increased the panicle number but reduced the grains per ear, and the yield in the double cropping season did not change significantly. Moreover, there was no difference between the two ecological regions. The reason for this may be that the self-regulation ability of a population under dense planting conditions may be closely related to the genotype of the variety.
The N fertilizer application and plant density had important influences on the crop production, and there was a coupling effect between them in an ecological scenario [49,50]. Huang et al. [31] showed that, in double cropping machine-transplanted rice, reduced N application treatment led to declines in the growth rate and dry matter, but the yield negative effect of the N reduction was compensated for through the increased plant density. The results showed that dense planting could effectively make up for the yield reduction due to N reduction in double cropping rice at Shanggao. At Xingguo, the yield reduction of the late rice caused by decreased N application could not be compensated for by dense planting. The reason for this may be that the different soil fertilities affected the yield compensation ability of the rice, and the insufficient supply of soil nutrients led to a decline in rice population productivity [51]. On the other hand, the lower N application rate significantly decreased the photosynthetic rate and biomass [52]. Therefore, reasonable dense planting and N fertilizer management promoted the yield of double cropping rice in the two ecological regions, but the low soil fertility reduced the yield capacity of dense planting to compensate for the reduced N.

4.2. Response of Nutrient Uptake and the Utilization of Double Cropping Rice to the N Rate and Plant Density in Different Ecological Regions

There is a close relationship between crop biomass and nutrient uptake [53]. The nutrient uptake determines the basis of the biomass, crop yield and photosynthetic rate of the population [54]. The results showed that, in the two ecological regions, dense planting increased the biomass and the N, phosphorus and potassium uptake of double cropping rice in the whole growth period and increased the grain production per kg nutrient and nutrient utilization. Previous studies have also indicated that reasonable dense planting can effectively increase the canopy productivity, nutrient accumulation and nutrient recovery efficiency of rice populations [23,40,55]. N is an important element of leaf photosynthesis and has an influence on the biomass formation and the N, phosphorus and potassium uptake [56]. This study indicated that, compared with the N1 treatment, the N2 treatment increased the leaf photosynthetic rate, biomass and plant nutrient uptake of double cropping rice but reduced the grain production per kg nutrient and N utilization in the two ecological regions. Zhao et al. [57] and Huang et al. [58] showed that the high N application rate enhanced the population quality, nutrient uptake and single plant productivity but reduced the N recovery efficiency. The planting density and N application rate combinations had important effects on the biomass and N uptake and utilization [52]. The results showed that, in the two ecological regions, the photosynthetic rate, biomass and nutrient uptake are important characteristics affecting the yield compensation ability of increased plant density with a decreased N application treatment; increased plant density with a deceased N application treatment could increase the distribution of plant nutrients to grain and the N utilization of the population. The previous studies [59,60,61] showed that the relationship between rice population productivity and nutrient utilization under an increasing plant density with a reduced N application treatment was not relevant. In summary, the relationship between the nutrient utilization and rice population productivity under an increased plant density with a decreased N application treatment still needs further investigation in the different ecological regions.

5. Conclusions

Dense planting could make up for the yield negative impacts caused by decreased N application and increased nutrient utilization for double cropping rice in ecological regions with high soil fertility. In ecological regions with medium soil fertility, the values of the physiological characteristics (photosynthetic rate, biomass and nutrient uptake) of the population were reduced due to the low soil nutrient supply, which was not suitable for the increased plant density with the decreased N application mode of the late season. Therefore, in these two ecological regions, high soil fertility is more conducive to stable yields with high nutrient utilization under dense planting with the reduced N application mode for double cropping rice.

Author Contributions

Investigation and manuscript preparation, K.L. and Y.Z.; Conceptualization, Q.S. and X.P.; Conceptualization, Z.W. and X.X.; Supervision, L.G. All authors have read and agreed to the published version of the manuscript.

Funding

This study was funded by the National Key R&D Program of China (2017YFD0301605).

Institutional Review Board Statement

Not applicable.

Informed Consent Statement

Not applicable.

Data Availability Statement

Data are available on request.

Acknowledgments

We thank the Ministry of Science and Technology of the People’s Republic of China.

Conflicts of Interest

The authors declare no conflict of interest.

References

  1. Peng, S.; Tang, Q.; Zou, Y. Current status and challenges of rice production in China. Plant Prod. Sci. 2009, 12, 3–8. [Google Scholar] [CrossRef] [Green Version]
  2. Wang, W.; Chen, Q.; Hussain, S.; Mei, J.; Dong, H.; Peng, S.; Huang, J.; Cui, K.; Nie, L. Pre-sowing seed treatments in direct-seeded early rice: Consequences for emergence, seedling growth and associated metabolic events under chilling stress. Sci. Rep. 2016, 6, 19637. [Google Scholar] [CrossRef] [PubMed] [Green Version]
  3. Guo, J.; Liu, X.; Zhang, Y.; Shen, J.; Han, W.; Zhang, W.; Christie, P.; Goulding, K.; Vitousek, P.; Zhang, F. Signifificant acidifification in major Chinese croplands. Science 2010, 327, 1008–1010. [Google Scholar] [CrossRef] [PubMed] [Green Version]
  4. Fan, M.; Shen, J.; Yuan, L.; Jiang, R.; Chen, X.; Davies, W.J.; Zhang, F. Improving crop productivity and resource use efficiency to ensure food security and environmental quality in China. J. Exp. Bot. 2012, 63, 13–24. [Google Scholar] [CrossRef]
  5. Bonneuil, C.; Choquet, P.L.; Franta, B. Early warnings and emerging accountability: Total’s responses to global warming, 1971–2021. Glob. Environ. Chang. 2021, 71, 102386. [Google Scholar] [CrossRef]
  6. Song, K.; Zhang, G.; Ma, J.; Peng, S.; Lv, S.; Xu, H. Greenhouse gas emissions from ratoon rice fields among different varieties. Field Crop Res. 2022, 277, 108423. [Google Scholar] [CrossRef]
  7. Zhang, G.; Song, K.; Huang, Q.; Zhu, X.; Gong, H.; Ma, J.; Xu, H. Heavy metal pollution and net greenhouse gas emissions in a rice-wheat rotation system as influenced by partial organic substitution. J. Environ. Mang. 2022, 307, 114599. [Google Scholar] [CrossRef]
  8. Fu, D.; Xiao, M.; Hayward, A.; Fu, Y.; Liu, G.; Jiang, G.; Zhang, H. Utilization of crop heterosis: A review. Euphytica 2014, 197, 161–173. [Google Scholar] [CrossRef]
  9. Yan, J.; Wu, Q.; Qi, D.; Zhu, J. Rice yield, water productivity, and nitrogen use efficiency responses to nitrogen management strategies under supplementary irrigation for rain-fed rice cultivation. Agric. Water Manag. 2022, 263, 107486. [Google Scholar] [CrossRef]
  10. Ding, C.; Luo, X.; Wu, Q.; Lu, B.; Ding, Y.; Song, J.; Li, G. Compact plant type rice has higher lodging and N resistance under machine transplanting. J. Integr. Agric. 2021, 20, 65–77. [Google Scholar] [CrossRef]
  11. Yan, X.; Ti, C.; Vitousek, P.; Chen, D.; Leip, A.; Cai, Z.; Zhu, Z. Fertilizer nitrogen recovery efficiencies in crop production systems of China with and without consideration of the residual effect of nitrogen. Environ. Res. Lett. 2014, 9, 095002. [Google Scholar] [CrossRef] [Green Version]
  12. Varga, I.; Lončarić, Z.; Kristek, S.; Kulundžić, A.M.; Rebekić, A.; Antunović, M. Sugar beet root yield and quality with leaf seasonal dynamics in relation to planting densities and nitrogen fertilization. Agriculture 2021, 11, 407. [Google Scholar] [CrossRef]
  13. Liu, X.; Zhang, Y.; Han, W.; Tang, A.; Shen, J.; Cui, Z.; Zhang, F. Enhanced nitrogen deposition over China. Nature 2013, 494, 459–462. [Google Scholar] [CrossRef] [PubMed]
  14. Zhang, S.; Zhang, G.; Wang, D.; Liu, Q. Long-term straw return with N addition alters reactive nitrogen runoff loss and the bacterial community during rice growth stages. J. Environ. Manag. 2021, 292, 112772. [Google Scholar] [CrossRef]
  15. Lin, S.S.; Shen, S.L.; Zhou, A.; Lyu, H.M. Assessment and management of lake eutrophication: A case study in lake erhai, China. Sci. Total Environ. 2021, 751, 141618. [Google Scholar] [CrossRef]
  16. Sha, M.; Xu, J.; Zheng, Z.; Fa, K. Enhanced atmospheric nitrogen deposition triggered little change in soil microbial diversity and structure in a desert ecosystem. Glob. Ecol. Conserv. 2021, 31, e01879. [Google Scholar] [CrossRef]
  17. Liu, S.; Li, L.; Fan, H.; Guo, X.; Wang, S.; Lu, J. Real-time and multi-stage recommendations for nitrogen fertilizer topdressing rates in winter oilseed rape based on canopy hyperspectral data. Ind. Crop Prod. 2020, 154, 112699. [Google Scholar] [CrossRef]
  18. Lyu, Y.; Yang, X.; Pan, H.; Zhang, X.; Cao, H.; Ulgiati, S.; Xiao, Y. Impact of fertilization schemes with different ratios of urea to controlled release nitrogen fertilizer on environmental sustainability, nitrogen use efficiency and economic benefit of rice production: A study case from Southwest China. J. Clean. Prod. 2021, 293, 126198. [Google Scholar] [CrossRef]
  19. Zhu, C.H.; Ouyang, Y.Y.; You, D.I.A.O.; Yu, J.Q.; Xi, L.U.O.; Zheng, J.G.; Li, X.Y. Effects of mechanized deep placement of nitrogen fertilizer rate and type on rice yield and nitrogen use efficiency in Chuanxi Plain, China. J. Integr. Agric. 2021, 20, 581–592. [Google Scholar] [CrossRef]
  20. Wan, X.; Wu, W.; Shah, F. Nitrogen fertilizer management for mitigating ammonia emission and increasing nitrogen use efficiencies by 15N stable isotopes in winter wheat. Sci. Total Environ. 2021, 790, 147587. [Google Scholar] [CrossRef]
  21. Zheng, H.B.; Chen, Y.W.; Chen, Q.M.; Li, B.; Zhang, Y.S.; Jia, W.; Mo, W.W.; Tang, Q.Y. High-density planting with lower nitrogen application increased early rice production in a double-season rice system. Agron. J. 2020, 112, 205–214. [Google Scholar] [CrossRef] [Green Version]
  22. Wei, H.; Meng, T.; Ge, J.; Zhang, X.; Shi, T.; Ding, E.; Dai, Q. Reduced nitrogen application rate with dense planting improves rice grain yield and nitrogen use efficiency: A case study in east China. Crop J. 2021, 9, 954–961. [Google Scholar] [CrossRef]
  23. Fu, Y.Q.; Zhong, X.H.; Zeng, J.H.; Liang, K.M.; Pan, J.F.; Xin, Y.F.; Huang, N.R. Improving grain yield, nitrogen use efficiency and radiation use efficiency by dense planting, with delayed and reduced nitrogen application, in double cropping rice in South China. J. Integr. Agric. 2021, 20, 565–580. [Google Scholar] [CrossRef]
  24. Chen, J.; Zhu, X.; Xie, J.; Deng, G.; Tu, T.; Guan, X.; Peng, C. Reducing nitrogen application with dense planting increases nitrogen use efficiency by maintaining root growth in a double-rice cropping system. Crop J. 2021, 9, 805–815. [Google Scholar] [CrossRef]
  25. Hu, Q.; Jiang, W.Q.; Shi, Q.; Xing, Z.P.; Hu, Y.J.; Guo, B.W.; Wei, H.Y. Effect of wide-narrow row arrangement in mechanical pot-seedling transplanting and plant density on yield formation and grain quality of japonica rice. J. Integr. Agric. 2020, 19, 1197–1214. [Google Scholar] [CrossRef]
  26. Sun, T.; Yang, X.; Tan, X.; Han, K.; Tang, S.; Tong, W.; Zhu, S.; Hu, Z.; Wu, L. Comparison of Agronomic Performance between Japonica/Indica Hybrid and Japonica Cultivars of Rice Based on Different Nitrogen Rates. Agronomy 2020, 10, 171. [Google Scholar] [CrossRef] [Green Version]
  27. Meng, T.; Chen, X.; Ge, J.; Zhang, X.; Zhou, G.; Dai, Q.; Wei, H. Reduced nitrogen rate with increased planting density facilitated grain yield and nitrogen use efficiency in modern conventional Japonica rice. Agriculture 2021, 11, 1188. [Google Scholar] [CrossRef]
  28. Awan, T.H.; Cruz, P.C.S.; Chauhan, B.S. Growth analysis and biomass partitioning of Cyperusiria in response to rice planting density and nitrogen rate. Crop Prot. 2015, 74, 92–102. [Google Scholar] [CrossRef]
  29. Zhu, X.; Zhang, J.; Zhang, Z.; Deng, A.; Zhang, W. Dense planting with less basal nitrogen fertilization might benefit rice cropping for high yield with less environmental impacts. Eur. J. Agron. 2016, 75, 50–59. [Google Scholar] [CrossRef]
  30. Hou, W.; Khan, M.R.; Zhang, J.; Lu, J.; Ren, T.; Cong, R.; Li, X. Nitrogen rate and plant density interaction enhances radiation interception, yield and nitrogen use efficiency of mechanically transplanted rice. Agric. Ecosyst. Environ. 2019, 269, 183–192. [Google Scholar] [CrossRef]
  31. Huang, M.; Chen, J.; Cao, F.; Zou, Y. Increased hill density can compensate for yield loss from reduced nitrogen input in machine-transplanted double-cropped rice. Field Crops Res. 2018, 221, 333–338. [Google Scholar] [CrossRef]
  32. Sun, B.; Zhou, S.; Zhao, Q. Evaluation of spatial and temporal changes of soil quality based on geostatistical analysis in the hill region of subtropical China. Geoderma 2003, 115, 85–99. [Google Scholar] [CrossRef]
  33. Wang, X.; Gong, Z. Assessment and analysis of soil quality changes after eleven years of reclamation in subtropical China. Geoderma 1998, 81, 339–355. [Google Scholar] [CrossRef]
  34. Liao, P.; Huang, S.; Van Gestel, N.; Zeng, Y.; Wu, Z.; Van Groenigen, K. Liming and straw retention interact to increase nitrogen uptake and grain yield in a double rice-cropping system. Field Crops Res. 2018, 216, 217–224. [Google Scholar] [CrossRef]
  35. Nishigaki, T.; Tsujimoto, Y.; Rinasoa, S.; Rakotoson, T.; Andriamananjara, A.; Razafimbelo, T. Phosphorus uptake of rice plants is affected by phosphorus forms and physicochemical properties of tropical weathered soils. Plant Soil 2019, 435, 27–38. [Google Scholar] [CrossRef] [Green Version]
  36. Pansu, D.; Gautheyrou, J. Handbook of Soil Analysis: Mineralogical, Organic and Inorganic Methods; Springer Science & Business Media: Heidelberg, Germany, 2007. [Google Scholar]
  37. Ju, C.; Buresh, R.J.; Wang, Z.; Zhang, H.; Liu, L.; Yang, J.; Zhang, J. Root and shoot traits for rice varieties with higher grain yield and higher nitrogen use efficiency at lower nitrogen rates application. Field Crops Res. 2015, 175, 47–55. [Google Scholar] [CrossRef]
  38. Fang, Y.; Ren, T.; Zhang, S.; Liu, Y.; Liao, S.; Li, X.; Cong, R.; Lu, J. Rotation with oilseed rape as the winter crop enhances rice yield and improves soil indigenous nutrient supply. Soil Tillage Res. 2021, 212, 105065. [Google Scholar] [CrossRef]
  39. Dinh, V.; Nguyen, H.; Nguyen, A.; Nguyen, T.; Nguyen, T.; Uteau, D.; Nguyen, N.; Tran, T.; Dultz, S.; Nguyen, M. Pelletized rice-straw biochar as a slow-release delivery medium: Potential routes for storing and serving of phosphorus and potassium. J. Environ. Chem. Eng. 2022, 10, 107237. [Google Scholar] [CrossRef]
  40. Guo, X.; Lan, Y.; Xu, L.; Yin, D.; Li, H.; Qian, Y.; Zheng, G.; Lv, Y. Effects of nitrogen application rate and hill density on rice yield and nitrogen utilization in sodic saline–alkaline padd field. J. Integr. Agric. 2021, 20, 540–553. [Google Scholar] [CrossRef]
  41. Zhang, X.; Davidson, E.; Mauzerall, D.; Searchinger, T.; Dumas, P.; Shen, Y. Managing nitrogen for sustainable development. Nature 2015, 528, 51–59. [Google Scholar] [CrossRef] [Green Version]
  42. Zhang, F.; Cui, Z.; Chen, X.; Ju, X.; Shen, J.; Chen, Q.; Liu, X.; Zhang, W.; Mi, G.; Fan, M.; et al. Integrated nutrient management for food security and environmental quality in China. Adv. Agron. 2012, 116, 1–40. [Google Scholar] [CrossRef]
  43. Wang, X.; Fan, J.; Xing, Y.; Xu, G.; Wang, H.; Deng, J.; Wang, Y.; Zhang, F.; Li, P.; Li, Z. The Effects of Mulch and Nitrogen Fertilizer on the Soil Environment of Crop Plants. Adv. Agron. 2019, 153, 121–173. [Google Scholar] [CrossRef]
  44. Huang, M.; Jiang, P.; Shan, S.; Gao, W.; Ma, G.; Zou, Y.; Uphoff, N.; Yuan, L. Higher yields of hybrid rice do not depend on nitrogen fertilization under moderate to high soil fertility conditions. Rice 2017, 10, 43. [Google Scholar] [CrossRef] [PubMed] [Green Version]
  45. Zhou, B.; Sun, X.; Wang, D.; Ding, Z.; Li, C.; Ma, W.; Zhao, M. Integrated agronomic practice increases maize grain yield and nitrogen use efficiency under various soil fertility conditions. Crop J. 2019, 7, 527–538. [Google Scholar] [CrossRef]
  46. Huang, M.; Yang, C.; Ji, Q.; Jiang, L.; Tan, J.; Li, Y. Tillering responses of rice to plant density and nitrogen rate in a subtropical environment of southern China. Field Crops Res. 2013, 149, 187–192. [Google Scholar] [CrossRef]
  47. Xie, X.; Shan, S.; Wang, Y.; Cao, F.; Chen, J.; Huang, M.; Zou, Y. Dense planting with reducing nitrogen rate increased grain yield and nitrogen use efficiency in two hybrid rice varieties across two light conditions. Field Crops Res. 2019, 236, 24–32. [Google Scholar] [CrossRef]
  48. Li, X.; Li, Z.; Xie, Y.; Wang, B.; Kuai, J.; Zhou, G. An improvement in oilseed rape (Brassica napus L.) productivity through optimization of rice-straw quantity and plant density. Field Crops Res. 2021, 273, 108290. [Google Scholar] [CrossRef]
  49. Chauhan, B.; Abugho, S. Effects of water regime, nitrogen fertilization, and rice plant density on growth and reproduction of lowland weed Echinochloa crus-galli. Crop Prot. 2013, 54, 142–147. [Google Scholar] [CrossRef]
  50. Clerget, B.; Bueno, C.; Domingo, A.; Layaoen, H.; Vial, L. Leaf emergence, tillering, plant growth, and yield in response to plant density in a high-yielding aerobic rice Crop. Field Crops Res. 2016, 199, 52–64. [Google Scholar] [CrossRef]
  51. Shankar, T.; Banerjee, M.; Malik, G.C.; Dutta, S.; Maiti, D.; Maitra, S.; Alharby, H.; Bamagoos, A.; Hossain, A.; Ismail, I.A.; et al. The productivity and nutrient use efficiency of rice–rice–black gram cropping sequence are influenced by location specific nutrient management. Sustainability 2021, 13, 3222. [Google Scholar] [CrossRef]
  52. Shankar, T.; Malik, G.C.; Banerjee, M.; Dutta, S.; Maitra, S.; Praharaj, S.; Sairam, M.; Kumar, D.S.; Dessoky, E.S.; Hassan, M.M.; et al. Productivity and nutrient balance of an intensive rice–rice cropping system are influenced by different nutrient management in the red and lateritic belt of west bengal. India. Plants 2021, 10, 1622. [Google Scholar] [CrossRef] [PubMed]
  53. Chew, J.; Joseph, S.; Chen, G.; Zhang, Y.; Zhu, L.; Liu, M.; Taherymoosavi, S.; Munroe, P.; Mitchell, D.; Pan, G.; et al. Biochar-based fertiliser enhances nutrient uptake and transport in rice seedlings. Sci Total Environ. 2022, 826, 154174. [Google Scholar] [CrossRef] [PubMed]
  54. Cuong, T.; Ullah, H.; Datta, A.; Hanh, T. Effects of silicon-based fertilizer on growth, yield and nutrient uptake of rice in tropical zone of Vietnam. Rice Sci. 2017, 24, 283–290. [Google Scholar] [CrossRef]
  55. Bakhshandeh, E.; Pirdashti, H.; Gilani, Z. Application of mathematical models to describe rice growth and nutrients uptake in the presence of plant growth promoting microorganisms. Appl. Soil Ecol. 2018, 124, 171–184. [Google Scholar] [CrossRef]
  56. Cui, N.; Zhang, X.; Cai, M.; Chen, G.; Zhou, L.; Zou, G. Does rice straw addition and/or Vallisneria natans (Lour.) planting contribute to enhancement in nitrate nitrogen and phosphorus removal in constructed wetlands under low temperature? Bioresour. Technol. 2022, 350, 126896. [Google Scholar] [CrossRef]
  57. Zhao, W.; Liang, B.; Yang, X.; Gale, W.; Zhou, J. Effect of long-term fertilization on 15N uptake and Retention in soil. J. Plant Nutr. 2016, 39, 1413–1440. [Google Scholar] [CrossRef]
  58. Huang, J.; Wu, J.; Chen, H.; Zhang, Z.; Fang, C.; Shao, C.; Lin, W.; Weng, P.; Muhammad, U.; Lin, W. Optimal management of nitrogen fertilizer in the main rice crop and its carrying-over effect on ratoon rice under mechanized cultivation in Southeast China. J. Integr. Agric. 2022, 21, 351–364. [Google Scholar] [CrossRef]
  59. Fu, H.; Cui, D.; Shen, H. Effects of nitrogen forms and application rates on nitrogen uptake, photosynthetic characteristics and yield of double-cropping rice in South China. Agronomy 2021, 11, 158. [Google Scholar] [CrossRef]
  60. Dou, Z.; Li, Y.; Guo, H.; Chen, L.; Jiang, J.; Zhou, Y.; Xu, Q.; Xing, Z.; Gao, H.; Zhang, H. Effects of mechanically transplanting methods and planting densities on yield and quality of Nanjing 2728 under rice-crayfish continuous production system. Agronomy 2021, 11, 488. [Google Scholar] [CrossRef]
  61. Ma, P.; Lan, Y.; Lv, X.; Fan, P.; Yang, Z.; Sun, Y.; Zhang, R.; Ma, J. Reasonable Nitrogen Fertilizer Management Improves Rice Yield and Quality under a Rapeseed/Wheat-Rice Rotation System. Agriculture 2021, 11, 490. [Google Scholar] [CrossRef]
Figure 1. Solar radiation, maximum and minimum temperatures and precipitation of the early and late seasons in the two ecological regions in 2018 and 2019.
Agriculture 12 00871 g001
Figure 2. GPN, GPP and GPK of double cropping rice (AH) response to the nitrogen (N) rate and plant density in two different ecological regions in 2018 and 2019. N1 and N2 represent 120 and 150 kg ha−1 for early rice and N1 and N2 represent 120 and 165 kg ha−1 for late rice. D1, D2 and D3 represent 86, 143 and 200 plants per m2 for early rice and D1, D2 and D3 represent 57, 114 and 172 plants per m2 for late rice. Values followed by different lowercase letters are significantly different at the 0.05 level. NS, * and ** represent no significant difference and significant difference at the 5% and 1% levels.
Agriculture 12 00871 g002
Figure 3. PFPN, PFPP and PFPK of double cropping rice (AH) response to the N rate and plant density in two different ecological regions in 2018 and 2019. N1 and N2 represent 120 and 150 kg ha−1 for early rice and N1 and N2 represent 120 and 165 kg ha−1 for late rice. D1, D2 and D3 represent 86, 143 and 200 plants per m2 for early rice and D1, D2 and D3 represent 57, 114 and 172 plants per m2 for late rice. Values followed by different lowercase letters are significantly different at the 0.05 level. NS, * and ** represent no significant difference and significant difference at the 5% and 1% levels.
Agriculture 12 00871 g003
Figure 4. Biomass accumulation dynamics of double cropping rice (AH) response to the N rate and plant density in two different ecological regions in 2018. N1 and N2 represent 120 and 150 kg ha−1 for early rice and N1 and N2 represent 120 and 165 kg ha−1 for late rice. D1, D2 and D3 represent 86, 143 and 200 plants per m2 for early rice and D1, D2 and D3 represent 57, 114 and 172 plants per m2 for late rice. Values followed by different lowercase letters are significantly different at the 0.05 level. NS, * and ** represent no significant difference and significant difference at the 5% and 1% levels.
Agriculture 12 00871 g004
Figure 5. Photosynthetic characteristics of double cropping rice (AH) response to the N rate and plant density in two different ecological regions in 2018. N1 and N2 represent 120 and 150 kg ha−1 for early rice and N1 and N2 represent 120 and 165 kg ha−1 for late rice. D1, D2 and D3 represent 86, 143 and 200 plants per m2 for early rice and D1, D2 and D3 represent 57, 114 and 172 plants per m2 for late rice. Values followed by different lowercase letters are significantly different at the 0.05 level. NS, * and ** represent no significant difference and significant difference at the 5% and 1% levels.
Agriculture 12 00871 g005
Figure 6. N absorption dynamics of double cropping rice (AH) response to the N rate and plant density in two different ecological regions in 2018. N1 and N2 represent 120 and 150 kg ha−1 for early rice and N1 and N2 represent 120 and 165 kg ha−1 for late rice. D1, D2 and D3 represent 86, 143 and 200 plants per m2 for early rice and D1, D2 and D3 represent 57, 114 and 172 plants per m2 for late rice. Values followed by different lowercase letters are significantly different at the 0.05 level. NS, * and ** represent no significant difference and significant difference at the 5% and 1% levels.
Agriculture 12 00871 g006
Figure 7. Phosphate absorption dynamics of double cropping rice (AH) response to the N rate and plant density in two different ecological regions in 2018. N1 and N2 represent 120 and 150 kg ha−1 for early rice and N1 and N2 represent 120 and 165 kg ha−1 for late rice. D1, D2 and D3 represent 86, 143 and 200 plants per m2 for early rice and D1, D2 and D3 represent 57, 114 and 172 plants per m2 for late rice. Values followed by different lowercase letters are significantly different at the 0.05 level. NS, * and ** represent no significant difference and significant difference at the 5% and 1% levels.
Agriculture 12 00871 g007
Figure 8. Potassium absorption dynamics of double cropping rice (AH) response to the N rate and plant density in two different ecological regions in 2018. N1 and N2 represent 120 and 150 kg ha−1 for early rice and N1 and N2 represent 120 and 165 kg ha−1 for late rice. D1, D2 and D3 represent 86, 143 and 200 plants per m2 for early rice and D1, D2 and D3 represent 57, 114 and 172 plants per m2 for late rice. Values followed by different lowercase letters are significantly different at the 0.05 level. NS, * and ** represent no significant difference and significant difference at the 5% and 1% levels.
Agriculture 12 00871 g008
Figure 9. Correlation between the photosynthetic rate at the heading stage and the N, phosphate and potassium uptake at the mature stage of the double cropping rice yield (AD). * and ** represent significant difference at the 5% and 1% probability levels. Pn, photosynthetic rate; Y, yield; NU, N uptake; PU, phosphate uptake; KU, potassium uptake.
Agriculture 12 00871 g009
Table 1. Double cropping rice yield and yield compositions response to the nitrogen (N) rate and plant density at Shanggao in 2018 and 2019.
SeasonTreatmentPanicle Number
(×104 hm−2)
Spikelets per PanicleSpikelet Filling
Percentage (%)
Thousand Kernel Weight (g)Yield (t ha−1)
2018201920182019201820192018201920182019
EarlyN1D1331.03e321.87e131.1a130.59a70.19d70.39b25.11a25.07a6.98c6.83c
riceN1D2410.50c398.56c112.62b111.68b71.39c71.09b25.06a25.11a7.57b7.42b
N1D3466.22a445.96a95.35c94.68c74.29b73.89a25.16a25.21a7.59b7.44b
N2D1346.27d335.69d129.95a128.79a70.05d70.59b25.14a25.17a7.31b7.16b
N2D2420.40b407.59b113.52b110.68b74.10b74.89a25.08a25.07a7.92a7.77a
N2D3460.79a449.16a98.53c97.89c75.44a74.99a25.21a25.16a7.91a7.76a
N20.48 **169.73 **NSNS34.55 **60.69 **NSNS137.11 **604.84 **
D2508.89 **10,808.49 **207.34 **1323.97 **169.28 **111.80 **NSNS199.10 **878.29 **
N × D18.21 **21.22 **NS8.56 **15.26 **24.57 **NSNSNSNS
LateN1D1389.35d399.52d129.56a126.89ab77.82b77.49b18.87a18.92a7.21c7.33c
riceN1D2417.95c428.20c124.42b124.42ab80.25ab80.35ab18.92a18.93a7.81b8.01b
N1D3441.83ab452.14b117.33c117.00b81.54a82.05a18.91a18.73a7.82b8.04b
N2D1411.08c422.19c129.12a128.79a78.58b78.51b18.89a18.90a7.61b7.87b
N2D2437.39b451.70b124.57b124.57ab80.54ab79.83ab18.92a18.94a8.26a8.47a
N2D3457.70a470.29a120.32c121.32ab81.12a80.79ab18.87a18.91a8.24a8.51a
N109.51 **58.40 **NSNSNSNSNSNS337.43 **566.67 **
D248.96 **108.30 **121.50 **20.40 **51.93 **16.15 **NSNS324.29 **454.43 **
N × DNSNSNSNSNSNSNSNSNSNS
N1 and N2 represent 120 and 150 kg ha−1 for early rice and N1 and N2 represent 120 and 165 kg ha−1 for late rice. D1, D2 and D3 represent 86, 143 and 200 plants per m2 for early rice and D1, D2 and D3 represent 57, 114 and 172 plants per m2 for late rice. Values followed by different lowercase letters are significantly different at the 0.05 level. NS and ** represent no significant difference and significant difference at the 1% levels.
Table 2. Double cropping rice yield and yield compositions response to the N rate and plant density at Xingguo in 2018 and 2019.
SeasonTreatmentPanicle Number
(×104 hm−2)
Spikelets per PanicleSpikelet Filling
Percentage (%)
Thousand Kernel Weight (g)Yield (t ha−1)
2018201920182019201820192018201920182019
EarlyN1D1227.28e224.69e125.24a124.13a71.59d71.08d25.37a25.38a5.06c4.91c
riceN1D2259.21c256.89c112.81b111.70b75.71c75.20c25.35a25.29a5.47b5.32b
N1D3292.07b288.79b95.25c94.14c80.91a80.40a25.33a25.24a5.55b5.40b
N2D1239.33d236.71d126.13a125.02a71.58d71.07d25.39a25.39a5.42b5.27b
N2D2300.32b292.78b111.55b110.44b76.52c76.01c25.36a25.17a5.91a5.76a
N2D3332.56a328.94a98.82c97.71c77.85b77.34b25.15a25.23a6.01a5.86a
N67.19 **201.98 **NSNSNS29.58 **NSNS204.24 **279.84 **
D144.96 **480.06 **61.85 **663.04 **172.81 **1065.02 **NSNS129.21 **177.04 **
N × D6.33 *17.96 **NS4.72 *11.72 **72.26 **NSNSNSNS
LateN1D1320.74d331.02d126.64a126.33a76.18a76.91a18.89a18.93a5.77c5.94c
riceN1D2364.76b375.19bc120.12bc120.12ab72.95bc73.62ab18.90a18.93a5.98b6.25b
N1D3389.78a400.35a116.89c116.89b70.26c70.79b18.89a18.94a5.96b6.27b
N2D1345.17c358.73c127.38a127.38a77.35a77.26a18.88a18.91a6.41a6.58a
N2D2379.77ab390.19ab124.13ab124.46ab74.48ab75.33ab18.91a18.91a6.60a6.75a
N2D3398.08a408.61a120.25c119.25b72.96bc73.57b18.90a18.93a6.58a6.71a
N201.95 **49.35 **34.87 **10.22 **9.37 *NSNSNS1550.18 **1159.32 **
D1015.87 **207.35 **114.23 **39.45 **25.90 **13.44 **NSNS63.86 **102.72 **
N × D17.48 **5.56 *4.77 *NSNSNSNSNSNS14.67 **
N1 and N2 represent 120 and 150 kg ha−1 for early rice and N1 and N2 represent 120 and 165 kg ha−1 for late rice. D1, D2 and D3 represent 86, 143 and 200 plants per m2 for early rice and D1, D2 and D3 represent 57, 114 and 172 plants per m2 for late rice. Values followed by different lowercase letters are significantly different at the 0.05 level. NS, * and ** represent no significant difference and significant difference at the 5% and 1% levels.
Publisher’s Note: MDPI stays neutral with regard to jurisdictional claims in published maps and institutional affiliations.

