1. Introduction
The process of pneumatic conveying is widely used to transport materials, particles, agricultural products and mineral grains [
1,
2], and has many advantages over other material transport options, including flexibility in design, fewer wear parts, lower maintenance cost, minimised dust problems and higher system availability [
3,
4,
5]. Thus, researchers are interested in studying the pneumatic conveying process of agricultural materials.
However, in a pneumatic conveying line for rice fertilisation, a low conveying gas velocity, very dense granular material and high-humidity operating environment often lead to granular material accumulation and pipe blockage [
6]. Therefore, several studies focused on the method for controlling the conveying gas velocity or feeding rate of granular material [
7,
8]. For example, Wang et al. [
9] studied the effects of the rotational speed of a fertilisation wheel, forward speed of a rice transplanter and conveying air speed on fertilisation performance. Zhu et al. [
10] optimised the parameters of a fertilisation control system based on a PID controller to increase fertilisation precision in fertiliser mass. Kim et al. [
11] developed a variable-rate pneumatic granule applicator with a 10 m long boom span, and the pneumatic applicator was equipped with relatively simple blow heads and a metering system. Tola et al. [
12] developed a fertiliser rate control system using a real-time fertiliser discharge sensor to enable variable-rate application with a significantly reduced error compared to those of current systems. To ensure the self-purification of the ear-picking device, Yang et al. [
13] used a combination of auger sieve hole cleaning device and lateral pneumatic auxiliary cleaning system, and designed a dual-axial flow threshing device, which uses a “U”-shaped conveying system to transport maize ears in the threshing chamber. Gagandeep et al. [
14] studied the effect of various speeds and different locations of airstream in respect of the plant to control the population of adult whitefly with a pneumatic trap cum electric swatter. Cousins et al. [
15] developed a model and performed simulation to demonstrate the potential of incorporating fast gas–solid flow simulation into the control infrastructure to improve the performance of air seeder conveying systems.
Therefore, a smooth flow of fertiliser can be achieved by adjusting the conveying gas velocity and feeding rate. However, it should be based on the optimised structure of key parts of a pneumatic conveying line as it is economical in terms of energy consumption. Several studies focused on the structural design and optimisation of the key parts of a pneumatic conveying line in seeders and fertilisation devices [
16]. An optimised distribution head used in an air-assisted centralised distribution was useful for facilitating the motion of seeds, reducing the frequency of seed–seed and seed–wall contacts, avoiding excessive residence of seeds, and improving distribution performance [
17]. A mechanical forced fertiliser discharging device adopting the principle of screw auger forced transportation for paddy field was innovatively designed to keep pipes from clogging [
18]. Wu designed a Venturi fertiliser tube with a strong suction for fertiliser and ideal distribution of the airflow field [
19]. Wang et al. [
20] designed a new T-pipe with a contraction section to convey the fertiliser smoothly. Gao et al. [
21] designed a Venturi feeding tube with a contraction angle of 70° and feeding angle of 45° to achieve efficient and precise seed planting.
In addition, fertiliser accumulation and pipe blockage occurring in a pneumatic conveying line are also caused by the inconsistent distribution of gas volume in different rows. To study the effect of gas-filled lines in different structures on the consistency of airflow speeds in different rows, Zha et al. [
22] measured airflow speeds in the branches of three different structural pneumatic conveying lines. The results showed that the airflow speed in each branch showed a large difference when the blower was placed at one end or the middle of the main duct. However, an airflow equaliser designed by Zhong and Gao was useful for increasing the consistency of airflow speeds in different rows [
23].
Therefore, the objective of this study was to increase the consistency of airflow speeds in different rows in a pneumatic conveying line for rice fertilisation to reduce the risks of fertiliser accumulation and pipe blockage. A new airflow equaliser to be used in a gas-filled line with a blower placed at the end of the duct was developed, and its structure was improved based on the operating principle of the airflow equaliser.
2. Materials and Methods
2.1. Pneumatic Conveying Line for Fertilisers
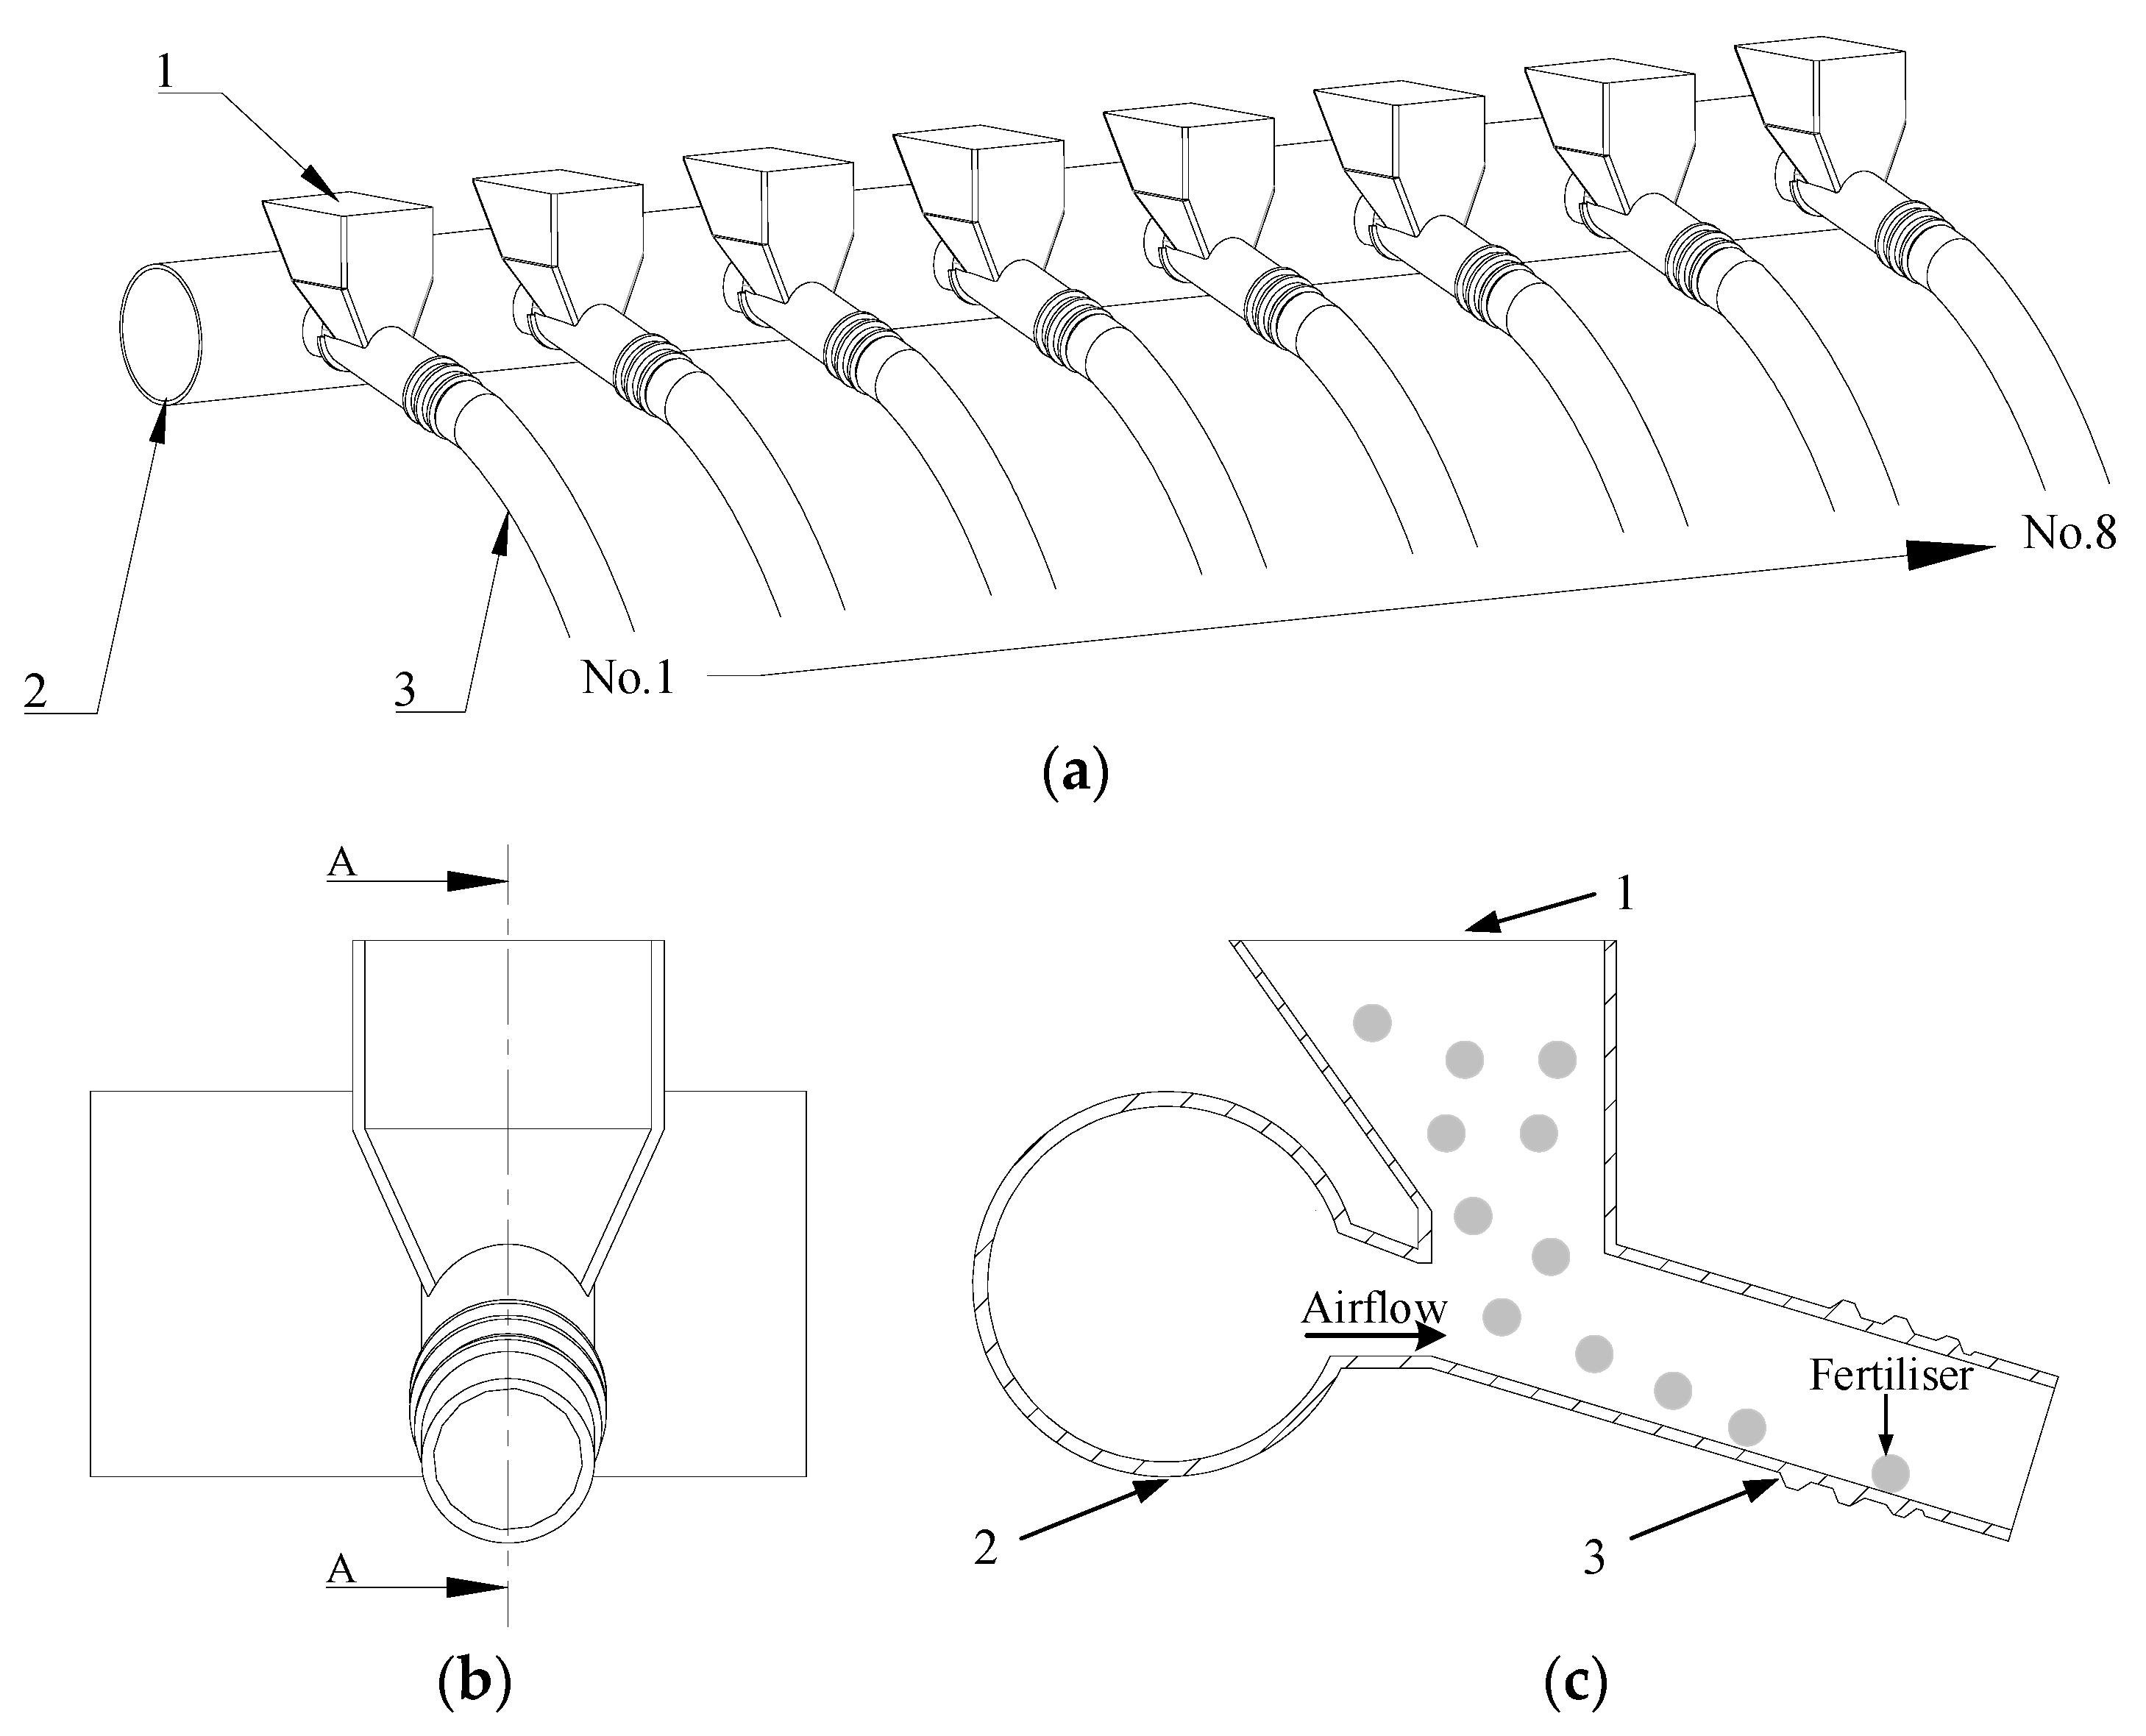
A pneumatic conveying line (
Figure 1) used in side-deep fertilisation devices for rice paddies is composed of a duct and several branch pipes. Gas flows in the duct from its one end, then flows to each branch pipe in different volume flow rates and finally the fertilisers dropped from a feeding port are conveyed by the airflow in a branch pipe (
Figure 1c).
2.2. Mechanism of Gas Flow
Gas pressure is a form of gaseous energy; thus, the loss of gaseous energy may be referred to as the loss of gas pressure, and it is divided into frictional loss and local loss according to its generation mechanism. The static pressure added to the dynamic pressure is equal to the total pressure, and the static pressure can be converted to the dynamic pressure and vice versa. When gas flows in the duct, the friction inside the gas caused by the air viscosity and friction between the airflow and inner wall of the duct generates gaseous frictional losses. Local losses are generated as the gas flows around local obstacles. Therefore, when gas flows under any operating condition, there is a loss of gaseous energy, i.e., the total gas pressure decreases. In addition, the length of the duct is fixed and the end of the duct is closed; thus, the gas velocity in the duct gradually decreases to zero, i.e., the dynamic pressure gradually decreases to zero along the direction of the airflow. Compared to the decrease in the total gas pressure, the dynamic pressure drop is significantly large; therefore, the static pressure in the duct increases along the airflow direction. The gas flowing axially in the duct is affected by a static pressure caused by the airflow itself in the normal direction of the duct inner wall. If a hole connecting the duct to a branch pipe opens on the duct wall, the gas flows out of the hole in the direction at an angle
α with the duct axis, caused by the combined effect of the static pressure difference and axial airflow motion. Based on the distributions of dynamic pressure and static pressure in the duct and the mechanism of gas flow at the inlets of the branch pipes, the gas velocity vector in a branch pipe and the directions of the gas velocity in different rows are shown in
Figure 2 and expressed as Equation (1).
where
vj is the velocity caused by static pressure (m s
−1);
ρ is the air density (kg m
−3);
pj is the static pressure (Pa);
vd is the velocity caused by the dynamic pressure (m s
−1);
pd is the dynamic pressure (Pa);
v is the practical velocity (m s
−1); and
α is the angle between
v and
vd (m s
−1).
2.3. Structural Design of a New Airflow Equaliser
2.3.1. Design Theory
Sectional gas velocity refers to the velocity of the gas flowing vertically through the cross-section of a pipe. Therefore, the sectional gas velocity is determined by the static pressure in a branch pipe, and the sectional gas velocities in the branch pipes close to the airflow inlet of the duct are lower than those in the branch pipes far away from the airflow inlet of the duct (Branch pipes close to the airflow inlet of the duct, i.e., at the front of the duct, are hereinafter referred to as ‘BPFD’. Branch pipes far away from the airflow inlet of the duct, i.e., at the end of the duct, are hereinafter referred to as ‘BPED’). Therefore, the uneven distribution of static pressure from the beginning to the end of the duct is the most fundamental reason for the poor consistency of the sectional gas velocities in the different rows. In addition, in the BPFD, the larger the angle α, the more uneven and denser the airflow on the windward side of the branch wall, which increases the frictional loss and reduces the sectional gas velocity; thus, the difference between the sectional gas velocities in the different rows is further increased.
According to DG/T 105-2019 Side-Deep Fertilisation Device for Rice Paddies issued by the Ministry of Agriculture and Rural Affairs of the People’s Republic of China, the coefficient of variation of the consistency of fertilisation quantity in different rows should be less than 13%; therefore, it is necessary to ensure that gas volume flow rate in the different rows is as equal as possible in order to reduce gas energy waste caused by high gas velocities in the BPED and the risks of fertiliser accumulation and pipe blockage caused by low gas velocities in the BPFD.
In a ventilation line with airflow equalisers, the static pressure in a branch pipe equals the sum of the original static pressure in the duct and static pressure converted from dynamic pressure using the airflow equaliser [
24]. An airflow equaliser designed by Zhong. et al. [
23] can convert a portion of the dynamic pressure in the duct into static pressure by adjusting its opening angle and then obstructing the airflow. Thus, the consistency of the sectional gas velocities in the different rows can be improved.
Therefore, an airflow equaliser performs two functions: One is to increase the sectional gas velocities in the BPFD by increasing the proportion of static pressure around the branches in the duct, and the other is to reduce the sectional gas velocities in the BPED by increasing the loss of gas pressure caused by gas flow in the duct. In addition, the structural design of an airflow equaliser must follow the principle of ‘appropriately seizing on the way of airflow and lessen acceleration’. This means that an airflow equaliser should appropriately intercept the airflow on the way to prevent a considerable dynamic pressure drop and lessen the airflow acceleration caused by the decrease in the cross-sectional area of the duct, i.e., lessen the transformation from static pressure to dynamic pressure.
A new airflow equaliser integrated with a branch pipe was developed based on the above principle. The branch pipe was extended through a hole into the duct, and there was a notch on the windward side of the branch pipe in the duct. In addition, the gas velocity (dynamic pressure) in the near-wall region is relatively low, while it is higher in the far-wall region; thus, the notch structure was designed as a triangle projected at the cross-section of the duct.
2.3.2. Structural Parameters
The windward side of the airflow equaliser was cut by the extrusion from the triangle at the cross-section of the duct, thus forming a triangular notch (
Figure 3). The vertex angle
θ of the triangle on the cross-section of the duct was determined by the notch angle
β on the cross-section of the branch pipe. The mathematical relationship between
θ and
β is expressed as Equation (2), and the triangular area is expressed as Equation (3). Therefore, both the notch angle
β and extended length
l were the key structural parameters that affected the sectional gas velocities in the branch pipes. Based on the distribution of gas pressure in the duct, as described above, the static pressure in a branch pipe was determined by the length of the duct and position of the branch pipe in the axial direction of the duct. In addition, the distances between adjacent branches were equal. Therefore, another key structural parameter was the distance between the adjacent branches.
where
β is the notch angle (°);
θ is the vertex angle of the triangle (°);
S is the projected area of notched triangle (m
2);
l is the extended length (mm); and
R is the radius of each branch pipe (
R = 12 mm).
2.4. Modelling and Processing
The 3D structure of the gas-filled line was designed using the Solidworks software and the computational fluid domain of the gas-filled line was modelled using the SpaceClaim software, meshed using the integrated computer engineering and manufacturing code for computational fluid dynamics (ICEM CFD) software, and the airflow field in the gas-filled line was simulated using the Fluent software.
It has been reported that a material with a uniform particle size is conveyed normally if the gas velocity is 1.5~2.5 times its suspended velocity, and the suspended velocity of granular fertilisers used in paddy fertilisation operations is generally 10.58 m/s [
25], so the gas velocity at the inlet to the duct was set as 20 m s
−1 in Fluent, volume flow rates were obtained using the post-processing in Fluent and the equation to obtain the sectional gas velocity in each branch pipe is expressed as Equation (4). The settings of the key parameters in Fluent were as follows: the time step size, number of time steps and total time were set to 0.002 s, 3000 and 6 s, respectively. The residuals showed that the simulation test converged after 1000 iterations; therefore, the simulations at 2 s, 3 s, 4 s, 5 s and 6 s can be considered as 5 repeated tests, and the coefficient of variation of the consistency of the sectional gas velocities in the different rows (
CV) is expressed as Equation (5).
where
q is the volume flow rate at the outlet of a branch pipe (m
3 s
−1);
s is the area of the outlet (
s ≈ 0.00045 m
2);
v is the sectional gas velocity caused by static pressure (m s
−1);
vi is the average sectional gas velocity in each branch per second (m s
−1);
v is the mean of
vi (m s
−1);
n is the number of branch pipes (
n = 8);
σ is the standard deviation of the consistency of the sectional gas velocities in the different rows; and
CV is the coefficient of variation of the consistency of the sectional gas velocities in the different rows (%).
2.5. Single-Factor Tests
To study the effects of the notch angle, extended length and distance between adjacent branches on CV and obtain reasonable ranges of the factors for the next orthogonal test, single-factor tests with CV as the evaluation indicator were carried out using the Fluent software. When calculating the area of the triangle at the cross-section of the duct, the notch angle β could not be mathematically set to 180° in Equation (4). However, the structure of the flow equaliser with a notch angle of 180° could be modelled using the Solidworks software. Therefore, the range of the notch angle was 30–180°, divided equally into 6 levels. The extended length was limited by the duct with a diameter of 60 mm, and a longer airflow equaliser significantly reduced the gas volume behind it. Therefore, the extended length range was 6–42 mm, divided equally into 7 levels. The frictional loss is proportional to the length of the duct and the width of a high-speed rice transplanter is approximately 2 m. Therefore, it was necessary to shorten the length of the duct on the basis of normal operation of conveying fertiliser; thus, the range of the distance between adjacent branches was 120–200 mm, divided equally into 5 levels. In addition, in the single-factor tests, when the notch angle, extended length and distance between adjacent branches are used as control variables, their values are selected as 150°, 18 mm and 180 mm, respectively.
2.6. Interaction Analysis in an Orthogonal Test
The ranges of the factors were determined using the single-factor tests. The factors divided into 3 levels at equal intervals are listed in
Table 1. The interactions between the three factors should be analysed using the principle of two-factor interactions (first-order interaction) in the orthogonal test. The principle is as follows: owing to experimental errors, if the lines representing the different levels are approximately parallel to each other, there is no interaction between the two factors or the interaction can be ignored. If two of the straight lines intersect, there is an interaction between the two factors. There were 9 groups of level combinations for the notch angle and extended length (
Figure 4). It can be observed from
Figure 4a that there is an interaction between the notch angle and extended length based on this principle. However, there were no interactions between the notch angle and distance between adjacent branches and that between the extended length and distance between adjacent branches using the same method.
2.7. Methods of Validation and Performance Tests
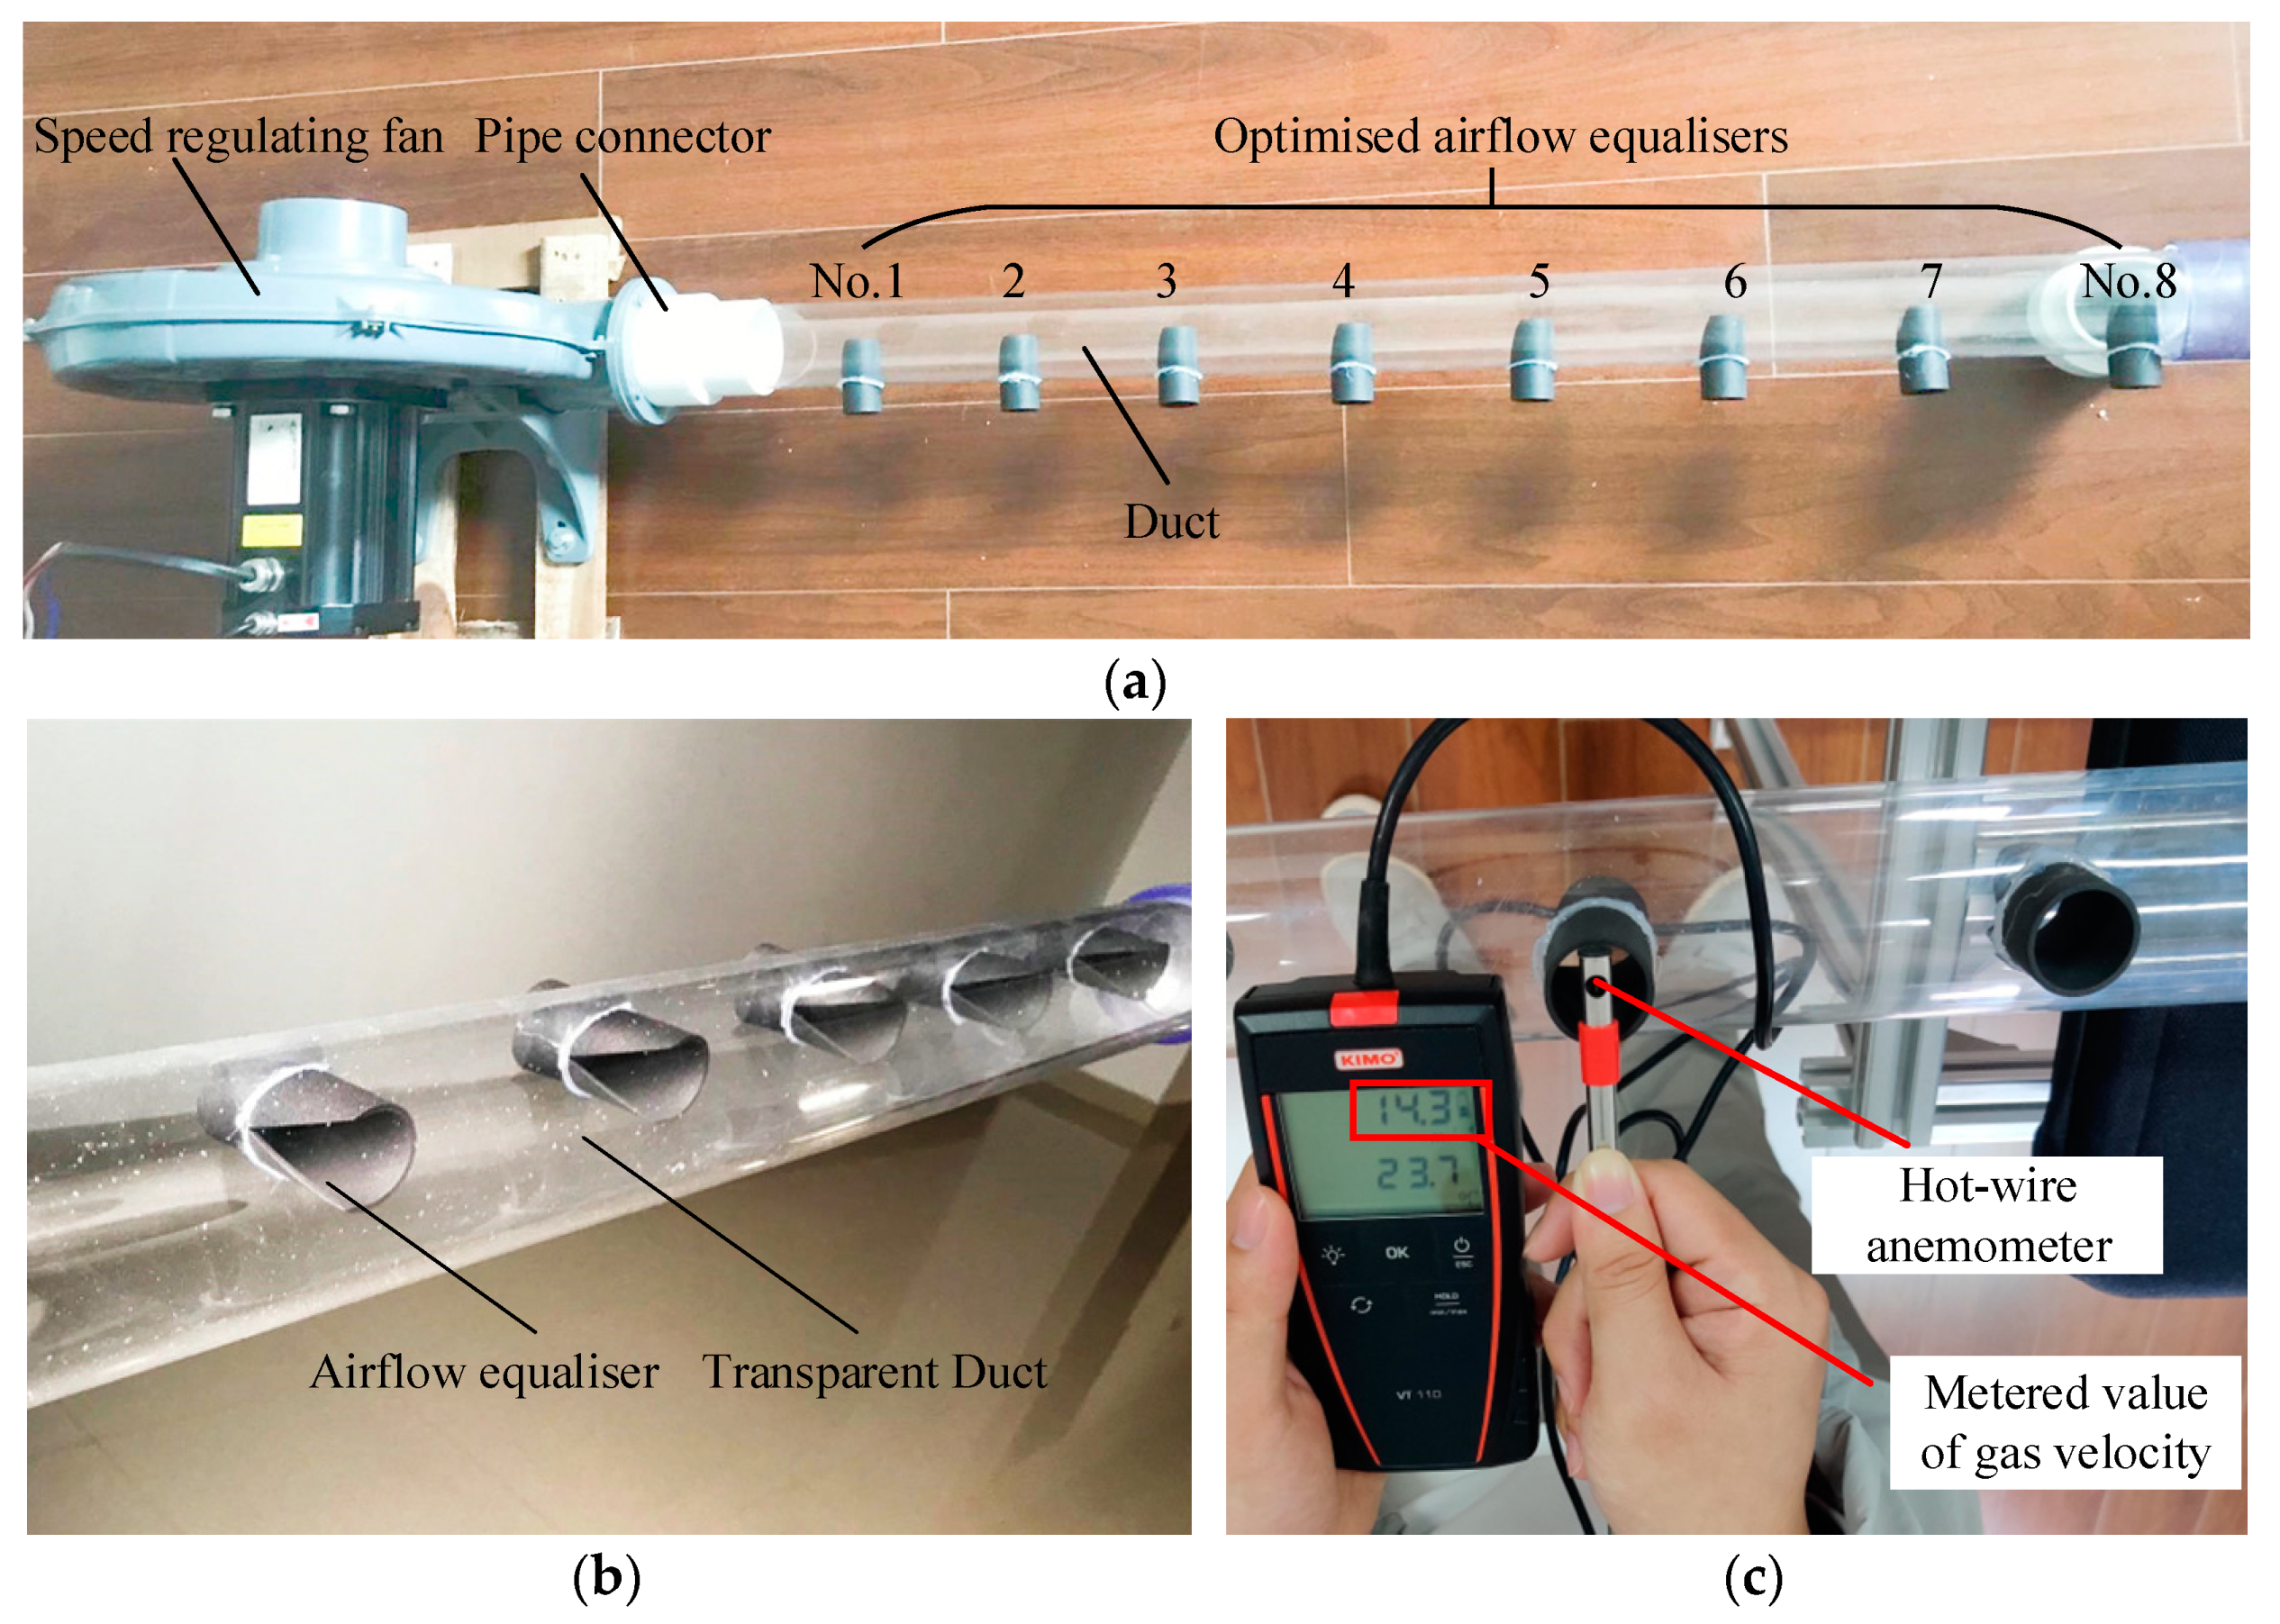
To validate the feasibility of simulations of the performance of the airflow equalisers, bench tests were carried out on the line with the optimised airflow equalisers. As shown in
Figure 5, the test equipment consisted of a speed regulating fan, a duct, a pipe connector, eight optimised airflow equalisers made by a technology of 3D printing (
Figure 5b) and a hot-wire anemometer (CTV210-B0, KIMO, Bordeaux, France). In the test, a gas velocity at the airflow outlet from the speed regulating fan was adjusted to 20 m s
−1, a sensor of the hot-wire anemometer was placed at different points on a surface of the airflow outlet from the branch pipe (
Figure 5c); thus, the mean of the gas velocities at the different points was regarded as sectional gas velocity in the airflow outlet surface.
In addition, in order to evaluate the contribution of the optimised airflow equalisers to improve the consistency of the sectional gas velocities in different rows, the simulation for a line without the optimised airflow equalisers (the distance between adjacent branches of 140 mm) is carried out as a control test.
3. Results and Discussion
3.1. Single-Factor Tests
3.1.1. Effects of the Notch Angle and Extended Length on CV
The value of
CV decreased with the increase in the notch angle in the range of 30–180° and extended length in the range of 6–36 mm, as shown in
Figure 6a,b. The windward area of the airflow equaliser was proportional to the notch angle and extended length according to Equation (3). The larger the windward area, the larger the gas volume that can be intercepted and static pressure that can be converted from dynamic pressure. In addition, the increase in sectional gas velocities in the BPFD was larger, because the gas velocity in front of the duct was higher, i.e., the dynamic pressure was higher. Meanwhile, the frictional loss and local loss increased with the increase in the notch angle and extended length, respectively; thus, both the static pressure at the end of the duct and the sectional gas velocities in the BPED decreased. Therefore, the increase in the sectional gas velocities in the BPFD and the decrease in the sectional gas velocities in the BPED occurred simultaneously, which was very useful for increasing the consistency of the sectional gas velocities in the different rows. Equation (3) shows that the extended length contributes more to the triangular area than the notch angle, which is verified by
Figure 6a,b. It can be observed that the increase in the extended length was significantly useful for increasing the consistency of the sectional gas velocities in the different rows. This is because the gas velocity at the centre of the duct was relatively large, and when the airflow equaliser approached or crossed the centre of the duct, larger conversion from dynamic pressure to static pressure was achieved using the airflow equaliser. However, lengthening the airflow equaliser to increase the consistency of the sectional gas velocities in the different rows was limited to an extended length in the range of 30–42 mm. Only in that range were the sectional gas velocities in the BPFD close to or larger than those in the branch pipes behind them (
Figure 6d). In particular, in the range of 36–42 mm, the dynamic pressure in the middle and end of the duct were not sufficient to be converted to static pressure in the branch pipes; thus, the consistency of the sectional gas velocities in the different rows became worse.
In conclusion, the ranges of the notch angle and extended length obtained from the single-factor tests were 120–180° and 18–30 mm, respectively.
3.1.2. Effect of the Distance between Adjacent Branches on CV
When the distance between the adjacent branches was smaller, lower sectional gas velocity in branch No. 1 and higher sectional gas velocity in branch No. 8 occurred simultaneously. However, this case was improved with an increase in the distance between the adjacent branches (
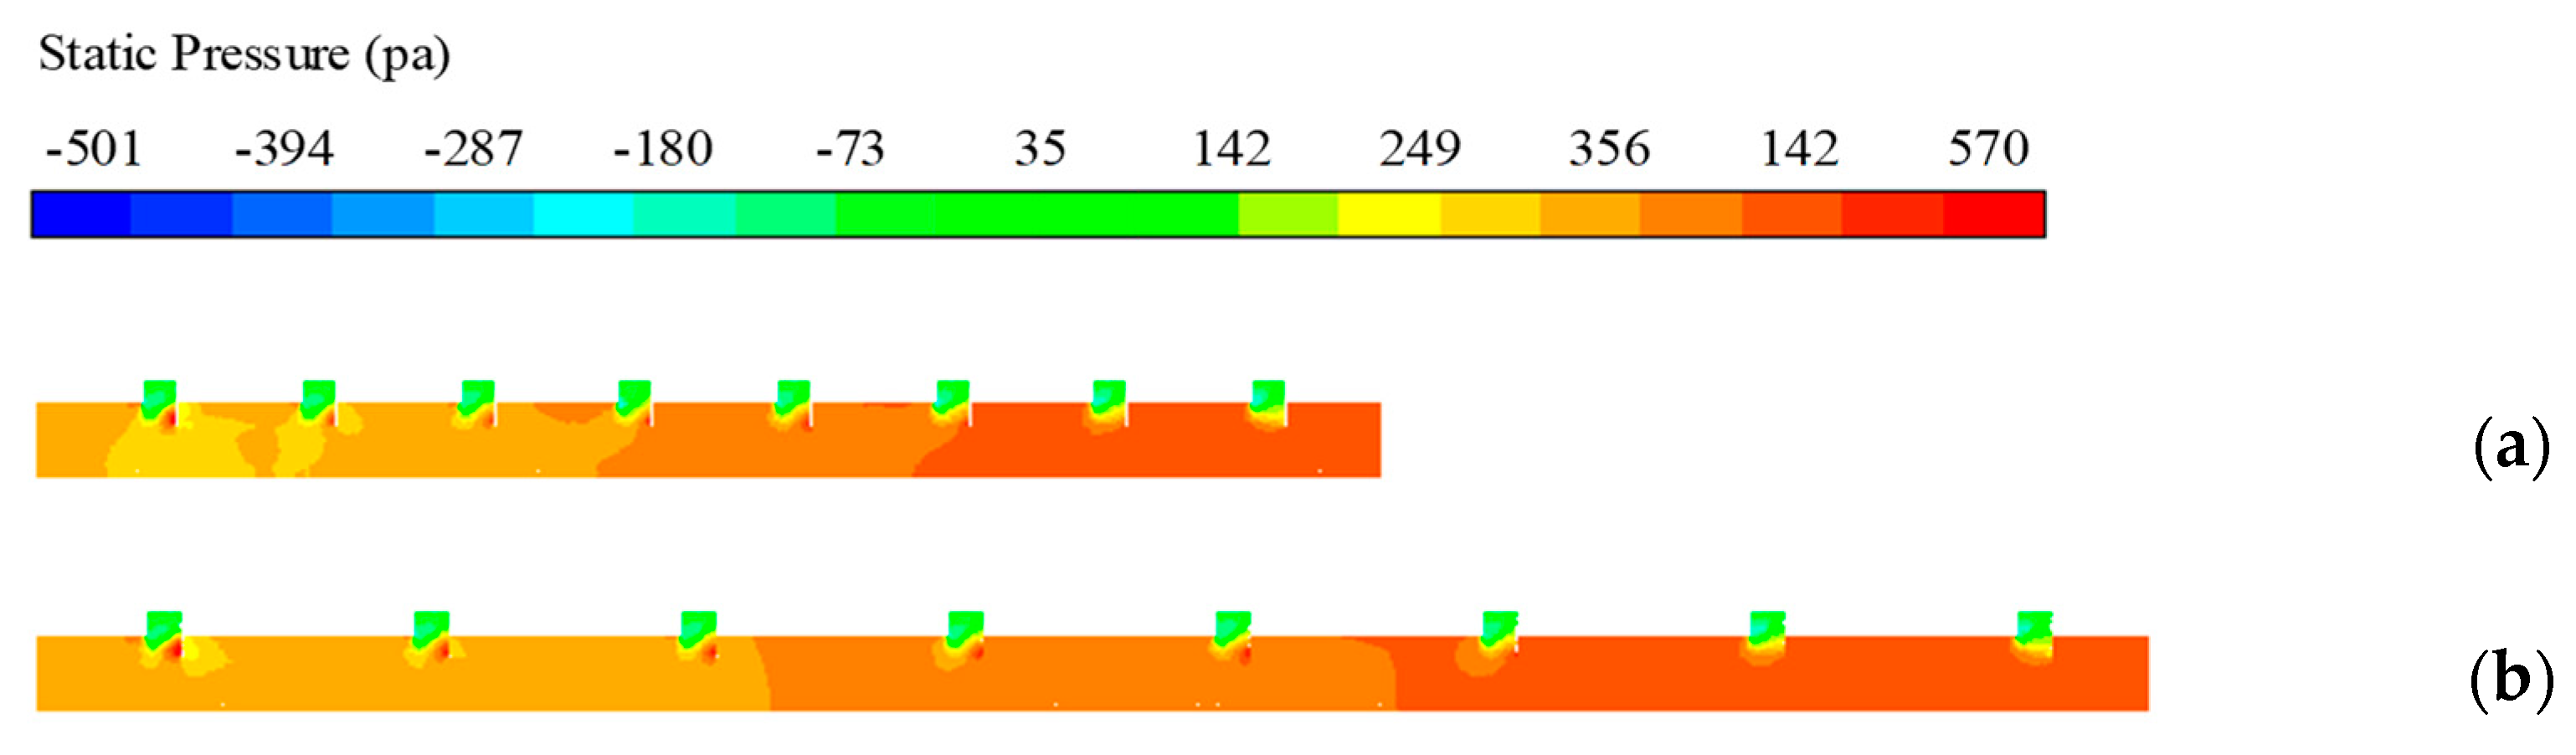
Figure 6c). When the distance between the adjacent branches increased from 120 to 160 mm, the sectional gas velocity in branch No. 1 increased and that in branch No. 8 decreased. This is because the static pressure at the end of the duct decreased, and the sectional gas velocities in the BPED decreased because of the increase in the friction pressure loss. When the distance between the adjacent branches was 120 mm, the static pressure in the region around branches No. 1 and No. 2 was lower than that in the near region, as shown in
Figure 7a. This is because when airflow reached the front region of the airflow equaliser, the gas velocity decreased and dynamic pressure increased; subsequently, static pressure decreased due to the decrease in the cross-sectional area of the duct. However, the effect of the cross-sectional area of the duct was reduced with the increase in the distance between the adjacent branches, compared with
Figure 7a,b, and it can be observed that the static pressure from the airflow inlet to the end of the duct changed progressively rather than randomly with an increase in the distance between the adjacent branches. The static pressure was equal at most points of the cross-section of the duct and it increased steadily along the airflow. This way, the difference between the sectional gas velocities in the adjacent branches was reduced and the consistency of the sectional gas velocities in the different rows was increased. Although lengthening the distance between the adjacent branches within a certain range increased the consistency of the sectional gas velocities in the different rows, it resulted in a larger loss of gas pressure and increased energy consumption. Therefore, the range of the distance between the adjacent branches was set to 120–160 mm after the single-factor tests.
3.2. Orthogonal Test
An interaction is considered as a factor; thus, it was set as a column in the orthogonal table. Additionally, two interactions between two factors at three levels were set as two columns in the orthogonal table. In addition, there are no less than one error column. Therefore, L
18(3
7) was selected as the orthogonal table in this study, and its table head and test results are presented in
Table 2.
3.2.1. Range Analysis
- (1)
According to the R value of the interaction and the three factors, the order of primary and secondary factors affecting CV was B > A × B > C > A.
- (2)
According to the K value of each factor level and the evaluation criteria for CV, the optimised levels of the factors were A2, B3 and C1.
- (3)
Owing to the interaction between A and B, an optimised combination could not be determined only from the individual effect of each factor on
CV. In this study, B had a larger effect on
CV than those of A and C, and its optimised level was B
3; therefore, an optimised combination of A and B was determined only by the optimised level of A.
Table 3 presents all the level collocations of A and B
3, and the
CV value of A
2B
3 was the smallest; thus, the optimised combination was A
2B
3C
1 for the optimised level of C.
3.2.2. Variance Analysis
To evaluate the degree of effects of the factors on
CV more accurately, in particular, the effect of the interactions on
CV, it is necessary to analyse the variance of the test results. Additionally, the results of variance analysis are presented in
Table 4.
- (1)
According to the variance analysis, factor B was the most significant; however, factors A, B and the interaction A × B were insignificant. According to the F value, the order of the effects of the interaction and three factors on CV was B > A × B > C > A, which was similar to the range analysis results.
- (2)
Owing to the insignificant interaction A × B, the optimised combination of factors A, B and C could be directly determined using the combination of the optimised level of each factor without considering the effect of the interaction on CV. Therefore, the optimised combination for the orthogonal test was A2B3C1.
3.3. Validation and Performance Tests
As shown in
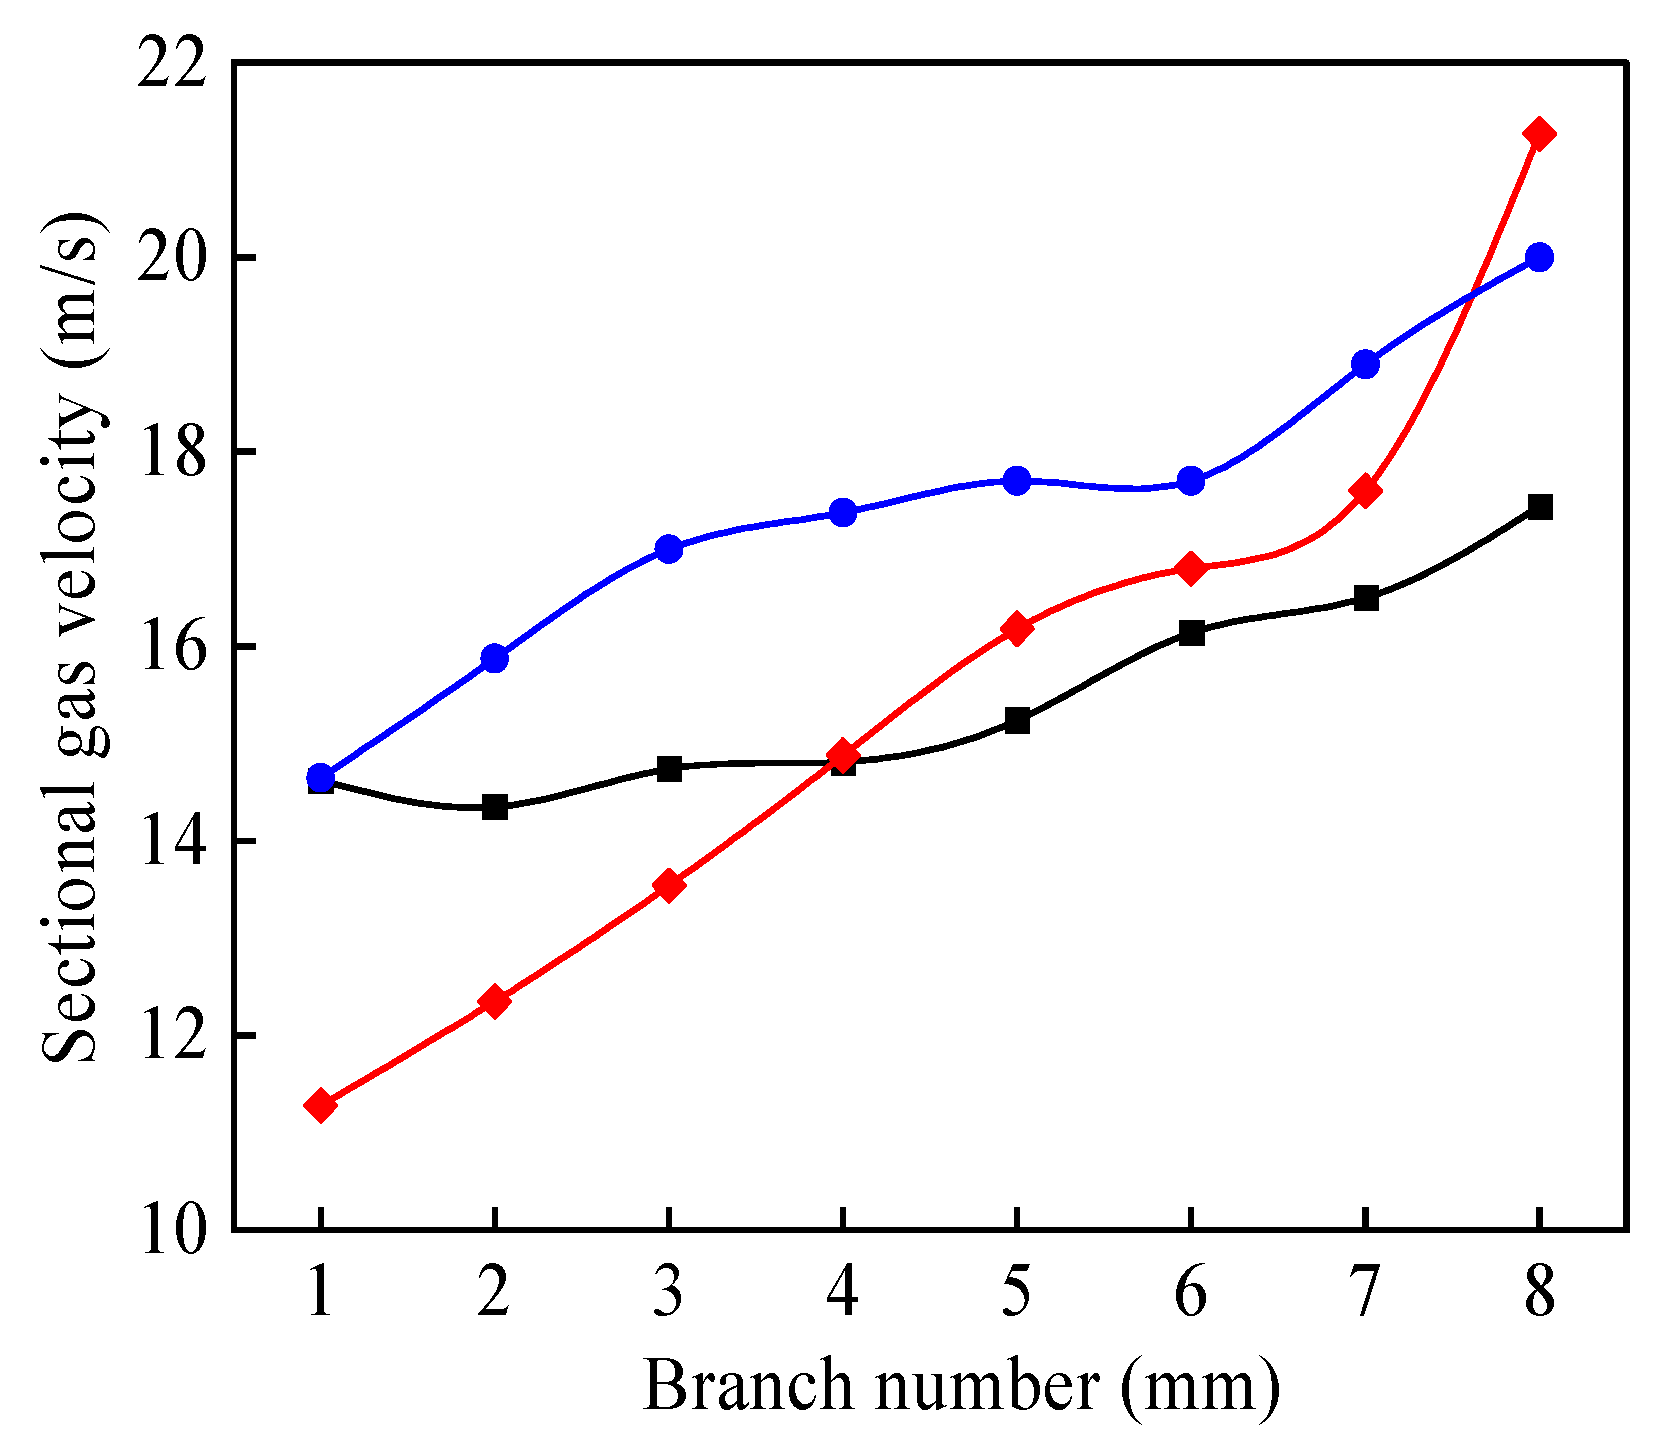
Figure 8, the trend of the sectional gas velocities in the branches from No. 1–8 was consistent within the allowable error range in the three tests, i.e., a simulation test for the line without and with the airflow equalisers, and a bench test for the line with the airflow equalisers. The sectional gas velocities all gradually increased with the increase in branch numbers. The
CV values in those three tests were 20.69%, 7.07% and 9.53%, respectively, which revealed that the simulation test results were consistent with the bench test results and the optimised airflow equalisers in this paper could improve the consistency of the sectional gas velocities in different rows.
In addition, the error between the CV values of 9.53% and 7.07% in the bench test and the simulation test, respectively, were caused by inaccuracies in the method of measuring sectional gas velocity in the bench test. However, in the bench test, it is impossible to obtain the volume flow rate of a surface as in the simulation test, even if using a wind capture hood, because it not properly sized with the branch pipe; therefore, the only solution is to measure the sectional gas velocity at as many points as possible on the airflow outlet surface to minimise the error.
Additionally, it has been reported that a simulation test and a bench test to test the performance of distributing gas volume from the duct to each branch equally for the line without the airflow equaliser were carried out. The
CV values are 16.67% and 10.69%, respectively [
26]. Its
CV value in the simulation test is consistent with that in this paper. Moreover, an adjustable gas-blocking area equaliser was designed by [
27], the consistency of the sectional gas velocities in different rows is much better than that with the non-adjustable gas-blocking area airflow equaliser in this paper, because the gas-blocking area is adjusted using a movable air valve. Thus, the next step is to design an adjustable gas-blocking area airflow equaliser in different branches.
The error between the CV values of 9.53% and 7.07% in the bench test and the simulation test, respectively, was caused by inaccuracies in the method of measuring sectional gas velocity in the bench test. However, in the bench test, it is impossible to obtain the volume flow rate of a surface as in the simulation test, even if using a wind capture hood, because it not properly sized with the branch pipe; therefore, the only solution is to measure the sectional gas velocity at as many points as possible on the airflow outlet surface to minimise the error. In summary, the error between the CV values in the bench and simulation tests is acceptable, two test results are about consistent and the simulations of the performance of the airflow equalisers are practical.


