
Could Surplus Food in Blind Box Form Increase Consumers’ Purchase Intention?


Abstract
:1. Introduction
1.1. Research Background
1.2. Research Motivation and Purpose
2. Relevant Studies
2.1. Perceived Value
2.2. Perceived Risk
2.3. Subjective Norm
2.4. Perceived Food Quality
2.5. Brand Image
2.6. Perceived Playfulness
2.7. Perceived Variety
2.8. Convenience
2.9. Purchase Intention
3. Research Method and Hypothesis
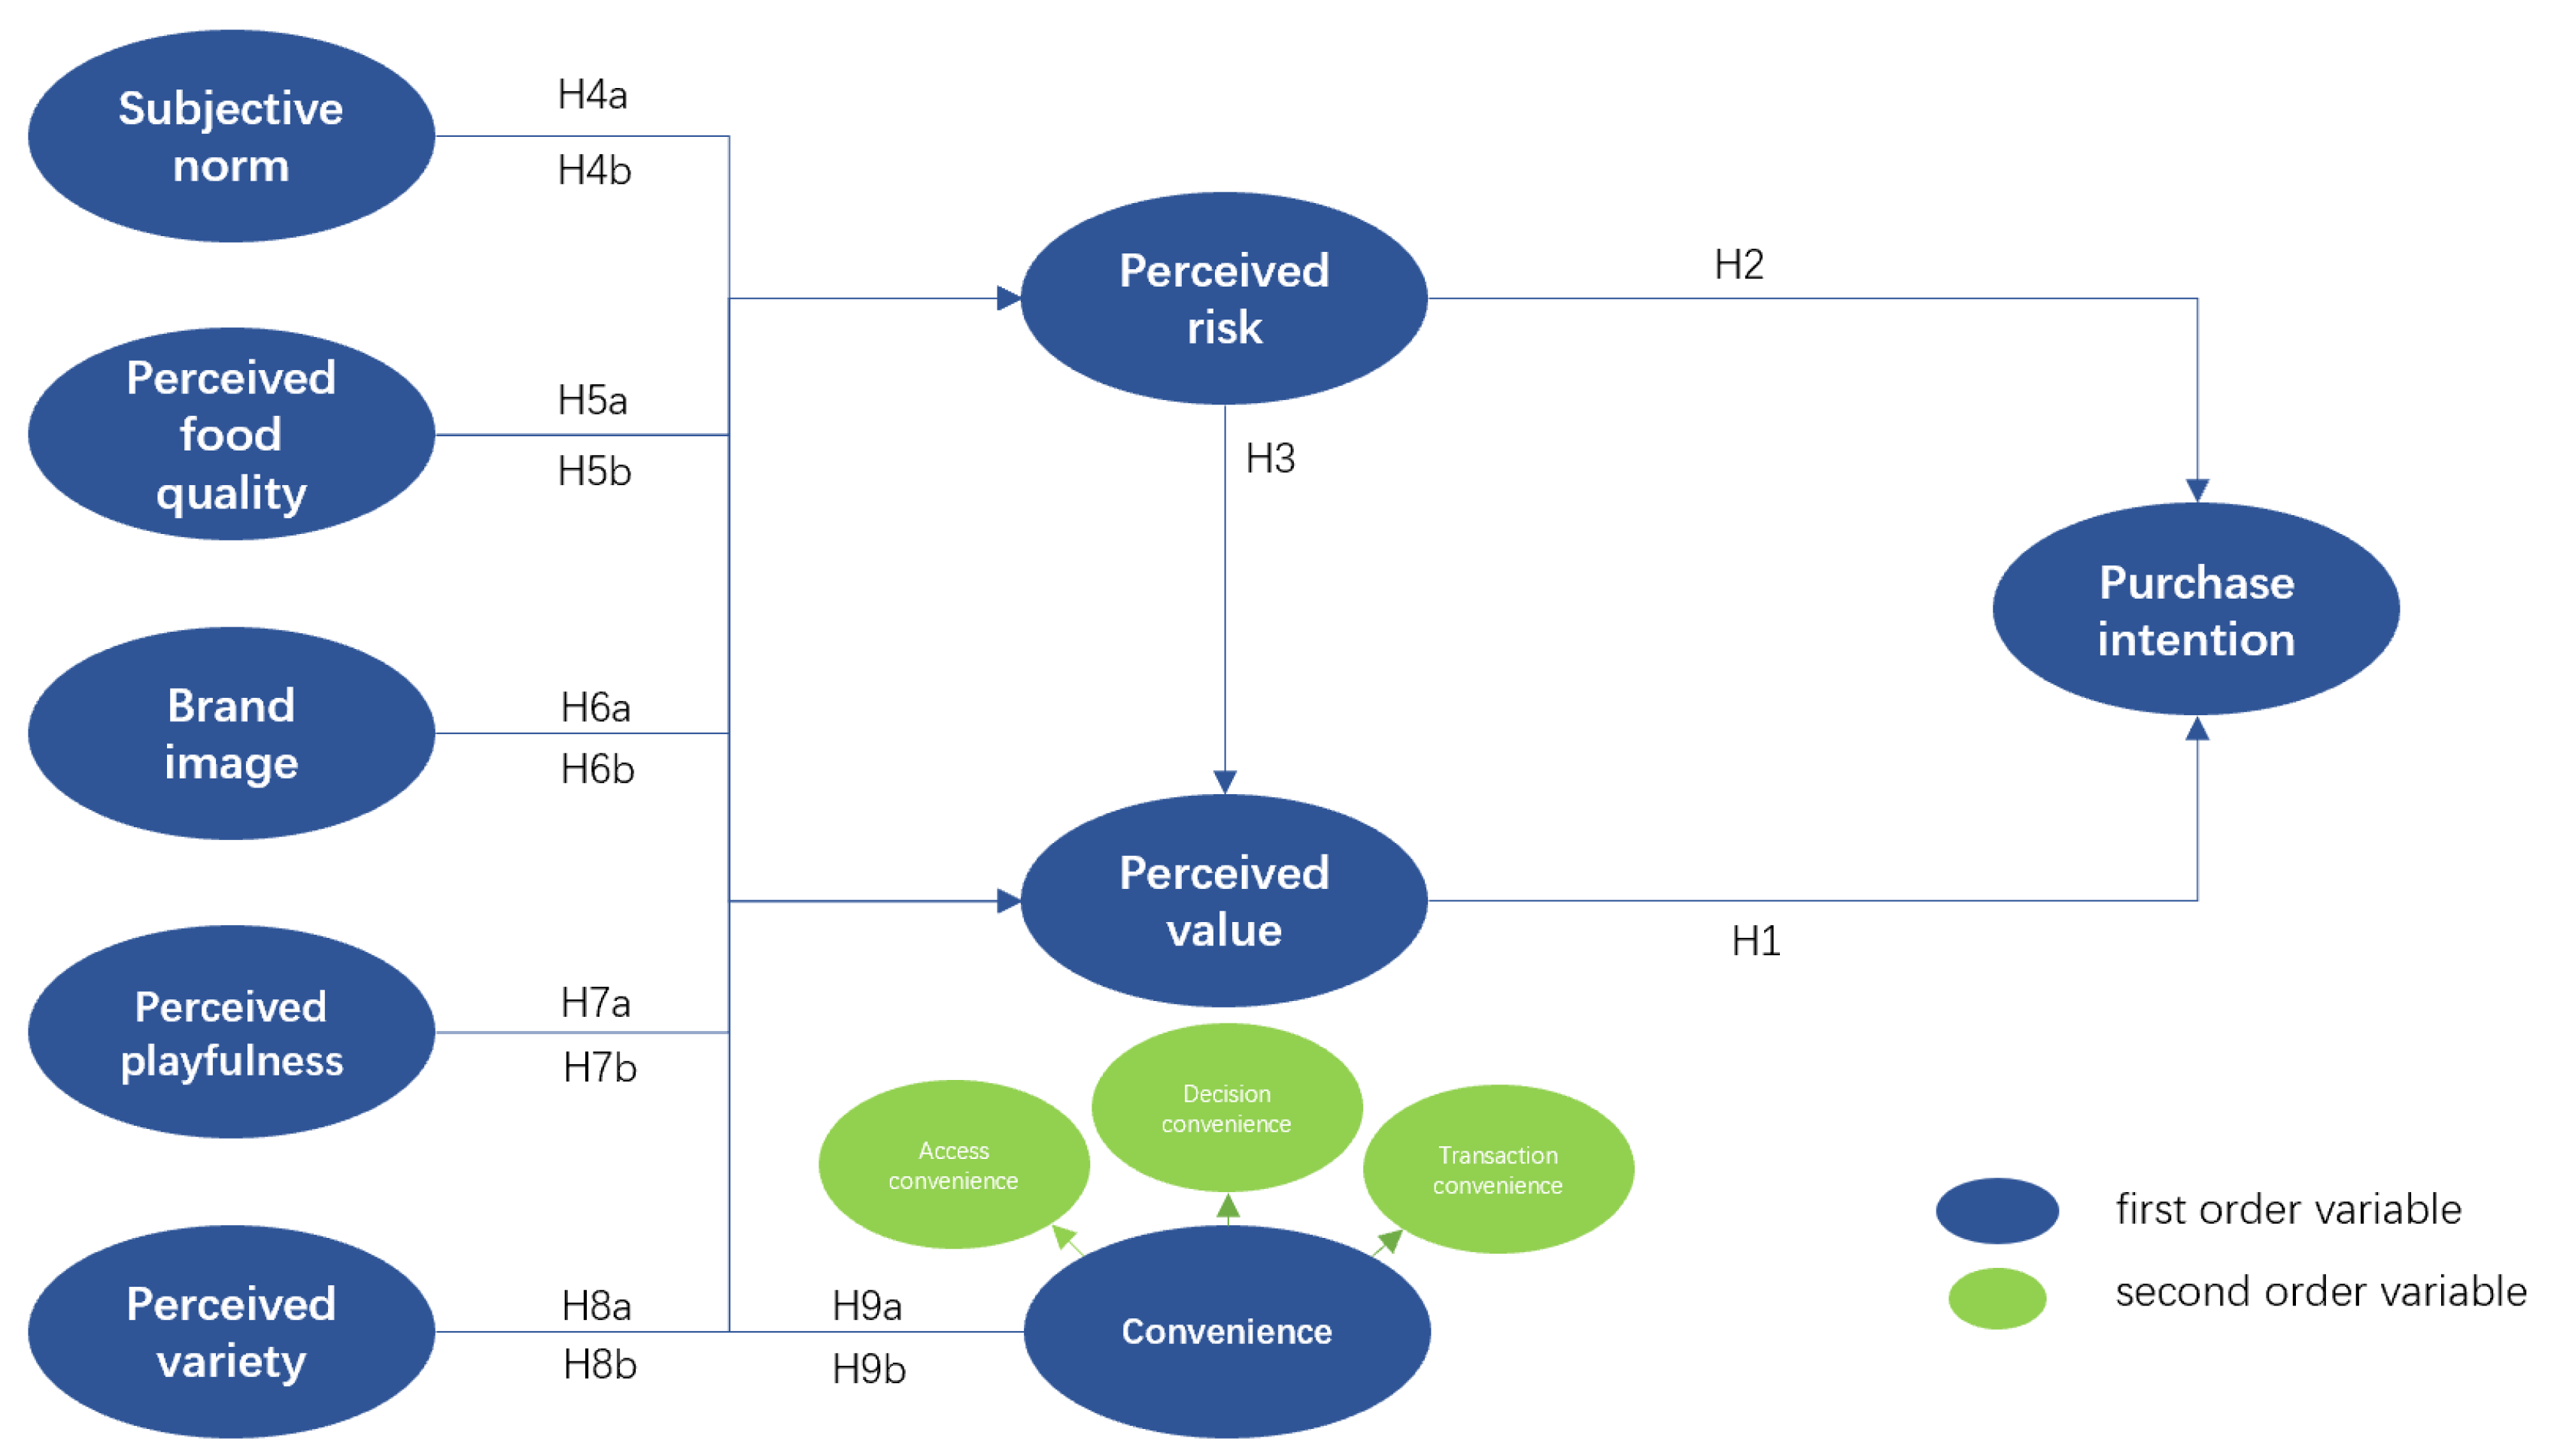
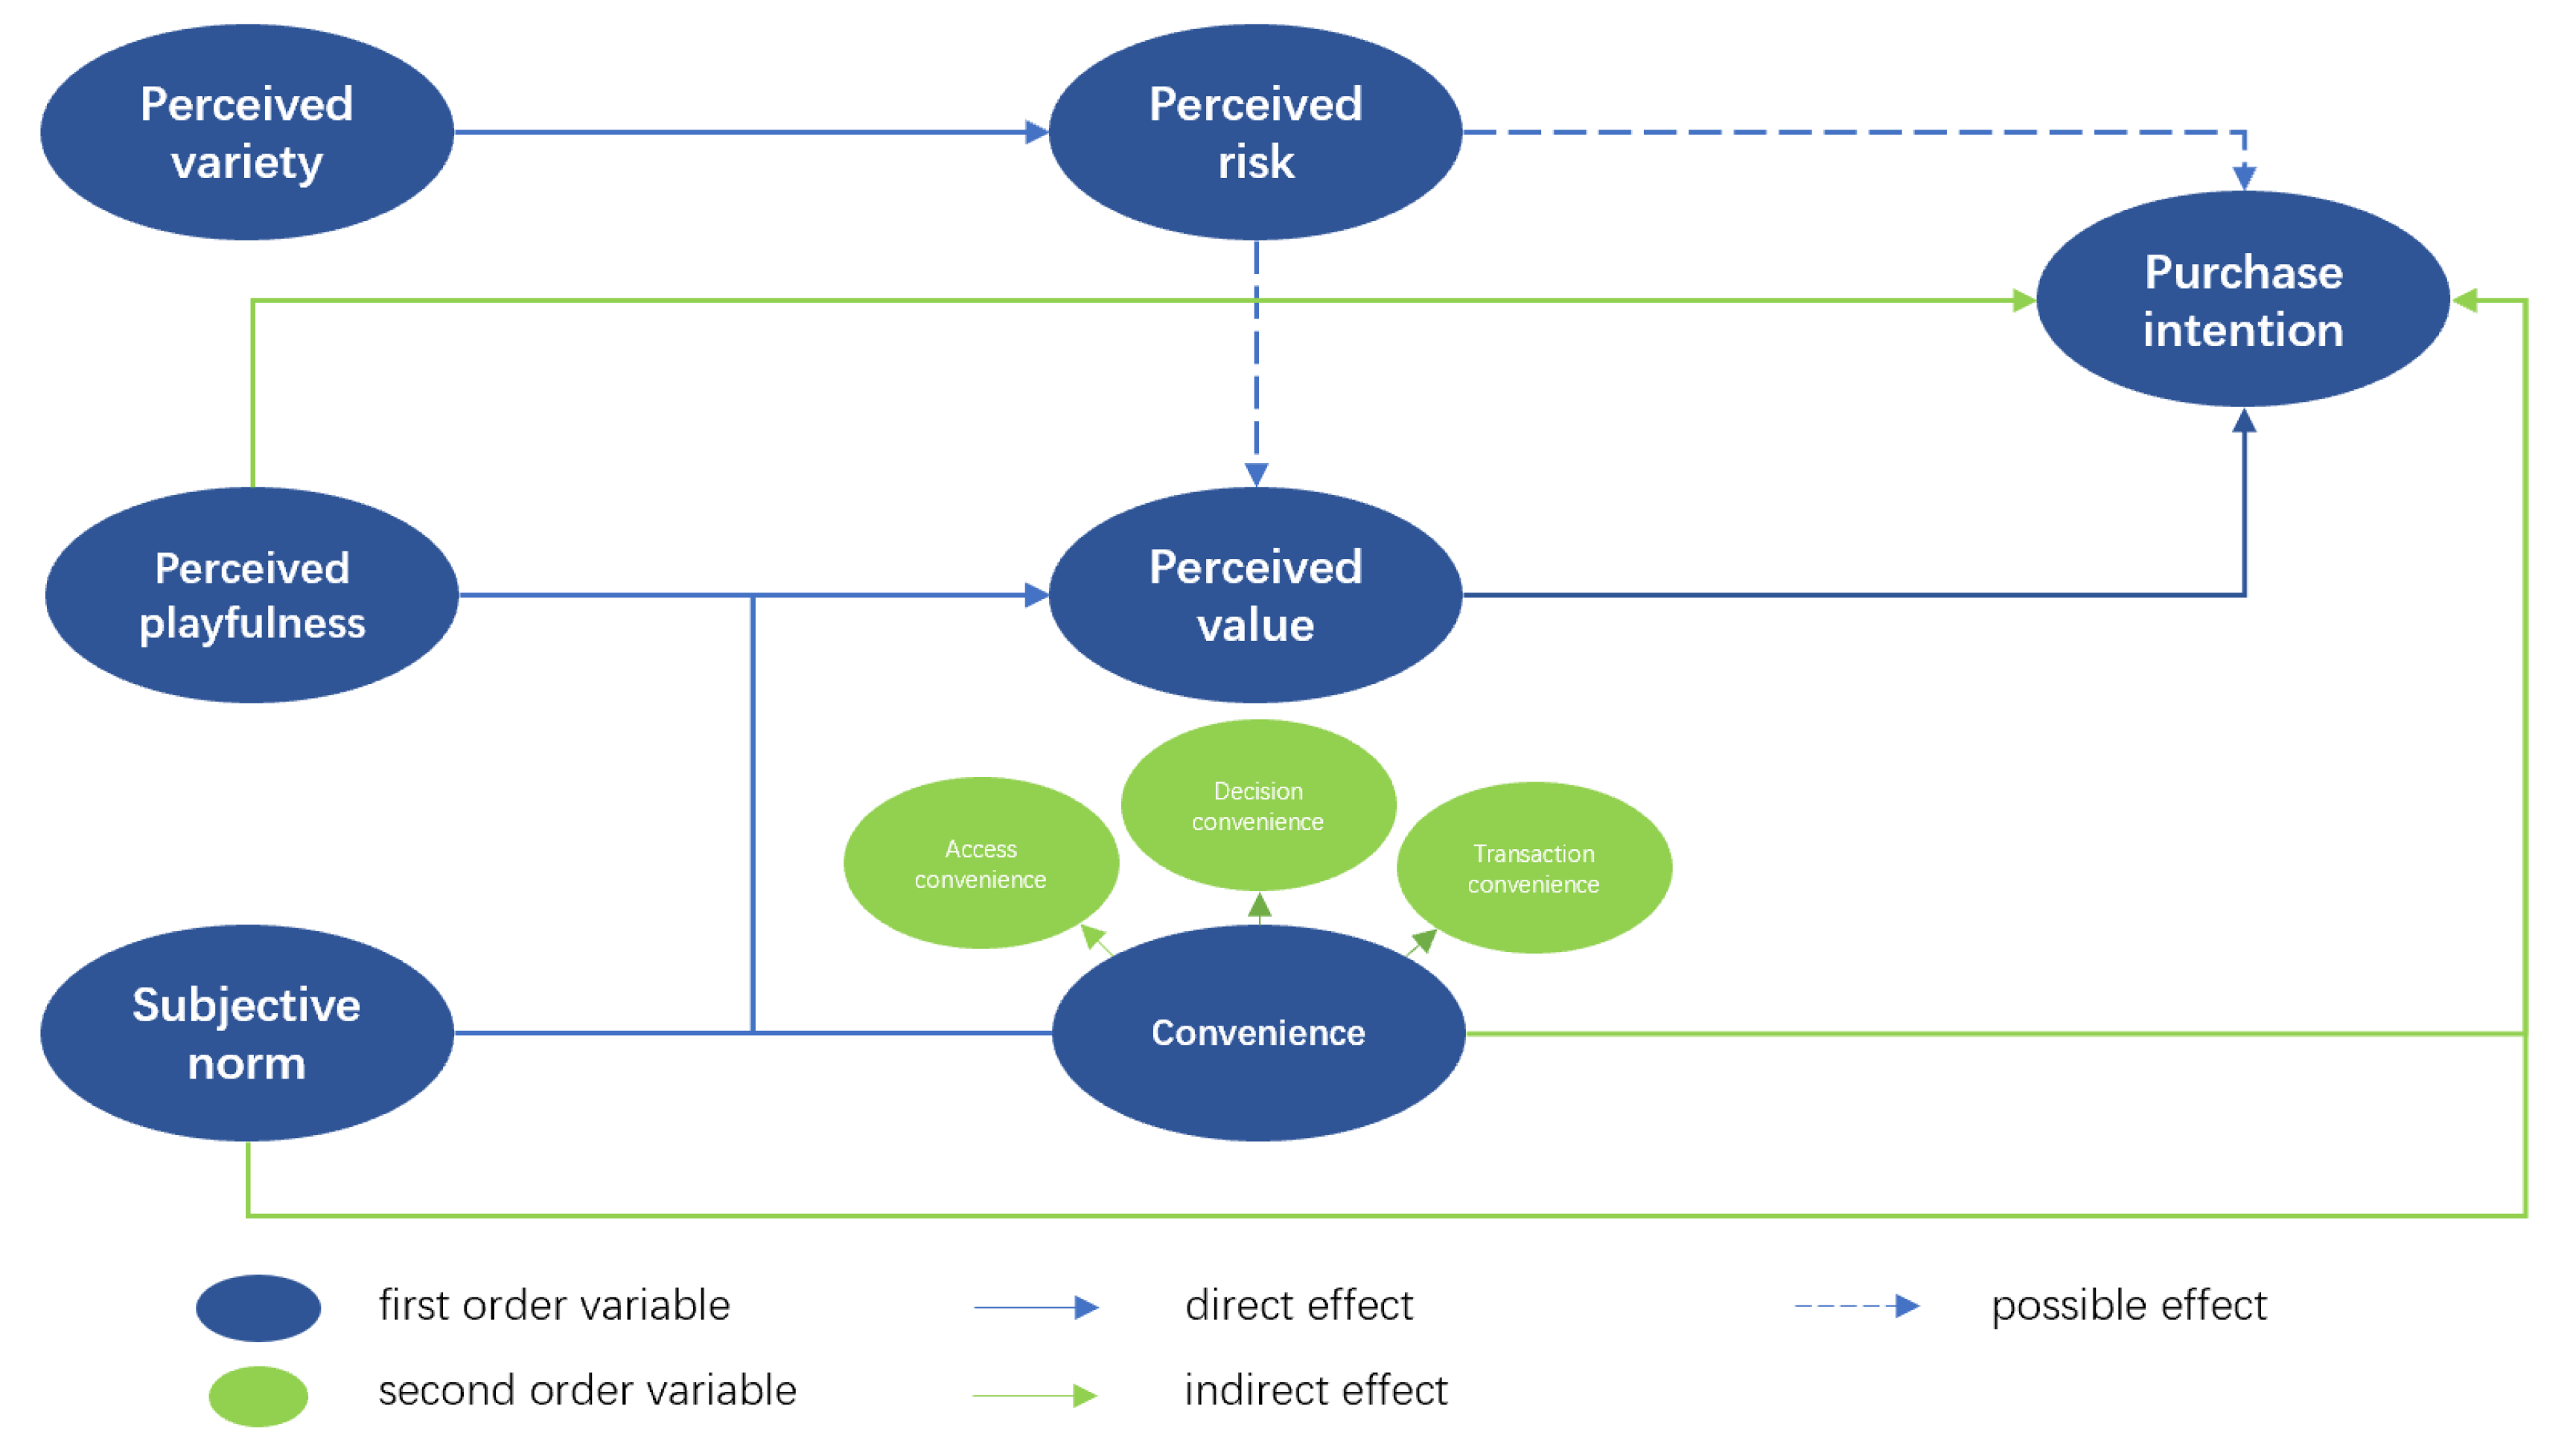
3.1. Research Hypothesis and Model Construction
3.2. Design of Questionnaires
3.3. Design of Questionnaires
4. Research Analysis and Results
4.1. Reliability Analysis
4.2. Exploratory Factor Analysis
4.3. Confirmatory Factor Analysis
4.3.1. First-Order Confirmatory Factor Analysis
4.3.2. Second-Order Confirmatory Factor Analysis
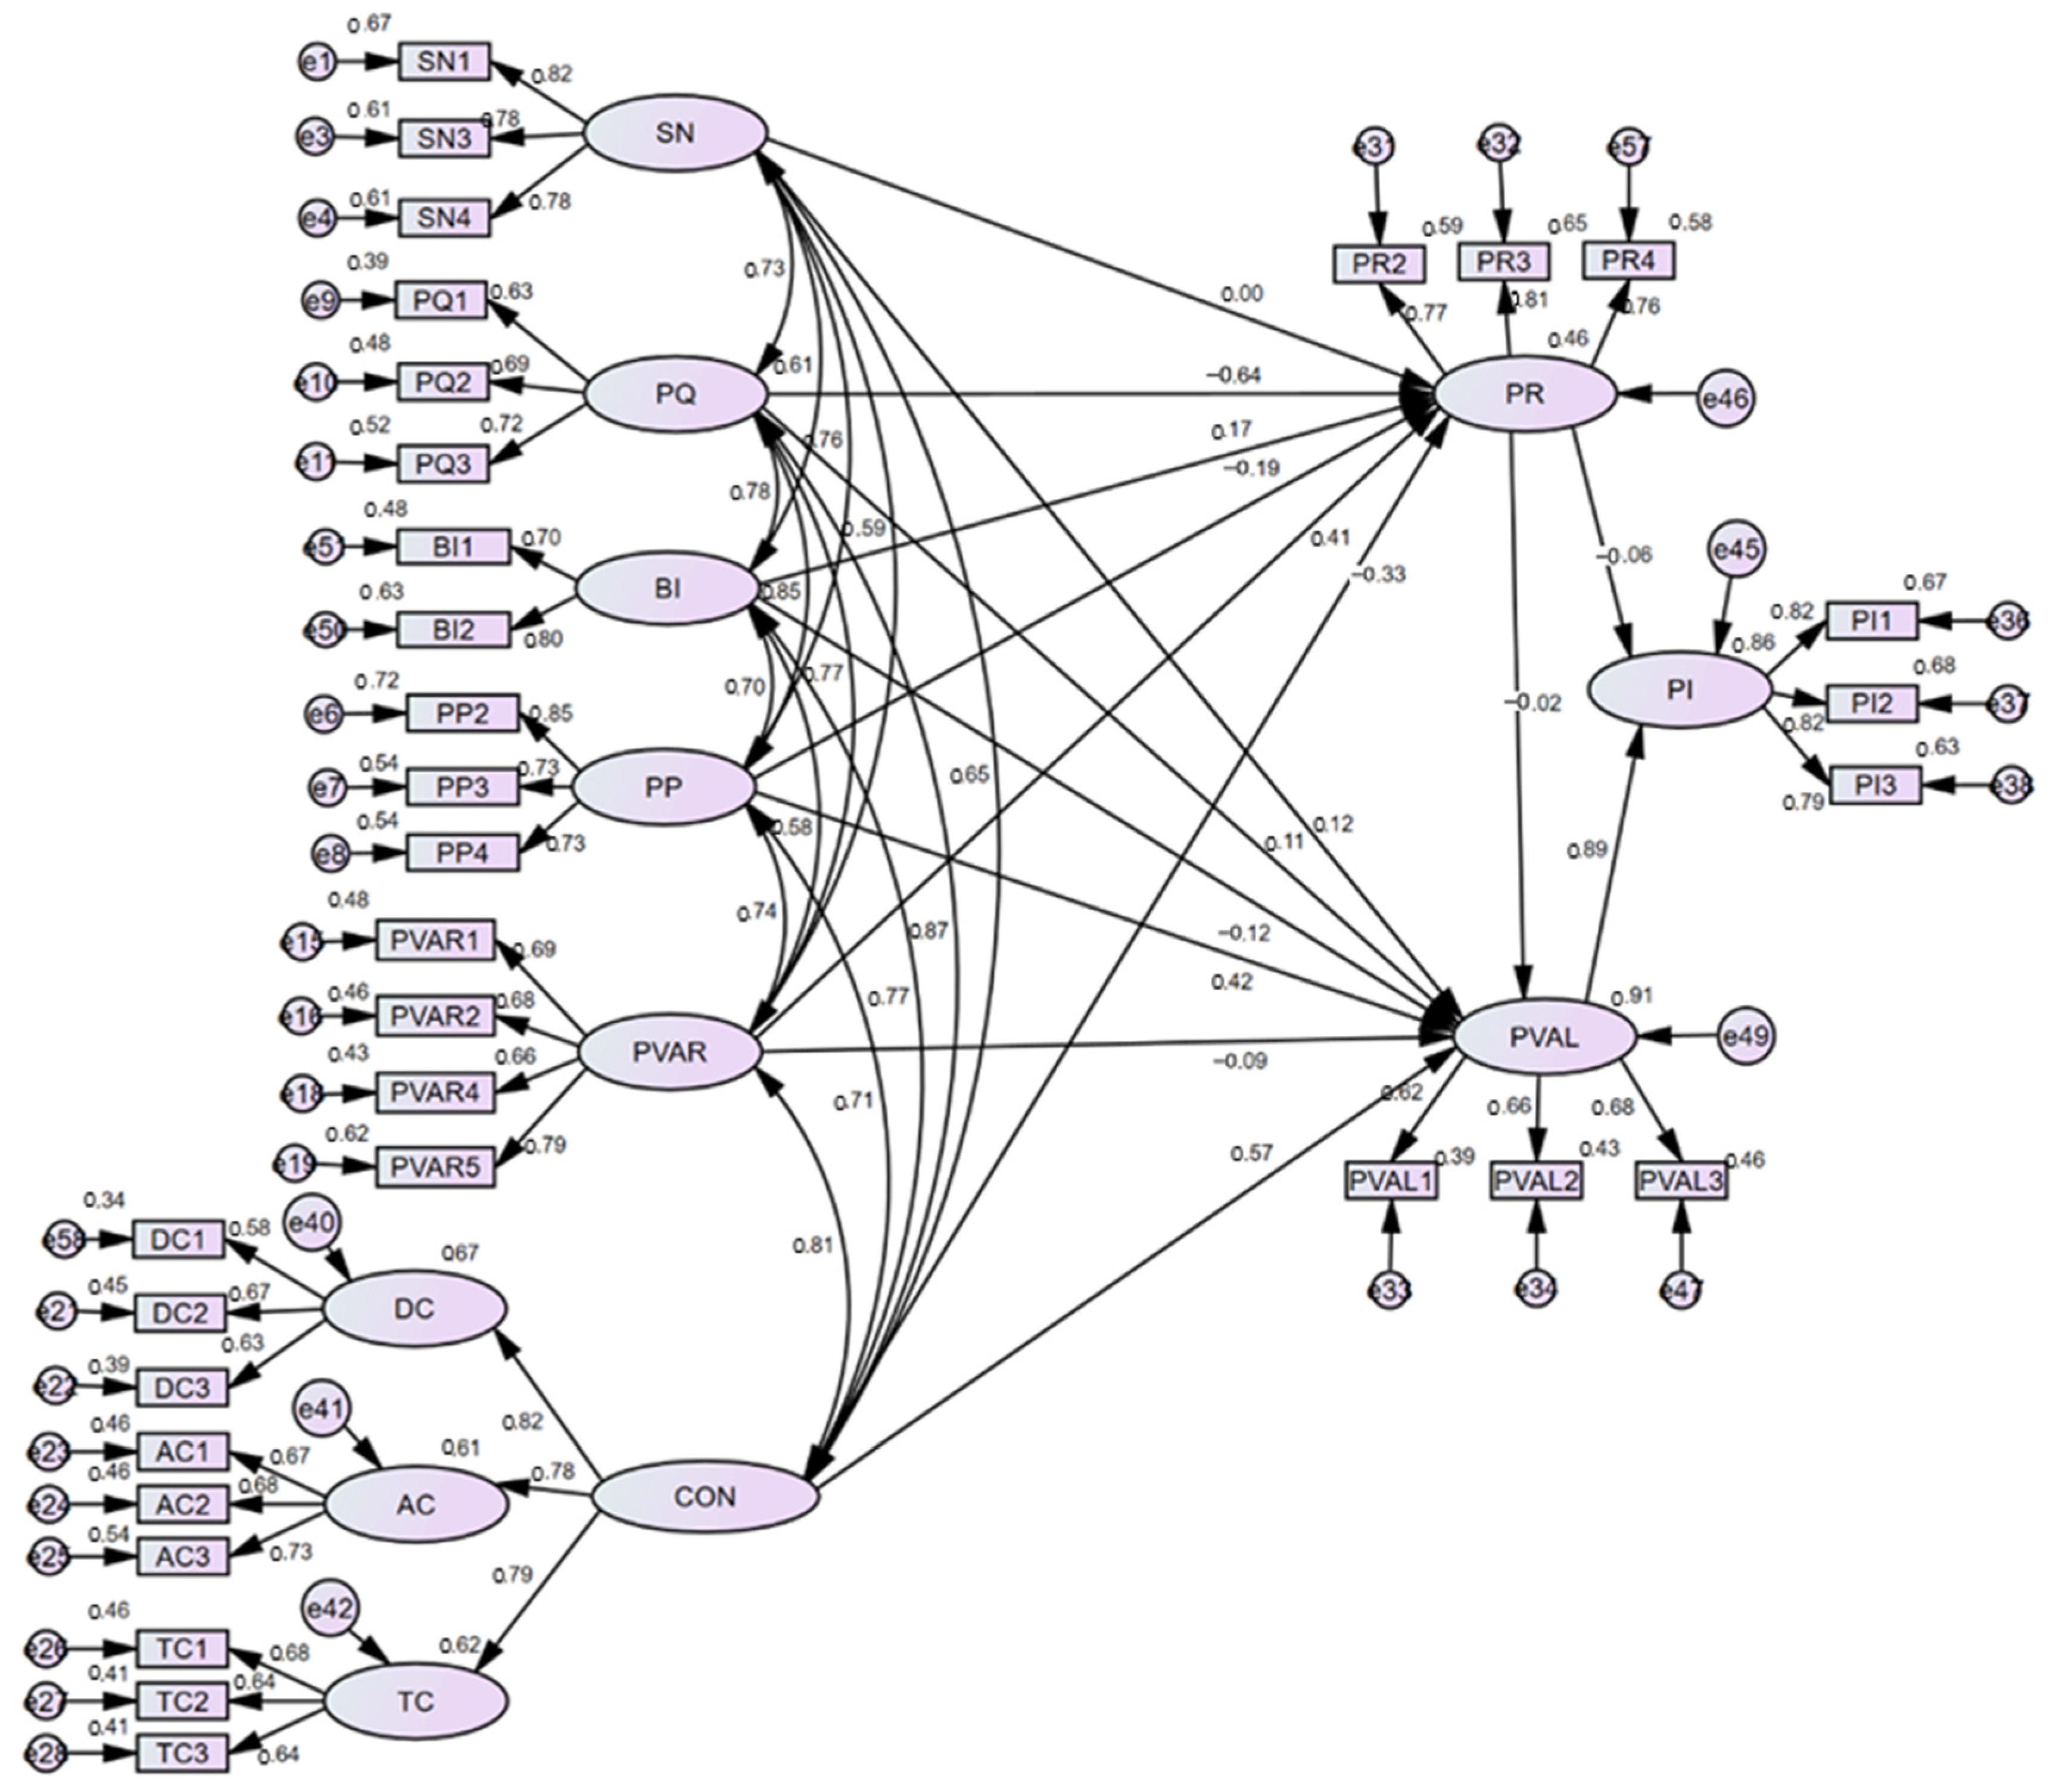
4.3.3. Results of the Structural Equation Model
4.4. Discussions
5. Conclusions and Suggestions
5.1. Theoretical Implications
5.2. Practical Implications
- Increasing the reputation of surplus food blind boxes (SN). For instance, promoting the amount of carbon dioxide that is reduced per serving and offering reduced prices can attract more customers with a variety of different attributes while making them possible repeat customers.
- Making blind boxes more interesting (PP), for example, by developing different styles of blind boxes (while preserving the mysterious characteristics of the blind box). The box may look similar, however, there are likely to be additional surprises within. It is also possible to add a QR code to the blind box, so the consumers can scan it and view the condition of the surplus food materials or the cooking process, which is not only entertaining, but also makes them feel more at ease. Maintain a consistent experience (CON) along the entire purchase path, focusing particularly on communication details and smoothness that stimulate consumers’ feelings, such as improving menu logic, simplifying purchase steps, etc.
- Pay attention to the combination of ingredients (PVAR). Although there are relatively few combinations of surplus food, we can develop a number of combinations of surplus food that will best suit the tastes of consumers.
5.3. Limitations and Future Research
- This paper does not demonstrate the existence of a direct relationship between PR, PV, and PI, but there may be some unknown complete mediation, which is worth investigating.
- PVAL can be divided in order to study the different dimensions of surplus food blind boxes.
- Separate the population into distinct subpopulations and conduct differential research and analysis.
- The present study is a quantitative study using structural equation modeling as the research and analysis method. In the future, qualitative research can be added to elaborate the deeper meaning that quantitative data cannot convey.
- In this study, Chinese samples were used as research subjects. Research in the future may also establish a comparison of Chinese and foreign data, which will broaden the research horizon and expand the research findings.
Author Contributions
Funding
Institutional Review Board Statement
Informed Consent Statement
Data Availability Statement
Conflicts of Interest
References
- F.A.O. The State of Food Security and Nutrition in the World: Safeguarding against Economic Slowdowns and Downturns; F.A.O.: Rome, Italy, 2019. [Google Scholar]
- von Massow, M.; Parizeau, K.; Gallant, M.; Wickson, M.; Haines, J.; Ma, D.W.L.; Wallace, A.; Carroll, N.; Duncan, A.M. Valuing the multiple impacts of household food waste. Front. Nutr. 2019, 6, 143. [Google Scholar] [CrossRef] [PubMed] [Green Version]
- Bai, L.; Cao, S.; Gong, S.; Huang, L. Motivations and obstructions of minimizing suboptimal food waste in chinese households. J. Clean. Prod. 2022, 342, 130951. [Google Scholar] [CrossRef]
- Khalil, M.; Northey, G.; Septianto, F.; Lang, B. Hopefully that’s not wasted! The role of hope for reducing food waste. J. Bus. Res. 2022, 147, 59–70. [Google Scholar]
- Zhang, C.; Su, H.; Baeyens, J.; Tan, T. Reviewing the anaerobic digestion of food waste for biogas production. Renew. Sustain. Energy Rev. 2014, 38, 383–392. [Google Scholar] [CrossRef]
- Song, G.; Li, M.; Semakula, H.M.; Zhang, S. Food consumption and waste and the embedded carbon, water and ecological footprints of households in China. Sci. Total Environ. 2015, 529, 191–197. [Google Scholar] [CrossRef]
- Liu, Y.; Wen, C.; Liu, X. China’s food security soiled by contamination. Science 2013, 339, 1382–1383. [Google Scholar] [CrossRef]
- Cheng, S.; Jin, Z.; Liu, G. 2018 China’s Urban Food Waste Report; WWF-China: Hong Kong, China, 2018. [Google Scholar]
- United Nations. Report of the Secretary-General: Progress towards the Sustainable Development Goals; United Nations: New York, NY, USA, 2020. [Google Scholar]
- Papargyropoulou, E.; Lozano, R.K.; Steinberger, J.; Wright, N.; Ujang, Z.b. The food waste hierarchy as a framework for the management of food surplus and food waste. J. Clean. Prod. 2014, 76, 106–115. [Google Scholar] [CrossRef]
- Teigiserova, D.A.; Hamelin, L.; Thomsen, M. Towards transparent valorization of food surplus, waste and loss: Clarifying definitions, food waste hierarchy, and role in the circular economy. Sci. Total Environ. 2020, 706, 136033. [Google Scholar] [CrossRef]
- Garrone, P.; Melacini, M.; Perego, A. Opening the black box of food waste reduction. Food Policy 2014, 46, 129–139. [Google Scholar] [CrossRef]
- Luo, J. Brand marketing behind the blind box--analysis on the brand marketing of pop mart. Front. Econ. Manag. Decis. 2022, 3, 564–567. [Google Scholar]
- Liu, S.-L. People in box: Blind box consumption landscape and its formation mechanism for z generation. China Youth Study 2022, 2, 78–84. [Google Scholar]
- Eggert, A.; Ulaga, W.; Frow, P.; Payne, A. Conceptualizing and communicating value in business markets: From value in exchange to value in use. Ind. Mark. Manag. 2018, 69, 80–90. [Google Scholar] [CrossRef]
- Lovelock, C. Services Marketing People, Technology, Strategy, 5/e; Pearson Education India: Noida, India, 2008. [Google Scholar]
- Ryu, K.; Lee, H.-R.; Kim, W.G. The influence of the quality of the physical environment, food, and service on restaurant image, customer perceived value, customer satisfaction, and behavioral intentions. Int. J. Contemp. Hosp. Manag. 2012, 24, 200–223. [Google Scholar] [CrossRef]
- Zeithaml, V.A. Consumer perceptions of price, quality, and value: A means-end model and synthesis of evidence. J. Mark. 1988, 52, 2–22. [Google Scholar] [CrossRef]
- Zhang, N.; Liu, R.; Zhang, X.-Y.; Pang, Z.-L. The impact of consumer perceived value on repeat purchase intention based on online reviews: By the method of text mining. Data Sci. Manag. 2021, 3, 22–32. [Google Scholar] [CrossRef]
- Kim, H.J.; Park, J.; Kim, M.-J.; Ryu, K. Does perceived restaurant food healthiness matter? Its influence on value, satisfaction and revisit intentions in restaurant operations in South Korea. Int. J. Hosp. Manag. 2013, 33, 397–405. [Google Scholar]
- Dunn, M.G.; Murphy, P.E.; Skelly, G.U. Research note: The influence of perceived risk on brand preference for supermarket products. J. Retail. 1986, 62, 204–216. [Google Scholar]
- Zanetta, L.D.A.; Hakim, M.P.; Gastaldi, G.B.; Seabra, L.M.A.J.; Rolim, P.M.; Nascimento, L.G.P.; Medeiros, C.O.; da Cunha, D.T. The use of food delivery apps during the COVID-19 pandemic in brazil: The role of solidarity, perceived risk, and regional aspects. Food Res. Int. 2021, 149, 110671. [Google Scholar] [CrossRef]
- Roselius, T. Consumer rankings of risk reduction methods. J. Mark. 1971, 35, 56–61. [Google Scholar] [CrossRef]
- Bamberg, S.; Hunecke, M.; Blöbaum, A. Social context, personal norms and the use of public transportation: Two field studies. J. Environ. Psychol. 2007, 27, 190–203. [Google Scholar] [CrossRef]
- Ajzen, I. The theory of planned behavior. Organ. Behav. Hum. Decis. Process. 1991, 50, 179–211. [Google Scholar] [CrossRef]
- Yang, C.; Chen, X. Factors affecting consumers’ purchasing of suboptimal foods during the COVID-19 pandemic. Agriculture 2022, 12, 99. [Google Scholar] [CrossRef]
- Tsai, W.-C.; Chen, X.; Yang, C. Consumer food waste behavior among emerging adults: Evidence from China. Foods 2020, 9, 961. [Google Scholar] [CrossRef] [PubMed]
- Sulek, J.M.; Hensley, R.L. The relative importance of food, atmosphere, and fairness of wait: The case of a full-service restaurant. Cornell Hotel. Restaur. Adm. Q. 2004, 45, 235–247. [Google Scholar] [CrossRef]
- Konuk, F.A. The influence of perceived food quality, price fairness, perceived value and satisfaction on customers’ revisit and word-of-mouth intentions towards organic food restaurants. J. Retail. Consum. Serv. 2019, 50, 103–110. [Google Scholar] [CrossRef]
- Keller, K.L. Conceptualizing, measuring, and managing customer-based brand equity. J. Mark. 1993, 57, 1–22. [Google Scholar] [CrossRef]
- Mitra, S.; Jenamani, M. Obim: A computational model to estimate brand image from online consumer review. J. Bus. Res. 2020, 114, 213–226. [Google Scholar] [CrossRef]
- He, X.; Song, X. Advances in Human Factors, Business Management and Leadership: Cham, 2020. In Service Design under the Form of “Micro Public Benefit” Taking the Surplus Food Sharing App as an Example; Kantola, J.I., Nazir, S., Salminen, V., Eds.; Springer International Publishing: Cham, Switzerland, 2020; pp. 290–296. [Google Scholar]
- Ikea. Reduce Food Waste with Ikea & Too Good to Go. Available online: https://www.ikea.com/nl/en/campaigns/reduce-food-waste-with-ikea-and-too-good-to-go-pubffaa1c61 (accessed on 20 April 2022).
- Shufflebotham, B. I Ordered a £3.59 Mystery Bag from Starbucks and It Was Miles Better than Costa. Available online: https://www.manchestereveningnews.co.uk/whats-on/whats-on-news/ordered-359-mystery-bag-starbucks-23598993 (accessed on 20 April 2022).
- Moon, J.-W.; Kim, Y.-G. Extending the tam for a world-wide-web context. Inf. Manag. 2001, 38, 217–230. [Google Scholar] [CrossRef]
- Jiang, Q.; Sun, J.; Yang, C.; Gu, C. The impact of perceived interactivity and intrinsic value on users’ continuance intention in using mobile augmented reality virtual shoe-try-on function. Systems 2022, 10, 3. [Google Scholar] [CrossRef]
- Padilla-Meléndez, A.; del Aguila-Obra, A.R.; Garrido-Moreno, A. Perceived playfulness, gender differences and technology acceptance model in a blended learning scenario. Comput. Educ. 2013, 63, 306–317. [Google Scholar] [CrossRef]
- Hung, S.-Y.; Tsai, J.C.-A.; Chou, S.-T. Decomposing perceived playfulness: A contextual examination of two social networking sites. Inf. Manag. 2016, 53, 698–716. [Google Scholar] [CrossRef]
- Huang, Z.; Kwong, J.Y.Y. Illusion of variety: Lower readability enhances perceived variety. Int. J. Res. Mark. 2016, 33, 674–687. [Google Scholar] [CrossRef]
- Chen, L.-d.; Gillenson, M.L.; Sherrell, D.L. Enticing online consumers: An extended technology acceptance perspective. Inf. Manag. 2002, 39, 705–719. [Google Scholar] [CrossRef]
- Berry, L.L.; Seiders, K.; Grewal, D. Understanding service convenience. J. Mark. 2002, 66, 1–17. [Google Scholar] [CrossRef]
- Kaura, V. Service convenience, customer satisfaction, and customer loyalty: Study of indian commercial banks. J. Glob. Mark. 2013, 26, 18–27. [Google Scholar] [CrossRef]
- Wong, A. Consumer perceptions of service convenience in hedonic and utilitarian retail settings in China. J. Int. Consum. Mark. 2021, 33, 452–470. [Google Scholar] [CrossRef]
- Ajzen, I.; Fishbein, M. Understanding Attitudes and Predicting Social Behavior; Prentice-Hall: Hoboken, NJ, USA, 1980. [Google Scholar]
- Kang, J.H.; Jin, B. Marketing Dynamism & Sustainability: Things Change, Things Stay the Same…, Cham, 2015. In Positive Consumption Emotion to Purchase Intention Cross-Cultural Evidence from China and India; Robinson, L., Ed.; Springer International Publishing: Cham, Switzerland, 2015; pp. 655–658. [Google Scholar]
- Yang, C.; Tu, J.-C.; Jiang, Q. The influential factors of consumers’ sustainable consumption: A case on electric vehicles in China. Sustainability 2020, 12, 3496. [Google Scholar] [CrossRef] [Green Version]
- Eberle, L.; Sperandio Milan, G.; Borchardt, M.; Medeiros Pereira, G.; Paula Graciola, A. Determinants and moderators of organic food purchase intention. Food Qual. Prefer. 2022, 100, 104609. [Google Scholar] [CrossRef]
- Liu, H.; Feng, S.; Hu, X. Process vs. Outcome: Effects of food photo types in online restaurant reviews on consumers’ purchase intention. Int. J. Hosp. Manag. 2022, 102, 103179. [Google Scholar] [CrossRef]
- Bae, S.Y.; Chang, P.-J. The effect of coronavirus disease-19 (COVID-19) risk perception on behavioural intention towards ‘untact’ tourism in south korea during the first wave of the pandemic (march 2020). Curr. Issues Tour. 2021, 24, 1017–1035. [Google Scholar] [CrossRef]
- Sasmita, J.; Mohd Suki, N. Young consumers’ insights on brand equity. Int. J. Retail. Distrib. Manag. 2015, 43, 276–292. [Google Scholar] [CrossRef]
- Chu, C.W.; Lu, H.P. Factors influencing online music purchase intention in taiwan. Internet Res. 2007, 17, 139–155. [Google Scholar] [CrossRef]
- Sylvester, B.D.; Standage, M.; Dowd, A.J.; Martin, L.J.; Sweet, S.N.; Beauchamp, M.R. Perceived variety, psychological needs satisfaction and exercise-related well-being. Psychol. Health 2014, 29, 1044–1061. [Google Scholar] [CrossRef] [PubMed] [Green Version]
- Abbasi, G.A.; Kumaravelu, J.; Goh, Y.-N.; Dara Singh, K.S. Understanding the intention to revisit a destination by expanding the theory of planned behaviour (tpb). Span. J. Mark.-ESIC 2021, 25, 282–311. [Google Scholar] [CrossRef]
- Gu, C.; Chen, J.; Wei, W.; Sun, J.; Yang, C.; Jiang, L.; Hu, J.; Lv, B.; Lin, S.; Jiang, Q. The impact of reusable tableware packaging combined with environmental propaganda on consumer behaviour in online retail. PLoS ONE 2022, 17, e0264562. [Google Scholar] [CrossRef] [PubMed]
- Jackson, D.L. Revisiting sample size and number of parameter estimates: Some support for the n:Q hypothesis. Struct. Equ. Model. Multidiscip. J. 2003, 10, 128–141. [Google Scholar] [CrossRef]
- Hofhuis, J.; Hautvast, J.L.A.; Schrijvers, A.J.P.; Bakker, J. Quality of life on admission to the intensive care: Can we query the relatives? Intensive Care Med. 2003, 29, 974–979. [Google Scholar] [CrossRef]
- Morgan, P.J.; Cleave-Hogg, D.; DeSousa, S.; Tarshis, J. High-fidelity patient simulation: Validation of performance checklists. BJA Br. J. Anaesth. 2004, 92, 388–392. [Google Scholar] [CrossRef] [Green Version]
- Sakip, S.R.M.; Akhir, N.M.; Omar, S.S. Determinant factors of successful public parks in malaysia. Procedia-Soc. Behav. Sci. 2015, 170, 422–432. [Google Scholar] [CrossRef] [Green Version]
- Norusis, M.J. Spss for Windows: Base System User’s Guide, Release 5.0; SPSS Incorporated: Chicago, IL, USA, 1992. [Google Scholar]
- Kaiser, H.F. An index of factorial simplicity. Psychometrika 1974, 39, 31–36. [Google Scholar] [CrossRef]
- Harman, H. Modern Factor Analysis; University of Chicago Press: Chicago, IL, USA, 1960. [Google Scholar]
- Kohli, A.K.; Shervani, T.A.; Challagalla, G.N. Learning and performance orientation of salespeople: The role of supervisors. J. Mark. Res. 1998, 35, 263–274. [Google Scholar] [CrossRef] [Green Version]
- Fornell, C.; Larcker, D.F. Evaluating structural equation models with unobservable variables and measurement error. J. Mark. Res. 1981, 18, 39–50. [Google Scholar] [CrossRef]
- Liang, A.R.-D.; Lim, W.M. Exploring the online buying behavior of specialty food shoppers. Int. J. Hosp. Manag. 2011, 30, 855–865. [Google Scholar] [CrossRef]
- Fernandes, D.W.; Moori, R.G.; Filho, V.A.V. Logistic service quality as a mediator between logistics capabilities and customer satisfaction. Rev. Gestão 2018, 25, 358–372. [Google Scholar] [CrossRef] [Green Version]
- Jackson, D.L.; Gillaspy, J.A., Jr.; Purc-Stephenson, R. Reporting practices in confirmatory factor analysis: An overview and some recommendations. Psychol. Methods 2009, 14, 6. [Google Scholar] [CrossRef]
- Kline, R.B. Principles and Practice of Structural Equation Modeling; Guilford Publications: New York City, NY, USA, 2015. [Google Scholar]
- Whittaker, T.A. A Beginner’s Guide to Structural Equation Modeling; Taylor & Francis: Singapore, 2011. [Google Scholar]
- Hu, L.t.; Bentler, P.M. Cutoff criteria for fit indexes in covariance structure analysis: Conventional criteria versus new alternatives. Struct. Equ. Model. Multidiscip. J. 1999, 6, 1–55. [Google Scholar] [CrossRef]
- Liao, H.-L.; Lu, H.-P. The role of experience and innovation characteristics in the adoption and continued use of e-learning websites. Comput. Educ. 2008, 51, 1405–1416. [Google Scholar] [CrossRef]
- Bonsón Ponte, E.; Carvajal-Trujillo, E.; Escobar-Rodríguez, T. Influence of trust and perceived value on the intention to purchase travel online: Integrating the effects of assurance on trust antecedents. Tour. Manag. 2015, 47, 286–302. [Google Scholar] [CrossRef]
- Chae, H.; Kim, S.; Lee, J.; Park, K. Impact of product characteristics of limited edition shoes on perceived value, brand trust, and purchase intention; focused on the scarcity message frequency. J. Bus. Res. 2020, 120, 398–406. [Google Scholar] [CrossRef]
- Hsu, C.-L.; Lin, J.C.-C. What drives purchase intention for paid mobile apps?—An expectation confirmation model with perceived value. Electron. Commer. Res. Appl. 2015, 14, 46–57. [Google Scholar]
- Kuo, Y.-F.; Wu, C.-M.; Deng, W.-J. The relationships among service quality, perceived value, customer satisfaction, and post-purchase intention in mobile value-added services. Comput. Hum. Behav. 2009, 25, 887–896. [Google Scholar] [CrossRef]
- Jin, H.; Lin, Z.; McLeay, F. Negative emotions, positive actions: Food safety and consumer intentions to purchase ethical food in China. Food Qual. Prefer. 2020, 85, 103981. [Google Scholar] [CrossRef]
- Sobal, J.; Bisogni, C.A. Constructing food choice decisions. Ann. Behav. Med. 2009, 38, s37–s46. [Google Scholar] [CrossRef] [PubMed]
- Byrum, K. “Hey friend, buy green”: Social media use to influence eco-purchasing involvement. Environ. Commun. 2019, 13, 209–221. [Google Scholar] [CrossRef]
- Huidobro Giménez, C. Normalizing Sustainable Consumption: How Marketing Is Used to Fight Food Waste. A Case Study with too Good to Go, the Movement that Fights Food Waste across Europe. Master’s Thesis, Lund University, Lund, Sweden, 2019. [Google Scholar]
- HOLA. Ikea Restaurant Turns Leftovers into Blind Boxes! 2.49 What’s in the Blind Box? Available online: https://www.bilibili.com/video/BV1fY411H7HY?spm_id_from=333.337.search-card.all.click (accessed on 25 April 2022).
- McShane, L.; Pancer, E.; Poole, M.; Deng, Q. Emoji, playfulness, and brand engagement on twitter. J. Interact. Mark. 2021, 53, 96–110. [Google Scholar] [CrossRef]
- Abbasi, A.Z.; Shamim, A.; Ting, D.H.; Hlavacs, H.; Rehman, U. Playful-consumption experiences and subjective well-being: Children’s smartphone usage. Entertain. Comput. 2021, 36, 100390. [Google Scholar] [CrossRef]
- Vyt, D.; Jara, M.; Mevel, O.; Morvan, T.; Morvan, N. The impact of convenience in a click and collect retail setting: A consumer-based approach. Int. J. Prod. Econ. 2022, 248, 108491. [Google Scholar] [CrossRef]

| Measurements | Description |
|---|---|
| Food waste in China annually | Approximately 17 to 18 metric tons of food are wasted annually [5], which produces 54 metric tons of carbon dioxide equivalent emissions, consumes 24 metric tons of water, and occupies 23 million hectares of land [6]. |
| Food waste in Chinese households annually | About 5.5 metric tons of food are wasted annually, equivalent to 22% of total food production. For vegetables and fruits, this percentage is even higher [7]. |
| Amount of food wasted per Chinese per day | It is about 93 g per meal, about 279 g three times a day [8]. |
| Attributes | Variables | Operating Definition | Request References |
|---|---|---|---|
| first-order | Subjective norm (SN) | Social pressures that encourage or discourage individuals to make an action with the surplus food blind box | [49] |
| Perceived food quality (PQ) | Consumers’ judgment of quality of the surplus food blind box based on cues | [29] | |
| Brand image (BI) | Brand image is related to the consumers’ use of the brand to reflect their symbolic meaning of consumption and identity in self-expression | [50] | |
| Perceived playfulness (PP) | perceived playfulness as the degree to which the consumer believes that enjoyment could be derived when shopping for the surplus food blind box | [51] | |
| Perceived variety (PVAR) | The pursuit and experience of diverse types of food in consumer’s shopping for the surplus food blind box | [52] | |
| Convenience (CON) | Consumers’ perceptions of their time and effort with regards to purchasing the surplus food blind box | [43] | |
| Perceived risk (PR) | Perceived risk is defined as a potential consumer’ perception about the possible uncertain negative outcomes from shopping for the surplus food blind box | [53] | |
| Perceived value (PVAL) | Consumer’s overall assessment of the utility of the surplus food blind box | [29] | |
| Purchase intention (PI) | Consumer’s intention to purchase the surplus food blind box | [54] | |
| Second-order | Access convenience (AC) | Access convenience refers to the degree of ease and comfort for the consumer to arrive at the trading venue | [43] |
| Decision convenience (DC) | Decision convenience relates to the time and effort utilized by consumers in making purchase decisions and deciding between products, brands, or service providers | [43] | |
| Transaction convenience (TC) | Transaction convenience refers to the time and effort the consumers spend to finalize a purchase | [43] |
| Sample | Category | Number | Percentage (%) |
|---|---|---|---|
| Gender | male | 410 | 55.8% |
| Female | 325 | 44.2% | |
| Age | 19–29 | 342 | 46.5% |
| 30–39 | 297 | 40.4% | |
| 40–49 | 75 | 10.2% | |
| above 50 | 21 | 2.9% | |
| Marriage Status | Married | 553 | 75.2% |
| unmarried | 182 | 24.8% | |
| Monthly Income | Below 4000 | 74 | 10.1% |
| 4001–8000 | 148 | 20.1% | |
| 8001–16,000 | 335 | 45.6% | |
| 16,001–30,000 | 134 | 18.2% | |
| 30,001 or more | 44 | 6.0% | |
| Education | Junior high school or below | 3 | 0.4% |
| high school or secondary school | 27 | 3.7% | |
| Undergraduate or college | 641 | 87.2% | |
| Institute including above | 64 | 8.7% | |
| Occupation | civil servant | 69 | 9.4% |
| clerk | 353 | 48.0% | |
| Worker | 108 | 14.7% | |
| public service agency | 79 | 10.7% | |
| student | 50 | 6.8% | |
| self-employed | 76 | 10.3% | |
| Area | East area | 412 | 56.1% |
| Central Region | 131 | 17.8% | |
| Western Region | 153 | 20.8% | |
| North-west region | 39 | 5.3% |
| Construct | Item | Mean | Std. Deviation | CITC | Cronbach’s α If Item Deleted | Cronbach’s α |
|---|---|---|---|---|---|---|
| SN | SN1 | 3.478 | 1.053 | 0.706 | 0.762 | 0.835 |
| SN2 | 3.579 | 1.118 | 0.695 | 0.774 | ||
| SN3 | 3.513 | 1.046 | 0.689 | 0.778 | ||
| PP | PP1 | 3.565 | 1.151 | 0.715 | 0.692 | 0.814 |
| PP2 | 3.379 | 1.156 | 0.654 | 0.755 | ||
| PP3 | 3.744 | 1.123 | 0.627 | 0.783 | ||
| PQ | PQ1 | 3.576 | 1.091 | 0.470 | 0.702 | 0.714 |
| PQ2 | 3.433 | 1.059 | 0.547 | 0.607 | ||
| PQ3 | 3.493 | 1.062 | 0.585 | 0.560 | ||
| BI | BI1 | 3.161 | 1.151 | 0.554 | - | 0.713 |
| BI2 | 3.460 | 1.108 | 0.554 | - | ||
| PVAR | PVAR1 | 3.893 | 1.004 | 0.615 | 0.737 | 0.793 |
| PVAR2 | 3.891 | 1.003 | 0.568 | 0.761 | ||
| PVAR3 | 3.995 | 0.912 | 0.565 | 0.761 | ||
| PVAR4 | 3.985 | 0.918 | 0.672 | 0.709 | ||
| DC | DC1 | 3.561 | 0.939 | 0.448 | 0.591 | 0.657 |
| DC2 | 3.542 | 1.172 | 0.463 | 0.580 | ||
| DC3 | 3.571 | 1.010 | 0.507 | 0.511 | ||
| AC | AC1 | 3.556 | 1.020 | 0.539 | 0.674 | 0.736 |
| AC2 | 3.502 | 1.068 | 0.546 | 0.666 | ||
| AC3 | 3.472 | 1.109 | 0.597 | 0.605 | ||
| TC | TC1 | 3.976 | 0.965 | 0.521 | 0.575 | 0.689 |
| TC2 | 3.954 | 0.904 | 0.495 | 0.608 | ||
| TC3 | 4.108 | 0.871 | 0.499 | 0.605 | ||
| PR | PR1 | 3.084 | 1.194 | 0.687 | 0.751 | 0.824 |
| PR2 | 3.352 | 1.218 | 0.684 | 0.754 | ||
| PR3 | 3.334 | 1.163 | 0.670 | 0.768 | ||
| PVAL | PVAL1 | 3.565 | 0.925 | 0.546 | 0.677 | 0.740 |
| PVAL2 | 3.452 | 1.058 | 0.566 | 0.656 | ||
| PVAL3 | 3.652 | 0.998 | 0.587 | 0.627 | ||
| PI | PI1 | 3.725 | 1.039 | 0.730 | 0.787 | 0.852 |
| PI2 | 3.845 | 1.052 | 0.735 | 0.781 | ||
| PI3 | 3.774 | 1.031 | 0.703 | 0.812 |
| Construct | KMO | Bartlett Sphere Test | Item | Component Matrix | Communalities | Eigenvalue | Total Variation Explaine% |
|---|---|---|---|---|---|---|---|
| SN | 0.726 | 0 | SN1 | 0.873 | 0.762 | 2.258 | 75.255 |
| SN2 | 0.886 | 0.751 | |||||
| SN3 | 0.863 | 0.745 | |||||
| PP | 0.703 | 0 | PP1 | 0.883 | 0.780 | 2.187 | 72.910 |
| PP2 | 0.848 | 0.719 | |||||
| PP3 | 0.829 | 0.688 | |||||
| PQ | 0.660 | 0 | PQ1 | 0.745 | 0.555 | 1.913 | 63.771 |
| PQ2 | 0.812 | 0.659 | |||||
| PQ3 | 0.836 | 0.699 | |||||
| BI | 0.500 | 0 | BI1 | 0.882 | 0.777 | 1.554 | 77.707 |
| BI2 | 0.882 | 0.777 | |||||
| PVAR | 0.789 | 0 | PVAR1 | 0.796 | 0.634 | 2.479 | 61.987 |
| PVAR2 | 0.758 | 0.575 | |||||
| PVAR3 | 0.756 | 0.572 | |||||
| PVAR4 | 0.836 | 0.698 | |||||
| DC | 0.655 | 0 | DC1 | 0.754 | 0.568 | 1.791 | 59.697 |
| DC2 | 0.764 | 0.583 | |||||
| DC3 | 0.800 | 0.640 | |||||
| AC | 0.680 | 0 | AC1 | 0.794 | 0.630 | 1.964 | 65.460 |
| AC2 | 0.798 | 0.637 | |||||
| AC3 | 0.835 | 0.697 | |||||
| TC | 0.669 | 0 | TC1 | 0.799 | 0.638 | 1.852 | 61.733 |
| TC2 | 0.777 | 0.604 | |||||
| TC3 | 0.781 | 0.609 | |||||
| PR | 0.721 | 0 | PR1 | 0.864 | 0.747 | 2.221 | 74.027 |
| PR2 | 0.863 | 0.744 | |||||
| PR3 | 0.854 | 0.729 | |||||
| PVAL | 0.686 | 0 | PVAL1 | 0.797 | 0.636 | 1.976 | 65.862 |
| PVAL2 | 0.811 | 0.658 | |||||
| PVAL3 | 0.826 | 0.682 | |||||
| PI | 0.731 | 0 | PI1 | 0.883 | 0.780 | 2.316 | 77.195 |
| PI2 | 0.886 | 0.785 | |||||
| PI3 | 0.867 | 0.751 |
| Common Indices | χ2 | df | χ2/df | GFI | AGFI | CFI | NFI | RMSEA | SRMR |
|---|---|---|---|---|---|---|---|---|---|
| Judgement criteria | <3 | >0.9 | >0.9 | >0.9 | >0.9 | <0.08 | <0.08 | ||
| Value | 755.646 | 440 | 1.717 | 0.941 | 0.924 | 0.972 | 0.935 | 0.031 | 0.032 |
| Item | Factor Loading | SMC | t | S.E. | Sig. | CR | AVE |
|---|---|---|---|---|---|---|---|
| SN1 | 0.818 | 0.668 | 25.363 | 0.020 | 0.001 | 0.836 | 0.629 |
| SN2 | 0.784 | 0.615 | 23.909 | 0.018 | 0.001 | ||
| SN3 | 0.777 | 0.603 | 23.603 | 0.021 | 0.001 | ||
| PP1 | 0.848 | 0.719 | 27.276 | 0.015 | 0.001 | 0.816 | 0.598 |
| PP2 | 0.730 | 0.533 | 22.048 | 0.020 | 0.001 | ||
| PP3 | 0.737 | 0.543 | 22.340 | 0.023 | 0.001 | ||
| PQ1 | 0.627 | 0.393 | 17.849 | 0.027 | 0.001 | 0.721 | 0.464 |
| PQ2 | 0.686 | 0.470 | 19.939 | 0.022 | 0.002 | ||
| PQ3 | 0.726 | 0.527 | 21.411 | 0.023 | 0.001 | ||
| BI1 | 0.705 | 0.497 | 19.445 | 0.024 | 0.001 | 0.715 | 0.558 |
| BI2 | 0.786 | 0.617 | 21.754 | 0.026 | 0.001 | ||
| PVAR1 | 0.691 | 0.477 | 19.998 | 0.026 | 0.002 | 0.797 | 0.497 |
| PVAR2 | 0.676 | 0.457 | 19.457 | 0.027 | 0.002 | ||
| PVAR3 | 0.667 | 0.445 | 19.120 | 0.030 | 0.001 | ||
| PVAR4 | 0.780 | 0.609 | 23.585 | 0.022 | 0.002 | ||
| DC1 | 0.597 | 0.368 | 15.538 | 0.035 | 0.001 | 0.662 | 0.395 |
| DC2 | 0.661 | 0.437 | 17.431 | 0.032 | 0.001 | ||
| DC3 | 0.626 | 0.392 | 16.400 | 0.033 | 0.001 | ||
| AC1 | 0.679 | 0.462 | 18.687 | 0.026 | 0.001 | 0.737 | 0.484 |
| AC2 | 0.673 | 0.454 | 18.488 | 0.026 | 0.001 | ||
| AC3 | 0.733 | 0.537 | 20.500 | 0.026 | 0.001 | ||
| TC1 | 0.684 | 0.468 | 18.434 | 0.031 | 0.001 | 0.690 | 0.427 |
| TC2 | 0.627 | 0.393 | 16.641 | 0.033 | 0.001 | ||
| TC3 | 0.647 | 0.419 | 17.264 | 0.031 | 0.001 | ||
| PR1 | 0.772 | 0.595 | 22.839 | 0.021 | 0.001 | 0.824 | 0.610 |
| PR2 | 0.808 | 0.652 | 24.241 | 0.019 | 0.001 | ||
| PR3 | 0.763 | 0.582 | 22.509 | 0.021 | 0.001 | ||
| PVAL1 | 0.669 | 0.448 | 19.074 | 0.029 | 0.001 | 0.741 | 0.489 |
| PVAL2 | 0.704 | 0.496 | 20.362 | 0.028 | 0.001 | ||
| PVAL3 | 0.723 | 0.523 | 21.069 | 0.023 | 0.001 | ||
| PI1 | 0.818 | 0.670 | 26.160 | 0.018 | 0.002 | 0.853 | 0.658 |
| PI2 | 0.824 | 0.680 | 26.454 | 0.016 | 0.001 | ||
| PI3 | 0.792 | 0.627 | 24.923 | 0.020 | 0.001 |
| SN | PP | PQ | BI | PVAR | DC | AC | TC | PR | PVAL | PI | |
|---|---|---|---|---|---|---|---|---|---|---|---|
| SN | 0.793 | ||||||||||
| PP | 0.625 | 0.773 | |||||||||
| PQ | 0.571 | 0.664 | 0.681 | ||||||||
| BI | 0.467 | 0.535 | 0.559 | 0.747 | |||||||
| PVAR | 0.481 | 0.601 | 0.594 | 0.439 | 0.705 | ||||||
| DC | 0.393 | 0.396 | 0.519 | 0.450 | 0.444 | 0.628 | |||||
| AC | 0.429 | 0.453 | 0.515 | 0.493 | 0.437 | 0.461 | 0.696 | ||||
| TC | 0.360 | 0.432 | 0.447 | 0.375 | 0.572 | 0.410 | 0.459 | 0.653 | |||
| PR | −0.398 | −0.447 | −0.495 | −0.363 | −0.322 | −0.310 | −0.392 | −0.305 | 0.781 | ||
| PVAL | 0.538 | 0.570 | 0.635 | 0.513 | 0.535 | 0.536 | 0.495 | 0.445 | −0.437 | 0.699 | |
| PI | 0.630 | 0.734 | 0.640 | 0.508 | 0.608 | 0.482 | 0.479 | 0.501 | −0.503 | 0.662 | 0.811 |
| Common Indices | χ2 | df | χ2/df | GFI | AGFI | CFI | NFI | RMSEA | SRMR |
|---|---|---|---|---|---|---|---|---|---|
| Judgement criteria | <3 | >0.9 | >0.9 | >0.9 | >0.9 | <0.08 | <0.08 | ||
| Value | 69.560 | 24 | 2.898 | 0.979 | 0.960 | 0.971 | 0.957 | 0.035 | 0.051 |
| Common Indices | χ2 | df | χ2/df | GFI | AGFI | CFI | NFI | RMSEA | SRMR |
|---|---|---|---|---|---|---|---|---|---|
| Judgement criteria | <3 | >0.9 | >0.9 | >0.9 | >0.9 | <0.08 | <0.08 | ||
| Value | 938.453 | 462 | 2.031 | 0.924 | 0.908 | 0.957 | 0.919 | 0.038 | 0.037 |
| DV | IV | Direct Effect | Indirect Effect | Total Effect | |||
|---|---|---|---|---|---|---|---|
| β | B-C Sig. | β | B-C Sig. | β | B-C Sig. | ||
| BI | PR | 0.167 | 0.246 | - | - | 0.167 | 0.246 |
| CON | −0.327 | 0.263 | - | - | −0.327 | 0.263 | |
| PVAR | 0.406 | 0.038 | - | - | 0.406 | 0.038 | |
| PQ | −0.636 | 0.103 | - | - | −0.636 | 0.103 | |
| PP | −0.193 | 0.316 | - | - | −0.193 | 0.316 | |
| SN | 0.001 | 0.892 | - | - | 0.001 | 0.892 | |
| BI | PVAL | −0.119 | 0.329 | −0.003 | 0.584 | −0.122 | 0.285 |
| CON | 0.571 | 0.010 | 0.005 | 0.530 | 0.576 | 0.011 | |
| PVAR | −0.090 | 0.547 | −0.006 | 0.725 | −0.096 | 0.477 | |
| PQ | 0.109 | 0.616 | 0.010 | 0.771 | 0.119 | 0.644 | |
| PP | 0.416 | 0.016 | 0.003 | 0.492 | 0.419 | 0.014 | |
| SN | 0.121 | 0.087 | 0.000 | 0.876 | 0.121 | 0.087 | |
| PR | −0.016 | 0.773 | - | - | −0.016 | 0.773 | |
| BI | PI | - | - | −0.119 | 0.228 | −0.119 | 0.228 |
| CON | - | - | 0.534 | 0.008 | 0.534 | 0.008 | |
| PVAR | - | - | −0.111 | 0.331 | −0.111 | 0.331 | |
| PQ | - | - | 0.146 | 0.487 | 0.146 | 0.487 | |
| PP | - | - | 0.386 | 0.016 | 0.386 | 0.016 | |
| SN | - | - | 0.108 | 0.088 | 0.108 | 0.088 | |
| PR | −0.063 | −0.308 | −0.014 | 0.771 | −0.077 | 0.199 | |
| PVAL | 0.891 | 0.001 | - | - | 0.891 | 0.001 | |
Publisher’s Note: MDPI stays neutral with regard to jurisdictional claims in published maps and institutional affiliations. |
© 2022 by the authors. Licensee MDPI, Basel, Switzerland. This article is an open access article distributed under the terms and conditions of the Creative Commons Attribution (CC BY) license (https://creativecommons.org/licenses/by/4.0/).
Share and Cite
Yang, C.; Chen, X.; Sun, J.; Wei, W.; Miao, W.; Gu, C. Could Surplus Food in Blind Box Form Increase Consumers’ Purchase Intention? Agriculture 2022, 12, 864. https://doi.org/10.3390/agriculture12060864
Yang C, Chen X, Sun J, Wei W, Miao W, Gu C. Could Surplus Food in Blind Box Form Increase Consumers’ Purchase Intention? Agriculture. 2022; 12(6):864. https://doi.org/10.3390/agriculture12060864
Chicago/Turabian StyleYang, Chun, Xuqi Chen, Jie Sun, Wei Wei, Wei Miao, and Chao Gu. 2022. "Could Surplus Food in Blind Box Form Increase Consumers’ Purchase Intention?" Agriculture 12, no. 6: 864. https://doi.org/10.3390/agriculture12060864
APA StyleYang, C., Chen, X., Sun, J., Wei, W., Miao, W., & Gu, C. (2022). Could Surplus Food in Blind Box Form Increase Consumers’ Purchase Intention? Agriculture, 12(6), 864. https://doi.org/10.3390/agriculture12060864