Article

Modulation of Growth Duration, Grain Yield and Nitrogen Recovery Efficiency by EMS Mutagenesis under OsNRT2.3b Overexpression Background in Rice

1
School of Agriculture, Shenzhen Campus of Sun Yat-sen University, Shenzhen 518107, China
2
State Key Laboratory of Crop Genetics and Germplasm Enhancement, MOA Key Laboratory of Plant Nutrition and Fertilization in Low-Middle Reaches of the Yangtze River, College of Resources and Environmental Sciences, Nanjing Agricultural University, Nanjing 210095, China
*
Authors to whom correspondence should be addressed.
Agriculture 2022, 12(6), 799; https://doi.org/10.3390/agriculture12060799
Submission received: 15 April 2022 / Revised: 26 May 2022 / Accepted: 27 May 2022 / Published: 31 May 2022
(This article belongs to the Special Issue Genetics, Genomics and Breeding of Rice)

Abstract

:
Growth duration is an important agronomic trait that determines the season and area of crop growth. Previous experiments showed that overexpression of nitrate transporter OsNRT2.3b significantly increased rice yield, nitrogen use efficiency, and growth duration. Through screening, we obtained four ethyl methanesulfonate (EMS)-mutagenized mutants with shorter growth duration compared with O8 of OsNRT2.3b overexpression line. The nitrogen translocation efficiency and physiological nitrogen use efficiency of the mutants were not significantly different from O8, which were increased by 24.4% and 14.2%, respectively compared with WT, but the growth duration of the mutant was significantly lower than O8. Analysis of O8 and mutants showed that the growth duration positively correlated with grain weight per panicle, grain yield, and nitrogen recovery efficiency. In conclusion, our results provide a new idea for balancing rice yield and growth duration.

1. Introduction

With the increase in population and decrease in arable land, rice yield increase is mainly achieved by enhancing the yield per unit area. There are many factors affecting yield, including grain weight per panicle and growth duration [1,2,3,4]. Growth duration is an important factor that determines the season and area of crop growth [5].
Molecular genetic studies have identified many genes that regulate heading and flowering. Under long-day conditions (LDs), the clock gene GI (GIGANTEA) influences the flowering of Arabidopsis thaliana by regulating the expression of FT (FLOWERING LOCUS T) [6]. The GI (GIGANTEAI)–Hd1 (Heading date 1)–Hd3a (Heading date 3a) pathway is also found in rice [7,8,9]. The Hd1 promotes flowering in short-day conditions (SDs) and inhibits flowering in LDs by regulating Hd3a expression [10]. DTH2 promotes flowering by regulating the expression of Hd3a and RFT1 under LDs [11]. The rice early heading gene Ehd1 encodes a rice-specific B-type responsive protein, which promotes flowering under both LDs and SDs by positively regulating the expression of Hd3a and RFT1 (RICE FLOWERING LOCUS T 1) [8,12].
Excessive or insufficient supply of mineral elements can change the flowering time of plants [13,14]. Pharbitis nil, a SDs plant grown under LDs with restricted nutrient supplies enticed flowering and was inversely regulated under excessive nutrients [15]. The flowering time of Landsberg erecta in 1% and 5% of Hoagland solution was significantly earlier than the time in the 25% concentration [16]. The flowering of Arabidopsis thaliana was accelerated by reducing the availability of mineral nutrients in soil [17]. Nitrogen (N) fertilization can also delay flowering, and thus, prolong the maturation times of crops [18,19,20]. Under the limited supply of nitrate, the flowering of Arabidopsis was significantly promoted by LDs or SDs, which is a method independent of vernalization [21]. Wang et al. [22] showed that rice nitrate transporter gene OsNRT1.1A can affect both N use and flowering time. Sanagi et al. [23] found that low N supply changed the phosphorylation state of FLOWERING BHLH 4 and accelerated the flowering of Arabidopsis.
The growth duration affects the yield of cereal crops. The short growth duration could lead to an insufficient accumulation of plant nutrient, and the long growth duration could lead to an insufficient accumulation of grain filling [24]. OsNRT2.3b is a high affinity nitrate transporter located on the plasma membrane [25]. Overexpression of OsNRT2.3b could enhance the pH-buffering capacity of rice, and increase the uptake of 15NH4+ and 15NO3, in the meantime, it significantly increases the grain yield and nitrogen use efficiency (NUE) of rice [25,26]. We carried out a forward genetic screening on an EMS-mutagenized population in O8 of OsNRT2.3b overexpression line. Through screening, compared with O8, we obtained four mutants with earlier heading time and shorter growth duration. The four mutants, with the same background as O8, are ideal materials for analyzing the relationship between growth duration and rice yield. Furthermore, we analyzed the effects of delayed growth duration of OsNRT2.3b overexpression lines on grain yield and NUE. This provided us with a new idea for balancing rice yield and growth duration.

2. Materials and Methods

2.1. Plant Materials and Growth Conditions

The generation and basic molecular properties of OsNRT2.3b overexpression line (O8) were previously described by Fan et al. [25] and Feng et al. [26]. O8 was treated with 1% EMS solution to obtain an EMS mutant population.
From May to October, the rice plants were grown in the experimental field of Nanjing Agricultural University in Nanjing, Jiangsu under natural long-day conditions (118°49′ E-30°10′ N, photoperiod of 13.5 h in the daytime and 10.5 h night in summer). The soil nutrient status was: Total N content, 0.91 g/kg; exchangeable K, 0.19 g/kg; available P content, 0.018 g/kg; organic matter, 11.56 g/kg; and pH 6.5. The N 40%, 30%, and 40% as fertilizer (urea) were applied before transplant, tillering, and the heading stage, respectively. The total N application was 180 kg/ha.
The surface of rice seeds was sterilized with 10% (v:v) H2O2 for 30 min, washed, then soaked in water for 3 days, sown evenly in wet soil for 3 weeks and the seedlings were transplanted to field plots. Each line was planted in the same size with three repetitive plots. The seedlings were planted in an array of 10 × 10 on a plot of 2 × 2 m. The plants on the outer edge of the plot were removed and samples were obtained. Four points were selected randomly in the remaining 8 × 8 rice centers, each containing four rice seedlings [27]. At the same time, the agronomic traits of rice plants in the three plots were analyzed.
The heading time of rice was recorded when about 50% of the rice panicles were exposed to leaf sheath and some spikes were at flowering. After flowering, rice went through the early filling stage, milking stage, waxy period, and mature period. The growth duration of rice is from seedling emergence to seed maturity. Ten seedlings were randomly selected from three plots for tracking the days to heading time and growth duration.

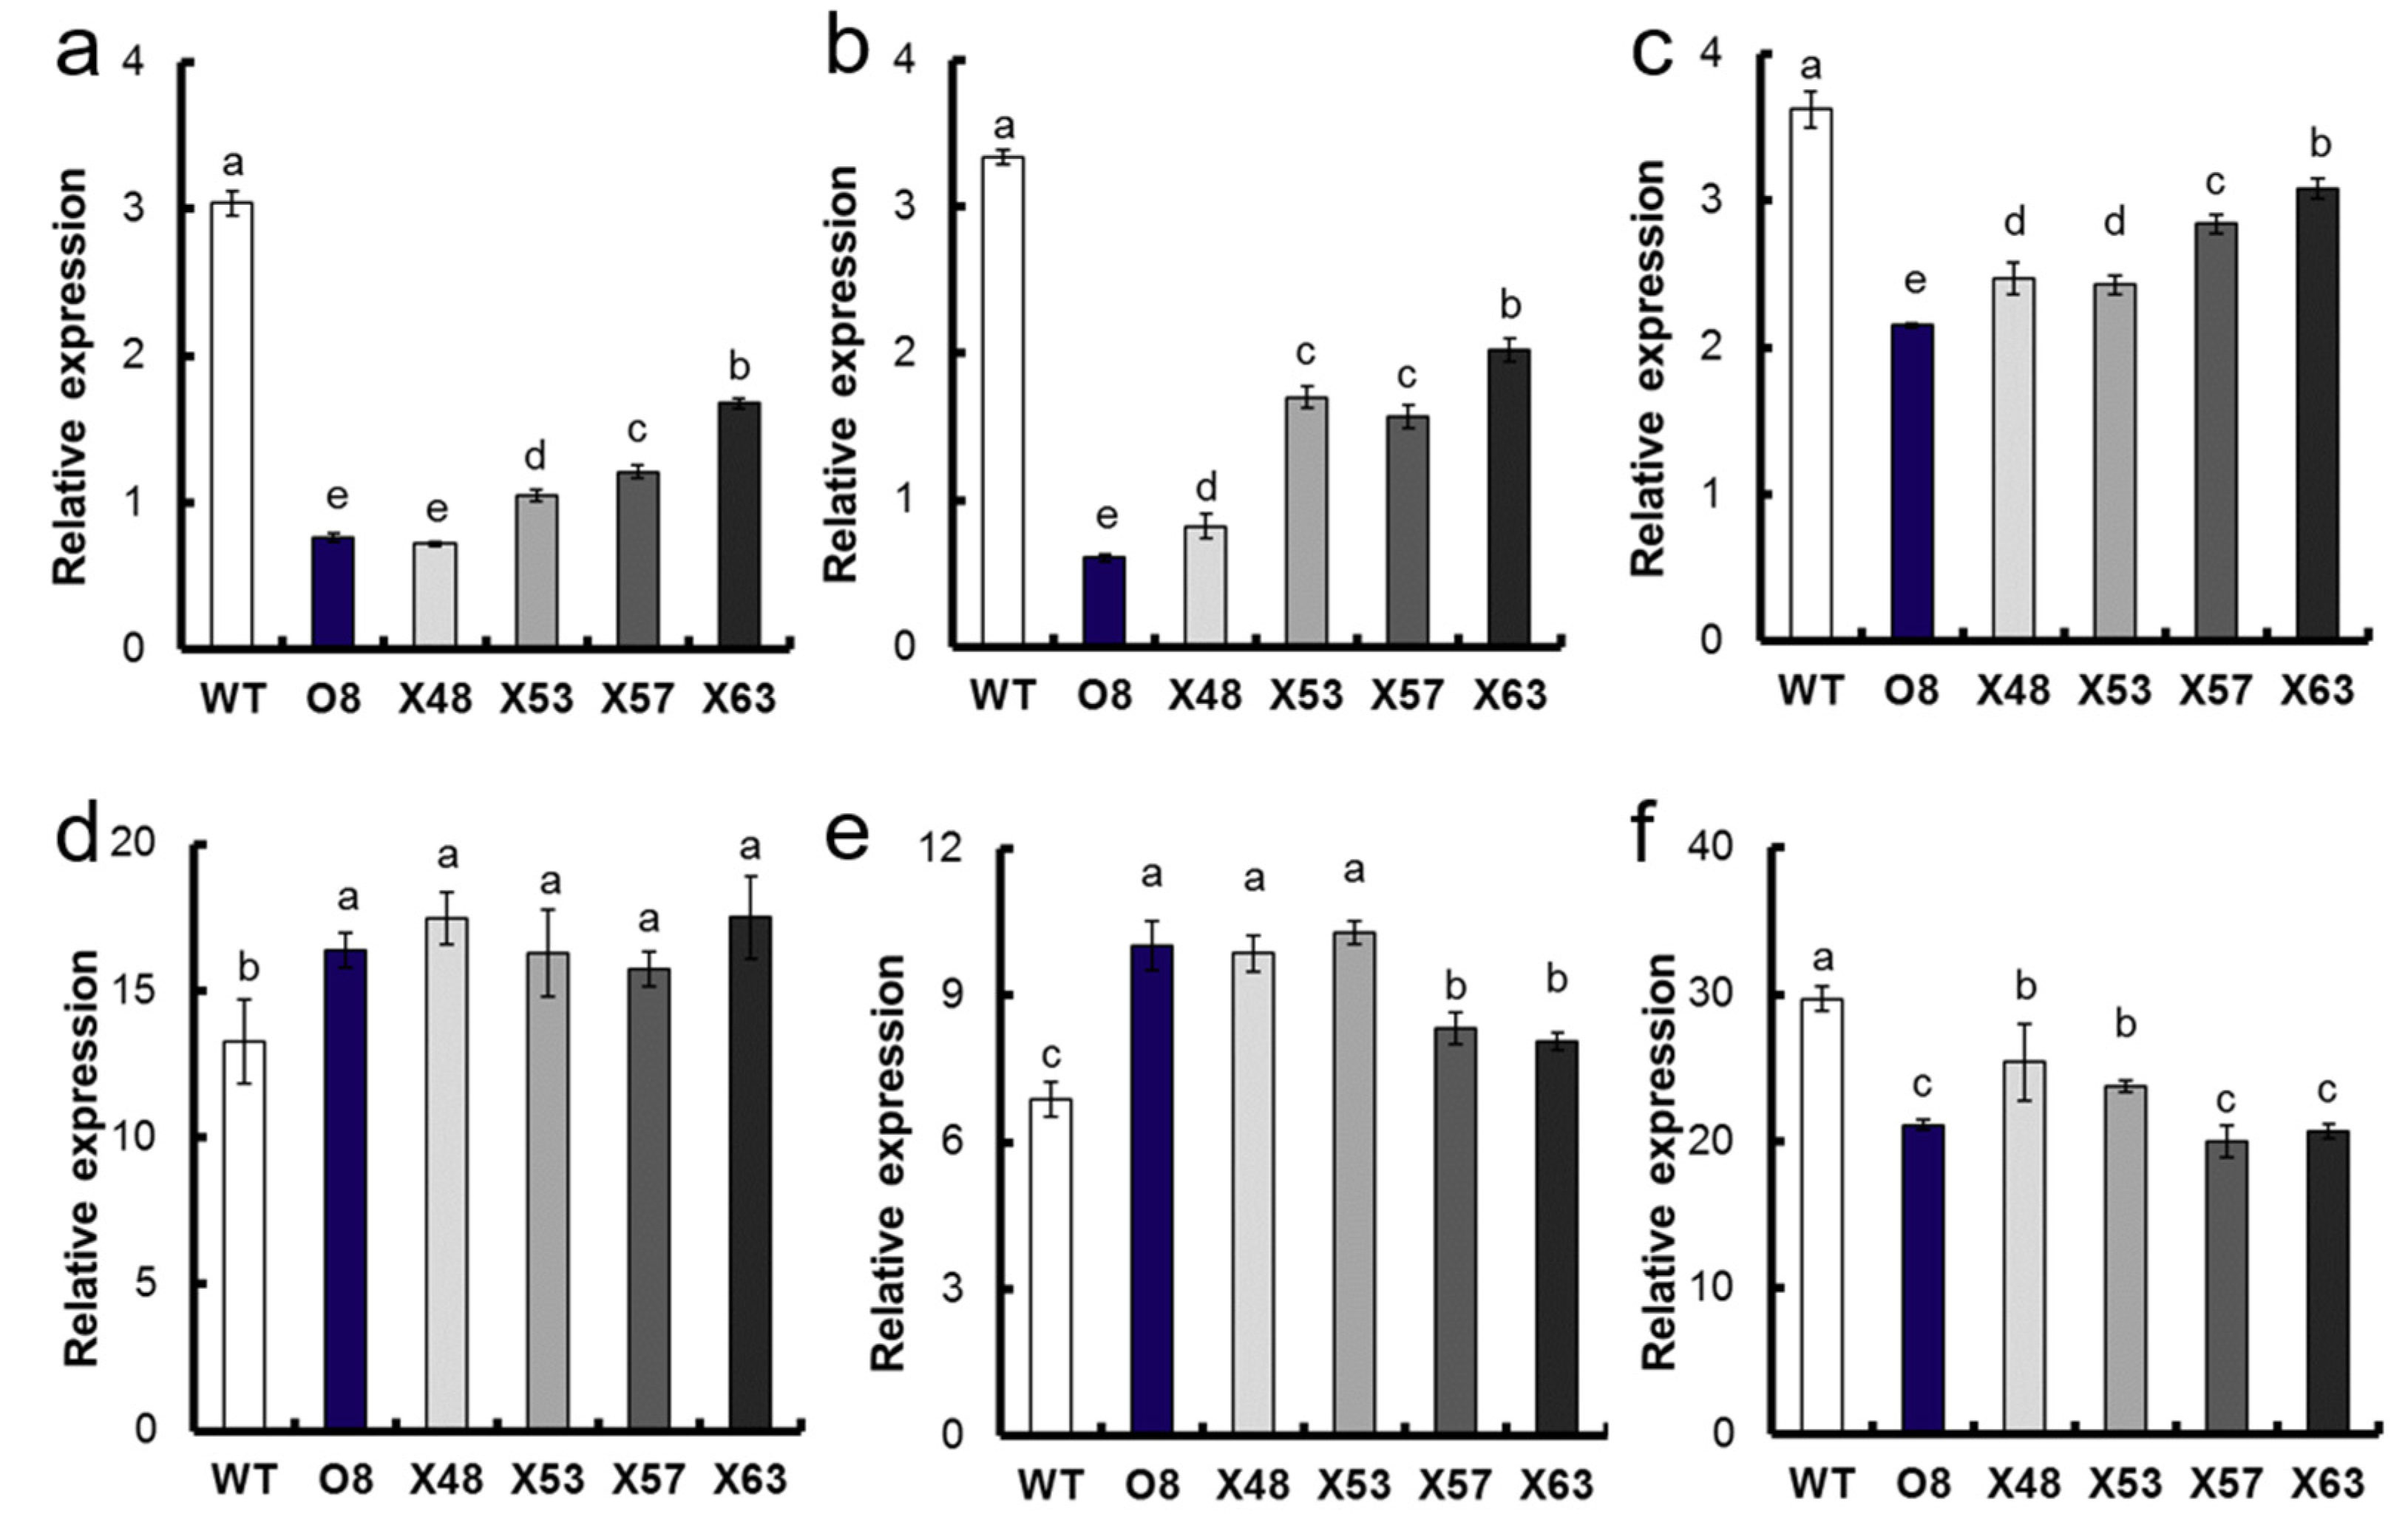
2.2. The qRT-PCR Assay

On the 50th day after transplant, the fresh leaves from wild-type (WT), O8, and mutants were collected and frozen for 10 min in liquid N, then stored at −70 °C in a refrigerator. Three samples were collected from each line for expression analysis. The total RNA was extracted by TRIzol (Vazyme Biotech Co, Ltd., Nanjing, China) and the residual genomic DNA was enzymolized with DNase I. RNA reverse transcription kit (HiScript II, Vazyme) was used to reverse the transcription of total RNA to cDNA for gene expression analysis. Triplicate quantitative assays were performed with 2 × T5 Fast qRT-PCR Mix (SYBRGreenI) kit (TsingKe Co, Ltd., Beijing, China) on the Step One Plus Real-Time PCR Systems (Applied Biosystems, Bio-Rad, Berkeley, CA, USA) [28]. The amplification of tobacco α-tubulin was used as an internal control to normalize all of the data. Relative expression level of each sample was determined by normalizing it to the amount of OsActin1 (LOC_Os03g50885) detected in the same sample and presented as 2△△CT. All of the primers used for qRT-PCR are listed in Table S1.

2.3. Sequence Analysis of OsNRT2.3b and Growth Duration Genes in O8 and EMS Mutants

Seedlings of O8 and EMS mutants were used for DNA extraction by the DNeasy Plant Mini Kit (Qiagen, Hilden, Germany). For each line, a single plant was used and the experiment was conducted in triplicate. The DNA samples of O8 and EMS mutants were used as templates to amplify the full-length genomic sequence of OsNRT2.3b, OsRFT1, OsHd3a, OsEhd1, OsHd1, OsGI, and OsLHY by the KOD-FX polymerase (Toyobo, Osaka, Japan) using specific primers (Table S2). Sequences of OsNRT2.3b, OsRFT1, OsHd3a, OsEhd1, OsHd1, OsGI, and OsLHY from O8 and EMS mutants were aligned and analyzed using MEGA 7.0.

2.4. Determination of Chlorophyll Content (SPAD Value)

The content of chlorophyll (SPAD value) of flag leaf was determined. At the time of determination, the leaf’s middle vein was avoided and the middle part of the blade was selected. Each leaf was measured 10–15 times to remove the maximum error value, and then the average value was obtained. The Nissan SPAD-502 chlorophyll meter was used as the measuring instrument.

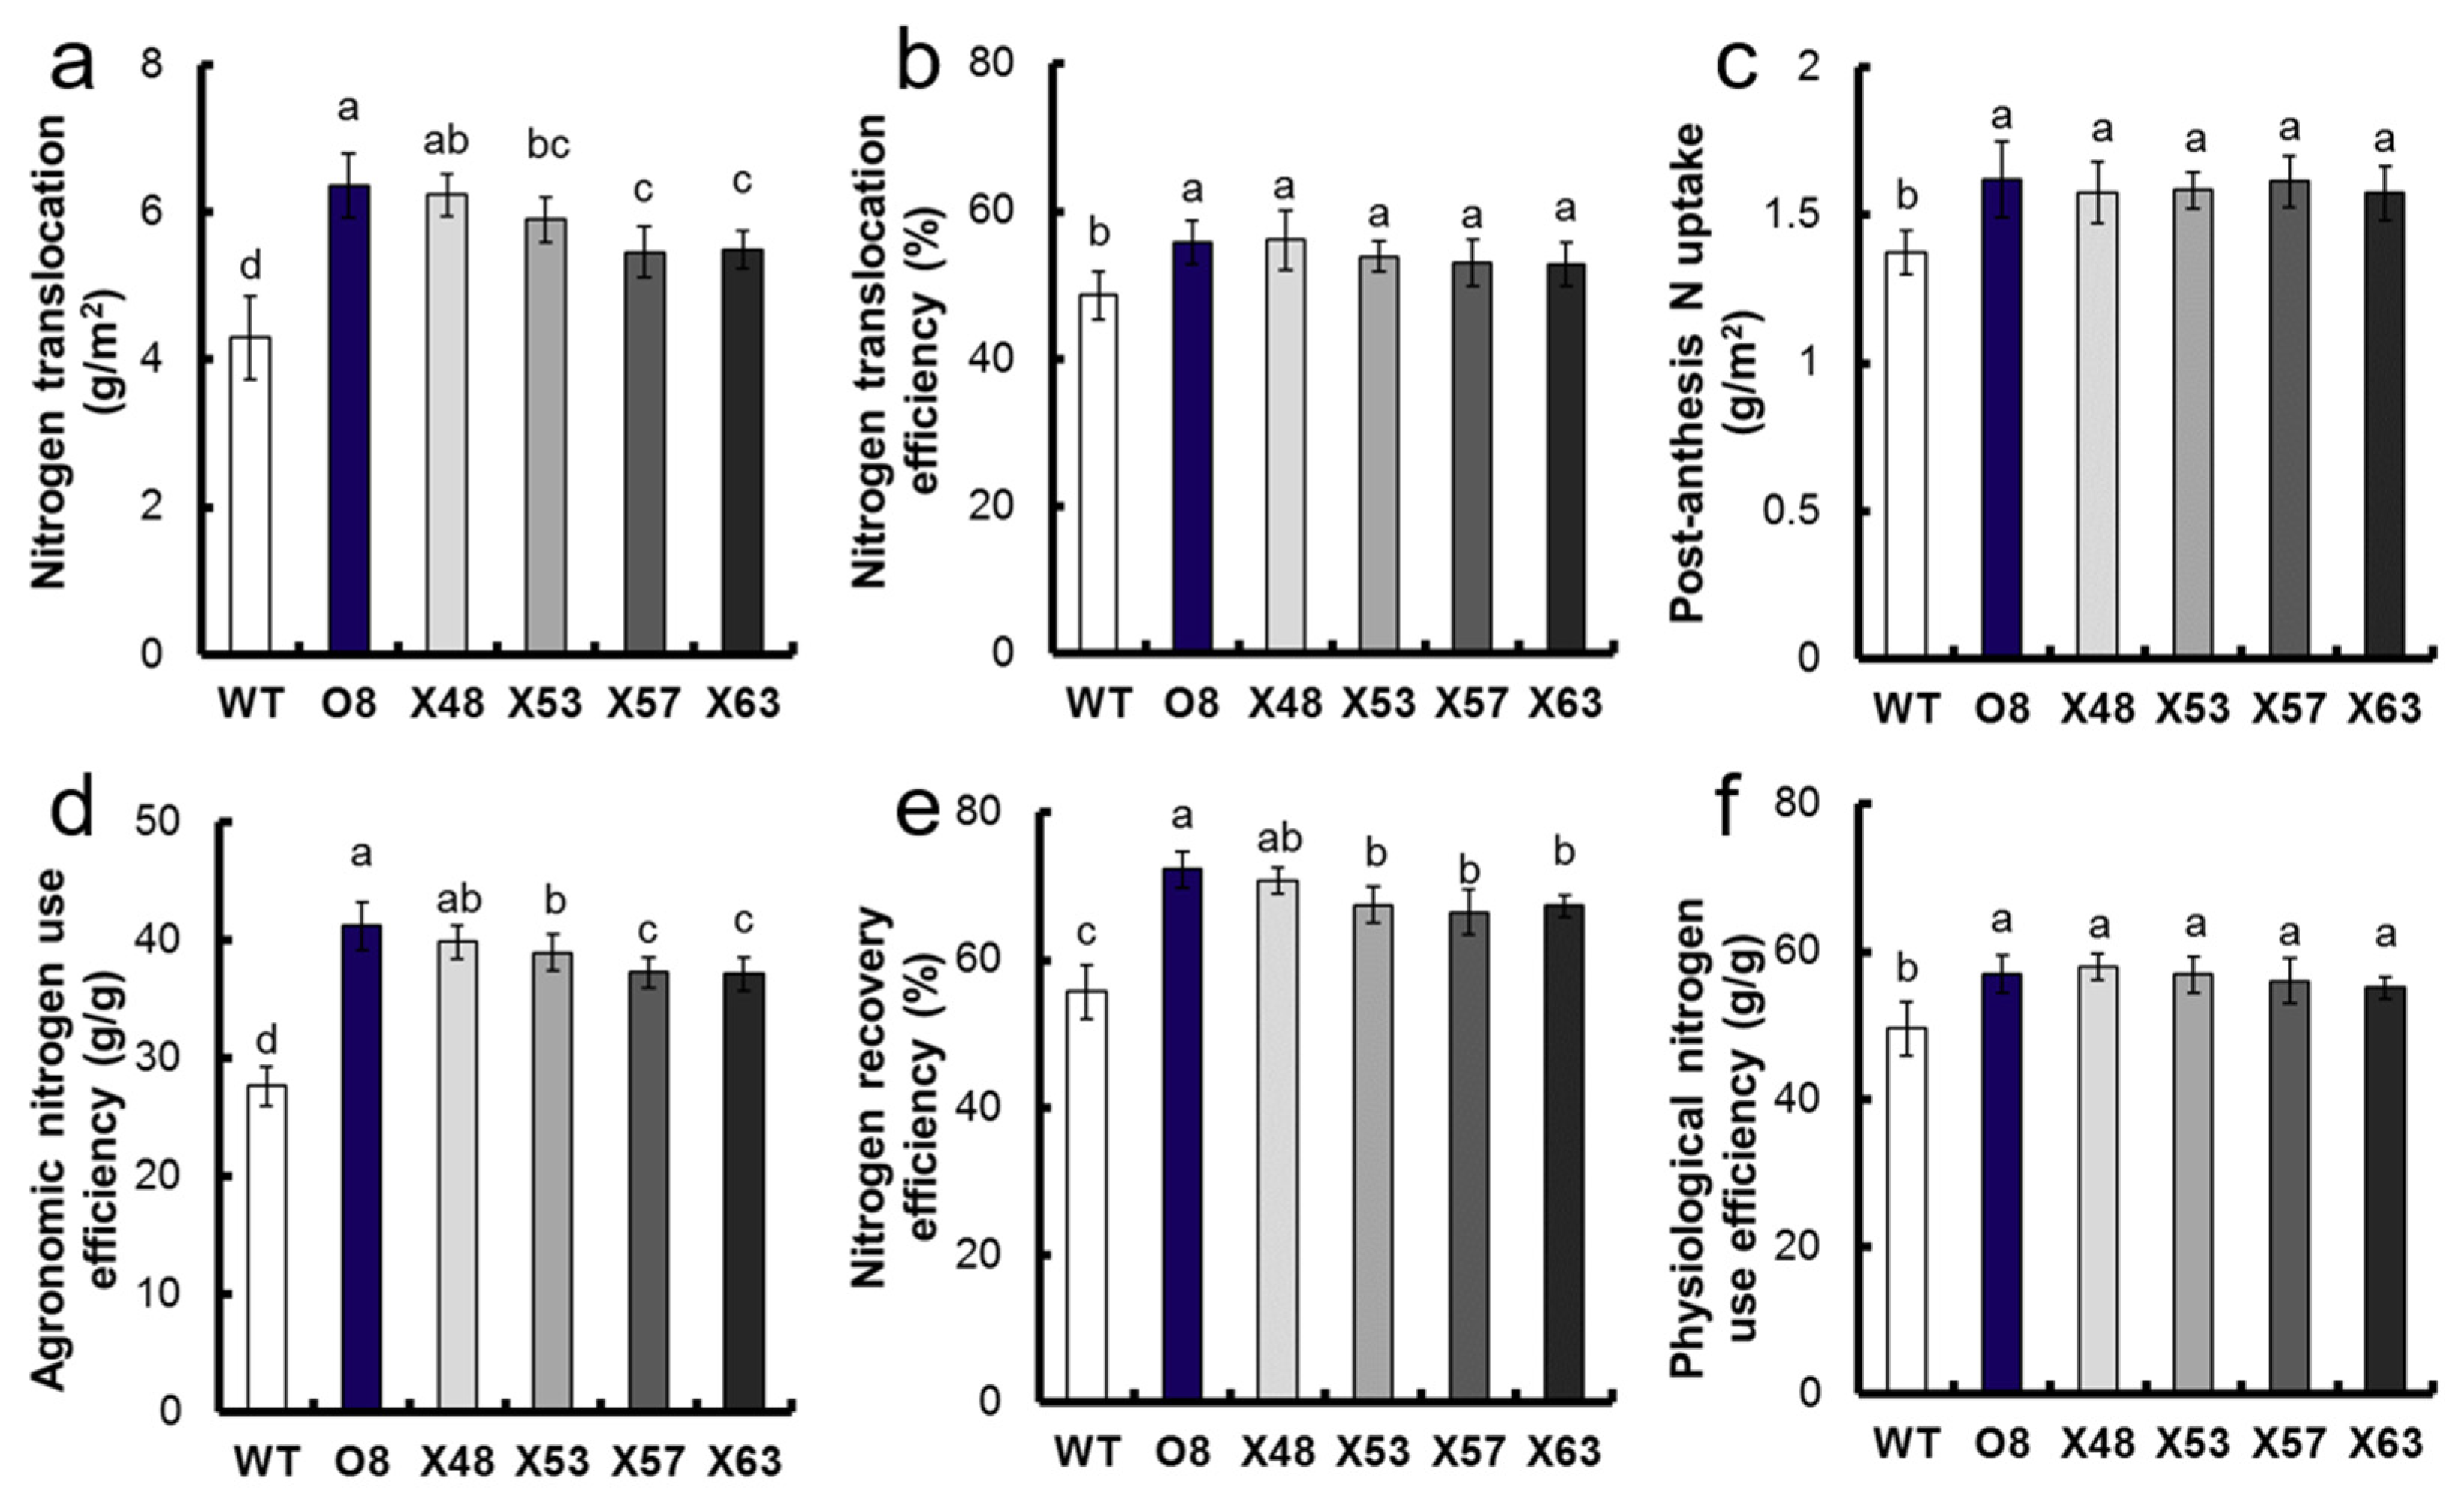
2.5. NUE and N Translocation Efficiency

After harvest, the samples were heated at 105 °C for 30 min, dried at 75 °C for 3 days, and then the dry matter quality was measured. The total N content was measured by Kjeldahl method [29].
The NUE was calculated as described by Chen et al. [29]. We investigated total N accumulation at anthesis (TNAA), grain N accumulation at maturity (GNAM), and total N accumulation at maturity (TNAM). N translocation (NT, g/m2) = TNAA-(TNAM-GNAM); N translocation efficiency (NTE, %) = NT/TNAA × 100%; post-anthesis N uptake, (PANU, kg/ha) = TNAM-TNAA; N recovery efficiency, (NRE, %) = TNAM/N supply; agronomic N use efficiency (ANUE, g/g) = grain yield/N supply; physiological N use efficiency (PNUE, g/g) = grain yield/TNAM.

2.6. Statistical Analysis

Statistical analysis and one-way ANOVA were performed with Excel software (Microsoft Office 2010) and SPSS13.0 software. Significant differences between the WT and OsNRT2.3b overexpressing lines are indicated by different letters (p < 0.05, one-way ANOVA).

3. Results

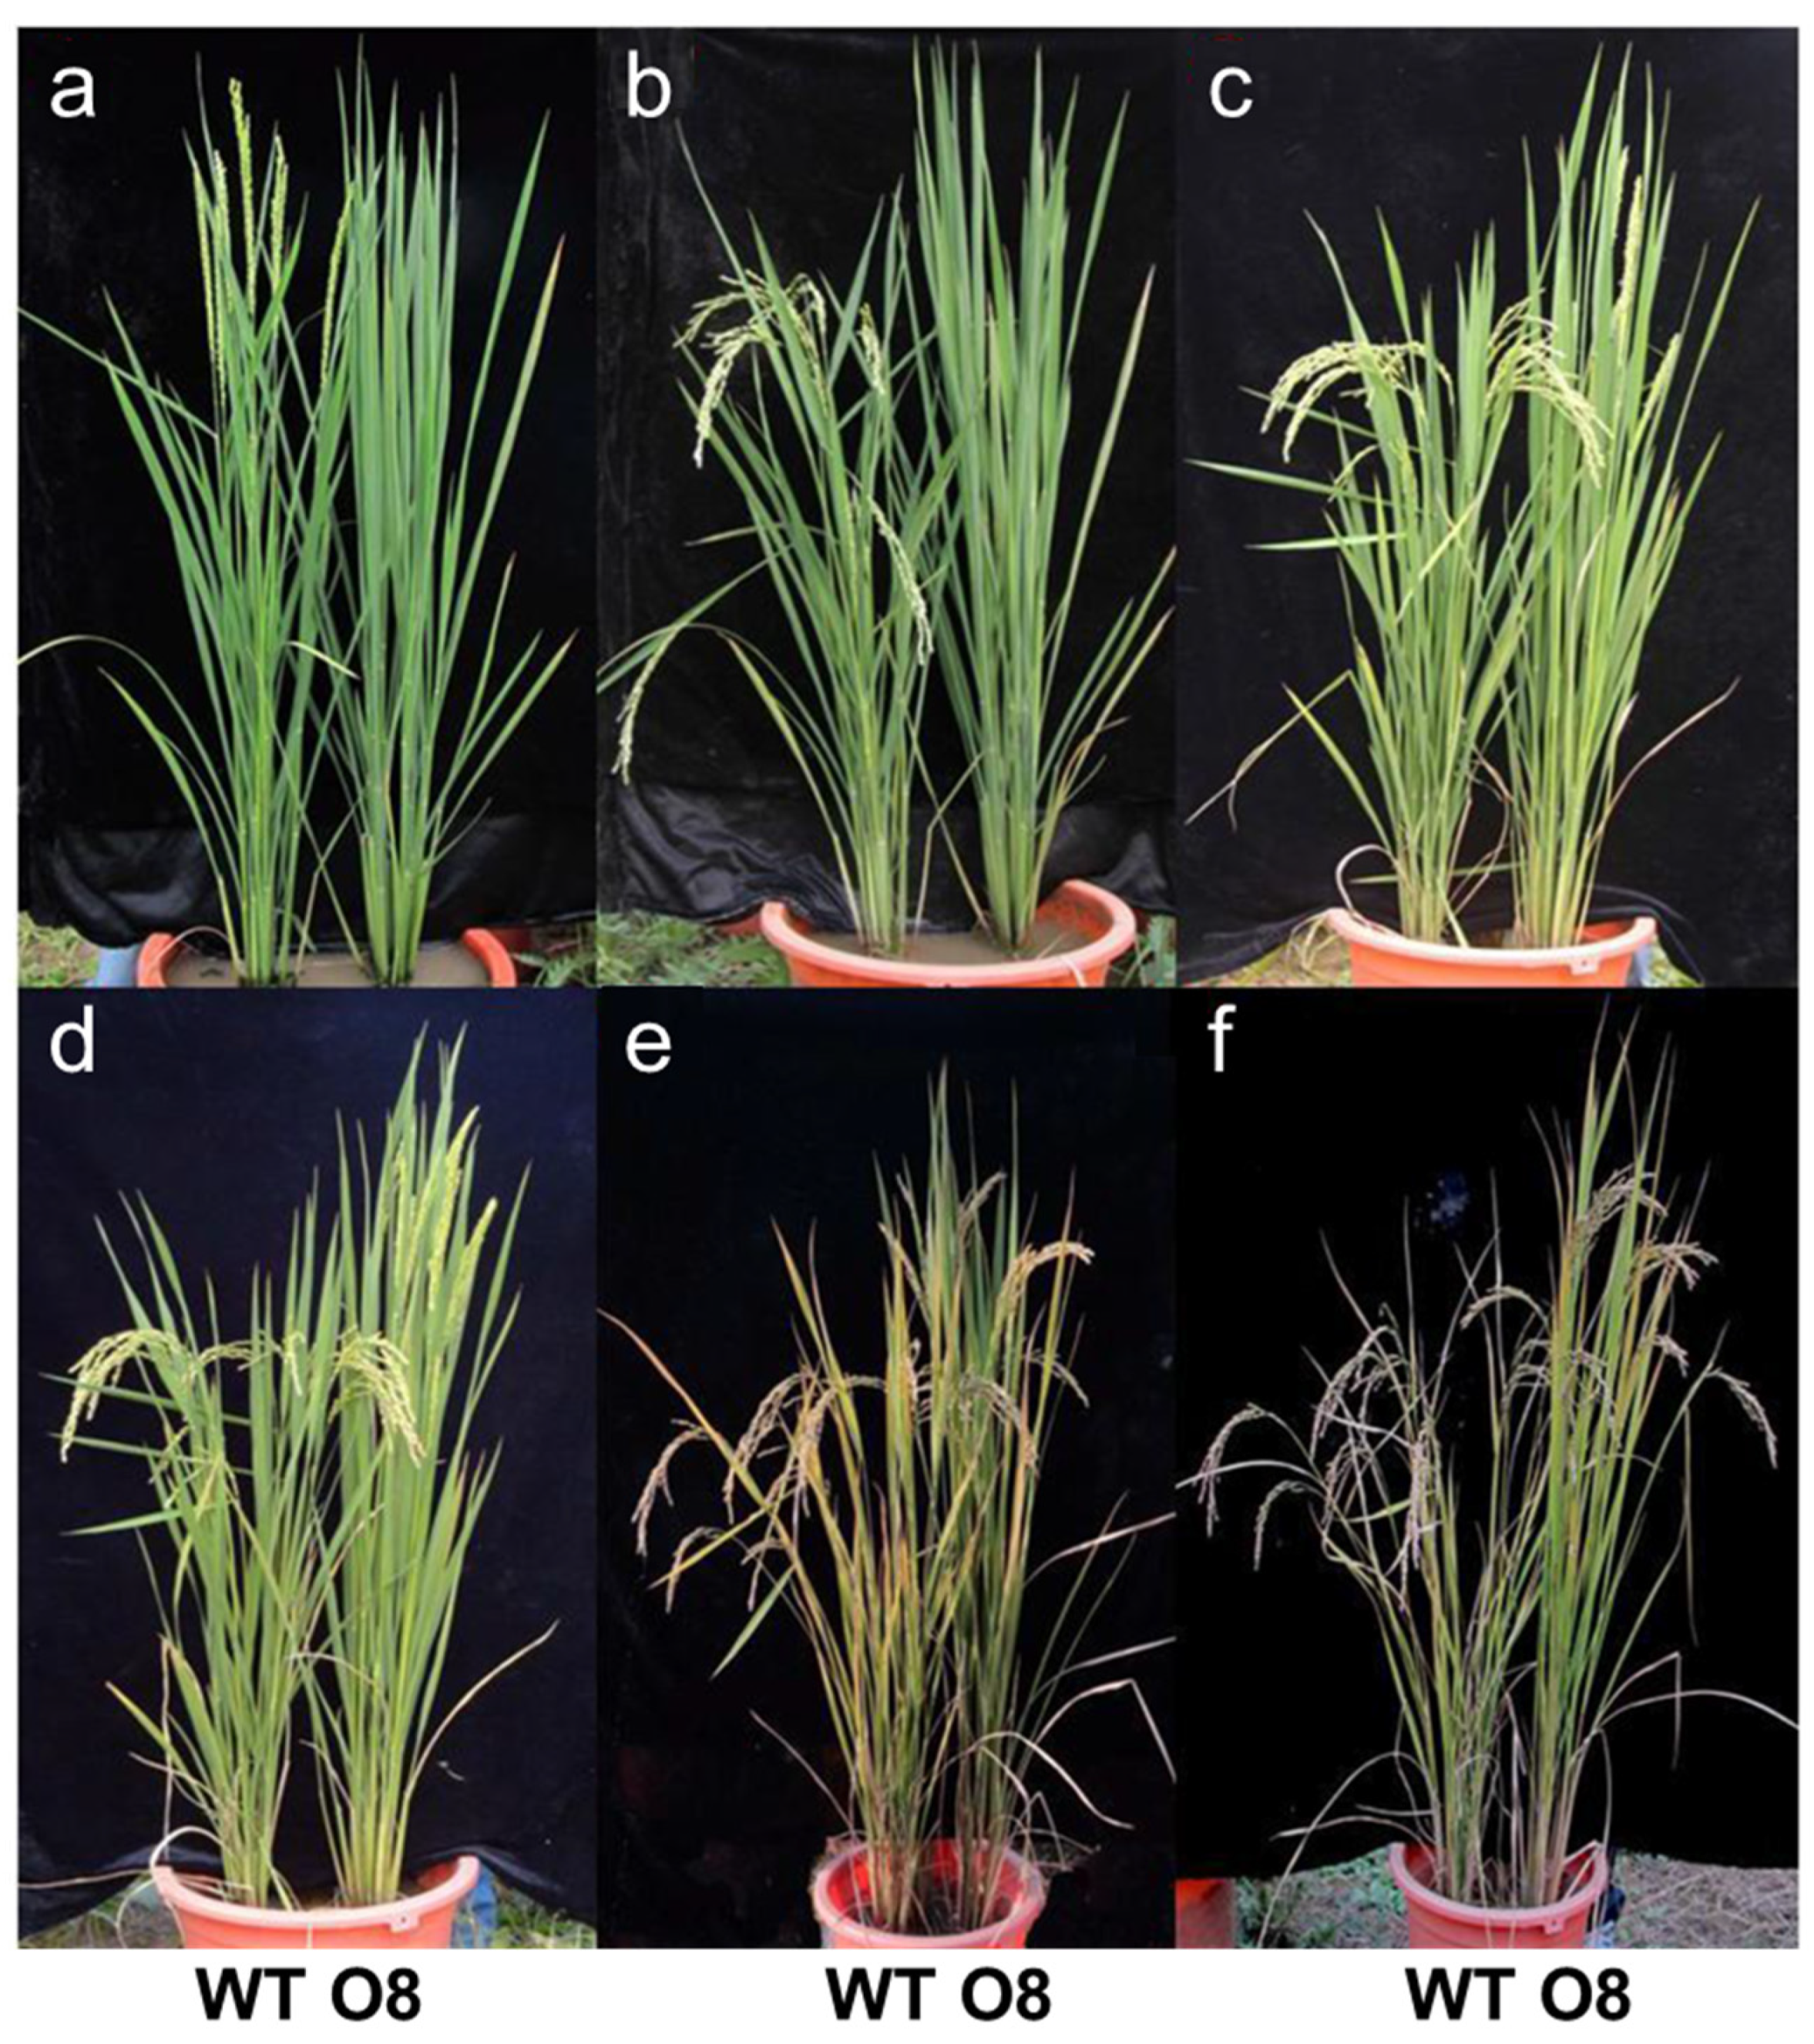
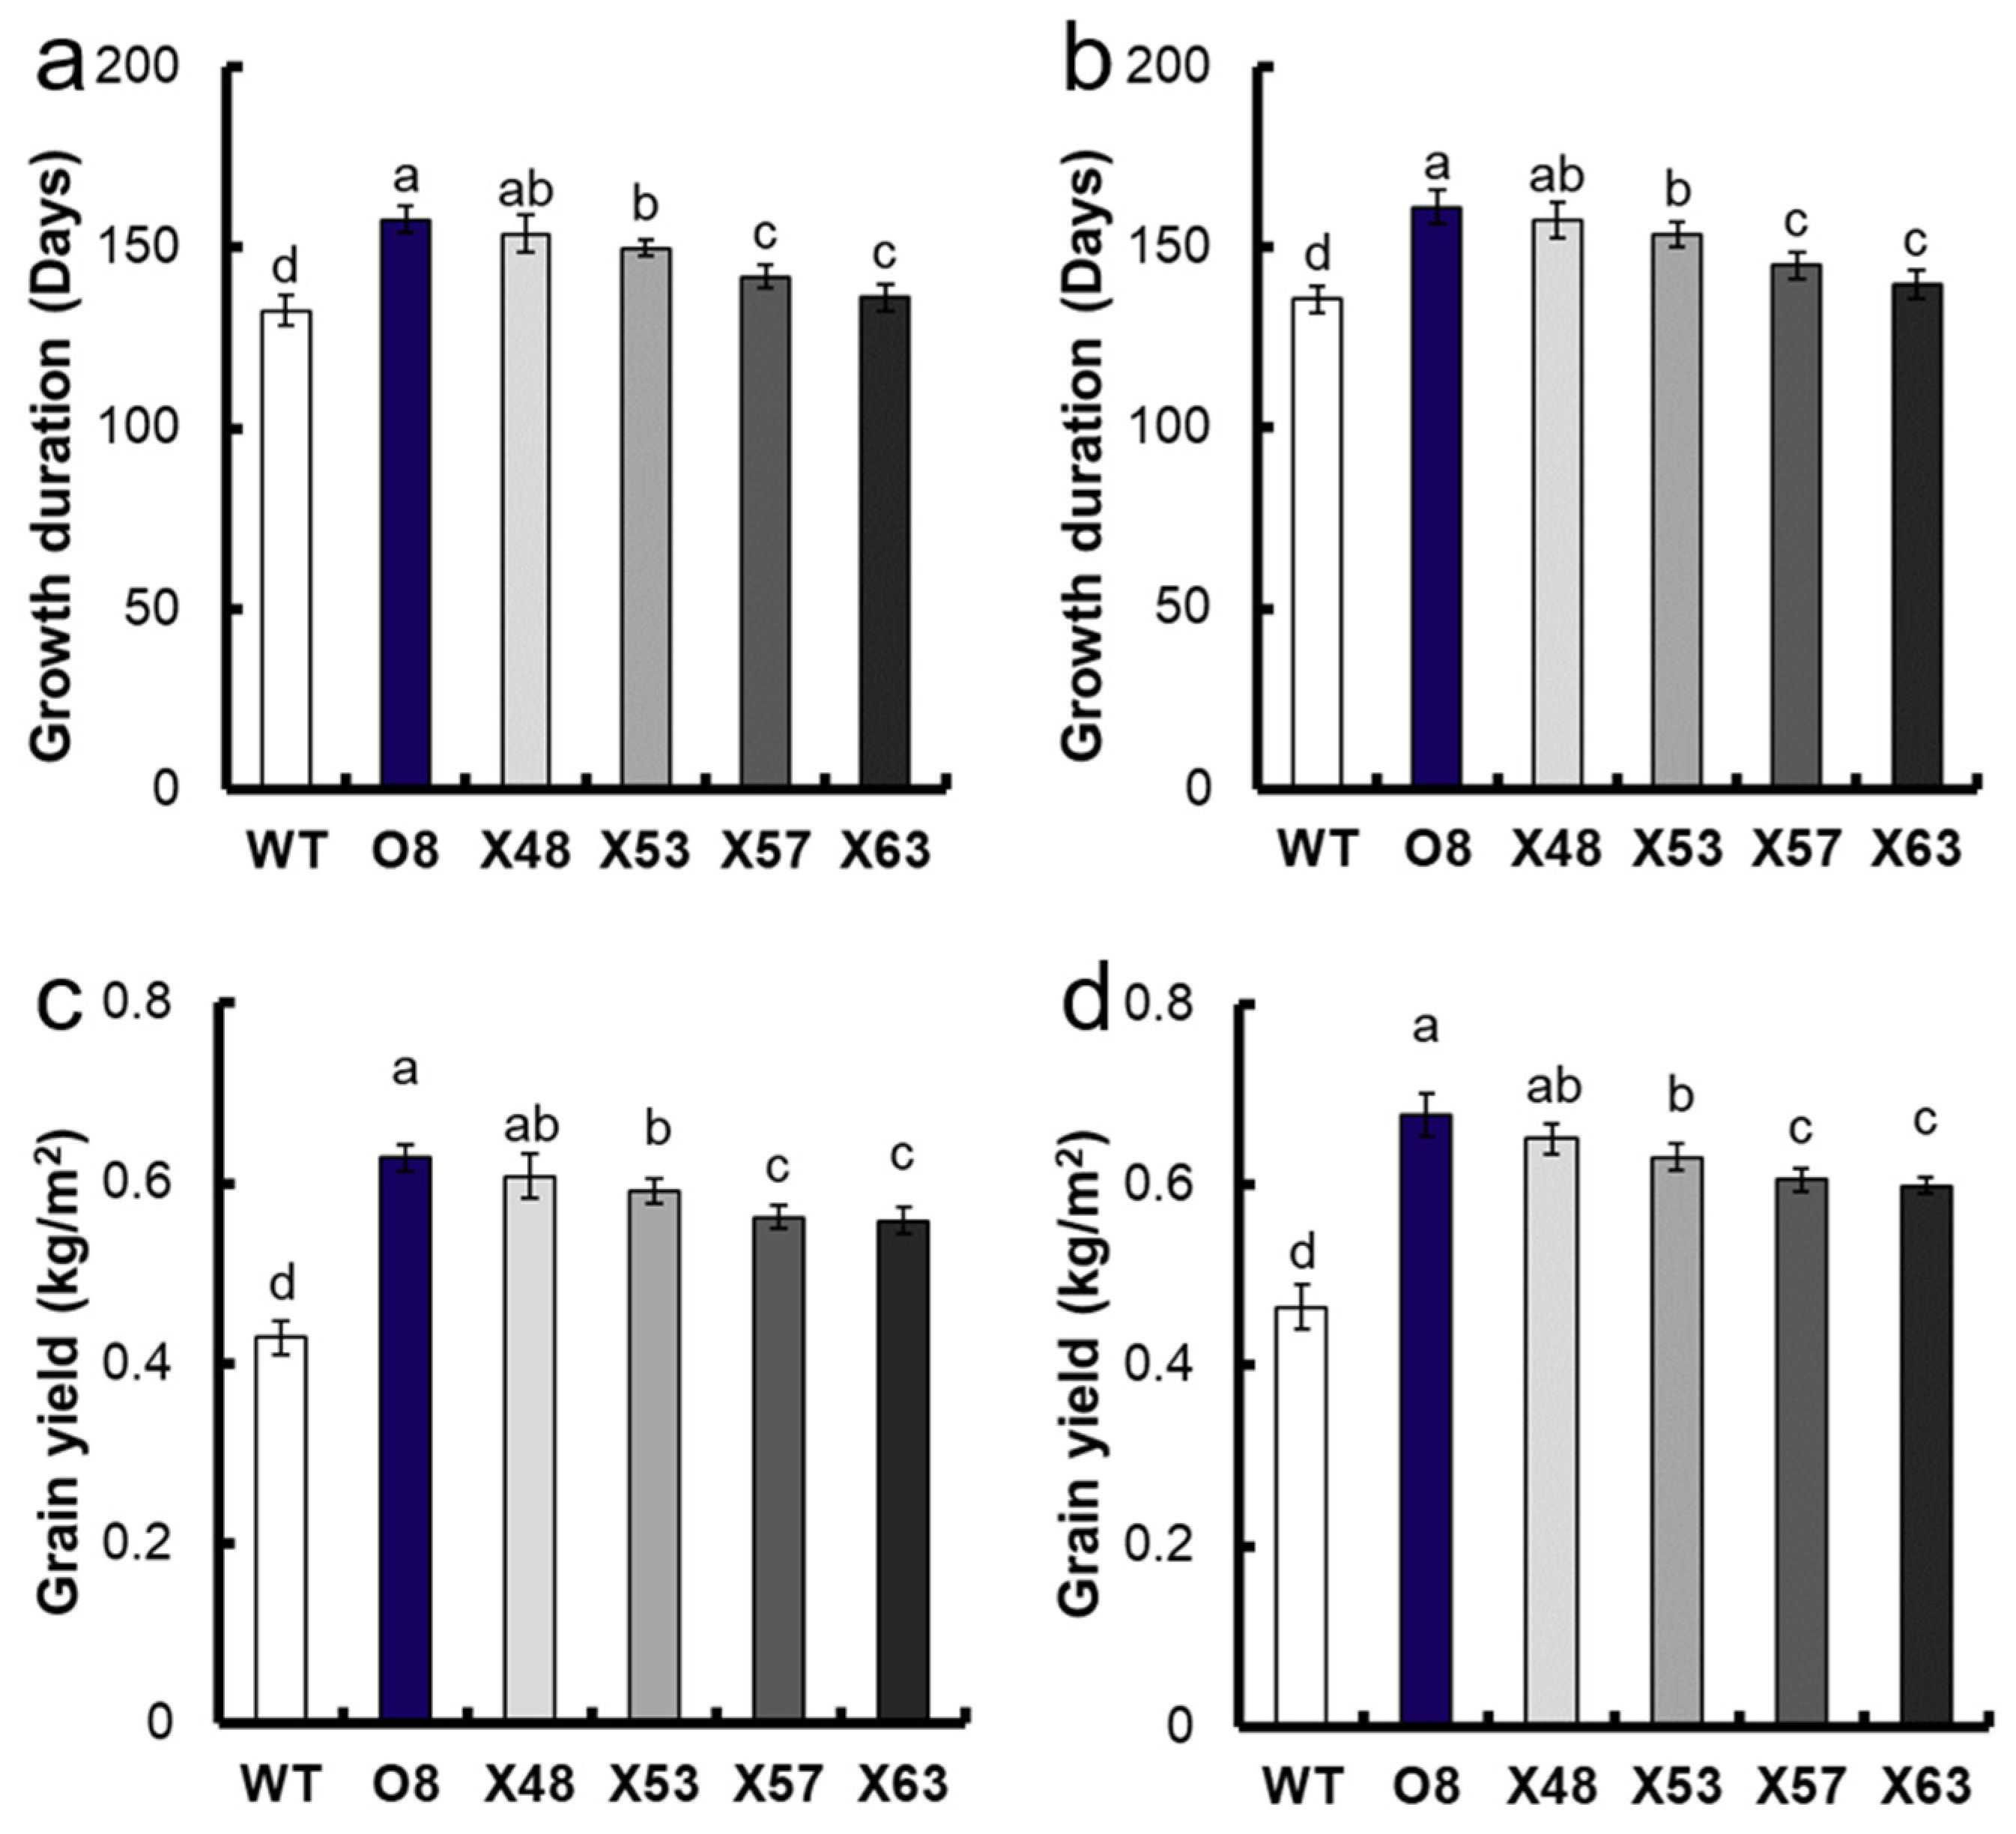
3.1. Analysis of Growth Duration of Mutants

We analyzed the growth period of OsNRT2.3b overexpression line O8, and found that the wild-type (WT) stepped into the heading stage at 76 days after transplant (Figure 1a), whereas the O8 was 98 days (Figure 1d). WT was fully mature after 120 days of transplanting (Figure 1e), while O8 did not mature until 140 days after transplant (Figure 1f).
The OsNRT2.3b overexpression line O8 was treated with 1% EMS solution to obtain EMS mutant population. About 1000 mutants were obtained, and 80 mutants with no change in plant type were selected. Four mutants, X48, X53, X57, and X63 were screened with earlier heading time and shorter growth duration, compared with O8. The four mutants showed shorter lower grain yield and growth duration in M4 and M5 generations, compared with O8 (Figure 2, Figure 3a and Figure S1). We analyzed the phenotype of the mutants in M6 generation in detail. There was no significant difference in the expression of OsNRT2.3b in O8, X48, X53, and X63. Compared with O8, the expression of OsNRT2.3b in X57 was significantly lower, but significantly higher than in WT (Figure 3b). Compared with O8, the heading time of X48, X53, X57, and X63 was reduced by 5, 9, 16, and 19 days, respectively, by 5.1%, 9.1%, 16.2%, and 19.2%, respectively (Figure 3c), and the growth duration was reduced by 2.5%, 4.5%, 9.8%, and 12.9%, respectively (Figure 3d). In the mature period of WT, we measured the chlorophyll content of flag leaves of all plants. Compared with WT, the chlorophyll content of O8, X48, X53, X57, and X63 increased by 30.3%, 23.5%, 17.5%, 14.6%, and 8.7% respectively, indicating that the growth duration of the mutants increased (Figure S2).
We analyzed the expression of related genes of heading and flowering in mutants. Compared with O8, the expression of OsRFT1 in X53, X57, and X63 increased by 37.5%, 59.4%, and 120.7%, respectively (Figure 4a). Compared with O8, the expression of OsHd3a in X48, X53, X57, and X63 increased by 34.8%, 179.1%, 157.0%, and 232.0%, respectively (Figure 4b); the expression of OsEhd1 increased by 14.9%, 12.9%, 32.3%, and 43.5%, respectively (Figure 4c). There was no significant difference in OsHd1 expression between O8, X48, X53, X57, and X63 (Figure 4d). Similarly, no significant difference in the expression of OsGI in O8, X48, and X53 was detected. Compared with O8, the expression of OsGI in X57 and X63 decreased by 17.0% and 19.7%, respectively (Figure 4e). There was no significant difference in the expression of OsLHY in O8, X57, and X63. Compared with O8, the expression of OsLHY in X48 and X53 increased by 20.3% and 12.4%, respectively (Figure 4f). Furthermore, we amplified and sequenced the gene sequences of OsNRT2.3b, OsRFT1, OsHd3a, OsEhd1, OsHd1, OsGI, and OsLHY in O8 and EMS mutants, and no base mutation was found.

3.2. Analysis of Yield and Agronomic Characteristics of Mutants

Overexpression of OsNRT2.3b can significantly increase the rice yield per plant [25,26]. Moreover, we found that compared with WT, the yield and dry weight of O8 increased by 48.0% and 38.7%, respectively (Table 1 and Table S3). Compared with O8, the yield of X48, X53, X57, and X63 decreased by 2.7%, 5.4%, 9.5%, and 9.5%, respectively (Table 1 and Table S3, Figure S3), and the biomass decreased by 2.1%, 4.2%, 7.7%, and 7.7%, respectively (Table 1 and Table S3). The grain-straw ratio of O8, X48, X53, X57, and X63 had no significant difference, but increased by 12.3% compared with WT (Table 1).
Furthermore, we analyzed the related agronomic traits. There was no significant difference in total tiller number per plant, effective tiller number per plant, seed setting rate, grain width, grain length, grain thickness, 1000-grain weight, and grain–straw ratio between O8 and EMS mutants (Table 1). Compared with O8, the panicle length of X48, X53, X57, and X63 decreased by 2.5%, 5.8%, 10.3%, and 11.0%, respectively; the grain number per panicle decreased by 2.8%, 6.0%, 11.7%, and 12.9%, respectively; the grain weight per panicle decreased by 2.2%, 5.8%, 12.5%, and 13.8%, respectively (Table 1).

3.3. NUE Analysis of Mutants

The method of measuring NUE usually calculates the plant biomass and yield under unit N application [30]. We analyzed the total N concentration, dry matter, and total N content of O8 and EMS mutants. At the anthesis stage, the biomass and total N content of O8, X48, X53, X57, and X63 increased significantly compared with WT (Figure 5a,c), and there was no significant difference in total N concentration between WT, O8, and EMS mutants (Figure 5b). At the maturity stage, the biomass and total N content of O8 and EMS mutants increased significantly compared with WT (Figure 5d,f), and the total N concentration of leaves of O8 and EMS mutants decreased significantly compared with WT (Figure 5e).
NUE can further define the components, including N uptake efficiency, N utilization (assimilation) efficiency, apparent N recovery rate, agronomy efficiency of fertilizer N, N physiological use efficiency, N transport efficiency, and N remobilization efficiency [30]. Compared with WT, the N translocation, N translocation efficiency, post-anthesis N uptake, agronomic N use efficiency, N recovery efficiency, and physiological N use efficiency of O8, X48, X53, X57, and X63 increased significantly (Figure 6). Compared with O8, the N translocation of X48, X53, X57, and X63 decreased by 2.0%, 7.2%, 14.1%, and 13.6%, respectively (Figure 6a, Table S3), the agronomic N use efficiency decreased by 3.3%, 5.5%, 9.6%, and 9.9%, respectively (Figure 6d, Table S3), and the N recovery efficiency decreased by 2.5%, 5.3%, 8.0%, and 6.8%, respectively (Figure 6e, Table S3). N translocation efficiency, post-anthesis N uptake, and physiological N use efficiency of the mutants was not significantly different compared with O8, and increased by about 24.4%, 16.1%, and 14.2% compared with WT (Figure 6b,c,f).

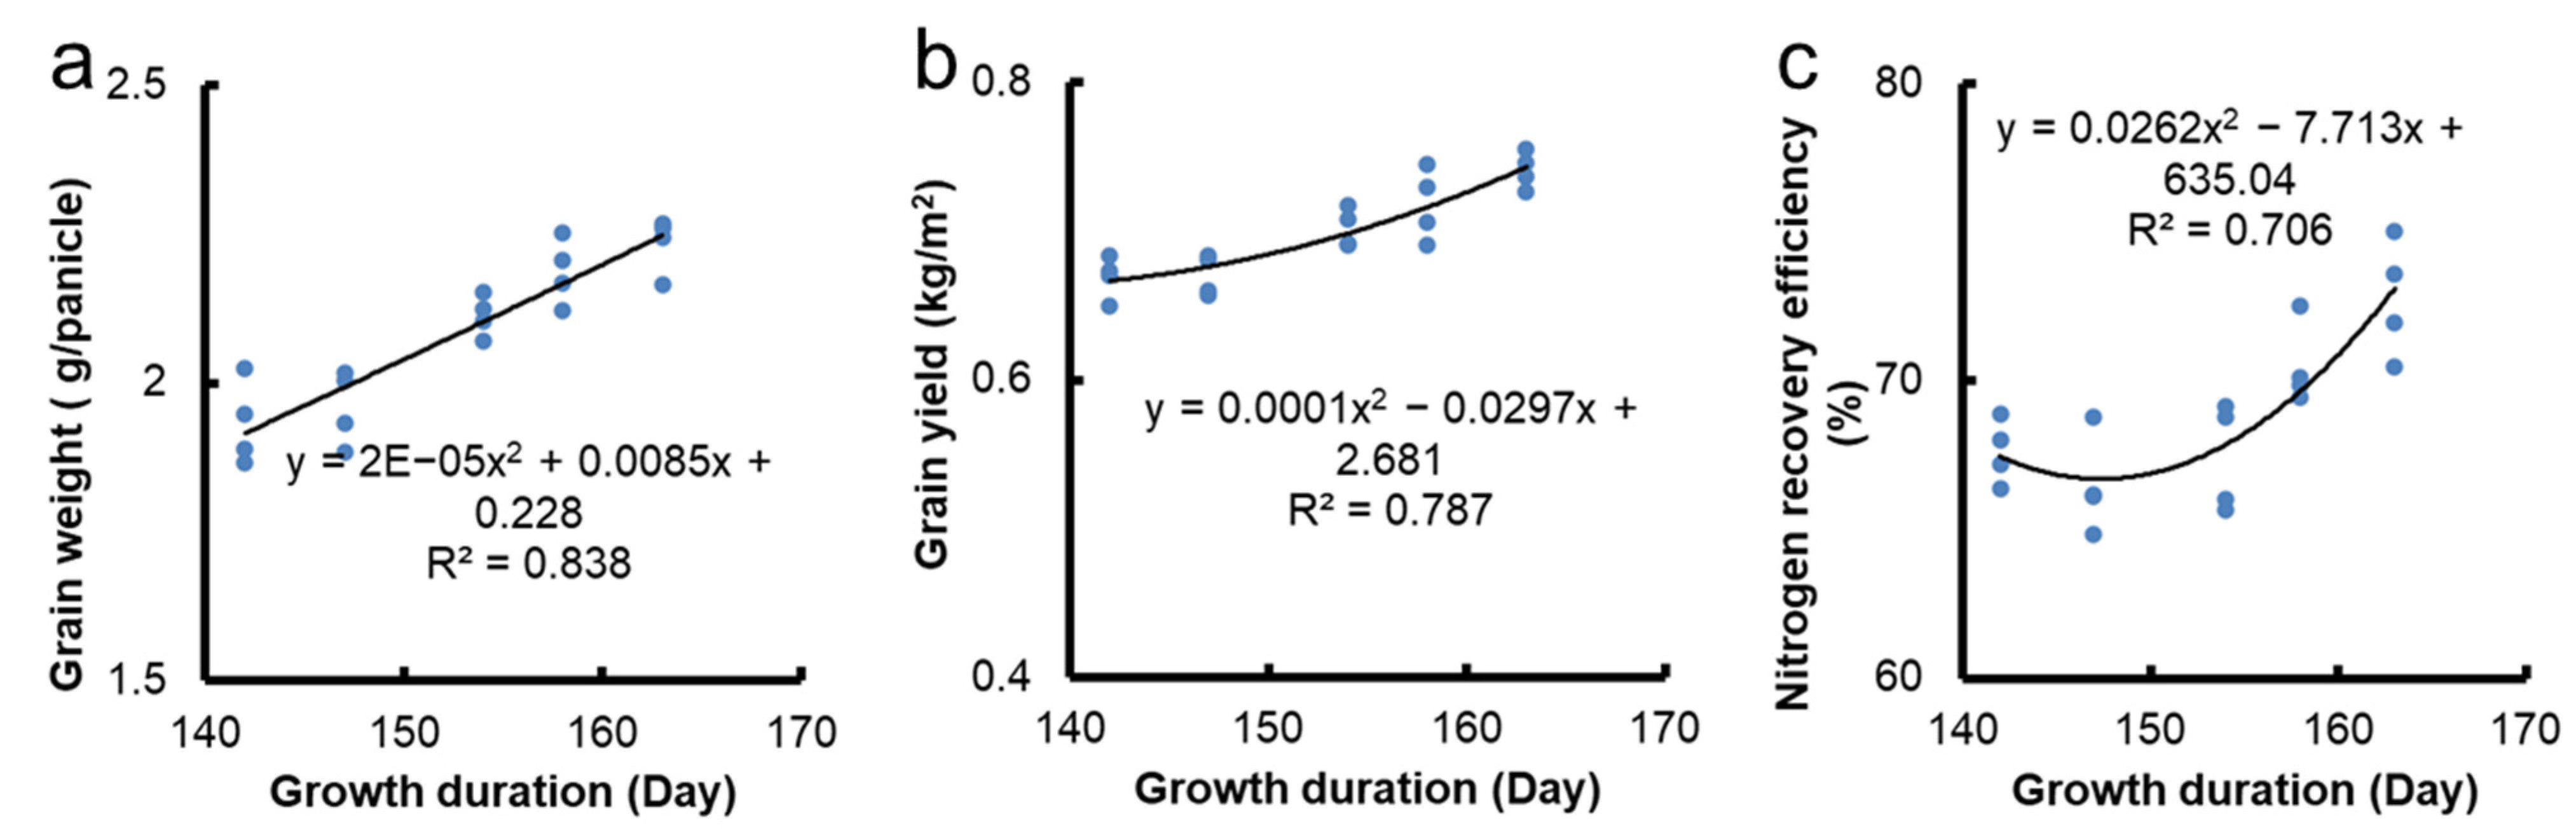
3.4. Regression Analysis of Growth Duration and Grain Yield

To analyze the growth effect of OsNRT2.3b overexpression lines on rice yield, we used O8, X48, X53, X57 and X63 to analyze the relationship between growth duration, grain weight per panicle, grain yield and N recovery efficiency. The results of univariate quadratic regression analysis showed that grain weight per panicle, grain yield and N recovery efficiency were positively correlated with growth duration (Figure 7).
In accordance with the correlation analysis of growth duration and grain yield, when the growth duration of OsNRT2.3b overexpression line increased to 0%, the grain yield increased by 32.8% (Figure S3).

4. Discussion

Heading time and growth duration are important agronomic traits in rice seed production [1,2,3]. The modification of growth cycle is of great significance to regional adaptation and yield optimization [5,31].
OsHd1 and OsEhd1 are two key genes in rice photoperiod regulation [8,10]. OsGI is the upstream gene of OsHdl and Hd3a, overexpression of OsGI will increase the expression of Hdl and reduce the expression of OsHd3a, resulting in the inhibition of rice flowering [7]. OsEhd1 influences rice flowering by regulating the expression of OsHd3a and OsRFT1 [8,12]. Compared with WT, the expression of OsRFT1, OsHd3a, and OsEhd1 in the overexpression of OsNRT2.3b lines was significantly reduced (Figure 4), which may be the main reason for their delayed heading time and longer growth duration. Compared with O8, the expression of OsRFT1, OsHd3a, and OsEhd1 was upregulated in mutant lines X48, X53, X57, and X63 (Figure 4a–c), and the heading time and growth duration were shorter (Figure 3c,d). However, it is not clear how OsNRT2.3b regulates the expression of OsRFT1, OsHd3a, and OsEhd1 in rice.
Rice grain yield and heading time are two distinct traits regulated by different QTLs [3,32]. The growth duration affects the yield of cereal crops [33,34], and the appropriate increase in growth duration could significantly increase crop yield [2]. Liu et al. [35] reported that overexpression of OsCOL9 in rice decreased the expression of EHd1, RFT, and Hd3a, increased the growth duration of rice under SDs and LDs, and finally increased the number of grains in main rice panicle. Knockout of oscol9 shortened the plant growth duration and reduced the grain number of main panicles [35]. Ghd7 induced the decrease in the expression of Hd3a under LDs, delayed the heading and flowering of rice, and increased the number of grains per panicle [36]. Wu et al. [37] reported that overexpression of OsCOL16 could increase the expression of Ghd7, reduce the expression of Ehd1, Hd3a, and RFT1, increase the growth duration of rice, increase the panicle length and grain number per panicle, and finally increase the grain yield. Moreover, we found that O8 line along with its four mutant lines had a significant increase in growth duration (Figure 2 and Figure 3), the grain weight per panicle, grain yield, and N recovery efficiency (Table 1 and Table S3, Figure 6e). The results showed that grain weight per panicle, grain yield, and N recovery efficiency were significantly positively correlated with growth duration in O8 and EMS mutants (Figure 7). Of course, the increase in rice yield does not necessarily attribute to the growth duration. Our previous results showed that overexpression of OsNAR2.1 could increase rice yield, but did not affect the growth duration of rice [27,28,29].
We previously reported that OsNRT2.3b is a high affinity nitrate transporter located on the plasma membrane. Overexpression of OsNRT2.3b could enhance the pH-buffering capacity of rice, and increases the uptake of 15NH4+ and 15NO3, in the meantime, it significantly increases the grain yield and NUE of rice [25]. Feng et al. [26] reported that overexpression of OsNRT2.3b in low phosphorus soil could increase the grain yield by 44% in rice. Our field experiments showed that the grain yield of O8 line increased by 48% compared with WT (Table 1 and Table S3). We analyzed the growth duration of O8 and WT, which increased by about 25 days compared with WT (Figure 1 and Figure 3d). In accordance with the correlation analysis of growth duration and grain yield (Figure 7a), the grain yield of O8 could be increased by 32.8% when the growth duration of O8 and WT was not different (Figure S3), and N transport efficiency, post-anthesis N uptake, and physiological N use efficiency did not change (Figure 6b,c,f). Therefore, overexpression of OsNRT2.3b can significantly increase rice yield and NUE, while higher yield and NUE can be achieved by appropriate extension of growth duration. Overexpression of OsNRT2.3b affects the growth duration of rice. However, its molecular mechanism is not clear, which requires further exploration.

5. Conclusions

The growth duration was significantly higher in O8, the OsNRT2.3b overexpression line, compared with WT. Four mutants with shortened growth duration were obtained by the EMS treatment of O8. The grain yield, plant biomass, and NUE were significantly increased in O8 and EMS mutants as compared with WT. Among O8 and EMS mutants, grain weight per panicle, grain yield, and N recovery efficiency were correlated with growth duration. In conclusion, our results provide a new idea for balancing rice yield and growth duration.

Supplementary Materials

The following supporting information can be downloaded at: https://www.mdpi.com/article/10.3390/agriculture12060799/s1. Table S1: Primers used for qRT-PCR; Table S2: Primers used to amplify the full-length of OsNRT2.3b and growth duration genes; Table S3: Enhanced percentage of growth duration, grain yield, and NUE of O8 and EMS mutants relative to WT (n = 3 plots for each mean). The different letters indicate a significant difference between the WT and OsNRT2.3b overexpressing lines (p < 0.05, one-way ANOVA); Figure S1: Phenotype of WT, O8, and EMS mutants in M6 generation at anthesis stage; Figure S2: Chlorophyll content and growth duration of O8 and EMS mutants. (a) Grain phenotype of O8 and EMS mutants. (b) SPAD of O8 and EMS mutants. The sample is obtained from the flag leaf of the mature period. Error bars: SE (n = 10 plants). The different letters indicate a significant difference between the WT and OsNRT2.3b overexpressing lines (p < 0.05, one-way ANOVA); Figure S3: Enhanced percentage of grain yield and growth duration of O8 and EMS mutants relative to WT. Yellow line: Enhanced percentage of grain yield of O8 and EMS mutants relative to WT. Blue line: Enhanced percentage of growth duration of O8 and EMS mutants relative to WT.

Author Contributions

Conceptualization, X.F.; writing—original draft preparation, J.C.; data curation, F.W., B.L., K.Q. and J.W. All authors have read and agreed to the published version of the manuscript.

Funding

This work was supported by the National Natural Science Foundation of China (32172665), policy guidance program of Jiangsu Province in 2020 (International Science and Technology cooperation, BZ2020064), Introduction Project of High-level Talents in Xinjiang Uygur Autonomous Region, Guangdong Basic and Applied Basic Research Foundation (2022A1515012381), and the Shenzhen Science and Technology Program (JCYJ20210324124409027).

Institutional Review Board Statement

Not applicable.

Informed Consent Statement

Not applicable.

Data Availability Statement

All the data generated or analyzed during this study are included in this published article.

Acknowledgments

We thank Guohua Xu, Hongye Qu, and Xiaozhen Wang (Nanjing Agricultural University) for their help in laboratory management.

Conflicts of Interest

The authors declare no conflict of interest.

References

  1. Xue, W.; Xing, Y.; Weng, X.; Zhao, Y.; Tang, W.; Wang, L.; Zhou, H.; Yu, S.; Xu, C.; Li, X.; et al. Natural variation in Ghd7 is an important regulator of heading date and yield potential in rice. Nat. Genet. 2008, 40, 761–767. [Google Scholar] [CrossRef]
  2. Weng, X.; Wang, L.; Wang, J.; Hu, Y.; Du, H.; Xu, C.; Xing, Y.; Li, X.; Xiao, J.; Zhang, Q. Grain number, plant height, and heading date7 is a central regulator of growth, development, and stress response. Plant Physiol. 2014, 164, 735–747. [Google Scholar] [CrossRef] [PubMed] [Green Version]
  3. Chen, J.; Zhang, H.; Ying, J.; Ma, L.; Zhuang, J. Natural variation at qHd1 affects heading date acceleration at high temperatures with pleiotropism for yield traits in rice. BMC Plant Biol. 2018, 18, 112. [Google Scholar]
  4. Hou, M.; Yu, M.; Li, Z.; Ai, Z.; Chen, J. Molecular Regulatory Networks for Improving Nitrogen Use Efficiency in Rice. Int. J. Mol. Sci. 2021, 22, 9040. [Google Scholar] [CrossRef] [PubMed]
  5. Hori, K.; Matsubara, K.; Yano, M. Genetic control of flowering time in rice: Integration of Mendelian genetics and genomics. Theor. Appl. Genet. 2016, 129, 2241–2252. [Google Scholar] [CrossRef] [PubMed]
  6. Wickland, D.P.; Hanzawa, Y. The FLOWERING LOCUS T/TERMINAL FLOWER 1 gene family: Functional evolution and molecular mechanisms. Mol. Plant 2015, 8, 983–997. [Google Scholar] [CrossRef] [Green Version]
  7. Hayama, R.; Yokoi, S.; Tamaki, S.; Yano, M.; Shimamoto, K. Adaptation of photoperiodic control pathways produces short-day flowering in rice. Nature 2003, 422, 719–722. [Google Scholar] [CrossRef]
  8. Komiya, R.; Yokoi, S.; Shimamoto, K. A gene network for longday flowering activates RFT1 encoding a mobile flowering signal in rice. Development 2009, 136, 3443–3450. [Google Scholar] [CrossRef] [Green Version]
  9. Du, A.; Tian, W.; Wei, M.; Yan, W.; He, H.; Zhou, D.; Huang, X.; Li, S.; Ouyang, X. The DTH8-Hd1 module mediates Day-Length-Dependent regulation of rice flowering. Mol. Plant 2017, 10, 948–961. [Google Scholar] [CrossRef] [Green Version]
  10. Tamaki, S.; Matsuo, S.; Wong, H.L.; Yokoi, S.; Shimamoto, K. Hd3a protein is a mobile flowering signal in rice. Science 2007, 316, 1033–1036. [Google Scholar] [CrossRef]
  11. Wu, W.; Zheng, X.M.; Lu, G.; Zhong, Z.; Gao, H.; Chen, L.; Wu, C.; Wang, H.J.; Wang, Q.; Zhou, K.; et al. Association of functional nucleotide polymorphisms at DTH2 with the northward expansion of rice cultivation in Asia. Proc. Natl. Acad. Sci. USA 2013, 110, 2775–2780. [Google Scholar] [CrossRef] [PubMed] [Green Version]
  12. Pasriga, R.; Yoon, J.; Cho, L.H.; An, G. Overexpression of RICE FLOWERING LOCUS T 1 (RFT1) induces extremely early flowering in rice. Mol. Cells 2019, 42, 406–417. [Google Scholar]
  13. Cho, L.H.; Yoon, J.; An, G. The control of flowering time by environmental factors. Plant J. 2017, 90, 708–719. [Google Scholar] [CrossRef] [PubMed]
  14. Zhang, S.; Zhang, Y.; Li, K.; Yan, M.; Zhang, J.; Yu, M.; Tang, S.; Wang, L.; Qu, H.; Luo, L.; et al. Nitrogen Mediates Flowering Time and Nitrogen Use Efficiency via Floral Regulators in Rice. Curr. Biol. 2021, 31, 671–683. [Google Scholar] [CrossRef] [PubMed]
  15. Wada, K.C.; Takeno, K. Stress-induced flowering. Plant Signal. Behav. 2010, 5, 944–947. [Google Scholar] [CrossRef] [PubMed]
  16. Tienderen, P.H.V.; Hammad, I.; Zwaal, F.C. Pleiotropic Effects of Flowering Time Genes in the Annual Crucifer Arabidopsis thaliana (Brassicaceae). Am. J. Bot. 1996, 83, 169–174. [Google Scholar] [CrossRef] [Green Version]
  17. Kolár, J.; Senková, J. Reduction of mineral nutrient availability accelerates flowering of Arabidopsis thaliana. J. Plant Physiol. 2008, 165, 1601–1609. [Google Scholar] [CrossRef]
  18. Dielen, V.; Lecouvet, V.; Dupont, S.; Kinet, J.M. In vitro control of floral transition in tomato (Lycopersicon esculentum Mill.), the model for autonomously flowering plants, using the late flowering uniflora mutant. J. Exp. Bot. 2001, 52, 715–723. [Google Scholar] [CrossRef] [Green Version]
  19. Castro, M.I.; Loef, I.; Bartetzko, L.; Searle, I.; Coupland, G.; Stitt, M.; Osuna, D. Nitrate regulates floral induction in Arabidopsis, acting independently of light, gibberellin and autonomous pathways. Planta 2011, 233, 539–552. [Google Scholar] [CrossRef] [Green Version]
  20. Li, H.; Hu, B.; Chu, C. Nitrogen use efficiency in crops: Lessons from Arabidopsis and rice. J. Exp. Bot. 2017, 68, 2477–2488. [Google Scholar] [CrossRef]
  21. Liu, T.; Li, Y.; Ren, J.; Qian, Y.; Yang, X.; Duan, W.; Hou, X. Nitrate or NaCl regulates floral induction in Arabidopsis thaliana. Biologia 2013, 68, 215–222. [Google Scholar] [CrossRef]
  22. Wang, W.; Hu, B.; Yuan, D.; Liu, Y.; Che, R.; Hu, Y.; Ou, S.; Liu, Y.; Zhang, Z.; Wang, H.; et al. Expression of the nitrate transporter gene OsNRT1.1A/OsNPF6.3 confers high yield and early maturation in rice. Plant Cell. 2018, 30, 638–651. [Google Scholar] [CrossRef] [PubMed] [Green Version]
  23. Sanagi, M.; Aoyama, S.; Kubo, A.; Lu, Y.; Sato, Y.; Ito, S.; Abe, M.; Mitsuda, N.; Ohme-Takagi, M.; Kiba, T.; et al. Low nitrogen conditions accelerate flowering by modulating the phosphorylation state of FLOWERING BHLH 4 in Arabidopsis. Proc. Natl. Acad. Sci. USA 2021, 118, e2022942118. [Google Scholar] [CrossRef]
  24. Song, Y.H.; Shim, J.S.; Kinmonth-Schultz, H.A.; Imaizumi, T. Photoperiodic flowering: Time measurement mechanisms in leaves. Annu. Rev. Plant Biol. 2015, 66, 441–464. [Google Scholar] [CrossRef] [Green Version]
  25. Fan, X.; Tang, Z.; Tan, Y.; Zhang, Y.; Luo, B.; Yang, M.; Lian, X.; Shen, Q.; Miller, A.J.; Xu, G. Overexpression of a pH-sensitive nitrate transporter in rice increases crop yields. Proc. Natl. Acad. Sci. USA 2016, 113, 7118–7123. [Google Scholar] [CrossRef] [PubMed] [Green Version]
  26. Feng, H.; Li, B.; Zhi, Y.; Chen, J.; Li, R.; Xia, X.; Xu, G.; Fan, X. Overexpression of the nitrate transporter, OsNRT2.3b, improves rice phosphorus uptake and translocation. Plant Cell Rep. 2017, 36, 1287–1296. [Google Scholar] [CrossRef]
  27. Chen, J.; Fan, X.; Qian, K.; Zhang, Y.; Song, M.; Liu, Y.; Xu, G.; Fan, X. pOsNAR2.1:OsNAR2.1 expression enhances nitrogen uptake efficiency and grain yield in transgenic rice plants. Plant Biotechnol. J. 2017, 15, 1273–1283. [Google Scholar] [CrossRef] [Green Version]
  28. Chen, J.; Qi, T.; Hu, Z.; Fan, X.; Zhu, L.; Iqbal, M.F.; Yin, X.; Xu, G.; Fan, X. OsNAR2.1 positively regulates drought tolerance and grain yield under drought stress conditions in rice. Front. Plant Sci. 2019, 10, 197. [Google Scholar] [CrossRef] [Green Version]
  29. Chen, J.; Liu, X.; Liu, S.; Fan, X.; Zhao, L.; Song, M.; Fan, X.; Xu, G. Co-Overexpression of OsNAR2.1 and OsNRT2.3a Increased Agronomic Nitrogen Use Efficiency in Transgenic Rice Plants. Front. Plant Sci. 2020, 11, 1245. [Google Scholar] [CrossRef]
  30. Xu, G.; Fan, X.; Miller, A.J. Plant nitrogen assimilation and use efficiency. Annu. Rev. Plant Biol. 2012, 63, 153–182. [Google Scholar] [CrossRef] [Green Version]
  31. Cockram, J.; Jones, H.; Leigh, F.J.; O’Sullivan, D.; Powell, W.; Laurie, D.A.; Greenland, A.J. Control of flowering time in temperate cereals: Genes, domestication, and sustainable productivity. J. Exp. Bot. 2007, 58, 1231–1244. [Google Scholar] [CrossRef] [PubMed]
  32. Zhang, B.; Liu, H.; Qi, F.; Zhang, Z.; Li, Q.; Han, Z.; Xing, Y. Genetic interactions among Ghd7, Ghd8, OsPRR37 and Hd1 contribute to large variation in heading date in rice. Rice 2019, 12, 48. [Google Scholar] [CrossRef] [Green Version]
  33. Roux, F.; Touzet, P.; Cuguen, J.; Le Corre, V. How to be early flowering: An evolutionary perspective. Trends Plant Sci. 2006, 11, 375–381. [Google Scholar] [CrossRef] [PubMed]
  34. Feys, K.; Demuynck, K.; De Block, J.; Bisht, A.; De Vliegher, A.; Inzé, D.; Nelissen, H. Growth rate rather than growth duration drives growth heterosis in maize B104 hybrids. Plant Cell Environ. 2018, 41, 374–382. [Google Scholar] [CrossRef] [PubMed] [Green Version]
  35. Liu, H.; Gu, F.; Dong, S.; Liu, W.; Wang, H.; Chen, Z.; Wang, J. CONSTANS-like 9 (COL9) delays the flowering time in Oryza sativa by repressing the Ehd1 pathway. Biochem. Biophys. Res. Commun. 2016, 479, 173–178. [Google Scholar] [CrossRef] [Green Version]
  36. Zheng, T.; Sun, J.; Zhou, S.; Chen, S.; Lu, J.; Cui, S.; Tian, Y.; Zhang, H.; Cai, M.; Zhu, S.; et al. Post-transcriptional regulation of Ghd7 protein stability by phytochrome and OsGI in photoperiodic control of flowering in rice. New Phytol. 2019, 224, 306–320. [Google Scholar] [CrossRef] [PubMed]
  37. Wu, W.; Zheng, X.M.; Chen, D.; Zhang, Y.; Ma, W.; Zhang, H.; Sun, L.; Yang, Z.; Zhao, C.; Zhan, X.; et al. OsCOL16, encoding a CONSTANS-like protein, represses flowering by up-regulating Ghd7 expression in rice. Plant Sci. 2017, 260, 60–69. [Google Scholar] [CrossRef]
Figure 1. The phenotype difference between WT and O8 in late growth stage. (a) 76 days after transplant; (b) 84 days after transplant; (c) 88 days after transplant; (d) 98 days after transplant; (e) 120 days after transplant; (f) 140 days after transplant.
Agriculture 12 00799 g001
Figure 2. Growth duration and grain yield of EMS mutants in M4 and M5 generations. Growth duration of EMS mutants in (a) M4 and (b) M5 generations. Error bars: SE (n = 10 plants). Grain yield of EMS mutants in (c) M4 and (d) M5 generations. Error bars: SE (n = 3). Significant differences between the WT and OsNRT2.3b overexpressing lines are indicated by different letters (p < 0.05, one-way ANOVA).
Agriculture 12 00799 g002
Figure 3. Characteristics of WT, O8, and EMS mutants in M6 generation. (a) Phenotype of O8 and EMS mutants in WT at maturity stage. (b) Real-time quantitative RT-PCR analysis of endogenous OsNRT2.3b expression in various overexpressing lines and WT plants. RNA was extracted from leaf blade I. Error bars: SE (n = 3 plants). (c) Days to heading of WT and overexpressing lines. Days to flowering was scored when the first panicle was bolted. Error bars: SE (n = 10 plants). (d) Growth duration of WT, O8, and EMS mutants. The 90% seeds of the main panicle are fully mature. Error bars: SE (n = 10 plants). Significant differences between the WT and OsNRT2.3b overexpressing lines are indicated by different letters (p < 0.05, one-way ANOVA).
Agriculture 12 00799 g003
Figure 4. Expression of growth duration genes in WT, O8, and EMS mutants. (a) OsRFT1, (b) OsHd3a, (c) OsEhd1, (d) OsHd1, (e) OsGI, and (f) OsLHY. RNA was extracted from leaf blade I. Error bars: SE (n = 3 plants). Significant differences between the WT and OsNRT2.3b overexpressing lines are indicated by different letters (p < 0.05, one-way ANOVA).
Agriculture 12 00799 g004
Figure 5. N content in various parts of WT, O8, and EMS mutants. Biomass (a,d), N concentration (b,e) and N content (c,f) in various parts of WT, O8, and EMS mutants at (ac) the anthesis stage and (df) maturity stage. Error bars: SE (n = 3 plots). Significant differences between the WT and OsNRT2.3b overexpressing lines are indicated by different letters (p < 0.05, one-way ANOVA).
Agriculture 12 00799 g005
Figure 6. NUE of WT, O8, and EMS mutants in field plots. (a) N translocation, (b) N translocation efficiency, (c) post-anthesis N uptake, (d) agronomic N use efficiency, (e) N recovery efficiency, (f) physiological N use efficiency. Error bars: SE (n = 3 plots). Significant differences between the WT and OsNRT2.3b overexpressing lines are indicated by different letters (p < 0.05, one-way ANOVA).
Agriculture 12 00799 g006
Figure 7. The relationships between growth duration and grain yield in O8 and EMS mutants. The relationships between growth duration and (a) grain weight (p = 0.015), (b) grain yield (p = 0.037) or (c) N recovery efficiency (p = 0.048).
Agriculture 12 00799 g007
Table 1. Agronomic traits of WT, O8, and EMS mutants.
GenotypeWTO8X48X53X57X63
Total tiller number per plant28.03 ± 1.41 a23.06 ± 2.01 b24.62 ± 1.66 b23.00 ± 2.31 b23.60 ± 1.60 b24.07 ± 1.65 b
Effective tiller number per plant20.77 ± 1.05 a19.85 ± 1.61 a21.01 ± 1.54 a19.50 ± 2.04 a20.80 ± 1.35 a20.96 ± 1.34 a
Panicle length (cm)20.80 ± 1.17 d29.49 ± 1.13 a28.75 ± 1.39 ab27.77 ± 0.61 b26.46 ± 0.59 c26.25 ± 0.41 c
Grain number per panicle77.69 ± 6.70 d113.58 ± 3.56 a110.39 ± 5.32 ab106.75 ± 3.24 b100.31 ± 3.16 c98.89 ± 4.05 c
Seed setting rate (%)80.63 ± 6.36 a85.46 ± 3.72 a83.97 ± 3.73 a81.67 ± 3.02 a83.87 ± 5.37 a80.91 ± 5.89 a
Grain weight (g/panicle)1.55 ± 0.10 d2.24 ± 0.08 a2.19 ± 0.11 ab2.11 ± 0.06 b1.96 ± 0.07 c1.93 ± 0.09 c
Grain width (mm)3.11 ± 0.06 a2.75 ± 0.07 b2.64 ± 0.05 b2.72 ± 0.11 b2.69 ± 0.18 b2.69 ± 0.11 b
Grain length (mm)7.28 ± 013 b8.67 ± 0.09 a8.73 ± 0.21 a8.63 ± 0.24 a8.67 ± 0.22 a8.66 ± 0.20 a
Grain thickness (mm)2.25 ± 0.05 a2.28 ± 0.06 a2.21 ± 0.04 a2.29 ± 0.05 a2.28 ± 0.06 a2.24 ± 0.04 a
1000-grain weight (g)23.18 ± 0.12 a23.63 ± 0.06 a22.04 ± 0.10 a22.96 ± 0.08 a22.16 ± 0.19 a22.65 ± 0.21 a
Grain yield (kg/m2)0.50 ± 0.03 d0.74 ± 0.02 a0.72 ± 0.02 ab0.70 ± 0.02 b0.67 ± 0.01 c0.67 ± 0.01 c
Dry weight (kg/m2)1.03 ± 0.06 d1.43 ± 0.02 a1.40 ± 0.05 ab1.37 ± 0.03 b1.32 ± 0.02 c1.32 ± 0.02 c
Grain–straw ratio0.93 ± 0.05 b1.07 ± 0.07 a1.05 ± 0.07 a1.05 ± 0.03 a1.03 ± 0.05 a1.02 ± 0.04 a
Statistical analysis was performed on data derived from the M6 generation; n = 3 for each mean.
Publisher’s Note: MDPI stays neutral with regard to jurisdictional claims in published maps and institutional affiliations.

