Review

Effects of Sheep Grazing Systems on Water Quality with a Focus on Nitrate Leaching

School of Agriculture and Environment, Massey University, Private Bag 11-222, Palmerston North 440, New Zealand
*
Author to whom correspondence should be addressed.
Agriculture 2022, 12(6), 758; https://doi.org/10.3390/agriculture12060758
Submission received: 17 April 2022 / Revised: 23 May 2022 / Accepted: 24 May 2022 / Published: 26 May 2022

Abstract

:
This article reviews the literature on nitrate leaching under sheep grazing systems and focuses on identifying future research needs. Urinary nitrogen (N) is an important source of the nitrate leached from pastoral agriculture. Urinary N excretion can be measured or simulated using models and has been well characterised for dairy systems. It is difficult to continuously monitor the urinary N excretion of sheep under field conditions; consequently, measurements of N excretion in sheep urine are limited. Urination events by sheep vary greatly in volume (0.5 L to 6.9 L), concentration (3 to 13.7 g N/L), and frequency (8 to 23 events/day); this variation results in a corresponding variation in N loading rates in urine patches. The amount of nitrate leached under pastures grazed by sheep has typically varied between 1 and 50 kg N/ha/year, but rates as high as 300 kg N/ha/year have been reported. The quantity of nitrate leached under sheep depends on the season, climate, quantity and timing of drainage, the interaction between forage production and stocking rate, fertiliser applied, N fixation by legumes, forage type, and grazing management. The majority of studies examining nitrate leaching under sheep grazing systems are more than 20 years old; so, there is little recent information on nitrate leaching under modern pasture-based sheep production systems. Further research is required to quantify nitrate leaching levels under current sheep farming practices, to understand the impacts of this leaching on water quality, and to help identify effective strategies to reduce the transfer of N from grazed paddocks to receiving water bodies. This additional information will help provide information for decision support tools, including models and management practices, to help sheep farmers minimise their impact on the aquatic environment.

1. Introduction

Nitrogen (N) losses in drainage and runoff from agricultural soils, particularly from intensively grazed pasture, can be a significant cause of water quality deterioration in many parts of the world [1,2,3,4,5]. Nitrate (NO3) is the most common form of N in drainage water [6,7]. At higher concentrations (>11.3 mg N/L), nitrate can be hazardous to human health and aquatic life [3]: more problematically, a relatively small concentration of nitrate can promote undesirable biological growth, which following eutrophication, results in a deterioration in water quality [3]. Nitrate has a negative charge and is repelled by cation exchange sites on the soil surface [8]; therefore, it is easily leached when water drains through soil [3]. In comparison, ammonium (NH4+) does not generally move far within the soil profile because it is attracted to cation exchange sites [6,7].
Nitrogen cycling in a grazing system is influenced by the grazing animal’s diet and the partitioning of ingested N within the animal [9]. Generally, between 75 and 95% of ingested N is returned to the soil, and approximately 70% of this N is excreted in urine (Figure 1) [6]. Thus, the primary source of nitrate leached from grazed pasture is livestock urine (Figure 1) [6]. Nitrogen in faeces is present in more complex organic forms that are less rapidly mineralised; therefore, it is not a significant contributor to nitrate leaching [10].
Nitrate leaching is widely believed to be significantly lower under sheep farming than dairy cow systems [9,11]. However, in order to remain economically viable, sheep production systems in New Zealand, particularly those on flat or undulating landscapes, have intensified over time, with greater use of N fertiliser and higher stocking rates [12]. Therefore, it is likely that nitrate leaching rates from the current sheep systems are greater than those previously reported in New Zealand, necessitating a reassessment of N losses, especially under intensive grazing practices. Currently, there are no long-term studies of nitrate leaching from modern pastoral-based sheep production systems in New Zealand. Due to the potentially adverse environmental effects of intensive farming on water quality [13], some regional councils have placed nitrate leaching caps on dairy farms [14]. In the future, these restrictions may be extended to other livestock industries, including intensive sheep farming. Therefore, knowledge of potential leaching rates and mitigation measures will be of benefit.
This review aims to explicitly examine the current knowledge of N excretion in sheep urine and how urination behaviour and other factors determine the extent of nitrate leaching under sheep grazing systems. Further, it aims to identify the areas of research and development that are required to enhance the knowledge and understanding of nitrate leaching under modern sheep grazing systems, including N application/loading, grazing management, and alternative pastures.

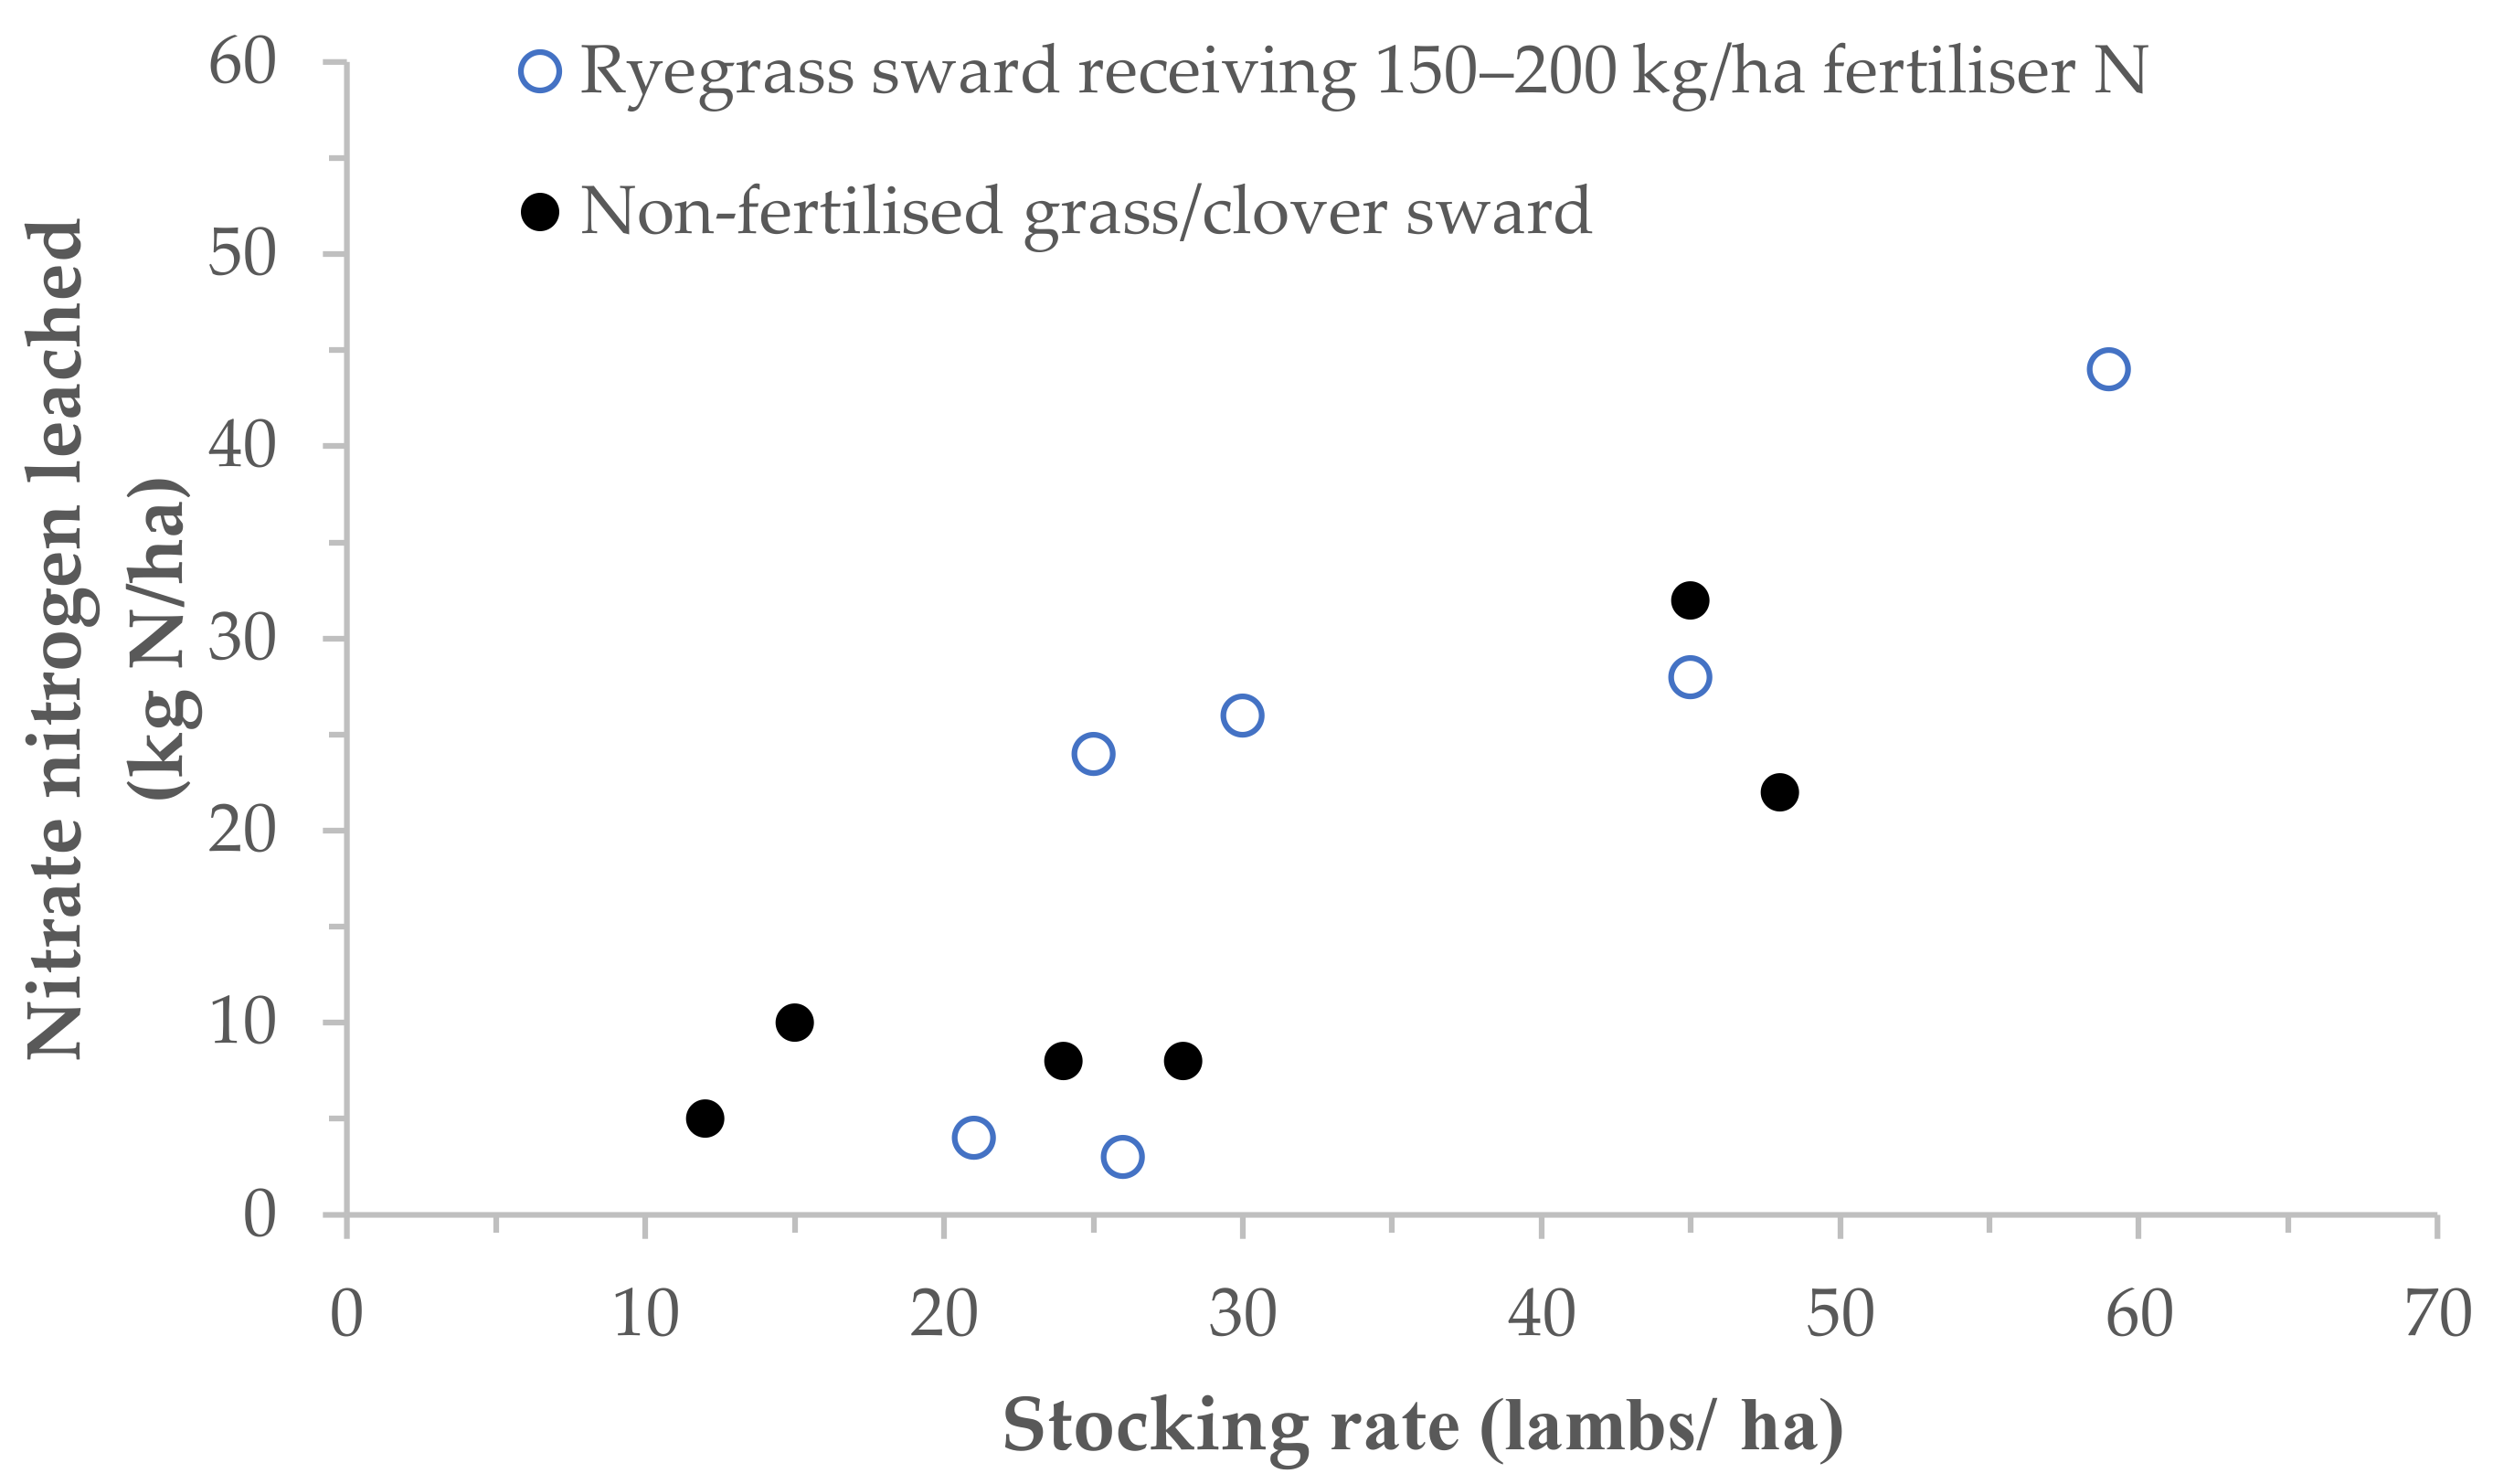
2. Measurements of Nitrate Leaching under Sheep Grazing Systems

The few studies to date that have measured nitrate leaching under typical sheep grazing conditions have mostly used soil core samples, suction cups, or lysimeter methods and have reported nitrate leaching rates ranged from 2 to 94 kg N/ha/year (Table 1). Nitrate leaching rates greater than 100 kg N/ha were reported in New Zealand, when the N fertiliser level was above 200 kg N/ha (Table 1). In contrast, in a UK study [5], the nitrate leaching rate remained below 50 kg N/ha, even when the N fertiliser rate was above 200 kg N/ha. The few studies that have measured nitrate leaching from mole and pipe drains (Table 2) have reported nitrate leaching ranging from 8.6 to 50 kg N/ha/year [15,16,17]. In studies of mole and pipe drainage, nitrate leaching under different N fertiliser rates (0, 50, and 120 kg N/ha) were compared [15,16,17]; no differences in nitrate leaching were found between no N fertiliser and the other two moderate N application rates.
Summarising Table 1, nitrate leaching under sheep grazing varies depending on the amount of fertiliser applied [18], the level of soil fertility [19], the amount of N fixed by legumes in the pasture [20], and the stocking rate [21]. The following sections discuss what is or is not known regarding the factors affecting leaching levels under sheep grazing.

3. Sheep Urination

Nitrogen losses under grazing systems are primarily driven by the amount of urinary N excreted by animals [9] for a particular soil type, climate context, and the season of the urinary N return. For example, although the N content in urine in spring may be relatively high, it may not significantly impact nitrate leaching due to rapid pasture growth and associated N uptake at this time of the year [22]. The total quantity of N deposited in sheep urine patches over a given period is influenced by the concentration of N in the urine, the number of urination events, the volume of urine voided at each urination event, and the size of the urination patch [6]. Sheep urination events under grazing conditions are highly variable in volume, concentration, and frequency [23,24,25]. This variation can lead to larger differences in urine N loading to soils [26].
Currently, information on sheep urination events under pastoral grazing conditions is limited due to the difficulty of continuously monitoring urination by sheep [25,27]. Consequently, most data have been derived from indoor full-collection studies in which animals are penned for sampling [28,29,30,31]. However, some studies have utilised sensors (thermistors) in conjunction with GPS to determine the spatial distribution of sheep urination events [23]. In dairy cattle, advanced technologies, including sensors and urine meters, have been successfully utilised to measure urination behaviour, including urine volume and frequency [32]. Triaxial accelerometer sensors are beginning to be trialled on sheep [33]. If successful, these technologies would allow more comprehensive studies of sheep urination behaviour to be undertaken under field conditions.
Table 1. Summary of nitrate nitrogen (N) leaching in sheep grazing pasture systems measured using lysimeter or ceramic cups at different depths.
ReferenceSoil TextureStocking Rate or
Urine Application
Fertiliser N
Applied kg N/ha
Drainage
mm
Total Nitrate N Leached
(kg N/ha)
New Zealand
Monaghan et al. [34]Silt loamSheep urine applied equivalent to 265 kg N/ha07–13619–37
Hoogendoorn et al. [11]SandRotational grazing of sheep for many days010020–31
Hoogendoorn et al. [18]Silty clay loam to clay loamRotational grazing of non-lactating ewes (200–250 ewes/ha for 3–4-day grazing and 10–14 times/year)0 47–74
100 43–67
200 37–94
300 113–176
400 152–227
500 235–315
750 238–368
Williams and Haynes [9]Silt loamSheep urine equivalent to 290 kg N/ ha (5.6 g N/L) 3–16
Di and Cameron [35]Silt loamCow urine equivalent to sheep urine20
Urine N applied at the rates of 300 kg N/ha 59.7
Urine N applied at the rates of 300 kg N/ha + DCD 9.9
Australia
Melland et al. [36] Chromosols26 SU/ha at set stocking high P 5.8–7.7
19 SU/ha at set stocking low P 3.5–5.2
27–28 SU/ha at rotational grazing high P 3.2–5
27–28 SU/ha at rotational grazing high P 4.6–5.1
UK
Cuttle et al. [37]Stony loamPreWL: 2859 days, PostWL: 6280 days0454–6966–33
PreWL: 2233 days, PostWL: 3028 days152–198 2–25
Cuttle et al. [5]Fine loamEwes + PreWL 18.8 unit/ha, PostWL: 24.9 lambs/ha0 5.4–13.3
Ewes + PreWL 21.6 unit/ha, PostWL: 25.2 lambs/ha 398 5.6
Ewes + PreWL 18.8 unit/ha, PostWL: 22.7 lambs/ha 467 13.6
Ewes + PreWL 17.8 unit/ha, PostWL: 25.7 lambs/ha462 10.3
Cuttle et al. [38]Fine loamContinuous stocking of ewes and lambs0454–6926–34
152–197 8–46
SU: stocking unit; PreWL: Pre-weaning lambs; PostWL: Post-weaning lambs.
Table 2. Summary of nitrate nitrogen (N) leaching in sheep grazing pasture systems measured using mole and pipe drainage systems.
ReferenceSoil TextureStocking Rate or
Urine Application
Fertiliser N
Applied kg N/ha
Drainage
mm
Total Nitrate N Leached
(kg N/ha)
New Zealand
Heng et al. [15]Silt loamNo grazing087–3048.6–12.6
40–50 sheep grazed one week50100–11814.9–19.7
Magesan et al. [16]Silt loamNo grazing0304–3399–23
No grazing50257–30013–17
Intensively grazed by sheep for several days0118–26619–50
Intensively grazed by sheep for several days50100–23615–44
White et al. [17]Silt loam40 sheep for one week0 35
40 sheep for one week120 23
21 sheep for 5 days0 43
21 sheep for 5 days120 17

3.1. Urine Volume

Indoor sheep studies utilising metabolic crates report a wide range in total daily urinary volume, ranging from 0.5 L to 6.9 L/day [25]. Urine volume is influenced by season and forage type [25,30,31]. Under field conditions, Doak [39] reported that the average daily urine volume usually varied between 1.7 and 3.8 L. Maximum daily urine volumes (11 L/day) were observed in October (spring); this was a reflection of high foliage water content [39]. However, in a recent UK study, ewes grazing ad libitum on a perennial ryegrass dominated sward had greater individual urine event volumes and daily urine volumes during a hot autumn (mean temperature of 16.4 °C, 377 mL urine/event, and 3.13 L urine/day) compared to a cool summer (mean temperature of 14.5 °C, 239 mL urine/event, and 2.02 L urine/day) or spring (mean temperature of 11.3 °C, 177 mL urine/event, and 2.03 L urine/day) [25]. They suggested that feed and water intake could be drivers for these differences in the production of urine volume [25], but these factors were not measured. Recent studies have shown that forage species, such as plantain, influence urinary volume, which is discussed in detail in later sections (Section 6).
Measuring the urine volume of sheep is a very laborious process and usually involves placing animals in metabolic crates [27]. Currently, it is not practical to collect accurate measurements of urine volume from sheep under pastoral grazing conditions and so alternative indicators are often employed. Muscle creatinine (a metabolite formed in muscle by removing water from creatinine phosphate) is produced daily at what is thought to be a constant rate, determined by the sheep’s live weight (per kilogram of animal muscle mass), and is exclusively excreted via urine [27]. Therefore, measurements of urine creatinine concentration along with the ratio of daily creatinine excretion per unit of live weight (LW) are commonly used to predict daily urine output (L/day). This method has predicted values of 1.4 to 7.6 L/day (Table 3). However, Jonker et al. [40] have recently indicated that creatinine excretion per kg of body weight is not as constant as initially thought, leading to underestimations of the urine output of sheep fed with low DM forage crops. Accordingly, they attempted to develop a model using multiple data inputs to improve the prediction of sheep’s daily urine output [40]. However, when these equations were applied to creatinine concentrations based on spot urine samples collected in the authors’ study [41], predicted urine volumes ranged from 0.5 to 49 L/day (see Table 3). It would appear that all of the equations that use measurements of creatinine concentration to predict sheep urinary N output lack consistency and often produce unrealistic values (i.e., well above 10 L/day). If spot urine samples are to be successfully used to predict total urine output (based on creatinine), further studies are required to understand how creatinine excretion is influenced by the time of the day, forage type, water intake, animal live weight, and physiological stage.

3.2. Urine N Concentration

Nitrogen concentration in urine is another primary determinant of soil N loading rates via urine patches [24]. The concentration of N excreted in each urination event depends on the amount of excess metabolised N excreted and urine volume [24]. Therefore, understanding N concentrations in sheep urine helps to explain N leaching rates. Across several studies, the N concentration of sheep urine has been shown to vary from 3 to 13.7 g N/L (Table 4). Urine N concentration appears to vary with pasture type, N intake, water intake, season, and animal reproductive status [42]. Increasing N intake has been shown to increase the excretion of urine N; however, high N feeds do not necessarily correspond to higher urine N concentration, because it also depends on the water intake [42]. The effect of forage species on sheep urine N concentration is explained in Section 6.
Hoogendoorn et al. [24] measured the N concentration of urine from ewes (12- to 18-month-old) grazing a ryegrass/cocksfoot-based pasture over three periods for three consecutive days during spring and autumn. They observed variations in N concentration between individual urination events within days, between days, and between individual sheep. Their study showed higher urinary N concentration in the afternoon relative to the morning [24]. The reason for this variation was not explained by Hoogendoorn et al. [24], but previous studies have shown that the water-soluble carbohydrates (WSC) and CP contents of pastures fluctuated throughout the day, with a lower WSC/CP ratio in the morning and higher in the afternoon [43]. Therefore, a significant intake of reduced WSC pastures in the morning may lead to an increase in the N concentration in the urine excreted during the afternoon. Variation in morning and afternoon N concentrations are not likely to affect annual leaching. However, it is important to consider this variation when sampling urine and making comparisons between studies.

3.3. Urination Frequency

There are few data on the average daily urination frequency of sheep under grazing conditions. The available data indicate that urination frequency in sheep varies from 8 to 23 events/day [23,25]. In a field study, the frequency of urination recorded using sensors was between 13 and 23 events/day [23] while ewes grazing pasture and placed in pens for six-hour periods to facilitate the capture of urination data, had a mean urination frequency of 9.7 events/day, with a range of 8 to 12 events/day [25]. However, care is required when interpreting these data and extrapolating to 24 h under grazing conditions, as penning itself could affect frequency. Betteridge et al. [23] reported that the frequency of urination in sheep increased from morning (09:00 h) and reached a maximum in the evening (20:00 h). This variation across the day might be explained by fluctuations in air temperature [23]. In addition, Betteridge et al. [23] mentioned that as foraging activity increases, sheep urinate more frequently during the day than at night [23]. More studies are required to measure the urination frequency of sheep when roaming and grazing pastures.
Table 3. Published equations for predicting daily creatinine excretion (DCE; mg) and urine volume (L/day), including their published ranges (min and max) and calculated DCE values and urine volume using data collected over two years in the authors’ study [41] based on these equations (average, min and max in parentheses).
ReferenceSheep
Description (Number of
Animals)
EquationsLiterature ValuesCalculated Values 1
DCE (mg) 2Urine Volume (L/day)
Daily creatinine excretionDCE (mg)
Brody [44]Ewes (15)Mean daily creatinine excretion (mg) = (12.7 LW0.896) 614.8
(479.1–751.4)
6.7 *
(0.45–17.8)
Langlands [45]Wethers (15)Mean daily creatinine excretion (mg) = 1.825 LW + 305801–14661692
(1354–2039)
18.4 *
(1.23–48.6)
Langlands [45]Ewes (13)Mean daily creatinine excretion (mg) = 1.825 LW + 232728–13931619
(1281–1966)
17.6 *
(1.18–46.8)
Field et al. [46]Ewes (59)Mean daily creatinine excretion (mg) = 18.16 LW + 93.14852–10821473
(1137–1818)
16 *
(1.09–43)
Urine volumeUrine volume (L/day)
McGusty [31]Hoggets (20)Urine output (mL/day) = (−1271.4 *
creatinine concentration (mmol/L)) + 6289.9
3.0–7.0 5.0
(0–10.0)
Jonker et al. [40]Ewes (155)ln urine output (L/day) = 5.474 − 0.8718 ln creatinine concentration (mg/L) + 0.01663 LW1.4–7.6 15.6
(1.7–41.6)
1 Data calculated based on the six published equations; 2 Daily creatinine excretion was calculated using the live weight (LW) of the ewes (mixed ages between 2 and 4 years old) and the creatinine concentration of the spot urine samples collected over two years in the authors’ study [41]; * Calculated   urine   volume   = urinary   creatinine   excretion   mg / kg   daily   of   LW ×   LW   kg creatinine   concentration   mg / deciliter [27].
Table 4. Individual and total urine volume (L/day), urine nitrogen (N) concentration (g N/L), and urinary N excretion (g N/day) of sheep grazing pasture measured at various stages using various techniques.
ReferenceType of SheepMethod of Urine CollectionUrine Volume
(L/day)
Urine N
Concentration (g N/L)
Urinary N Excretion
(g N/day)
New Zealand
Doak [39]WethersOutdoor study (Electrical counters)2.98.68
Ledgard et al. [47]Ram lambsIndoor study (Metabolic crates) 2
Hoogendoorn et al. [24] EweOutdoor study (Airway obstruction) 5.2–9.6
Jonker et al. [28]WethersIndoor study (Metabolic crates) 9.2–20.8
O’Connell et al. [30]Ewe lambsIndoor study (Metabolic crates)2.9–4.6
Lindsay [29]Ewe lambsIndoor study (Metabolic crates)2.5–3.33.0–5.0
McGusty [31]Ewe lambsIndoor study (Metabolic crates)1.7–3.8
Al-Marashdeh et al. [48]Ram lambsOutdoor study (Airway obstruction) 17.8–19.7
Australia
Lynch et al. [49]EwesOutdoor study (Catheters)1.75
UK
Field et al. [46]Ewe 6.0–22.2
Bristow et al. [50]EwesOutdoor study (Polythene buckets) 3.0–13.7
Marsden et al. [25]EwesPartial outdoor study (Pens outside)0.5–6.94.5–7.09.8–26.7
David et al. [27]EweIndoor study (Metabolic crates)2.2–2.7

3.4. Urine Patch Area

Many variables determine the size of the urine patch. These factors include urine volume, soil moisture content, soil surface microtopography, the presence and size of pores open to the soil surface, vegetation cover, slope, and wind [6]. Williams and Haynes [9] used bromide to trace the physical movement of sheep urine through a silt loam to determine the shape and size of the soil volume wetted by urine. They reported that sheep urine moved in both horizontal and vertical directions in the soil profile (the soil water content ranged from 20 to 30%), covering an area of 0.043–0.055 m2, and a maximum depth of 0.15 m [9]. Other studies using 15N-labelled urine reported similar urinary spot areas (0.03–0.05 m2) [39].
If we assume sheep grazing at a set stocking rate of 12 ewes per ha per year, then the area covered in urine spots will be 8.64 m2 (12 ewes × 16 urination × 0.045 m2) after 24 h of grazing. Assuming there is no overlap of urine patches, then after a year of grazing, urine deposition will cover approximately 32% of the pasture area (8.64 m2 × 365 days × 0.0001 ha/m2).

4. Impact of Climate and Pasture Uptake on Nitrate Leaching

Environmental conditions (temperature, soil moisture, and rainfall) and soil characteristics (soil texture, drainage class, and soil temperature) are among the primary factors that determine the magnitude of N losses from animal excreta [51]. Soon after urination, hydrolyses converts urea N to ammonium, and this is mostly completed within 24 h of deposition. Some ammonium may be recovered by plants, lost as ammonia, or immobilised in soil organic matter, but most is nitrified within about two weeks of deposition [51,52].
The quantity of nitrate leached in drainage water depends on the nitrate content in the soil profile, the volume of drainage, and how drainage water moves through the pore volume [53]. The total quantity of drainage is determined principally by climate. In temperate regions, drainage does not typically occur in summer and early autumn, due to the high evaporation rate and lower rainfall, and most leaching occurs over winter and early spring when the volume of drainage is greatest [16]. In general terms, for farms of comparable stocking rate and performance, the magnitude of nitrate leaching will increase with increasing rainfall [54]. As drainage quantity increases, there is more water movement to depth, which will leach nitrate from the profile [13]. This is particularly so for coarse-textured soils where larger quantities of drainage will ‘flush’ the pore space more often than is the case for fine-textured soils [13,42].
In addition, the quantity of nitrate available for leaching is also affected by the interactions between season and climate, plant uptake, soil fertility and fertiliser application, and stocking rate and urination traits [3].
Pasture production in New Zealand peaks in spring due to good soil moisture levels, increasing soil temperatures and increasing day length [55] and is lower during late autumn and winter due to cooler temperatures [56]. The rate at which any particular plant takes up nitrate depends on plant growth rate, the depth and vigour of its roots, soil temperature, and general soil health [35]. When the soil temperature is lower than 7 °C, the growth of forages slows, and the plant’s absorption of N is significantly reduced. If pasture growth is slow and drainage events occur, the potential for nitrate leaching is greater [35]. Thomas et al. [51] measured the fate of sheep urine N (equivalent to 40–52 g N m−2) applied to a grass sward in the United Kingdom (UK) under warm and dry, cool, and cool and wet environmental conditions. They found that when sheep urine was applied under different environmental conditions, the conversion of urine N in the soil followed the same temporal pattern, and nitrate appeared about 14 days after application regardless of season [51]. However, the degree of nitrification varied significantly with the environmental conditions and was greatest under cool conditions when up to 76% of the inorganic soil N was in the form of nitrate, while, in all other environmental conditions, nitrate levels were relatively lower. Although nitrate was relatively low in some circumstances, it was still the major form of inorganic N [51]. Further, Thomas et al. [51] observed that from all the applications, only 10 to 30% of the sheep urine N (at a rate equivalent to 78 kg N/ha) was recovered in pastures. Similarly Ball and Keeney [52] studied the effect of season on average apparent recovery of N in a ryegrass/clover pasture after the application of urine N (at rates equivalent to 300 kg N/ha) under three different environmental conditions (cool–moist, warm–moist, and warm–dry) in New Zealand. They reported that the average recovery rate of urinary N was 30%, with higher (53%) and lower (10%) recovery rates under warm–moist and warm–dry conditions, respectively. A UK study by Cuttle and Bourne [57] mentioned that the recovery percentage of N in the pastures was very low (<0.1%) when urine was applied (equivalent to 300 kg N/ha) in the latter part of autumn. Cuttle and Bourne [57] further reported that approximately 60% (18.6 g N m−2) of applied N (30 g N m−2) was leached under urine treated plots; in contrast, nitrate leaching was negligible (0.7 g N m−2) under untreated plots.

5. Impact of Nitrogen Inputs on Nitrate Leaching

Nitrate leaching under pastoral grazing conditions generally increases with increasing stocking rates and fertiliser rates [58,59]. The direct nitrate leaching of fertiliser N may be low if the timing and rate of fertiliser application are well matched with plant demand [13]. However, additional fertiliser input increases dry matter production, N uptake, and recycling in animal excreta, which leads to an increased risk of N loss to the environment [60]. A recent New Zealand study [18] has shown that nitrate leaching from a sheep-grazed pasture steadily increased as fertiliser N application increased above 100 kg N/ha (Figure 2). It is now prohibited in New Zealand to apply N fertiliser rates above 190 kg N/ha/year to grazed pasture [14]. For sheep pastures, most N application rates would be less than 100 kg N/ha/year; although, as noted, this rate is increasing on some intensively managed farms. However, the high levels of fertiliser N, included in Figure 2, are now not likely to occur in the near future in New Zealand but can be used to compare with nitrate leaching in other temperate countries. In addition, with low to moderate N fertiliser use, urine patches will be the primary source of nitrate leaching. The Parfitt et al. [19] study suggests that, even at a fertiliser rate of 300 kg N/ha, urine patches are still the main source of leaching.
Although there are numerous suggestions that fertiliser application onto urine-affected areas can lead to an increased risk of nitrate leaching and reduce fertiliser N use efficiency [13], few studies have quantitatively investigated the interactions between the concurrent application of fertiliser N and urine N deposition and nitrate leaching [57]. As shown in Figure 3, there is a clear relationship between fertiliser N rate and stocking rate and nitrate leaching. In a six-year study, which compared nitrate leaching from a perennial ryegrass pasture that received 150 to 200 kg/ha fertiliser N to a ryegrass/white clover pasture that received no N fertiliser, there was a positive relationship between stocking rate (15 to 60 lambs/ha) and the quantity of nitrate leached from both treatments during the following winter (Figure 3). Cuttle and Scholefield [21] explained that stocking rate and, therefore, the proportion of pasture affected by excreta were the main factors determining the magnitude of nitrate leaching. This finding matches the calculation made in Section 3.4 (i.e., a greater number of animals leads to more urine patches and more N loss). However, this depends on the seasonality as well; a lot of stock in spring may not have as much influence as a lot of stock in autumn.
It is important to note that New Zealand pastures also receive N from biological N fixation by clovers [1]. The amount of N fixed by legumes per year ranges depending on legume content: with pastures containing 3–40% of white clover fixing N at the rates of 20 to 250 kg N/ha/year [61,62,63]. In a comparative study between sheep grazing a perennial ryegrass/white clover and a perennial ryegrass monoculture without N fertiliser, Field et al. [20] observed that the amount of nitrate leaching under the ryegrass/white clover sward was about 50% greater than that of a perennial ryegrass monoculture sward. A UK study of sheep-grazed pasture compared nitrate leaching under perennial ryegrass/clover pastures (15% clover component) with a perennial ryegrass monoculture fertilised with approximately 200 kg N/ha/year [37]. The monoculture pastures with N fertiliser had slightly higher nitrate leaching, which was attributed to the difference in stocking rates [37,38]. Stocking rates were higher on the fertiliser treatment and, therefore, nitrate leaching rates were also higher on the fertiliser treatments. Cuttle et al. [37] noted that if the stocking rates are similar, nitrate leaching rates are similar under non-fertilised ryegrass/clover pastures and highly N-fertilised (150 to 200 kg N/ha/year) ryegrass monocultures. This suggests that nitrate leaching depends on the amount of N consumed by sheep rather than the source of N (fertiliser N, urinary N, or N fixed by legume). In support of this argument, Cuttle et al. [38] found that the nitrate leaching was similar in non-fertilised ryegrass/clover pastures treatment and highly N-fertilised treatment under similar rates of N inputs regardless of whether they contained clover or not.

6. Effect of Other Forages on Reducing Nitrate Leaching

The use of alternative forage species to minimise or mitigate nitrate leaching from pastoral systems is gaining increasing interest and research attention. Forage species with high rumen utilisable protein (RUP), which diverts more of the dietary N away from urine [64], or forages with high WSC to CP ratios (e.g., high sugar ryegrass) can help to reduce urine N excretion [65]. A growing body of evidence indicates that, compared to perennial ryegrass/white clover swards, the grazing of plantain can help reduce the N concentration in urine, the amount of urea N excretion in urine, and potentially the nitrification and denitrification rates in soils [64,66,67,68,69,70]. The presence of the secondary compounds [71], smaller DM percentage, and higher mineral load (sodium content) of plantain could potentially cause diuresis [66]. The diuretic effect has been shown to reduce urine N concentration in individual urine patches by increasing the frequency of urination in dairy cows [66,68]. Recent indoor feeding studies in New Zealand have also shown that intake of plantain causes greater water diuresis in sheep when compared with a diet of ryegrass [29,30,31]. Sheep that were fed plantain produced 0.8 to 1.9 L (7 to 19%) more urine than sheep that were fed ryegrass [29,30,31]. In addition, Lindsay [29] noted that sheep that were fed plantain had a lower urine N concentration (2.98 g N/L) compared to sheep fed ryegrass (4.97 g N/L). The interactions of the aforementioned factors likely explain the lower N concentration and higher urinary volume produced by the sheep that were fed plantain by Lindsay [29]. However, the effect of secondary compounds on diuresis was not measured in their study. Although several dairy studies have quantified the benefits of plantain to nitrate leaching [32,72], there is currently limited measurement of the effect of plantain on the amount of nitrate leached under sheep grazing.
Italian ryegrass shows greater N uptake during winter due to its faster growth rate and, therefore, reduces nitrate leaching [73,74,75]. Studies with dairy cattle have shown that the N uptake by Italian ryegrass in winter was 1.4 to 1.9 times greater than that of perennial ryegrass, and the nitrate leaching was 20 to 50% lower than that of perennial ryegrass [74,76,77,78]. However, there are few published data on the effects of Italian ryegrass grazing on N leaching under sheep.

7. Summary

This review highlighted existing knowledge of the factors influencing nitrate leaching under sheep grazing pasture systems in New Zealand and other countries and the factors influencing nitrate leaching rates. Further work is required on the following issues:
1.
Quantifying the excretion of N in sheep urine under grazing conditions.
2.
Determining the quantity of nitrate leaching under modern sheep farming systems.
3.
Comparisons of nitrate leaching under alternative pasture species grazed by sheep.
4.
Formulating accurate models to determine farm-level nitrate leaching under commercial sheep grazing systems.

Author Contributions

Conceptualization, S.M.; investigation and supervision, L.M.C., J.P.M., D.J.H., J.A.H., P.R.K. and P.D.K.; writing—original draft preparation, S.M.; writing—review and editing, S.M., L.M.C., J.P.M., D.J.H., J.A.H., P.R.K. and P.D.K. All authors have read and agreed to the published version of the manuscript.

Funding

This research received no external funding.

Institutional Review Board Statement

Not applicable.

Informed Consent Statement

Not applicable.

Acknowledgments

The authors wish to thank D. Burnham for his technical assistance with data collection in their study. We thank the L.A. Alexander Trust, the C. Alma Baker Trust, and Massey University for their financial support.

Conflicts of Interest

The authors have no conflicts of interest with any financial organization regarding the material discussed in the manuscript.

References

  1. Ruz-Jerez, B.; White, R.; Ball, P. A comparison of nitrate leaching under clover-based pastures and nitrogen-fertilized grass grazed by sheep. J. Agric. Sci. 1995, 125, 361–369. [Google Scholar] [CrossRef]
  2. Silva, R.G.; Cameron, K.C.; Di, H.J.; Hendry, T. A lysimeter study of the impact of cow urine, dairy shed effluent, and nitrogen fertiliser on nitrate leaching. Aust. J. Soil Res. 1999, 37, 357–369. [Google Scholar] [CrossRef]
  3. Di, H.J.; Cameron, K.C. Nitrate leaching in temperate agroecosystems: Sources, factors and mitigating strategies. Nutr. Cycl. Agroecosyst. 2002, 64, 237–256. [Google Scholar] [CrossRef]
  4. Houlbrooke, D.J.; Horne, D.J.; Hedley, M.J.; Hanly, J.A.; Snow, V.O. A review of literature on the land treatment of farm-dairy effluent in New Zealand and its impact on water quality. N. Z. J. Agric. Res. 2004, 47, 499–511. [Google Scholar] [CrossRef]
  5. Cuttle, S.P.; Hallard, M.; Gill, E.K.; Scurlock, R.V. Nitrate leaching from sheep-grazed upland pastures in Wales. J. Agric. Sci. 1996, 127, 365–375. [Google Scholar] [CrossRef]
  6. Haynes, R.J.; Williams, P.H. Nutrient Cycling and Soil Fertility in the Grazed Pasture Ecosystem. Adv. Agron. 1993, 49, 119–199. [Google Scholar] [CrossRef]
  7. Monaghan, R.M.; Paton, R.J.; Drewry, J.J. Nitrogen and phosphorus losses in mole and tile drainage from a cattle-grazed pasture in eastern Southland. N. Z. J. Agric. Res. 2002, 45, 197–205. [Google Scholar] [CrossRef]
  8. Garwood, E.; Ryden, J. Nitrate loss through leaching and surface runoff from grassland: Effects of water supply, soil type and management. In Nitrogen Fluxes in Intensive Grassland Systems; van der Meer, H.G., Ryden, J.C., Ennik, G.C., Eds.; Springer: Dordrecht, The Netherlands, 1986; pp. 99–113. [Google Scholar]
  9. Williams, P.; Haynes, R. Comparison of initial wetting pattern, nutrient concentrations in soil solution and the fate of 15 N-labelled urine in sheep and cattle urine patch areas of pasture soil. Plant Soil. 1994, 162, 49–59. [Google Scholar] [CrossRef]
  10. Wachendorf, C.; Taube, F.; Wachendorf, M. Nitrogen leaching from N-15 labelled cow urine and dung applied to grassland on a sandy soil. Nutr. Cycl. Agroecosyst. 2005, 73, 89–100. [Google Scholar] [CrossRef]
  11. Hoogendoorn, C.J.; Betteridge, K.; Ledgard, S.F.; Costall, D.A.; Park, Z.A.; Theobald, P.W. Nitrogen leaching from sheep-, cattle- and deer-grazed pastures in the Lake Taupo catchment in New Zealand. Anim. Prod. Sci. 2011, 51, 416–425. [Google Scholar] [CrossRef]
  12. Morris, S.T.; Kenyon, P.R. Intensive sheep and beef production from pasture-a New Zealand perspective of concerns, opportunities and challenges. Meat Sci. 2014, 98, 330–335. [Google Scholar] [CrossRef] [PubMed]
  13. Cameron, K.C.; Di, H.J.; Moir, J.L. Nitrogen losses from the soil/plant system: A review. Ann. Appl. Biol. 2013, 162, 145–173. [Google Scholar] [CrossRef]
  14. Ministry for the Environment. National Policy Statement for Freshwater Management. 2020. Available online: https://environment.govt.nz/publications/national-policy-statement-for-freshwater-management-2020 (accessed on 10 May 2021).
  15. Heng, L.K.; White, R.E.; Bolan, N.S.; Scotter, D.R. Leaching losses of major nutrients from a mole-drained soil under pasture. N. Z. J. Agric. Res. 1991, 34, 325–334. [Google Scholar] [CrossRef]
  16. Magesan, G.; White, R.; Scotter, D. Nitrate leaching from a drained, sheep-grazed pasture. I. Experimental results and environmental implications. Soil Res. 1996, 34, 55–67. [Google Scholar] [CrossRef]
  17. White, R.E.; Heng, L.K.; Magesan, G.N. Nitrate leaching from a drained, sheep-grazed pasture. II. Modelling nitrate leaching losses. Aust. J. Soil Res. 1998, 36, 963–977. [Google Scholar] [CrossRef]
  18. Hoogendoorn, C.J.; Lambert, M.G.; Devantier, B.P.; Theobald, P.W.; Park, Z.A. Nitrogen fertiliser application rates and nitrogen leaching in intensively managed sheep grazed hill country pastures in New Zealand. N. Z. J. Agric. Res. 2017, 60, 154–172. [Google Scholar] [CrossRef]
  19. Parfitt, R.; Mackay, A.; Ross, D.; Budding, P. Effects of soil fertility on leaching losses of N, P and C in hill country. N. Z. J. Agric. Res. 2009, 52, 69–80. [Google Scholar] [CrossRef] [Green Version]
  20. Field, T.; Ball, P.R.; Theobald, P. Leaching of nitrate from sheep-grazed pastures. In Proceedings of the New Zealand Grassland Association, Lincoln, New Zealand, 12–15 May 1985; pp. 209–214. [Google Scholar]
  21. Cuttle, S.P.; Scholefield, D. Management options to limit nitrate leaching from grassland. J. Contam. Hydrol. 1995, 20, 299–312. [Google Scholar] [CrossRef]
  22. Shepherd, M.; Lucci, G. A review of the effect of autumn nitrogen fertiliser on pasture nitrogen concentration and an assessment of the potential effects on nitrate leaching risk. Proc. N. Z. Grassl. Assoc. 2013, 75, 197–202. [Google Scholar]
  23. Betteridge, K.; Costall, D.; Balladur, S.; Upsdell, M.; Umemura, K. Urine distribution and grazing behaviour of female sheep and cattle grazing a steep New Zealand hill pasture. Anim. Prod. Sci. 2010, 50, 624–629. [Google Scholar] [CrossRef]
  24. Hoogendoorn, C.J.; Betteridge, K.; Costall, D.A.; Ledgard, S.F. Nitrogen concentration in the urine of cattle, sheep and deer grazing a common ryegrass/cocksfoot/white clover pasture. N. Z. J. Agric. Res. 2010, 53, 235–243. [Google Scholar] [CrossRef]
  25. Marsden, K.A.; Lush, L.; Holmberg, J.A.; Whelan, M.J.; King, A.J.; Wilson, R.P.; Charteris, A.F.; Cardenas, L.M.; Jones, D.L.; Chadwick, D.R. Sheep urination frequency, volume, N excretion and chemical composition: Implications for subsequent agricultural N losses. Agric. Ecosyst. Environ. 2020, 302, 107073. [Google Scholar] [CrossRef]
  26. Li, F.Y.; Betteridge, K.; Cichota, R.; Hoogendoorn, C.J.; Jolly, B. Effects of nitrogen load variation in animal urination events on nitrogen leaching from grazed pasture. Agric. Ecosyst. Environ. 2012, 159, 81–89. [Google Scholar] [CrossRef]
  27. David, D.B.; Poli, C.H.E.C.; Savian, J.V.; Amaral, G.A.; Azevedo, E.B.; Jochims, F. Urinary creatinine as a nutritional and urinary volume marker in sheep fed with tropical or temperate forages. Arq. Bras. Med. Vet. Zootec. 2015, 67, 1009–1015. [Google Scholar] [CrossRef] [Green Version]
  28. Jonker, A.; Cheng, L.; Edwards, G.; Molano, G.; Taylor, P.; Sandoval, E.; Cosgrove, G. Nitrogen partitioning in sheep offered three perennial ryegrass cultivars at two allowances in spring and autumn. In Proceedings of the New Zealand Society of Animal Production, Dunedin, New Zealand, 28 June–1 July 2015; pp. 74–78. [Google Scholar]
  29. Lindsay, G. An Investigation of the Effects of Plantain (Plantago lanceolata) Ingestion on Kidney Function in Sheep. Bachelor’s Thesis, Lincoln University, Lincoln, New Zealand, 2016. [Google Scholar]
  30. O’Connell, C.; Judson, H.; Barrell, G.K. Sustained diuretic effect of plantain when ingested by sheep. In Proceedings of the New Zealand Society of Animal Production, Adelaide, Australia, 4–7 July 2016. [Google Scholar]
  31. McGusty, A. An Investigation into the Effect of Sodium Content in Plantain (Plantago lanceolata) on Urine Production in Sheep. Bachelor’s Thesis, Lincoln University, Lincoln, New Zealand, 2017. [Google Scholar]
  32. Marshall, C.; Beck, M.; Garrett, K.; Barrell, G.; Al-Marashdeh, O.; Gregorini, P. Grazing dairy cows with low milk urea nitrogen breeding values excrete less urinary urea nitrogen. Sci. Total Environ. 2020, 739, 139994. [Google Scholar] [CrossRef] [PubMed]
  33. Lush, L.; Wilson, R.P.; Holton, M.D.; Hopkins, P.; Marsden, K.A.; Chadwick, D.R.; King, A.J. Classification of sheep urination events using accelerometers to aid improved measurements of livestock contributions to nitrous oxide emissions. Comput. Electron. Agric. 2018, 150, 170–177. [Google Scholar] [CrossRef] [Green Version]
  34. Monaghan, R.M.; Cameron, K.C.; Mclay, C.D.A. Leaching Losses of Nitrogen from Sheep Urine Patches. N. Z. J. Agric. Res. 1989, 32, 237–244. [Google Scholar] [CrossRef]
  35. Di, H.J.; Cameron, K.C. Nitrate leaching losses and pasture yields as affected by different rates of animal urine nitrogen returns and application of a nitrification inhibitor—A lysimeter study. Nutr. Cycl. Agroecosyst. 2007, 79, 281–290. [Google Scholar] [CrossRef]
  36. Melland, A.R.; Mc Caskill, M.R.; White, R.E.; Chapman, D.F. Loss of phosphorus and nitrogen in runoff and subsurface drainage from high and low input pastures grazed by sheep in southern Australia. Aust. J. Soil Res. 2008, 46, 161–172. [Google Scholar] [CrossRef]
  37. Cuttle, S.P.; Hallard, M.; Daniel, G.; Scurlock, R.V. Nitrate Leaching from Sheep-Grazed Grass Clover and Fertilized Grass Pastures. J. Agric. Sci. 1992, 119, 335–343. [Google Scholar] [CrossRef]
  38. Cuttle, S.P.; Scurlock, R.V.; Davies, B.M.S. A 6-year comparison of nitrate leaching from grass/clover and N-fertilized grass pastures grazed by sheep. J. Agric. Sci. 1998, 131, 39–50. [Google Scholar] [CrossRef] [Green Version]
  39. Doak, B. Some chemical changes in the nitrogenous constituents of urine when voided on pasture. J. Agric. Sci 1952, 42, 162–171. [Google Scholar] [CrossRef]
  40. Jonker, A.; Cheng, L.; Sun, X. Using urinary creatinine to predict daily urine output in sheep fed fresh forages. Anim.-Sci. Proc. 2021, 12, 24. [Google Scholar] [CrossRef]
  41. Maheswaran, S.; Cranston, L.M.; Millner, J.P.; Horne, D.J.; Hanly, J.A.; Kenyon, P.R.; Kemp, P.D.; (School of Agriculture and Environment, Massey University, Private Bag 11-222, Palmerston North 4442, New Zealand). Nutrient leaching under sheep grazing systems. Unpublished work. 2022. [Google Scholar]
  42. Selbie, D.R.; Buckthought, L.E.; Shepherd, M.A. The Challenge of the Urine Patch for Managing Nitrogen in Grazed Pasture Systems. Adv. Agron. 2015, 129, 229–292. [Google Scholar] [CrossRef]
  43. Avondo, M.; Bonanno, A.; Pagano, R.I.; Valenti, B.; Di Grigoli, A.; Alicata, M.L.; Galofaro, V.; Pennisi, P. Milk quality as affected by grazing time of day in Mediterranean goats. J. Dairy Res. 2008, 75, 48–54. [Google Scholar] [CrossRef] [PubMed]
  44. Brody, S. Bioenergetics and Growth, with Special Reference to the Efficiency Complex in Domestic Animals; Reinhold Publishing Corporation: New York, NY, USA, 1945. [Google Scholar]
  45. Langlands, J. Creatinine as an index substance for estimating the urinary excretion of nitrogen and potassium by grazing sheep. Aust. J. Agric. Res. 1966, 17, 757–763. [Google Scholar] [CrossRef]
  46. Field, A.; Sykes, A.; Gunn, R. Effects of age and state of incisor dentition on faecal output of dry matter and on faecal and urinary output of nitrogen and minerals, of sheep grazing hill pastures. J. Agric. Sci. 1974, 83, 151–160. [Google Scholar] [CrossRef]
  47. Ledgard, S.F.; Menneer, J.C.; Dexter, M.M.; Kear, M.J.; Lindsey, S.; Peters, J.S.; Pacheco, D. A novel concept to reduce nitrogen losses from grazed pastures by administering soil nitrogen process inhibitors to ruminant animals: A study with sheep. Agr. Ecosyst. Environ. 2008, 125, 148–158. [Google Scholar] [CrossRef]
  48. Al-Marashdeh, O.; Cook, G.A.; Anderson, F.C.; Meyer, J.; Logan, C.M.; Edwards, G.; Maxwell, T.M. Liveweight gain and urinary nitrogen excretion of lambs grazing diverse (plantain, Italian ryegrass and red clover) or ryegrass-white clover pasture in autumn. N. Z. Soc. Anim. Prod. 2020, 80, 70–75. [Google Scholar]
  49. Lynch, J.J.; Marjoram, A.R.; Mottershead, B.E. Measurement of urine flow from grazing sheep. Med. Biol. Eng. 1973, 11, 621–627. [Google Scholar] [CrossRef]
  50. Bristow, A.W.; Whitehead, D.C.; Cockburn, J.E. Nitrogenous Constituents in the Urine of Cattle, Sheep and Goats. J. Sci. Food Agric. 1992, 59, 387–394. [Google Scholar] [CrossRef]
  51. Thomas, R.J.; Logan, K.A.B.; Ironside, A.D.; Bolton, G.R. Transformations and Fate of Sheep Urine-N Applied to an Upland Uk Pasture at Different Times during the Growing-Season. Plant Soil. 1988, 107, 173–181. [Google Scholar] [CrossRef]
  52. Ball, P.; Keeney, D. Nitrogen losses from urine-affected areas of a New Zealand pasture, under contrasting seasonal conditions [Grazing ruminants, Lolium perenne, Trifolium repens]. In Proceedings of the XIV International Grassland Congress, Lexington, KY, USA, 15–24 June 1983; pp. 342–344. [Google Scholar]
  53. White, R.E.; Magesan, G.N. A Stochastic-Empirical Approach to Modeling Nitrate Leaching. Soil Use Manag. 1991, 7, 85–94. [Google Scholar] [CrossRef]
  54. Monaghan, R.; Semadeni-Davies, A.; Muirhead, R.; Elliott, S.; Shankar, U. Land Use and Land Management Risks to Water Quality in Southland; Agresearch: Southland, New Zealand, 2010; pp. 1–85. [Google Scholar]
  55. Matthews, P. Livestock farming systems in New Zealand. In New Zealand Pasture and Crop Science; Hodgson, J., White, J., Eds.; Oxford University Press: Auckland, New Zealand, 1999; pp. 101–116. [Google Scholar]
  56. Matthews, P.; Harrington, K.; Hampton, J. Management of grazing systems. In New Zealand Pasture and Crop Science; Oxford University Press: Auckland, New Zealand, 1999; pp. 153–174. [Google Scholar]
  57. Cuttle, S.P.; Bourne, P.C. Uptake and Leaching of Nitrogen from Artificial Urine Applied to Grassland on Different Dates during the Growing-Season. Plant Soil. 1993, 150, 77–86. [Google Scholar] [CrossRef]
  58. Barraclough, D.; Jarvis, S.C.; Davies, G.P.; Williams, J. The Relation between Fertilizer Nitrogen Applications and Nitrate Leaching from Grazed Grassland. Soil Use Manag. 1992, 8, 51–56. [Google Scholar] [CrossRef]
  59. Garrett, M.K.; Watson, C.; Jordan, C.; Steen, R.; Smith, R. Nitrogen economy of grazed grassland. In Proceedings of the Fertiliser Society, No. 326, Cambridge, UK, 16–17 December 1992; p. 32. [Google Scholar]
  60. Hatch, D.J.; Goodlass, G.; Joynes, A.; Shepherd, M.A. The effect of cutting, mulching and applications of farmyard manure on nitrogen fixation in a red clover/grass sward. Bioresour. Technol. 2007, 98, 3243–3248. [Google Scholar] [CrossRef]
  61. Crush, J.R.; Cosgrove, G.P.; Brougham, R.W. Nitrogen-Fixation during 1979–81 in 2 Pastures on the Manawatu Plains. N. Z. J. Exp. Agric. 1983, 11, 17–20. [Google Scholar] [CrossRef]
  62. Goh, K.M.; Mansur, I.; Mead, D.J.; Sweet, G.B. Biological nitrogen fixing capacity and biomass production of different understorey pastures in a Pinus radiata pasture agroforestry system in New Zealand. Agrofor. Syst. 1996, 34, 33–49. [Google Scholar] [CrossRef]
  63. Kumar, K.; Goh, K.M. Biological nitrogen fixation, accumulation of soil nitrogen and nitrogen balance for white clover (Trifolium repens L.) and field pea (Pisum sativum L.) grown for seed. Field Crops Res. 2000, 68, 49–59. [Google Scholar] [CrossRef]
  64. Woodward, S.; Waghorn, G.; Bryant, M.; Benton, A. Can diverse pasture mixtures reduce nitrogen losses? In Proceedings of the Australasian Dairy Science Symposium, Melbourne, Australia, 13–15 November 2012; pp. 463–464. [Google Scholar]
  65. De Klein, C.A.M.; van der Weerden, T.J.; Luo, J.; Cameron, K.C.; Di, H.J. A review of plant options for mitigating nitrous oxide emissions from pasture-based systems. N. Z. J. Agric. Res. 2019, 63, 29–43. [Google Scholar] [CrossRef]
  66. Box, L.; Edwards, G.; Bryant, R. Milk production and urinary nitrogen excretion of dairy cows grazing perennial ryegrass-white clover and pure plantain pastures. In Proceedings of the New Zealand Society of Animal Production, Adelaide, Australia, 4–7 July 2016; pp. 18–21. [Google Scholar]
  67. Navarrete, S.; Kemp, P.D.; Pain, S.J.; Back, P. Bioactive compounds, aucubin and acteoside, in plantain (Plantago lanceolata L.) and their effect on in vitro rumen fermentation. Anim. Feed Sci. Technol. 2016, 222, 158–167. [Google Scholar] [CrossRef]
  68. Cheng, L.; Mccormick, J.; Hussein, A.N.; Logan, C.; Pacheco, D.; Hodge, M.C.; Edwards, G.R. Live weight gain, urinary nitrogen excretion and urination behaviour of dairy heifers grazing pasture, chicory and plantain. J. Agric. Sci. 2017, 155, 669–678. [Google Scholar] [CrossRef]
  69. Gardiner, C.A.; Clough, T.J.; Cameron, K.C.; Di, H.J.; Edwards, G.R.; de Klein, C.A.M. Potential inhibition of urine patch nitrous oxide emissions by Plantago lanceolata and its metabolite aucubin. N. Z. J. Agric. Res. 2018, 61, 495–503. [Google Scholar] [CrossRef]
  70. Bryant, R.H.; Snow, V.O.; Shorten, P.R.; Welten, B.G. Can alternative forages substantially reduce N leaching? Findings from a review and associated modelling. N. Z. J. Agric. Res. 2020, 63, 3–28. [Google Scholar] [CrossRef]
  71. Deaker, J. Carcass, liver and kidney characteristics of lambs grazing plantain (Plantago lanceolata), chicory (Cichorium intybus), white clover (Trifolium repens) or perennial ryegrass (Lolium perenne). In Proceedings of the New Zealand Society of Animal Production. 1994, pp. 197–200. Available online: http://www.nzsap.org/proceedings/1994/carcass-liver-and-kidney-characteristics-lambs-grazing-plantain-plantago-lanceolata (accessed on 10 May 2021).
  72. Box, L.A.; Edwards, G.R.; Bryant, R.H. Milk production and urinary nitrogen excretion of dairy cows grazing plantain in early and late lactation. N. Z. J. Agric. Res. 2017, 60, 470–482. [Google Scholar] [CrossRef]
  73. Moir, J.L.; Malcolm, B.J.; Cameron, K.C.; Di, H.J. The effect of dicyandiamide on pasture nitrate concentration, yield and N offtake under high N loading in winter and spring. Grass Forage Sci. 2012, 67, 391–402. [Google Scholar] [CrossRef]
  74. Malcolm, B.J.; Cameron, K.C.; Di, H.J.; Edwards, G.R.; Moir, J.L. The effect of four different pasture species compositions on nitrate leaching losses under high N loading. Soil Use Manag. 2014, 30, 58–68. [Google Scholar] [CrossRef]
  75. Malcolm, B.; Moir, J.; Cameron, K.; Di, H.; Edwards, G. Influence of plant growth and root architecture of Italian ryegrass (Lolium multiflorum) and tall fescue (Festuca arundinacea) on N recovery during winter. Grass Forage Sci. 2015, 70, 600–610. [Google Scholar] [CrossRef]
  76. Moir, J.L.; Edwards, G.R.; Berry, L.N. Nitrogen uptake and leaching loss of thirteen temperate grass species under high N loading. Grass Forage Sci. 2013, 68, 313–325. [Google Scholar] [CrossRef]
  77. Woods, R.R.; Cameron, K.C.; Edwards, G.R.; Di, H.J.; Clough, T.J. Effects of forage type and gibberellic acid on nitrate leaching losses. Soil Use Manag. 2016, 32, 565–572. [Google Scholar] [CrossRef]
  78. Maxwell, T.M.R.; McLenaghen, R.D.; Edwards, G.R.; Di, H.J.; Cameron, K.C. Italian ryegrass swards reduce N leaching via greater N uptake and lower drainage over perennial ryegrass cultivars varying in cool season growth rates. N. Z. J. Agric. Res. 2019, 62, 69–82. [Google Scholar] [CrossRef]
Figure 1. Nitrogen (N) transfer in a sheep grazing system, for one day’s grazing assuming 533 sheep/ha ingesting 800 kg DM pasture @ 2.5% N. Based on Haynes and Williams [6].
Agriculture 12 00758 g001
Figure 2. Nitrate leached from sheep-grazed pasture systems under different nitrogen (N) fertiliser rates. Data adapted from Hoogendoorn et al. [18].
Agriculture 12 00758 g002
Figure 3. Relationship between quantities of annual nitrate nitrogen (N) leached and mean stocking rates (post-weaning) for a ryegrass sward receiving 150 to 200 kg/ha fertiliser N (open symbols) and a non-fertilised grass/clover sward (solid symbols): 1987–1993 (Cuttle et al. [37]; Adapted from Cuttle and Scholefield [21].
Agriculture 12 00758 g003
Publisher’s Note: MDPI stays neutral with regard to jurisdictional claims in published maps and institutional affiliations.

