Article

Physiological and Biochemical Parameters of Leaves for Evaluation of the Potato Yield

1
Samara Federal Research Scientific Center RAS, Institute of Ecology of the Volga Basin RAS, 10, Komzina, 445003 Togliatti, Russia
2
Samara Federal Research Scientific Center RAS, Samara Scientific Research Agriculture Institute Named after N.M. Tulajkov, 446254 Bezenchuk, Russia
*
Author to whom correspondence should be addressed.
Agriculture 2022, 12(6), 757; https://doi.org/10.3390/agriculture12060757
Submission received: 20 April 2022 / Revised: 24 May 2022 / Accepted: 25 May 2022 / Published: 26 May 2022

Abstract

:
The aim of the study was to investigate the morphological, physiological, and biochemical parameters of leaves to evaluate the yield of Solanum tuberosum L. We conducted 3-year experiments with 24 varieties of potatoes, differing in ripeness groups (early ripening, mid-early ripening and mid ripening). Plant height, linear dimensions, number of stomata per unit leaf area as well as content of pigments, proline, membrane lipids and proteins, and the level of lipid per oxidation in the leaves of each variety were investigated. A 3D modeling method showed the yield of early varieties negatively correlated with an increase in temperatures (R = –0.97). The soil moisture content positively correlated with the yield of medium-early varieties (R = 0.97). The soil moisture content and the tuber numbers in mid-season varieties had a negative correlation (R = –0.96). The regulation mechanisms of processes in cells depend on the ripening time of a variety. In order to increase productivity and to improve the potato quality, it is necessary to take into account the peculiarities of the regional climatic conditions and use the varieties of a certain ripening group. Our data refine the understanding of the relationship between the potato above-ground mass and the yield of tubers.

1. Introduction

The potato is one of the most valuable agricultural crops, playing an important role in human nutrition and food security in many countries [1]. It has conventionally been classified as a cold-season crop [2]. The effective air temperature range for its above-ground mass growth is 18–25 °C, and the soil temperature optimum for tuber growth is 17–19 °C [3]. The high temperature regime and the moisture deficiency promote stressful conditions both at the stages of seedlings and tuber formation [4,5]. For example, under heat stress, the photosynthetic activity decreases [6,7], growth and development of above-ground mass slow down [8,9], and tuber formation and development are inhibited [10]. Potato is sensitive to drought because of the shallow root system location [11,12]. The drought as well as the heat stress slow the growth of above-ground potato mass [13], shorten the growth cycle [14], and reduce the number [15] and mass of tubers [5,16]. Thus, the environmental factors can lead to a sharp decline in the economic potato yield [9,17].
Yield formation is integrated function of plants based on genetically determined growth and development processes [18]. The rate of growth and the size of the leaf area are important for the accumulation of economically useful biomass and the formation of the potato crop [4,19]. Morphological and physiological parameters of potato leaves are closely related to the main metabolic processes [20,21]. The photosynthesis efficiency depends on the pigment content and the supply of CO2 through the stomata [22,23]. Photosynthetic pigments provide the adsorption of light quanta and the stomata regulate the CO2 incoming rate and the loss of water due to transpiration. The pigments are integrated into chloroplast membranes and bind to proteins. Their quantitative content and ratio in a leaf may reflect the adaptation features of the photosynthetic apparatus [24]. Lipids ensure the membrane integrity and the functional activity of membrane proteins (MP). Membrane glycolipids (GL) and phospholipids (PL) are involved in ionic homeostasis, electron transport and other processes [25,26].
Because of stress caused by excess heat or water deficiency, the production of various types of reactive oxygen species (ROS) is activated in plant cells, which can cause significant damage to membranes, DNA, and proteins [27]. Excessive ROS accumulation is regulated by the activity of the antioxidant system including enzymatic and low molecular antioxidants [28,29,30].
The adverse consequences of stress can be mitigated by the selection of highly resistant crops using different genetic or biotechnological approaches [9]. For this, it is necessary to have a deep understanding of the physiological and biochemical characteristics of particular groups and genotypes of potato [21,26,31].
The aim of the current study was to investigate the morphological, physiological, and biochemical parameters of leaves for evaluation yield of Solanum tuberosum L. in the conditions of the Middle Volga region of Russia.

2. Materials and Methods

2.1. Objects of Study and Growing Conditions

The study was carried out in a central part of the Middle Volga region of Russia. The type of climate is moderately continental. It is characterized by cold winters with little snow, short springs and autumns, and hot, dry summers. The average temperature in July, as the hottest month, is +21 °C and January, as the coldest month, is −13.5 °C. There are 300 mm of precipitation falling annually, while evaporation is about 700 mm. The objects of investigation were potato plants (S. tuberosum) of various ripening groups: early variety (‘Barin’, ‘Korchma’, ‘Kupets’, ‘Terra’, ‘Udacha’), medium-early variety (‘Calibr’, ‘Grand’, ‘Debut’, ‘Krasa Meshchery’, ‘Krasavchik’, ‘Narymskaya nochka’, ‘Serdolik’, ‘Sudarynya’, ‘Tretyakovka’, ‘Elixred’), mid-season (‘Augustine’, ‘Brusnica’, ‘Kumach’, ‘Varyag’, ‘Zhigulevskiy’, ‘Severnoye siyanie’, ‘Siverskiy’, ‘Signal’, ‘Utro’). The experiments were conducted on the fields of Samara Scientific Research Agricultural Institute, a branch of Samara Federal Research Scientific Center of the Russian Academy of Sciences (53°03′ N, 49°25′ E) in 2019–2021. Each variety was set in two rows with the spacing at 60 cm and the distance between plants at 35 cm. There were four repetitions with 50 tubers each. Tubers were planted on 12 and 13 May. The soil was terraced chernozem, ordinary, low-humus, medium-thick, and heavy loamy. Field experiments were carried out on plots of 500 m2 in a crop rotation (forecrop was spring wheat) using conventional agricultural technologies without fertilisation and additional irrigation at natural day length. In May, the photoperiod averages 15 h 6 min, in June, it is 16 h 44 min, in July, it is 16 h 2 min, and in August it is 14 h 6 min.

2.2. Research Methodology

2.2.1. Growth and Yield Parameters

Tubers were harvested simultaneously for all potato varieties in the first ten days of September. The yield of each variety was estimated by the mass of tubers per plant (g), the number of tubers per plant (pieces) and the total yield (t/ha). The morphological indicators of the above-ground mass were measured on ten randomly selected plants of each variety. The plant height was estimated on the 50th and 60th days after planting on a meter scale for each variety from the soil level to the top of the sprout. When the plant was fully developed, the number of stems was summed up. The growth dynamics was assessed by the growth of the above-ground part of each variety from 50th to 60th days from planting. The linear dimensions were measured in 10 lateral leaf lobes of the plants.

2.2.2. Plant Material

For physiological and biochemical analyses, fully developed leaves of the middle part of the stem of three random plants of each variety were selected. Leaf samples were taken in the middle of the day at 14:00 in the phase of full flowering of plants (July) and leaf wilting (August). Samples of 0.1–0.5 g were combined from the average weight of each biological experiment in three replicates depending on the type of analysis. The material was fixed with liquid nitrogen immediately after it was separated from the plant and weighed. To evaluate the number of stomata, the middle part of the leaves was fixed in a 3.5% solution of glutaraldehyde (Novokhim, Tomsk, Russia) in phosphate buffer (pH = 7.4) and stored in a refrigerator at 8 °C. The leaf area (cm2) was estimated by photographing fresh leaves (3 pieces taken from 10–15 random plants) and computer analyser Simagis Mesoplant™ (SIAMS, Yekaterinburg, Russia).
The study of stomata was conducted by the imprint method. Epidermal casts were preliminary viewed with a Leica DMLS microscope (Leica Microsystems, Wetzlar, Germany), then photographed by an Axioskop-40 microscope using an AxioCam HRs built-in camera (Zeiss, Jena, Germany). The number of stomata on the leaf epidermal sections was counted in 20 repetitions by light microscopy method (PZO Warszawa SK14, Warsaw, Poland).

2.2.3. Physiological Parameters of Leaves

The water content was evaluated after drying the fresh weight of the leaves to constant weight at a temperature of 60 °C and expressed as a percentage of the fresh weight.
To determine the content of photosynthetic pigments, leaves (0.5 g of fresh weight) were homogenized in a porcelain mortar by hand with 5 mL of 80% acetone. The homogenate was washed with acetone several times until complete discoloration. The extract was filtered through a glass filter. The final extract volume in which the quantity of chlorophyll a, b and carotenoids was determined, was 50 mL. The pigment content was detected spectrophotometrically at λ 662, 645 and 470 nm (Shanghai Mapada Instruments Co., Shanghai, China). The chlorophyll a, b, and carotenoids concentrations were carried out according to the recommendations of [32].
The intensity of lipid peroxidation (LPO) in plant leaves was detected by the accumulation of malondialdehyde and its reaction with thiobardituric acid at λ 532 nm using PE-3000-UV spectrophotometer (Shanghai Mapada Instruments Co., Shanghai, China) [33]. Plant leaves (0.5 g fresh weight) were homogenised in a porcelain mortar by hand with isolation medium (0.1 M tris-HCl buffer pH = 7.6 containing 0.35 M NaCl). Then, 2 mL of 0.5% thiobarbituric acid in 20% trichloracetic was added to 3 mL of homogenate and incubated in a boiling water bath for 30 min. Then, the solution was cooled, filtered, and the optical density of the filtrate was measured comparing with the control (isolation medium + reagent).

2.2.4. Lipid Analysis

Lipids were extracted with a mixture of chloroform and methanol (1:2) with simultaneous mechanical destruction of tissues [34]. Separation of lipids was carried out by thin layer chromatography. The amount of membrane PL and GL was detected by densitometric method using the Denscan-04 program (Lenchrome, Saint Petersburg, Russia). The chromatograms were analysed in a parabolic approximation mode according to the calibration dependences using phosphatitylcholine and monogalactosyldiacylglycerol as standards (Sigma-Aldrich, Steinheim, Germany).

2.2.5. Protein Analysis

When analysing the protein content, the leaves were homogenised in a porcelain mortar in the cold with 5 mL of phosphate buffer that refers to a mild method of isolation. The homogenate was centrifuged for 15 min at 8000× g. The supernatant was separated from the sediment, the volume was adjusted to 10 mL and used for the quantative determination of water soluble proteins (WP). The precipitate was added to 10 mL of 0.05% Triton X 100 (Panreac, Barcelona, Spain) in phosphate buffer, mixed and kept for 1 day at 4 °C for the extraction of MP. The amount of WP and MP was detected according to the [35] on a spectrophotometer (Shanghai Mapada Instruments Co., Shanghai, China) at λ = 750 nm using calibration curves with a standard solution of bovine serum albumin (Calbiochem, Darmstadt, Germany) prepared in phosphate buffer, pH = 7.4.

2.2.6. Proline Analysis

The free proline content was estimated in the leaf dry weight using the acid ninhydrin reagent prepared without heating (1.25 g of ninhydrate + 30 mL of glacial acetic acid + 20 mL of 6 M H3PO4). A portion of dry plant tissue (20–25 mg) was charged with 3 mL of boiling distilled water and kept for 10 min in a water bath at 100 °C. Then, 2 mL of glacial acetic acid and 2 mL of ninhydrin reagent were added to a clean tube together with 2 mL of prepared extract. The samples were incubated for 20 min in a water bath at a temperature of 100 °C, and then they were quickly cooled to room temperature. After the artificial cooling (cold water or ice), the optical density of the reaction products was measured at a wavelength of 520 nm on a spectrophotometer (Shanghai Mapada Instruments Co., Shanghai, China) in cuvettes with an absorbing layer thickness of 10 mm [36]. The proline content values were calculated with the help of a calibration curve using chemically pure proline (Sigma-Aldrich, Steinheim, Germany) for its construction. The results were figured out per 1 g of dry weight.

2.3. Statistical Analysis of the Data

Field experiments were established in three years, 2019, 2020, and 2021, in a completely randomized design. Each variety was set in two rows with the spacing at 60 cm and the distance between plants at 35 cm. There were four repetitions with 50 tubers each. The analysis of each component was performed three times in each biological sample. The results are presented in the figures as mean values of the parameter for a group of plants (Mean), their standard errors (SE), maximum (Max) and minimum (Min) values. The data from table was reported as the means with SE. Additionally, the Spearman’s correlation analysis was conducted. Comparison of quantitative characteristics of data was performed using the analysis of variance (one-way ANOVA) followed by the use of Tukey’s test to compare means with a significance level of p ≤ 0.05. The calculations were performed using Statistica 6.0 for Windows, Microsoft Excel 2007, Past 3, Statgraphics Centurion XVI programs.

3. Results

3.1. Environmental Conditions

During the study period of three years, the weather conditions differed in temperature regime and the amount of precipitation (Figure 1). The average daytime air temperature from the first plant sprouts to harvest in 2019 and 2020 was 26 °C. In 2021, it increased to 29 °C. The hottest months were June (2019), July (2020), and August (2021), when the average air temperatures were 27, 31 and 32 °C, respectively (Figure 1a). On particular days, the air temperature reached 33 °C (June 2019) and 36 °C (July 2020). The amount of precipitation was erratic during one growing season and in different years of research. Thus, during the periods of tuber setting and mass growth, the greatest amount of precipitation was detected in 2021 and the least in 2019 (Figure 1b). The growing season of 2019 was characterized by a large amount of precipitation that fell in July. Weather conditions affected the soil moisture in different periods of the study, which ranged from 5 to 23% of the fresh weight of the soil (Figure 1c).

3.2. Potato Yield and Its Components

The average values of potato yields in various ripening groups differed within the interval 14.2–25.7 t/ha. The highest yield was in 2019 (Table 1). The average potato yield in the studied groups did not have significant differences. Each group contained both low- and high-productive potato varieties. We found a decrease in the yield of potatoes of all ripening groups with changes in vegetation conditions. However, while for early varieties, the yield losses amounted to 13%, for medium-early variety and mid-season, they reached 32–43%.
In all groups, a decrease in the tuber mass and an increase in their number were observed. The correlation analysis use made it possible identifies the yield formation peculiarities for different potato varieties, depending on the weather conditions of the year. It was found that the yield (t/ha) of early and mid-season varieties was negatively correlated (R = −0.97, p = 0.04) with an average temperature increase from May to August. The soil moisture content at a depth of 20 cm was positively correlated with the yield of medium-early varieties (R = 0.97, p = 0.04). Early varieties had a negative correlation with average air temperatures (R = −0.95, p = 0.04). An increase in the soil moisture content favourably affected the average tuber weight (R = 0.98, p = 0.04) especially in the varieties of the medium-early and mid-season groups.

3.3. Potato Plant Growth

Growth parameters were evaluated by plant height, number of stems, and leaf area. The average plant height was 44–48 cm and had no significant differences between the ripening groups (Figure 2a). The number of stems per plant increased in the row: early → medium-early → mid-season varieties (Figure 2b). Together with the number of stems, the plants differed in the amount of the leaf mass. The leaf area in plants of mid-season varieties was 15% less compared to medium-early and early varieties (Figure 2c). The growth rate of above-ground biomass in varieties with later ripening periods was higher compared to early varieties. The increase in above-ground mass within 10 days from the 50th to 60th days from planting in middle-ripening varieties was 1.5 times higher than in early varieties (Figure 2d). Plant height, number of stems, and leaf area had no effect on tuber yield.

3.4. Functional Parameters of Leaves

The photosynthetic activity of plant leaves depends on interrelated components: leaf hydration, pigment content, and CO2 diffusion through the stomatal apparatus. The average content of water in the plant leaves during the flowering period (July) and the leaf wilting (August) differed little and amounted to 79.8–81.6% of the leaf wet weight. The moisture loss by the period of leaf death was 3.0–3.5%, regardless of the ripening degree of the variety (Figure 3a,d).
Both in July and August, the total content of photosynthetic pigments in the leaves of mid-season varieties was 6–7% lower compared to medium-early and early varieties. In all groups, a decrease in the concentration of pigments was observed by the end of the growing season (Figure 3b,e). Moreover, in early varieties, the amount of pigments in the leaves decreased by 20%, and in mid-season varieties, it decreased by no more than 10%. In August, a large variability in the pigment content was found in medium-early varieties. Their minimum amount was 8 mg g−1 of leaf dry weight, and the maximum amount was 13.6 mg g−1. During the flowering period, quite significant differences in the number of stomata per leaf area unit were revealed between potato groups (Figure 3c). On average, the number of stomata providing CO2 supply and regulating the transpiration flow was higher in mid-season varieties compared to medium-early and early varieties, respectively.

3.5. Elements of the Antioxidant System

The induction of oxidative processes was estimated by the content of LPO products. The data of Figure 4a show that in plants of medium-early potato varieties, oxidation processes are manifested to a less extent, their LPO level is ~20% lower compared to early varieties. Oxidative processes intensified in the leaf wilting in middle-early and mid-season-ripening varieties. The content of LPO products increased by 1.2 and 1.5 times, respectively. The content of the proline in the plant leaves of mid-season varieties was 30% higher than in early varieties (Figure 4c). The proline accumulation increased by the period of leaf wilting. A particularly strong increase in the proline amount was detected in the leaves of early varieties (Figure 4b,e). In contrast to proline, the average content of WS proteins, which include components that protect cells from ROS and LPO processes, decreased by the period of leaf wilting along with the amount of pigments in potato plants of all ripeness groups (Figure 4c,f).

3.6. Membrane Complex

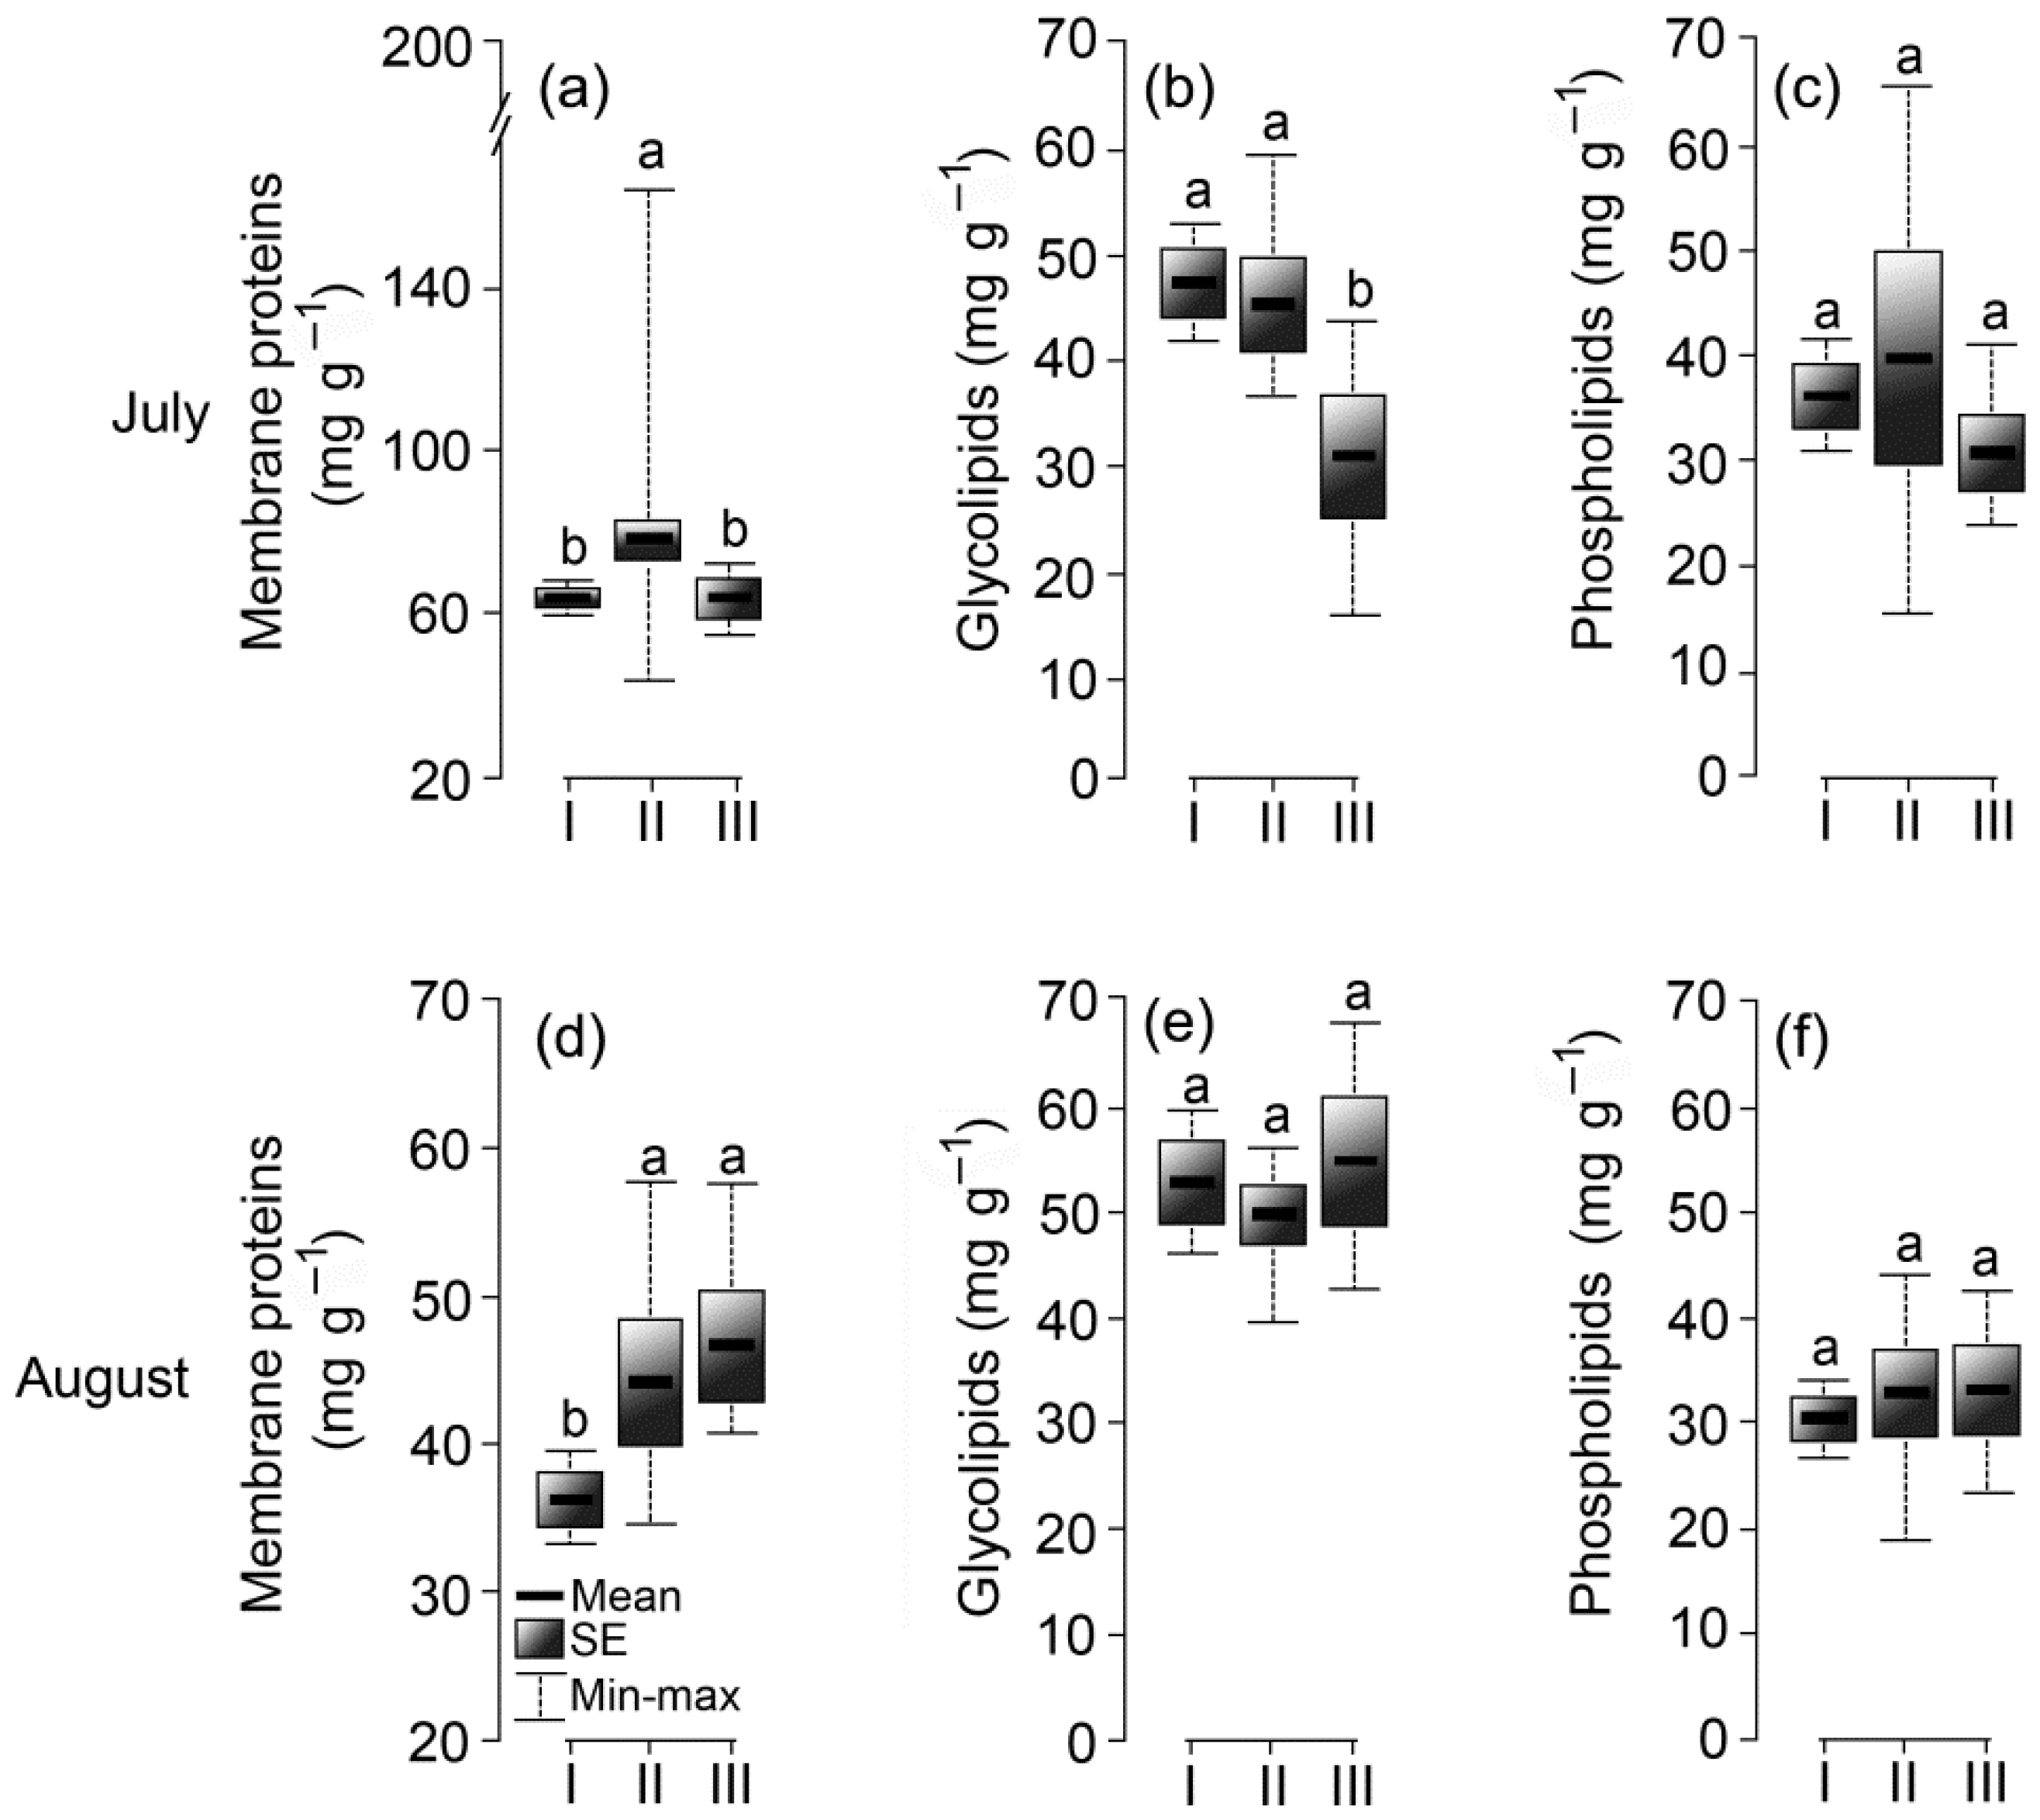
The maximum content of MP was during the flowering period of plants in medium-early varieties as 70 mg g−1 of leaf dry weight. By the leaf wilting period, the MP content decreased in all groups of potatoes, but differently: in mid-season varieties by 27%, and in early and medium-early varieties by 1.6 and 1.3 times, respectively (Figure 5a,d). The amount of GL responsible for the structure of the photosynthetic apparatus during the flowering period in mid-season varieties was 1.5 times less than in early and medium-early varieties. By the time of leaf wilting, their content increased and became almost equal in all groups of plants (Figure 5b,e). The concentration of PL practically did not differ between groups of plants in different growth periods (Figure 5c,f). The content of LPO products was positively related to the content of membrane GL (R = 0.55, p = 0.02) and PL (R = 0.62, p = 0.01).

4. Discussion

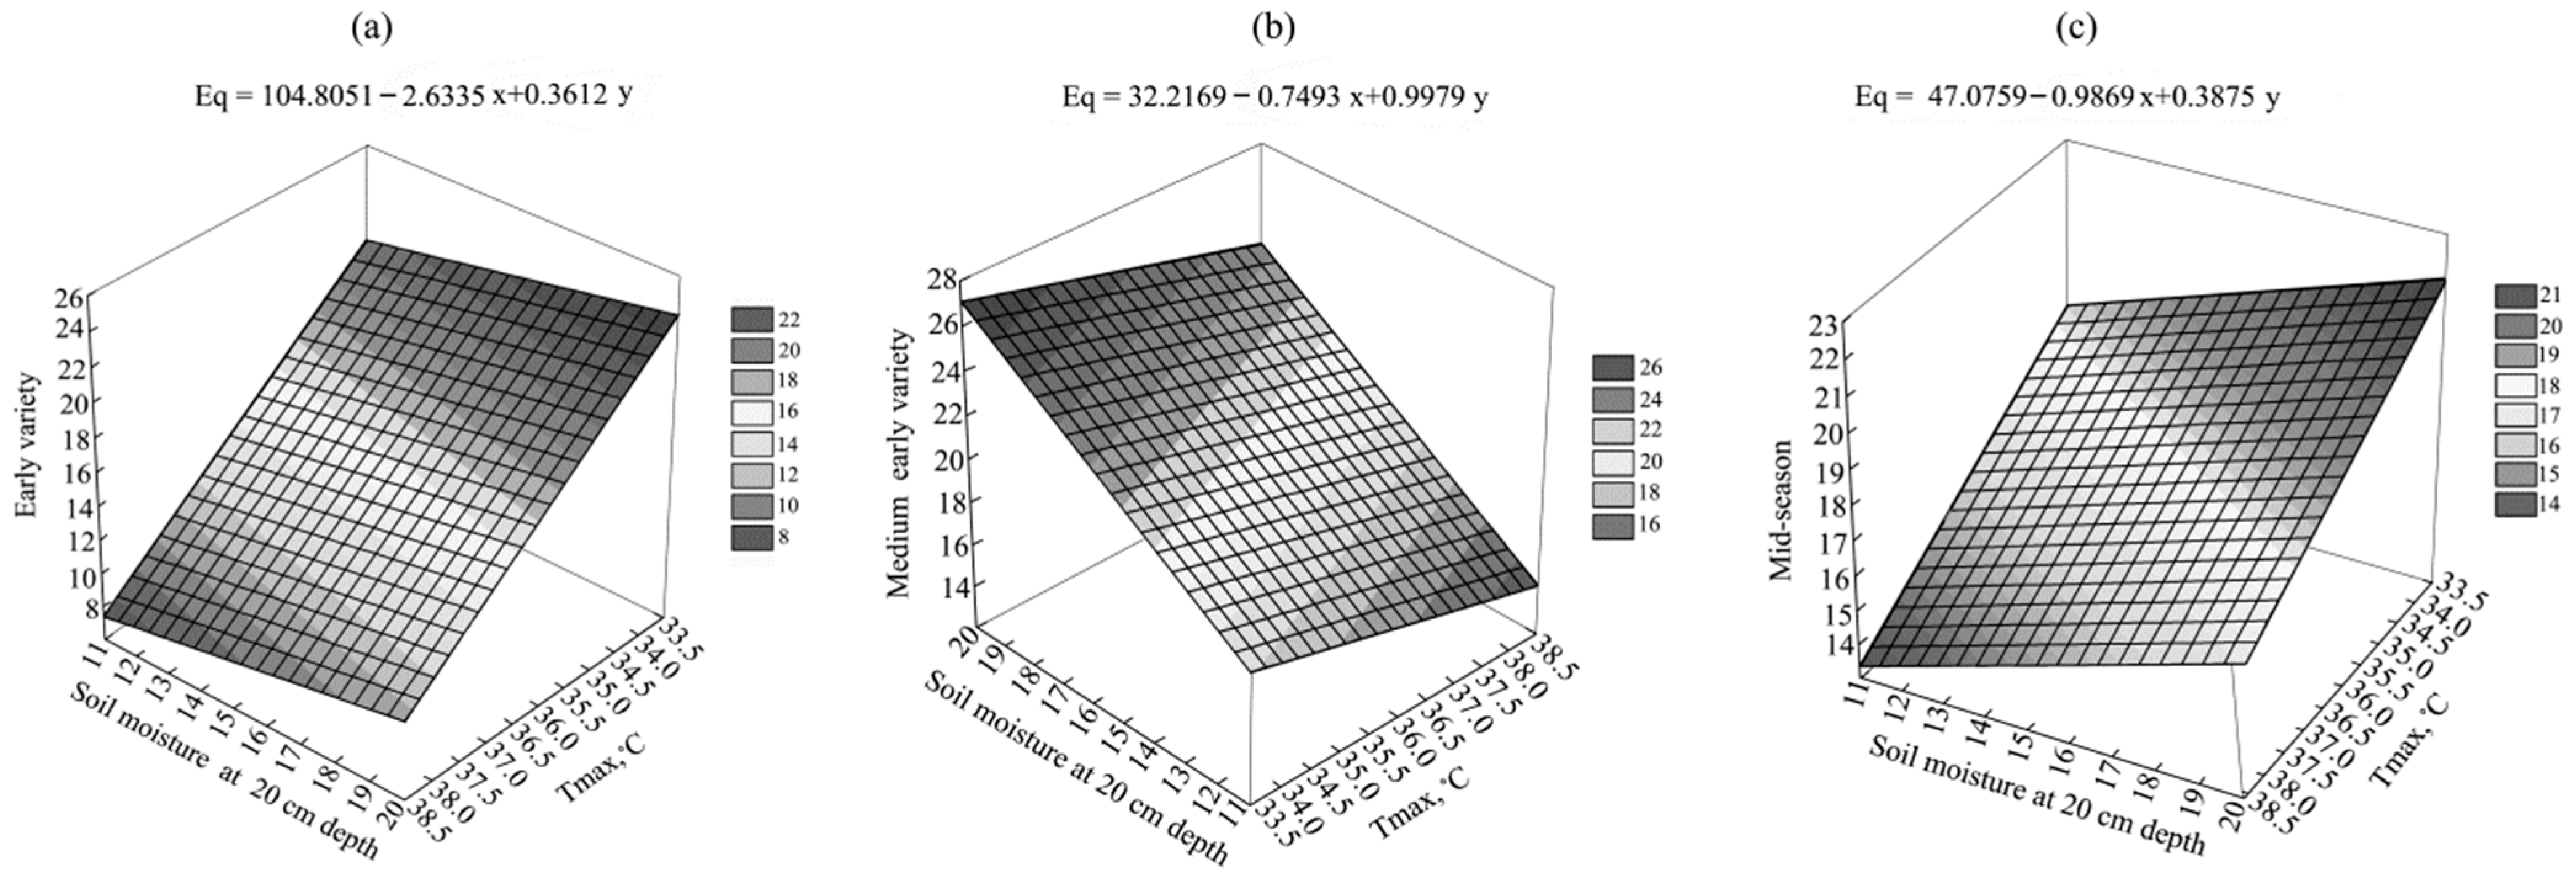
It is known that the increase in air temperature predicted by various scenarios of climate change will lead to a decline in the potato yield by 18–25% [37]. We found that the erratic character of precipitation, together with high air temperature in the region studied, led to a soil moisture deficiency and to a decrease in potato yield from 13 to 43% as a result. It can be supposed that early ripening varieties are more adapted to the conditions of the Middle Volga region of Russia. To visualize the relationship between the potato yield and the hydrothermal conditions, three-dimensional models were constructed in which the data are interpreted as a triplet of the values plotted on the XYZ axes (Figure 6). According to the data obtained, the growth of the temperature anomalies (Tmax, °C) negatively affected the yield of early potato varieties (Figure 6a). At the same time, soil moisture had a lesser effect than temperature fluctuations.
The ×opposite direction of the tilting angle in the 3D model of medium-early varieties in comparison with early and mid-season varieties indicated that the genotypes of this group were more sensitive to the soil moisture content and less dependent on temperature anomalies (Figure 6b). Thus, a large angle was formed between the axes that characterized the soil moisture content and yield, and a smaller angle was formed between the axes Tmax, °C and yield. The varieties of the mid-season group were similar to the group of early varieties according to the type of the dependence, but soil moisture had a greater impact on their productivity in comparison with the early variety group (Figure 6c). The 3D models and formulas obtained on the basis of experimental data could be used to predict the potato yield in various ripening groups depending on the hydrothermal factors of the region.
The potato yield is a complex quantitative indicator, which depends on a number of external and internal characteristics [6,16]. The optimal temperature for European potato varieties is 20 °C, and each increase of 5 °C leads to a decline in the photosynthesis rate and the yield by about 25% [6], and at 35 °C, the decrease is about 30% [20,38]. In the period of investigation, the average temperature range was 26–32 °C, and the maximum was 31–38 °C. These conditions led to a soil moisture deficiency but did not cause the plant death, and significantly reduced the tuber mass. Similar results were obtained in multiple field experiments [8,16,23].
One of the reasons why the tuber mass decreases under thermal stress is a suppression of the tuber formation signal and the disruption of carbon transport to the acceptor organs [20,39]. This means that the assimilated carbon is incorporated into the starch of the tubers to a lesser extent and leads to a decrease in the mass of tubers in the studied varieties (Table 1). Potatoes can respond to heat stress by shifting the tuber division into sprouts, with an increase in plant height and a reduction in leaf area [12,19]. A large height and area of plant leaves and a smaller number of stems were manifested in plants with early ripening periods (Figure 2).
The primary reaction to stress is a change in the energy and protein metabolism regulation associated with the transfer from plant growth to protective mechanisms [40]. As for the water content in the leaves, all the plants studied were able to maintain a sufficiently high level in the leaf tissues, regardless of the ripening group, and keep it unchanged until the beginning of the top wilting. Water in the plant leaves provides osmosis and turgor that effect the growth, structure maintenance, stomatal movement, photosynthesis, and other processes. Potato plants adapt to water deficiency by reducing moisture loss or maintaining its absorption [41]. The adaptation mechanisms of potato plants of different ripening groups apparently were associated not with the water content in the leaves but with differences in physiological and biochemical processes. For example, the pigment content was higher in the leaves of plants with earlier ripening periods that provided greater photosynthetic activity, which was necessary for the early formation of tubers.
The transition of growth processes to protective mechanisms in plants is accompanied by a change in the regulation of energy, protein and water metabolism [40]. Potato plants adapt to water deficiency by reducing the loss of moisture or maintaining its absorption [41]. Water in plant leaves provides osmosis and turgor, which affect the growth, structure maintenance, stomatal movement, photosynthesis, and other processes. All the plants studied were able to maintain a sufficiently high level in the leaf tissues, regardless of the ripening group, and keep it unchanged until the beginning of the top wilting. The adaptation mechanisms of potato plants of different ripening groups apparently were associated not with the water content in the leaves but with differences in physiological and biochemical processes. For example, the pigment content was higher in the leaves of plants with earlier ripening periods, which provided a greater photosynthetic activity which was necessary for the early formation of tubers.
Under heat stress conditions, potato varieties with a higher chlorophyll content and plant height tend to have a smaller decrease in tuber weight [10]. The lower pigment concentration in the group of mid-season varieties was compensated by a large number of stomata responsible for CO2 diffusion. The genotypes of this group as a rule differed from the early variety groups by higher values of the LPO level and the content of proline and WP (Figure 4). The main danger for plants caused by LPO processes is complete loss of the membrane barrier function by cells [42]. A sufficiently stable lipid content in the membranes indicates that the barrier function in plants is retained, which is also due to the action of the amino acid proline. A proline content increase is one of the evident reactions to water stress and to enhanced thermal and ultraviolet radiation [29,43].
Proline is a non-protein amino acid formed in the most stressed tissues. Both proline and soluble sugars are easily metabolized after drought, which allows additional water to be absorbed from the environment, thereby mitigating the immediate effect of water deficiency in the plant [44]. The physiological meaning of the accumulation of proline is associated with its ability to stabilize the structures of proteins and membranes through the formation of hydrophilic shells, which prevents the inactivation of proteins by hydroxyl radicals and singlet oxygen [45]. Proline plays a more significant role in the metabolism of mid-season potato varieties compared to early variety ones. The proline accumulation in these potato varieties might be one of the possible mechanisms for overcoming osmotic and oxidative stress caused by water deficiency and thermal stress. A similar increase in the proline content in potato leaves under water stress was observed by [30].
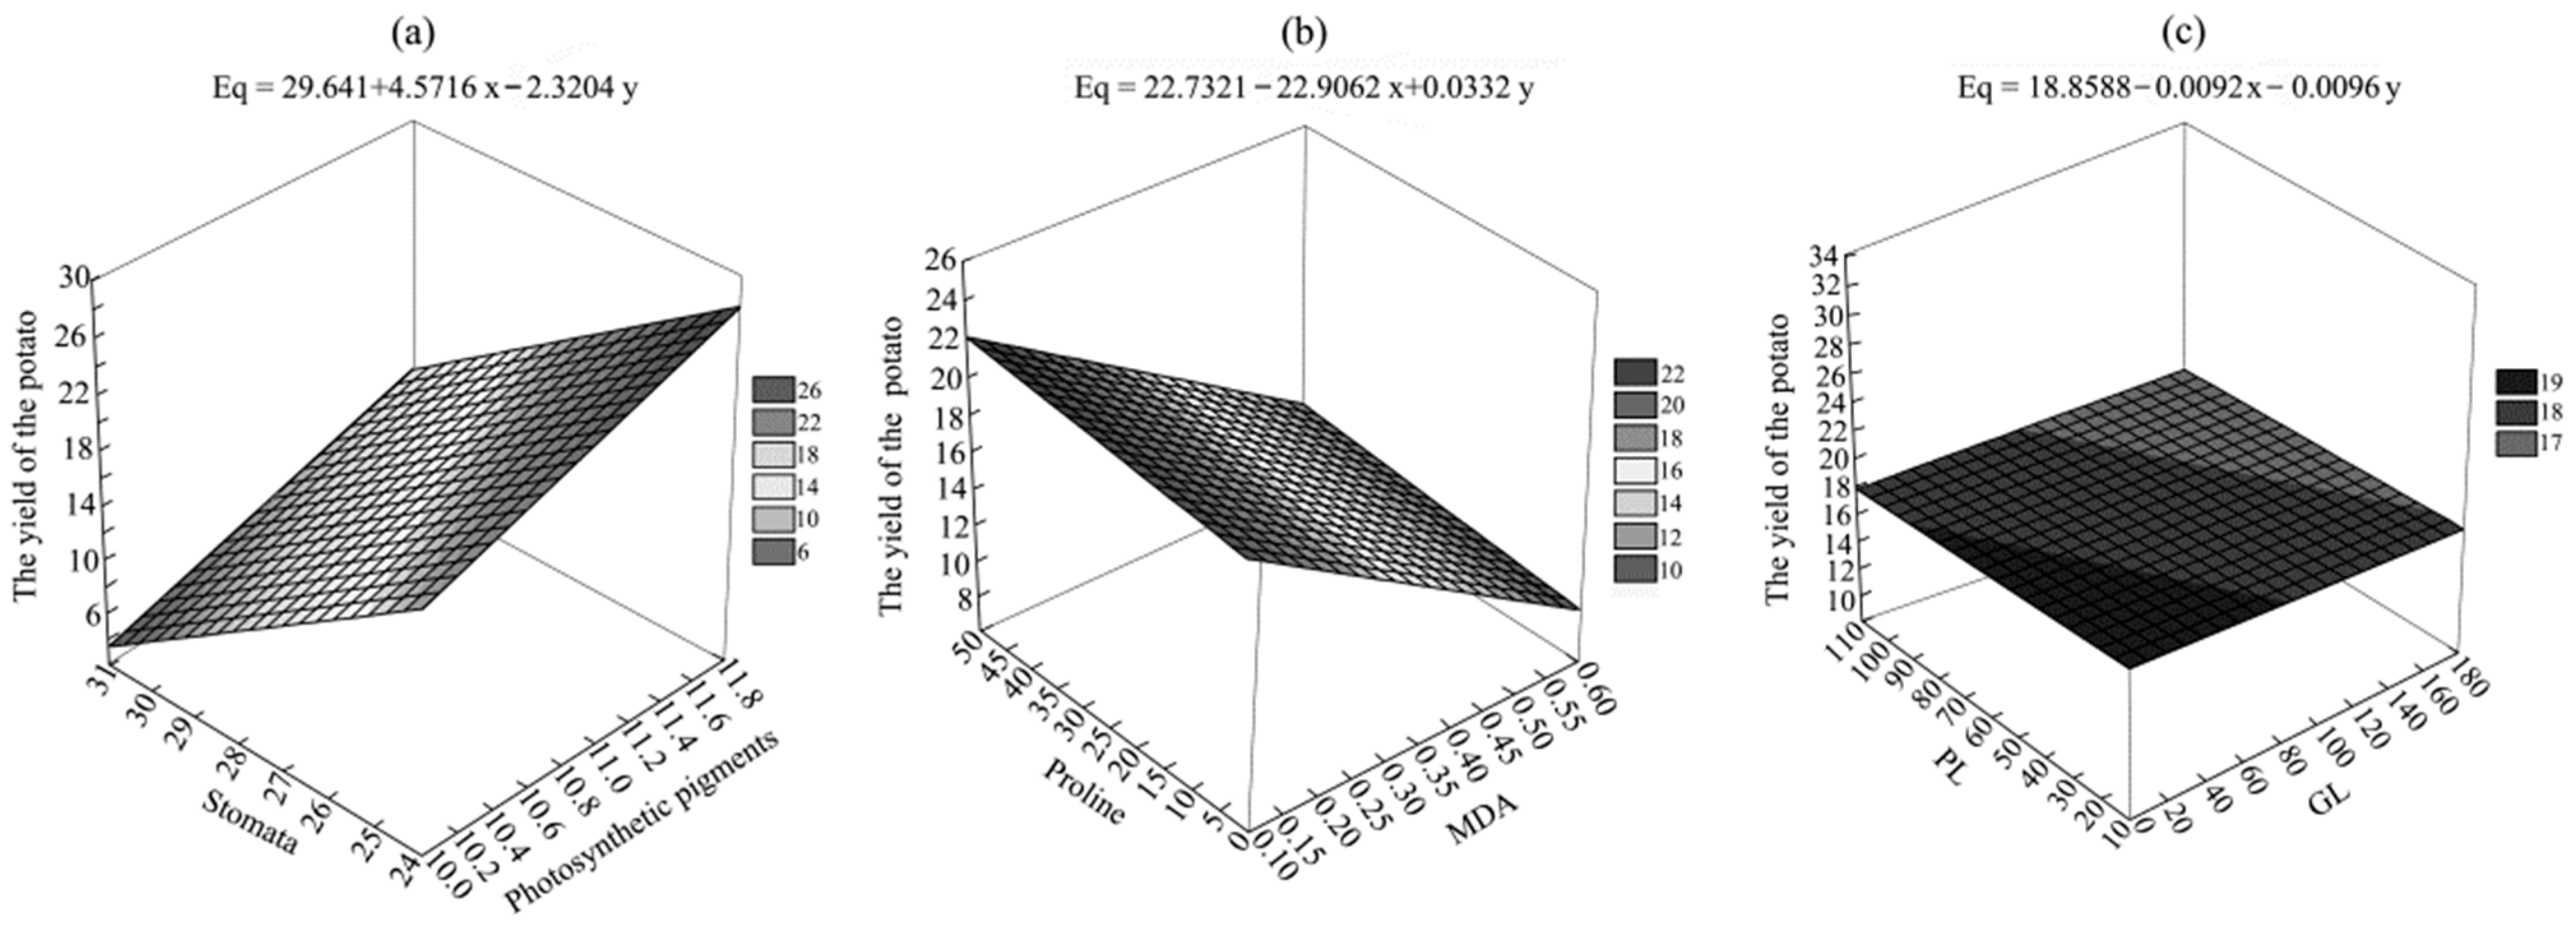
Both heat and drought stresses seem to effect differently on the enzymes, hormones, membranes in genotypes with different ripening periods. It means that potato plants implement various adaptation mechanisms which can affect the yield. Using the 3D model method, the physiological and biochemical peculiarities of each ripening group and their relationship with the yield were shown. The yield of early varieties is determined by a higher level of pigments and a low number of stomata per unit leaf area (Figure 7a). It can be determined by the earlier ripening periods in which the plant does not develop the signs of xeromorphism (small foliage and a large number of small stomata). The medium-early variety group differed from the others in the stability of the membrane system in July and August (Figure 7b). The genotypes of the mid-season group demonstrated high yields with the greatest proline content and the lowest LPO level (Figure 7c). In this group of plants, there was an obvious shift in the regulation of energy and protein metabolism towards protective mechanisms. If they managed to overcome the oxidative stress, the yield indicators the yield indicators increased.

5. Conclusions

The analysis of relationships between different plant characteristics is widely used by researchers, for example, to assess the importance of productivity components and to identify direct or indirect relationships between morphological characteristics of different crops. Among the morphological characters, all studies are focused on measuring the height of plants, the size and number of leaves, and the root system. Less attention is paid to the biochemical characteristics of the leaf apparatus, although the energy and substrate supply of plant growth and development is largely determined by cellular processes—photosynthesis, respiration, transport, allocation and storage of the products of primary and secondary biosynthesis. Our study of 24 potato varieties (Solanum tuberosum L.) revealed a reduction in the yield with an increase in air temperature and a decrease in soil moisture. In addition, the crop loss depended on the ripening period. We found that the physiological and biochemical parameters of potato plants, including the quantitative amount of pigments, the level of LPO processes, the accumulation of low molecular weight antioxidants, and the state of membrane systems, can affect the course of the production process—the rapid formation and growth of leaves, slow aging of plants and, as a consequence, on the productivity.
Obtained experimental models that can be used for predicting the yield of different potato varieties depend on the weather conditions of the growing region. In order to increase productivity and to improve the potato quality, it is necessary to take into account the peculiarities of the regional climatic conditions including temperature anomalies and use the varieties of a certain ripening group. In general, our data refine the understanding of the relationship between the potato above-ground mass and the yield of tubers. They provide the basis for developing methods to control growth processes in order to increase the productivity of this important agricultural crop.

Author Contributions

Conceptualization, O.R.; methodology, E.B.; software, V.N.; validation, A.B.; formal analysis, N.D.; investigation, E.B. and V.N.; resources, A.M.; data curation, S.R. All authors have read and agreed to the published version of the manuscript.

Funding

The work was carried out within the framework of the program (Structure, dynamics and sustainable development of ecosystems in the Volga basin), 1021060107217-0-1.6.19; Complex Plan of Scientific Research including (Development of selection and seed production of potatoes).

Conflicts of Interest

The authors declare that they have no conflict of interest.

References

  1. George, T.S.; Taylor, M.A.; Dodd, I.C.; White, P.J. Climate Change and Consequences for Potato Production: A Review of Tolerance to Emerging Abiotic Stress. Potato Res. 2018, 60, 239–268. [Google Scholar] [CrossRef]
  2. Cabello, R.; Monneveux, P.; De Mendiburu, F.; Bonierbale, M. Comparison of yield based drought tolerance indices in improved varieties, genetic stocks and landraces of potato (Solanum tuberosum L.). Euphytica 2013, 193, 147–156. [Google Scholar] [CrossRef]
  3. Demirel, U.; Çalişkan, S.; Yavuz, C.; Tindaş, I.; Polgar, Z.; Vaszily, Z.; Cernák, I.; Çalişkan, M.E. Assessment of morphophysiological traits for selection of heat-tolerant potato genotypes. Turk. J. Agric. For. 2017, 41, 218–232. [Google Scholar] [CrossRef] [Green Version]
  4. Jeffery, R.A. Physiology of Crop Response to Drought. In Potato Ecology and Modeling of Crops Under Conditions Limiting Growth; Haverkortand, A.J., MacKerron, D.K.L., Eds.; Academic Publishers: Wageningen, The Netherlands, 1995; pp. 61–74. [Google Scholar] [CrossRef]
  5. Schafleitner, R.; Gutierrez, R.; Espino, R.; Gaudin, A.; Pérez, J.; Martínez, M.; Domínguez, A.; Tincopa, L.; Alvarado, C.; Numberto, G.; et al. Field screening for variation of drought tolerance in Solanum tuberosum L. by agronomical, physiological and genetic analysis. Potato Res. 2007, 50, 71–85. [Google Scholar] [CrossRef]
  6. Burton, W.G. Challenges for stress physiology in potato. Am. Potato J. 1981, 58, 3–14. [Google Scholar] [CrossRef]
  7. Van Der Zaag, D.E. Reliability and significance of a simple method of estimating the potential yield of the potato crop. Potato Res. 1984, 27, 51–73. [Google Scholar] [CrossRef]
  8. Ahn, Y.J.; Claussen, K.; Zimmerman, J.L. Genotypic differences in the heat-shock response and thermotolerance in four potato cultivars. Plant Sci. 2004, 166, 901–911. [Google Scholar] [CrossRef]
  9. Wahid, A.; Gelani, S.; Ashraf, M.; Foolad, M.R. Heat tolerance in plants: An overview. Environ. Exp. Bot. 2007, 61, 199–223. [Google Scholar] [CrossRef]
  10. Tang, R.; Niu, S.; Zhang, G.; Chen, G.; Haroon, M.; Yang, Q.; Rajora, O.P.; Li, X.-Q. Physiological and growth responses of potato cultivars to heat stress. Botany 2018, 96, 897–912. [Google Scholar] [CrossRef]
  11. Monneveux, P.; Ramírez, D.A.; Pino, M.-T. Drought tolerance in potato (S. tuberosum L.): Can we learn from drought tolerance research in cereals? Plant Sci. 2013, 205–206, 76–86. [Google Scholar] [CrossRef]
  12. Krystyna, Z.; Dominika, B.-M.; Artur, N. Differences in size and architecture of the potato cultivars root system and their tolerance to drought stress. Plant Soil Environ. 2017, 63, 159–164. [Google Scholar] [CrossRef] [Green Version]
  13. Deblonde, P.; Ledent, J. Effects of moderate drought conditions on green leaf number, stem height, leaf length and tuber yield of potato cultivars. Eur. J. Agron. 2001, 14, 31–41. [Google Scholar] [CrossRef]
  14. Kumar, S.; Asrey, A.; Mandal, G. Effect of differential irrigation regimes on potato (Solanum tuberosum) yield and post-harvest attributes. Indian J. Agric. Sci. 2007, 77, 366–368. [Google Scholar]
  15. Eiasu, B.K.; Soundy, P.; Hammes, P.S. Response of potato (Solarium tuberosum) tuber yield components to gel-polymer soil amendments and irrigation regimes. N. Z. J. Crop Hortic. Sci. 2007, 35, 25–31. [Google Scholar] [CrossRef] [Green Version]
  16. Aliche, E.B.; Oortwijn, M.; Theeuwen, T.P.J.M.; Bachem, C.W.B.; van Eck, H.J.; Visser, R.G.F.; van der Linden, C.G. Genetic mapping of tuber size distribution and marketable tuber yield under drought stress in potatoes. Euphytica 2019, 215, 186. [Google Scholar] [CrossRef] [Green Version]
  17. Rykaczewska, K.; Zarzyńska, K.; Boguszewska-Mańkowska, D. Architecture of the root system of potato cultivars grown in aeroponics. Electron. J. Pol. Agric. Univ. 2018, 21, 02. [Google Scholar] [CrossRef]
  18. Tabalenkova, G.N.; Golovko, T.K. Production the Process of Cultivated Plants in Cold Conditions the Climate; Nauka: St. Petersburg, Russia, 2010. (In Russian) [Google Scholar]
  19. Struik, P.C.; Geertsema, J.; Custers, C.H.M.G. Effects of shoot, root and stolon temperature on the development of the potato (Solanum tuberosum L.) plant. Potato Res. 1989, 32, 151–158. [Google Scholar] [CrossRef]
  20. Hancock, R.D.; Morris, W.L.; Ducreux, L.J.M.; Morris, J.A.; Usman, M.; Verrall, S.R.; Fuller, J.; Simpson, C.G.; Zhang, R.; Hedley, P.E.; et al. Physiological, biochemical and molecular responses of the potato (Solanum tuberosum L.) plant to moderately elevated temperature. Plant Cell Environ. 2014, 37, 439–450. [Google Scholar] [CrossRef]
  21. Mahgoub, H.; Eisa, G.; Youssef, M. Molecular, biochemical and anatomical analysis of some potato (Solanum tuberosum L.) cultivars growing in Egypt. J. Genet. Eng. Biotechnol. 2015, 13, 39–49. [Google Scholar] [CrossRef]
  22. Germ, M. The response of two potato cultivars on combined effects of selenium and drought. Acta Agric. Slov. 2008, 9, 121–137. [Google Scholar] [CrossRef]
  23. Gervais, T.; Creelman, A.; Li, X.-Q.; Dahal, K. Potato response to drought stress: Physiological and growth basis. Front. Plant Sci. 2021, 12, 698060. [Google Scholar] [CrossRef]
  24. Ivanov, L.A.; Ronzhina, D.A.; Yudina, P.K.; Zolotareva, N.V.; Kalashnikova, I.V.; Ivanova, L.A. Seasonal dynamics of the chlorophyll and carotenoid content in the leaves of steppe and forest plants on species and community level. Rus. J. Plant Physiol. 2020, 67, 453–462. [Google Scholar] [CrossRef]
  25. Boudière, L.; Michaud, M.; Petroutsos, D.; Rébeillé, F.; Falconet, D.; Bastien, O.; Roy, S.; Finazzi, G.; Rolland, N.; Jouhet, J.; et al. Glycerolipids in photosynthesis: Composition, synthesis and trafficking. Biochim. Biophys. Acta 2014, 1837, 470–480. [Google Scholar] [CrossRef]
  26. Rozentsvet, O.A.; Bogdanova, E.S.; Nesterov, V.N.; Shevchenko, S.N.; Bakunov, A.L.; Milekhin, A.V.; Rubtsov, S.L. Productivity and dynamics of morphological, physiological and biochemical parameters of potatoes in arid climate. Doklady Biol. Sci. 2021, 497, 65–68. [Google Scholar] [CrossRef]
  27. Impa, S.M.; Nadaradjan, S.; Jagadish, S.V.K. Drought Stress Induced Reactiveoxygen Species and Anti-Oxidants in Plants. In Abiotic Stress Responses in Plants: Metabolism, Productivity and Sustainability; Ahmad, P., Prasad, M.N.V., Eds.; Springer: New York, NY, USA, 2012; pp. 131–148. [Google Scholar] [CrossRef]
  28. Lorenzen, J.; Lafta, A.M. Effect of heat stress on enzymes that affect sucrose levels in potato shoots. J. Am. Soc. Hort. Sci. 1996, 121, 1152–1156. [Google Scholar] [CrossRef] [Green Version]
  29. Hossain, A.M.; Hoque, M.A.; Burritt, D.J.; Fujita, M. Proline Protects Plants against Abiotic Oxidative Stress. In Oxidative Damage to Plants Antioxidant Networks and Signaling; Ahmad, P., Ed.; Academic Press: Cambridge, MA, USA, 2014; pp. 477–522. [Google Scholar] [CrossRef]
  30. Kumar, S.; Kumar, D.; Kumar, P.; Malik, P.S.; Kumar, M. Proline accumulation in the leaves of four potato cultivars in response to water stress. Plant Arch. 2020, 20, 3510–3514. [Google Scholar]
  31. Raymundo, R.; Asseng, S.; Cammarano, D.; Quiroz, R. Potato, sweet potato, and yam models for climate change: A review. Field Crops Res. 2014, 166, 173–185. [Google Scholar] [CrossRef]
  32. Lichtenthaler, H.K. Chlorophylls and Carotenoids Pigments of Photosynthetic Biomembranes. In Methods in Enzymology; Douse, R., Packer, L., Eds.; Academic Press Inc.: New York, NY, USA, 1987; pp. 350–382. [Google Scholar] [CrossRef]
  33. Uchiyama, M.; Mihara, M. Determination of malonaldehyde precursor in tissues by thiobarbituric acid test. Anal. Biochem. 1978, 86, 271–278. [Google Scholar] [CrossRef]
  34. Kates, M. Techniques of Lipidology. In Laboratory Techniques in Biochemistry and Molecular Biology; Work, T.S., Work, E., Eds.; Elsevier: Amsterdam, The Netherlands, 1975; pp. 269–610. [Google Scholar]
  35. Lowry, O.H.; Rosebrough, N.J.; Farr, A.L.; Randall, R.J. Protein measurement with the Folin phenol reagent. J. Biol. Chem. 1951, 193, 265–275. [Google Scholar] [CrossRef]
  36. Bates, L.S.; Waldren, R.P.; Teare, I.D. Rapid determination of free proline for water-stress studies. Plant Soil 1973, 39, 205–207. [Google Scholar] [CrossRef]
  37. Hijmans, R.J. The effect of climate change on global potato production. Am. J. Potato Res. 2003, 80, 271–279. [Google Scholar] [CrossRef]
  38. Wolf, S.; Olesinski, A.A.; Rudich, J.; Marani, A. Effect of high temperature on photosynthesis in potatoes. Ann. Bot. 1990, 65, 179–185. [Google Scholar] [CrossRef]
  39. Hastilestari, B.R.; Lorenz, J.; Reid, S.; Hofmann, J.; Pscheidt, D.; Sonnewald, U.; Sonnewald, S. Deciphering source and sink responses of potato plants (Solanum tuberosum L.) to elevated temperatures. Plant Cell Environ. 2018, 41, 2600–2616. [Google Scholar] [CrossRef]
  40. Sprenger, H.; Kurowsky, C.; Horn, R.; Erban, A.; Seddig, S.; Rudack, K.; Fischer, A.; Walther, D.; Zuther, E.; Köhl, K.; et al. The drought response of potato reference cultivars with contrasting tolerance. Plant Cell Environ. 2016, 39, 2370–2389. [Google Scholar] [CrossRef]
  41. Obidiegwu, J.E.; Bryan, G.J.; Jones, H.G.; Prashar, A. Coping with drought: Stress and adaptive responses in potato and perspectives for improvement. Front. Plant Sci. 2015, 6, 542. [Google Scholar] [CrossRef] [Green Version]
  42. Petukhov, A.S.; Khritokhin, N.; Petukhova, G. Lipid peroxidation in plants cells under conditions of the urban environment. RUDN J. Ecol. Life Saf. 2018, 26, 82–90. [Google Scholar] [CrossRef]
  43. Mansour, M.M.F.; Ali, E.F. Evaluation of proline functions in saline conditions. Phytochemistry 2017, 140, 52–68. [Google Scholar] [CrossRef]
  44. Farhad, M.-S.; Babak, A.M.; Reza, Z.M.; Hassan, R.-S.M.; Afshin, T. Response of proline, soluble sugars, photosynthetic pigments and antioxidant enzymes in potato (Solanum tuberosum L.) to different irrigation regimes in greenhouse condition. Aust. J. Crop Sci. 2011, 5, 55–60. [Google Scholar]
  45. Matysik, J.; Bhalu, B.A.; Mohanty, P. Molecular mechanisms of quenching of reactive oxygen species by proline under stress in plants. Curr. Sci. 2002, 82, 525–532. [Google Scholar]
Figure 1. Dynamics of average air temperatures (a), precipitation (b) and soil moisture (c) content during the growing season of potatoes. V—May; VI—June; VII—July; VIII—August.
Agriculture 12 00757 g001
Figure 2. Changes in the plant height (a), number of stems (b), leaf area (c) and plant weight gain (d) of potato plants depending on the ripening degree. I—early variety, II—medium-early variety, III—mid-season.
Agriculture 12 00757 g002
Figure 3. The content of water (July—(a), August—(d)), photosynthetic pigments (July—(b), August—(e)) and the number of stomata per leaf area unit (July—(c), August—(f)) depending on the ripening degree of potato plants and the growing season. I—early variety; II—medium-early variety; III—mid-season.
Agriculture 12 00757 g003
Figure 4. The content of LPO products (July—(a), August—(d)), proline (July—(b), August—(e)) and WP (July—(c), August—(f)) in the leaves of potato plants depending on the ripening degree and the growing season. I—early variety; II—medium-early variety; III—mid-season.
Agriculture 12 00757 g004
Figure 5. The content of MP (July—(a), August—(d)), GL (July—(b), August—(e)) and PL (July—(c), August—(f)) in the potato leaves depending on the ripening degree and the growing season. I—early variety; II—medium-early variety; III—mid-season.
Agriculture 12 00757 g005
Figure 6. Linear surfaces of distribution of yield parameters of early variety (a), medium-early variety (b) and mid-season (c) potato varieties in the space of hydrothermal factors.
Agriculture 12 00757 g006
Figure 7. Peculiarities of the yield parameter distribution of early variety (a), medium-early variety (b) and mid-season (c) potato varieties in the space of physiological and biochemical leaf characteristics. x-variable: photosynthetic pigments, MDA, GL; y-variable: stomata, proline, PL; z-variable: the yield of the potato.
Agriculture 12 00757 g007
Table 1. Characteristics of variety samples by yield components.
VarietyNumber of Tubers Per 1 PlantAverage Weight of Tubers, gYield, t/ha
201920202021201920202021201920202021
Early5.0 ± 0.86.3 ± 1.17.0 ± 0.8108.9 ± 16.174.2 ± 15.354.8 ± 12.021.2 ± 2.721.8 ± 3.718.4 ± 4.8
Medium-early6.8 ± 2.06.5 ± 0.56.7 ± 2.096.8 ± 13.670.3 ± 9.348.2 ± 9.525.7 ± 6.120.8 ± 3.214.6 ± 4.4
Mid-season5.7 ± 1.96.7 ± 1.57.1 ± 0.989.4 ± 6.159.8 ± 7.043.7 ± 11.520.9 ± 7.919.0 ± 3.714.2 ± 4.1
Publisher’s Note: MDPI stays neutral with regard to jurisdictional claims in published maps and institutional affiliations.