1. Introduction
Climate change and environmental degradation are major current concerns. The main objective, of the EU through the Green Pact, according to the European Commission (2021) [
1], is for the EU to become a competitive and resource-efficient economic formation. They intend to eliminate greenhouse gases by 2050, and to decouple the process of economic growth from the use of resources, without omitting any person or region. European policies in the fields of climate, energy, transport and taxation will be in line with the goal of reducing greenhouse gas emissions by at least 55% by 2030, compared to the 1990s. The Green Pact focuses its actions in eight directions, i.e., climate, environment and oceans, energy, transport, finance and regional development, industry, agriculture, research and innovation. The European Commission (2021) [
1] considers the European agricultural and food system to be a standard of safety and security in terms of supply, nutrition, and quality, however, this standard should become a benchmark in terms of sustainability. There would be social, environmental, health and economic benefits. This is the reason why the EU ensures food security in the context of climate change and biodiversity, to reduce the impact of the agricultural and food system on the environment and climate, to strengthen food resilience and determine a global transition to competitive farm-to-consumer sustainability [
1].
The above context motivates us to assess the carbon footprint of agricultural chains in the case of European OECD member countries. The carbon footprint refers to a certain amount of greenhouse gas emissions, relevant to climate change, associated with human activity related to production and consumption, although etymologically, it would be described as an exclusive measure of dioxide emissions. Carbon results directly or indirectly from an activity or is accumulated over the life cycle of a product [
2]. It is also believed that the carbon footprint measures the intensity of greenhouse gases in products, bodies and processes which take place worldwide [
3]. In the paper, we refer to the definition provided by Pandey and Agrawal (2014) [
3] according to which the carbon footprint measures the intensity of greenhouse gas emissions for various activities and services.
In Europe, the agricultural sector is very different among regions [
4], and agricultural sustainability is not high enough. Agriculture is the largest contributor to anthropogenic greenhouse gas emissions; therefore, the quantification of various specific and related activities is essential [
3]. The mechanisation of agriculture has greatly increased productivity and production, contributing to industrialisation but there are implications for the environment, especially concerning the carbon footprint [
5]. Agriculture is the main source of nitrogen pollution due to increasing product demand and inefficiency along the entire food supply chain, from the production of synthetic fertilisers to waste management [
6]. It generates 20% of anthropogenic greenhouse gas emissions due to fuel consumption, land use change, soil cultivation, nitrogen oxide emissions, animal waste and enteric fermentation [
7]. Within the agri-food chain, the agricultural stage bears the highest impact on final products and on the environment [
8], but supports food security too. Climate change and biodiversity destruction due to anthropogenic action require a change in vision and in the understanding of the system in which agricultural and food policies operate [
9]. European governance structures are not well adapted to the current challenges of climate, biodiversity loss and agri-food insufficiency, and among different areas of economic policy such as agriculture, trade, health, environment and at different levels of governance we observe the manifestation of conflicting objectives and the lack of synergy which requires common sustainable agricultural policies [
10]. The great challenge of European agriculture is to adapt production according to the growing demand for food while conserving natural resources and the environment [
11].
Green Pact is an important step in the decision to calibrate the European economic activity to planetary and human needs. We will assess the carbon footprint of European agricultural chains starting from the analysis of the current scientific framework, after which we will present the methodology, analyse the results and draw conclusions.
2. Literature Review
Agriculture has a complex multiplier effect in all sectors of the economy. The role of agriculture and its effects on the carbon footprint are an important scientific concern. Agriculture is related to two challenges of global sustainability, climate change and biodiversity loss [
12]. It is associated with problems related to pollution, disruption of nutrient cycles, scarcity of drinking water, hunger, poverty and the struggle for resources. Intensive agriculture, as shown by Garske et al. (2021) [
12], is responsible for about a quarter of the carbon footprint and three quarters of biodiversity loss, and if the reporting includes the entire food sector, the percentage increases. Schiavon et al. (2021) [
13] note that there is a vicious circle between agricultural production and climate change in which agriculture is a trigger and a victim, which is why climate and energy targets provide for a 40% reduction in emissions by 2030 for all sectors of the economy, which implies changes including in agriculture as well. Jehlićka et al. (2020) [
14] note that the technologically and economically sophisticated industrial agri-food system, adopted almost globally and a landmark for less developed countries, contributed to soil degradation, biodiversity loss and climate change, thus calling sustainability into question.
The carbon footprint began to increase with the mechanisation of agriculture, and the maximum threshold was reached in the first decades of the agricultural industrialisation process, according to Aquilera et al. (2019) [
5]. The carbon footprint can be traced from the direction of five economic sectors, i.e., energy, industry, construction, transport and AFOLU (agriculture, forestry and other land uses). A study by Lamb et al. (2021) [
15] for the period 1990–2018 reveals that at the European level there was a modest decarbonisation of energy systems, and the region was the only one in the world to reduce its carbon footprint since 2010. Europe pollutes the most through energy systems, industry, transport and, to a lesser extent, through AFOLU. The EU has reduced its carbon footprint by 8% since the early 2000s, the main determinant being technology, but the effort is minor and visible only in 2007–2008 [
16].
The calculation of the carbon footprint of food production systems for 14 European countries covering 65% of global food production in the period 2000–2014 showed that the carbon footprint decreased and its determining factors were GDP per capita, population density, nitrogen fertiliser production, agricultural area, animal production and per capita energy consumption per capita [
17]. Crippa et al. (2021) [
18] consider that agriculture and agricultural land are sources of the highest contribution to the carbon footprint, followed by retail, transport, consumption, fuel production, waste management, industrial processes and product packaging. According to the study by Crippa et al. (2021) [
18], in 2015, 27% of emissions were from developed countries, 73% from developing countries, and over 71% were associated with land use for agricultural purposes. Tubiello et al. (2021) [
19] show that the agricultural area, the energy consumed on the farm, the transport of products and food waste disposal significantly contribute to the carbon footprint. Renner et al. (2020) [
20] also claim that agriculture generates half of the carbon footprint.
Therefore, agriculture provides food security for the population, and is the basis of the economy and economic growth, which is why we propose to analyse the research hypothesis, (H1), according to which the economic growth of the European OECD member states is decoupled from the carbon footprint.
Organic production contributes positively to agricultural and natural biodiversity compared to the conventional one [
21]. Meier et al. (2015) [
22] consider that organic farming has a low impact on the carbon footprint compared to conventional agriculture if the cultivated area is analysed. The impact increases if the quantity produced is analysed, especially under the influence of chemicals contained in fertilisers. Stoi et al. (2020) [
23] consider that organic production is a solution to environmental problems such as global warming, biodiversity loss and desertification. Organic farming adds value to local economies, however, the demand for organic products is low [
24], and the decision to consume organic products is related to environmental issues. Based on these ideas, we propose to analyse the research hypothesis, (H
2), according to which
the expansion of organically cultivated areas in OECD member states reduces the carbon footprint.
Fisch-Romino and Guivarch (2019) [
25] assessed the need to invest in transport infrastructure, given that this activity is one of the largest emitters of greenhouse gases since the 1970s. The transport effect on the carbon footprint must be reduced if we want to keep the global temperature rise under two degrees Celsius. Analysing the relationship between transport infrastructure and the carbon footprint for OECD countries for a period of about 150 years, Churchill et al. (2021) [
26] conclude that transport infrastructure determines the long-term carbon footprint. Investments in road and air transport infrastructure increase the carbon footprint, while those in railroad infrastructure contribute to its reduction, according to the conclusions of Erdogan’s study [
27] for 21 OECD countries in the period 2000–2015. Road transport is responsible for 74% of emissions from the entire sector [
27]. Therefore, investments determine the quality of the environment by promoting the use of conventional vehicles, which contribute to the increase of carbon footprint. The same study argues that investments in infrastructure involve constructing roads which cause biodiversity loss, degradation of drinking water sources, and which change the destination of land.
Given that transport is the second most important determinant of the carbon footprint, Georgatzi et al. (2020) [
28] analysed the relationship between emissions and transport activity for 12 European countries between 1994 and 2014. The results of the study show that investments in transport infrastructure do not affect carbon footprint. They are located at the intersection of climate and development issues and, although they do not reduce the absolute carbon footprint, they reduce the intensity of pollution, except for those in road infrastructure which have a neutral effect.
Fertilisers are an important component of the agricultural chain, necessary for food security, which contributes to carbon footprint increase [
29]. Agriculture depends on large amounts of fertilisers and pesticides and, according to a study conducted by Tripathi et al. (2020) [
30], excessive use of chemicals and technology has led to severe environmental degradation, more specifically to soil pollution and biodiversity degradation with irreversible effects on long term. The shift from the use of chemical to organic fertilisers increases agricultural productivity in a sustainable way according to a study by Koondhar et al. (2021) [
31]. The authors claim that, in the long run, reducing the carbon footprint in agriculture by 10% leads to increased production. Improper use of fertilisers is the reason of the increase in the carbon footprint [
32], which is why the main challenge in organic agriculture is precisely the improvement of fertiliser management [
33]. Organic farming involves the use of methods which exclude the intake of chemicals, consequently the use of fertilisers in small quantities reduces the carbon footprint, but also the agricultural yield [
34].
Aquaculture is a developing sector, with a growth rate of about 6%, which increases its carbon footprint without an accurate estimate of its impact, only the certainty that it will increase. In 2030, anthropogenic emissions from aquaculture production will likely account for 5.72% [
35]. Aquaculture production contributes to the carbon footprint through energy consumption, transport and feed. The contribution of this activity to the carbon footprint is low according to Maulu et al. (2021) [
36] but compared to other activities in the food sector it is significant. MacLeod et al. (2020) [
37] argue that aquaculture production has modest effects on the carbon footprint, but they increase post-production. The direct and indirect contribution of aquaculture production to food security is important, but not harmless to the environment. The authors claim that in 2017, approximately 0.49% of the carbon footprint was caused by aquaculture production. According to Gephart et al. (2021) [
38], aquaculture production negatively affects the carbon footprint, but not as much as land use. The conclusions of this paper lead us to analyse the research hypothesis, (H
3), according to which
fertilisers, agricultural area, aquaculture production and investments in transport infrastructure reduce the carbon footprint in OECD member states.
This context draws attention to the role of short production and supply chains. In Europe, short agri-food chains play an important but marginalised role. A study conducted in 15 European countries by Rivera et al. (2020) [
39] shows that the European system is dominated by large agricultural producers, able to achieve increases in productivity, efficiency and economies of scale. Small producers, more traditional in production methods, are marginalised on the market, although they have an important contribution to agri-food security, support local biodiversity, contribute to environmental sustainability, maintain agricultural culture and resilience of local communities.
Agricultural area, road transport infrastructure, organically cultivated area, fertilizers, and aquaculture production are components of the agricultural chains. Their study is of interest in assessing the carbon footprint of European OECD member countries along with economic growth, an important process to ensure well-being. The importance of agricultural chains crystallizes two other research hypotheses, i.e., (H4), European agricultural chains reduce the carbon footprint of each European OECD state, and (H5) the agricultural chains of European OECD member states have contributed, since the end of the first decade of the 2000s, to the carbon footprint reduction.
The food security of the population depends on the agricultural sector efficiency. The COVID-19 pandemic, the Russian–Ukrainian conflict, and the energy and food crises have aggravated the problem of food security, given that more than 2 billion people already experience food problems [
40]. In this context, we formulate another research hypothesis, (H
6),
local agricultural chains reduce food insecurity in conditions of sustainability in the context of worsening economic and social crises.
3. Materials and Methods
3.1. Data
In this study we set out to assess the carbon footprint of agricultural chains for European OECD member countries based on six research hypotheses, as follows:
H1. Economic growth of the European OECD member states is decoupled from the carbon footprint;
H2. The expansion of organically cultivated areas in OECD member states reduces the carbon footprint;
H3. Fertilizers, agricultural area, aquaculture production and investment in transport infrastructure reduce the carbon footprint in OECD member states;
H4. European agricultural chains reduce the carbon footprint of each European OECD state;
H5. The agricultural chains of European OECD member states have contributed, since the end of the first decade of the 2000s to the footprint reduction;
H6. Local agricultural chains reduce food insecurity in conditions of sustainability in the context of worsening economic and social crises;
For this purpose, the indicators analysed describe the period 2000–2019. They were taken from the OECD (Organization for Economic Cooperation and Development) [
41], World Bank [
42] and FAO (Food and Agriculture Organization) [
43] websites. Because data for certain years are missing, we covered the deficiency by calculating an arithmetic mean between the values of the previous and/or subsequent years. The study of the effects of agricultural chains on the carbon footprint was developed for European OECD member countries except Luxembourg. The exclusion of this state from the analysis was due the lack of data for long periods in the case of several indicators.
We considered the carbon footprint as the amount of greenhouse gas emissions, because we started from the consideration that not only is carbon dioxide harmful to the environment, but also the rest of the components of greenhouse gases. Greenhouse gas emissions include, according to OECD description, carbon dioxide, methane, nitrogen oxides, chlorofluorocarbons, hydrofluorocarbons, perfluorocarbons, sulphur hexafluoride and nitrogen trifluoride, resulting from human activities (OECD). Because we believe that all these components affect the environment and biodiversity, not just carbon dioxide, we considered the carbon footprint equivalent to the amount of greenhouse gases. This indicator is the dependent or explanatory variable of the study because we want to see the extent to which certain characteristics of agricultural chains increase or decrease the carbon footprint and thus the results can be extrapolated in the decision area.
As the activities which ensure agri-food production lead to economic growth and improvement of people’s quality of life, and growth, in turn, is reflected in the economic and social environment, we introduced in the group of independent variables gross domestic product per capita, which represents the gross value added by economic agents active on the territory of a country in relation to the number of inhabitants and describes the process of economic growth. To describe the agri-food chains, we opted for the analysis of the following: the fertiliser amount-nutrients used per unit of arable land, i.e., nitrogen, potassium and phosphate fertilisers; the agricultural area - land intended for agriculture, cultivated and with pastures; the organically cultivated area-extensively cultivated areas, by traditional methods; the investment in road infrastructure as transport is an important step along the agri-food chain; the aquaculture production-a branch of agriculture which deals with the breeding of aquatic animals and plants for sale. All indicators relate to each country population. The empirical analysis is based on seven variables, six of which determine the carbon footprint measured by the amount of greenhouse gas emissions and are specific to agricultural and agri-food chains.
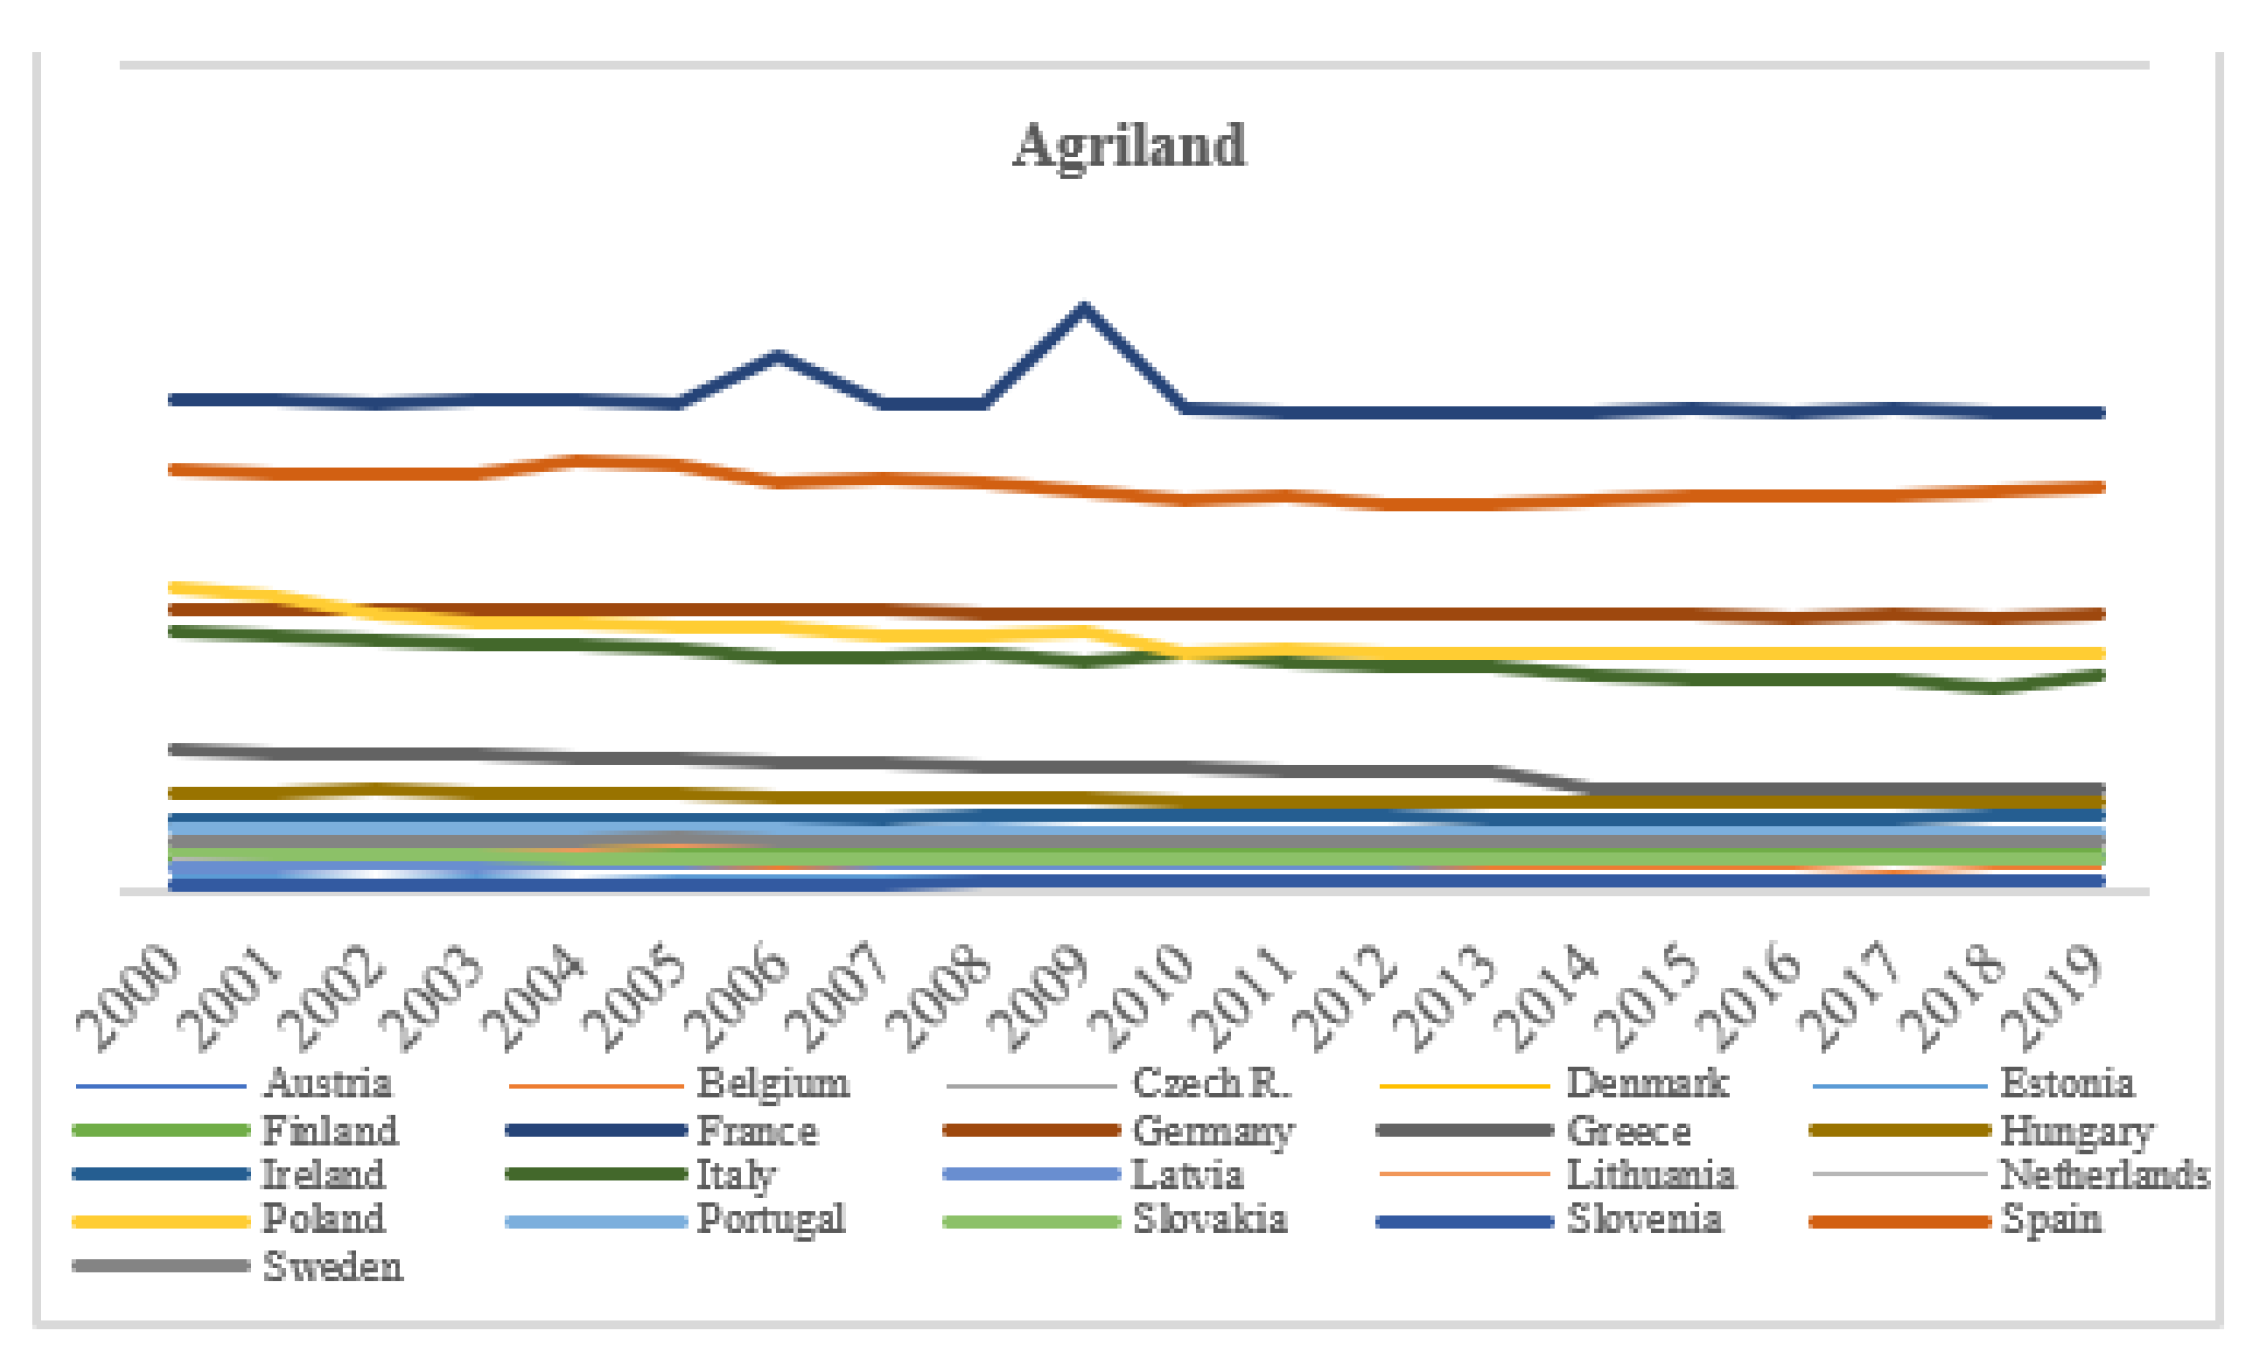
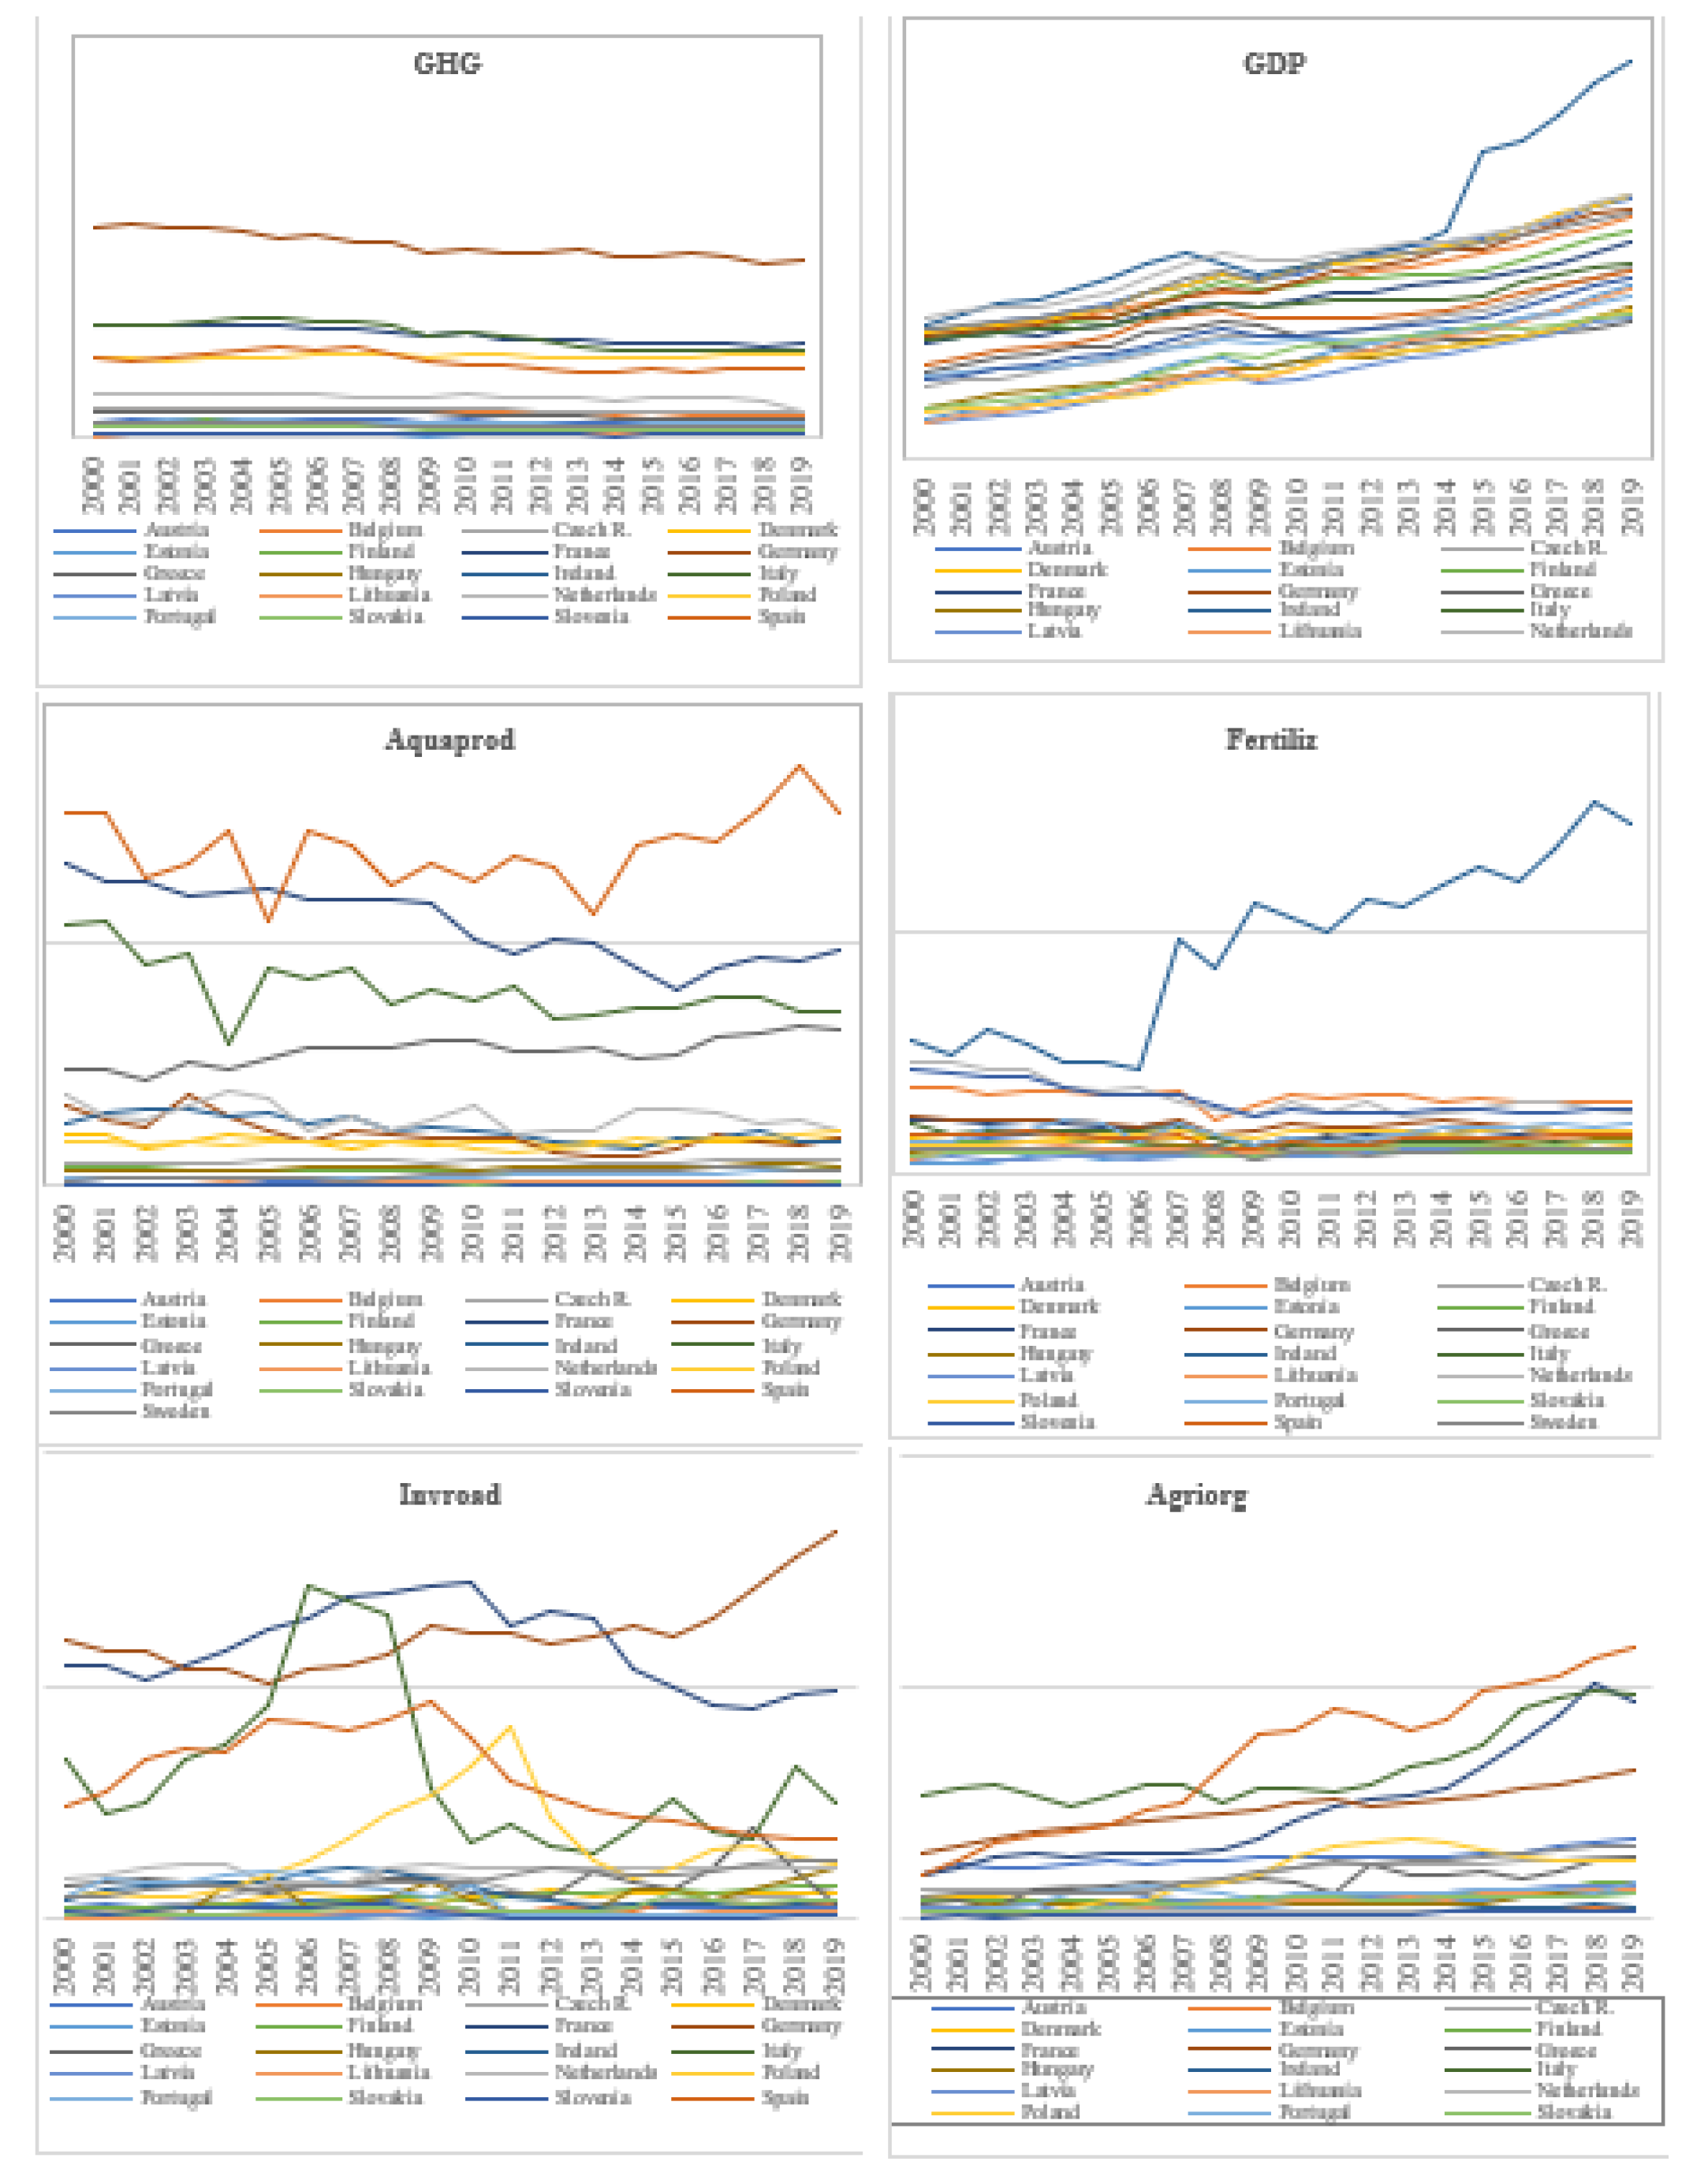
As we see from
Figure 1, Germany is the largest polluter in Europe, followed by France, Italy, Poland, Spain and the Netherlands. The differences between the amount of emissions of these countries are significant. For Germany, the year 2016 is representative for a maximum of GHG amount. France and Italy emit relatively similar amounts of emissions. Italy issued higher GHG quantities than France only in the period 2002–2009. Poland and Spain are on relatively close trends but lower than those already mentioned. In the period 2001–2008, Spain emitted higher GHG amounts compared to Poland. The Netherlands has followed a relatively steady trend in emissions, similar to other European countries which are not polluters of the calibre of the states already mentioned. In the case of the Netherlands, 2018 marks a significant reduction in pollutant emissions. All European countries have managed to stimulate the economy and achieve rising GDP per capita since 2013, with the most spectacular growth in Ireland. The financial crisis has been felt in all European countries. Between 2007 and 2013, growth slowed. European economies have felt the effects of the crisis at different times, and the recovery has taken place under the spectrum of time lags.
In terms of aquaculture production, the Mediterranean countries are the main European producers. From this point of view, Spain stands out, on a strongly fluctuating trend which we also notice in the cases of Italy and Greece. France is the second largest producer of European aquaculture, although production followed a downward trend until 2015, severely affected by the 2009 crisis, after which growth was resumed. The Netherlands, Germany and Denmark are among the European aquaculture producers, but with much more modest production compared to the Mediterranean countries.
All European countries use fertilisers in quantities which, for the most part, do not produce major differences among them. There are exceptions, such as Ireland, which uses far more amounts of fertilisers than the rest of the world. The trend is highly fluctuating and growing for Ireland. The Netherlands, Slovenia and Belgium use fertilisers in much smaller quantities than Ireland, but higher than other European countries. If until 2004 the Netherlands was the second largest European user of fertilisers, Belgium has been in this position since 2008.
Germany has been making the highest investments in transport infrastructure since 2014. France was the European leader in invroad from 2007–2014. Italy had a strong increase in this variable in period 2005–2006. Subsequently, the trend fluctuated, declining below the 2006 level. Spain recorded a maximum value of these investments in 2009 but subsequently the trend has slightly decreased. Poland is one of the countries which steadily increased the value of these investments until 2011, after which the decrease was significant. Sweden experienced a visible increase in invroad in 2017 at a level similar to that of Italy and Spain. The rest of the European countries are not leaders in terms of invroad. Some of them made significant investments at certain times, others made relatively constant investments during the period under review.
Regarding the organically cultivated area, the trend for the period 2000–2019 is upward for most European countries. Some of them are notable for the increase in organically cultivated areas. Spain made the highest progress; Italy and France also; both decoupled from the upward trend only in 2018, Italy by maintaining a relatively constant area of organically cultivated areas, and France by reducing them after a period of strong growth. Germany, Austria, Poland, Sweden, Greece also fall into the category of economies which supported organic farming to a greater extent than the rest of the European countries whose progress was almost visible.
European countries keep the cultivated area relatively constant. The states with the highest cultivated areas are France, Spain, Germany, Italy, Poland, with quite large differences among them, but also Greece, Hungary and Ireland. In some cases, the cultivated area is decreasing, an aspect also supported by Fitton et al. (2019) [
44] which emphasizes that the reduction of cultivated area takes place in parallel with the change in attitude towards food and the need to reduce waste.
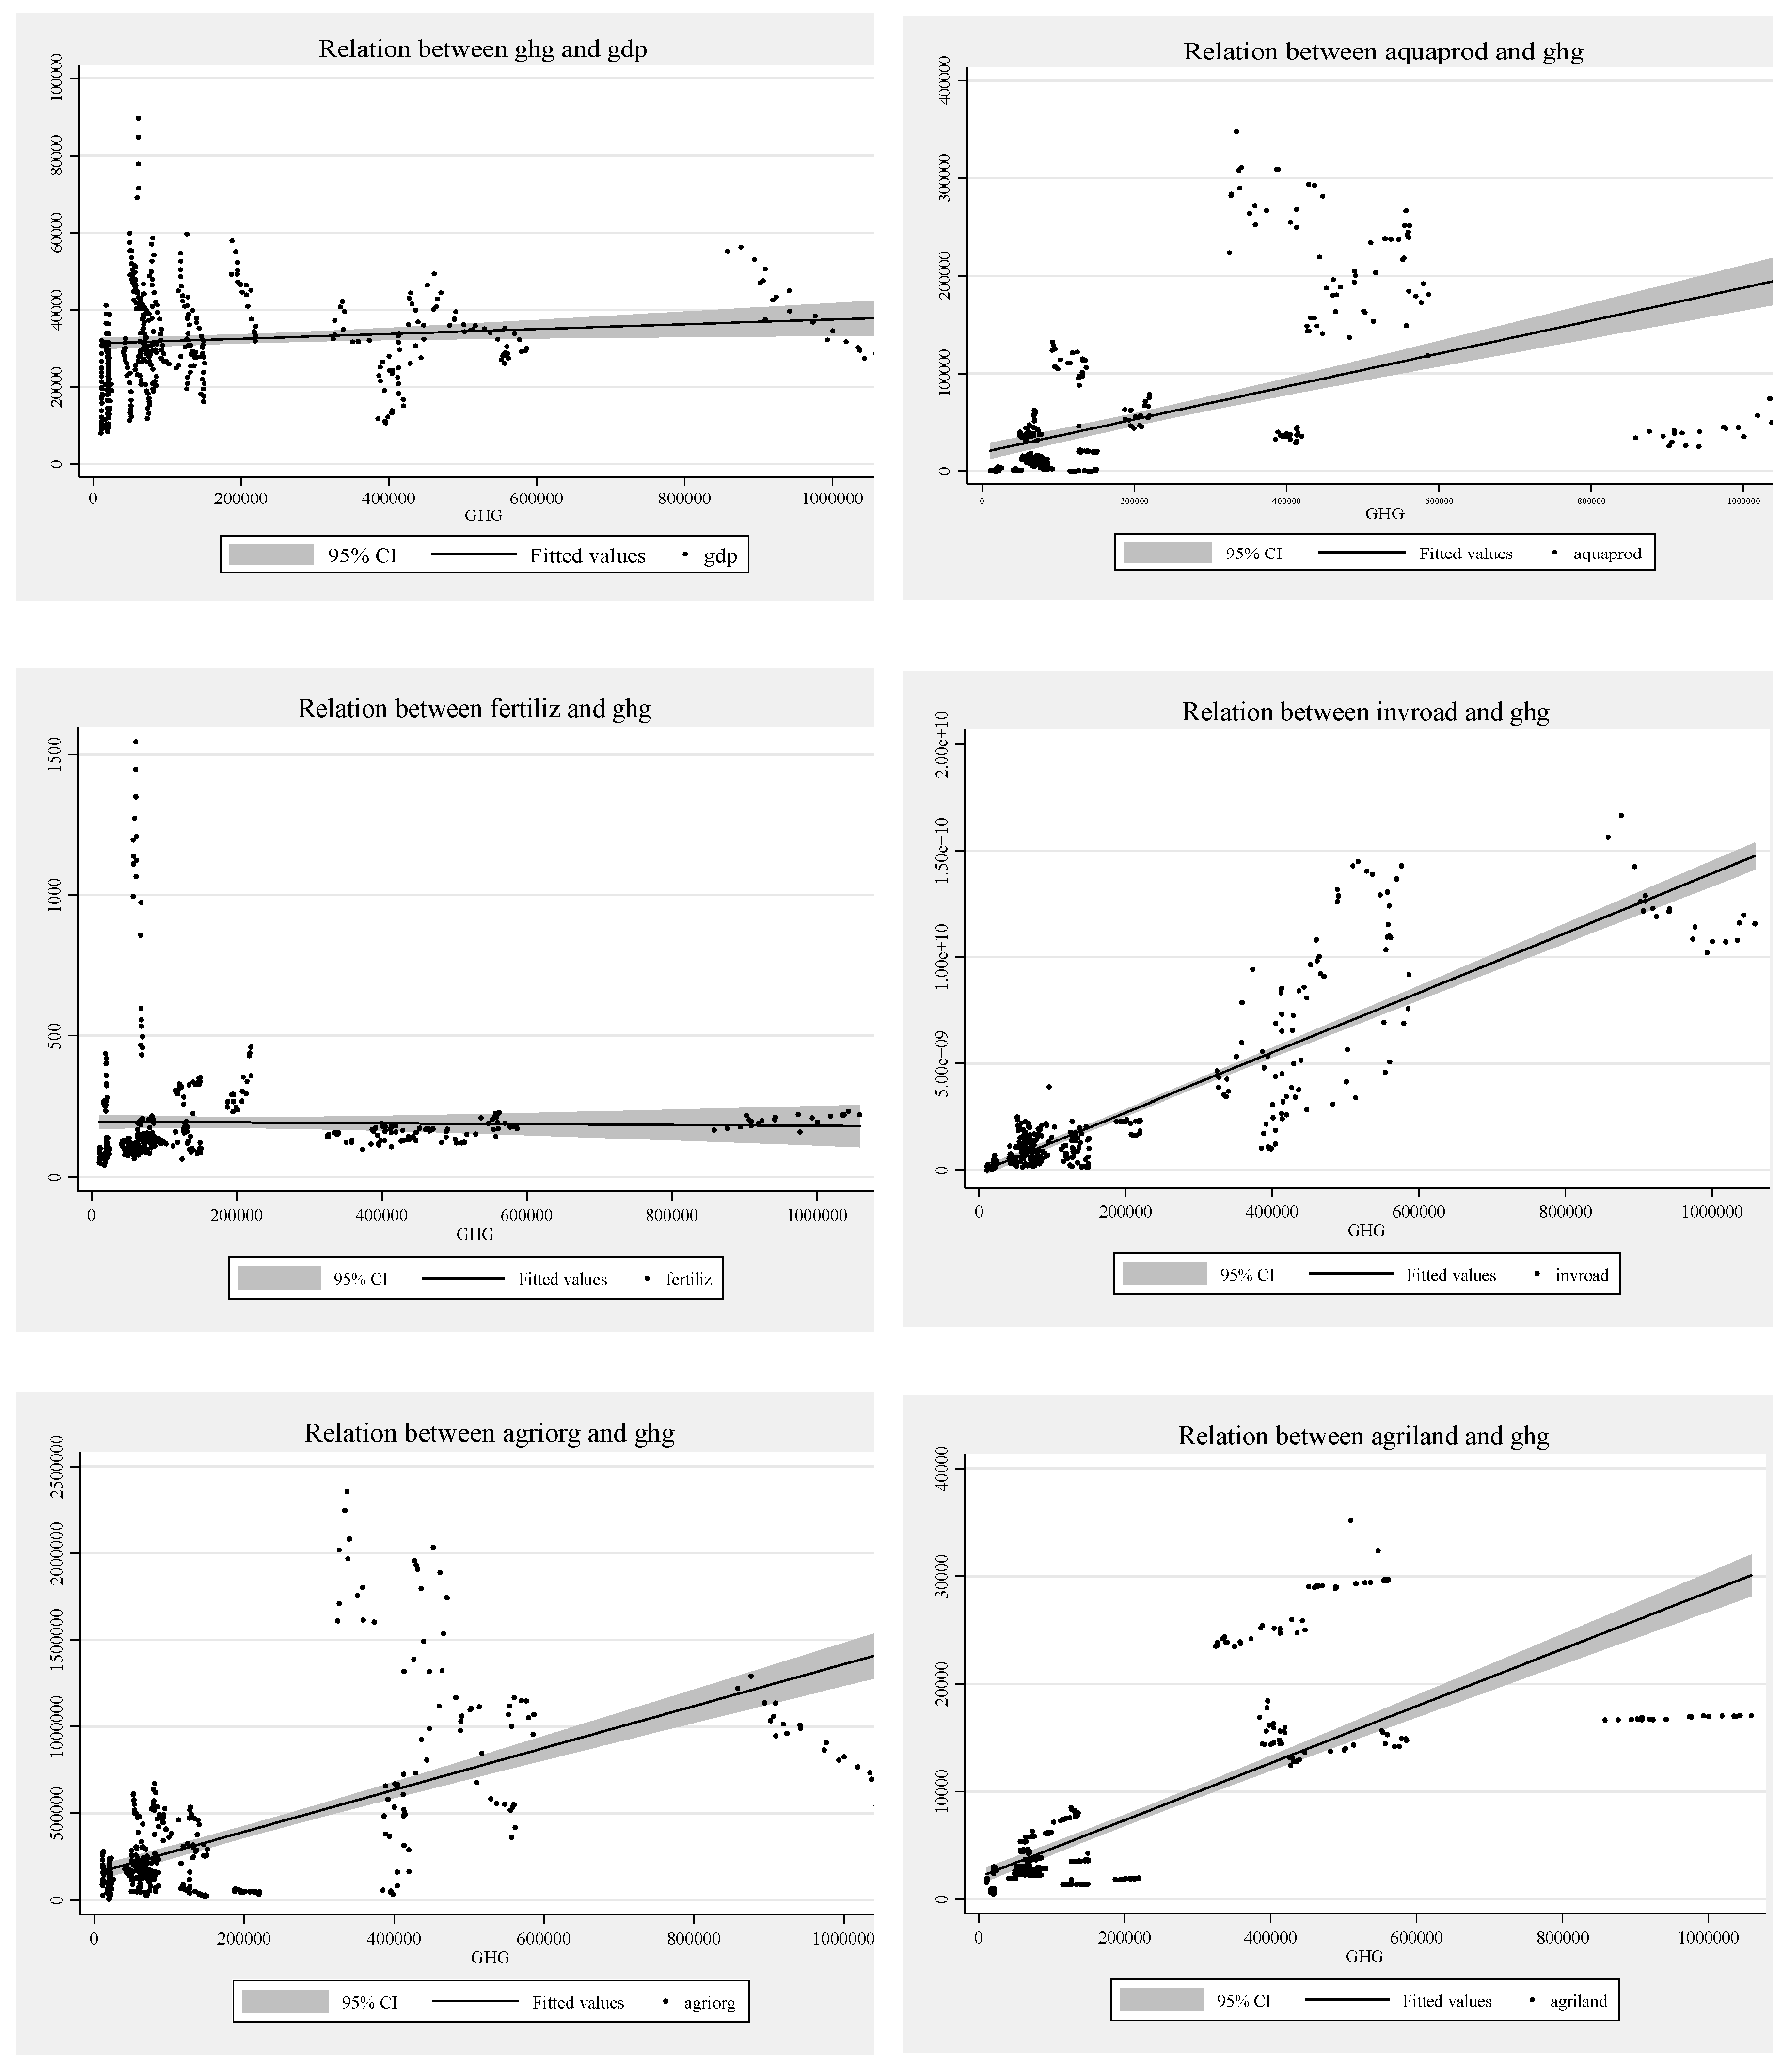
In
Figure 2, the relationship is shown between the dependent variable (GHG) and each of the six independent variables as we already as we have already explained.
3.2. Method
The method we apply for the validation of the first research hypotheses (H1–5) is Panel Data or Cross-Sectional Time-Series Data. The aim is to assess the carbon footprint of agricultural chains in the case of European OECD member countries under the influence of specific variables in agricultural chains. The analysis of the carbon footprint under the influence of variables specific to agricultural chains involves three directions, i.e., a general one, for all European OECD member countries analysed, the second direction, geographical, for each country, and the third one, in temporary dynamics. We used the Fixed Effects model following the application of the Hausman test. It explores the relationship between explanatory variables and the result variable. Each European country has its own characteristics which influence the explanatory variables. The fixed effects model eliminates the effect of invariant characteristics over time so, we evaluate the net effect of explanatory variables on the result variable. Another assumption of the model is that the time-invariant characteristics are unique and they are not correlated with other individual characteristics.
The general equation of the model is:
where:
αi (i = 1,..., n)—the unknown intercept for each country;
yit—the dependent variable or result;
Xit—the independent or explanatory variable;
βi—the coefficient of the independent variable;
u
it—the error term; i represents the countries; t represents time.
where:
uit—the error term or discrepancy variable;
μi—the unobservable, non-time-changing cross-sectional specific effect which estimates the effect of the variables not included in the model specific to the country and on the dependent variable;
ηi—the temporary specific effect which does not change in the transversal structures, estimating the effect of the variables not included in the model, at time t, on the dependent variable;
vit—variable error among units (countries) and in space.
We start from the presumption that μi and ηi are fixed parameters, uncorrelated with errors, the sum of them is zero, and the estimation method is that of the smallest squares.
Equation (1) can be written by inserting dummy variables in the form below (Equation (3)).
where d
ij = 1 if i = j or d
ij = 0 in other way. The parameters α
j and β can be estimated with ordinary least squares. The same estimation is obtained whether the regression is performed as a deviation from the individual mean α
j which involves removing individual effects by transforming the data. The Fixed Effects term is justified by the fact that the intercept may vary between countries but not over time. The estimated coefficients of the fixed effects model cannot be influenced by time-invariant characteristics omitted from the analysis such as culture, religion, gender, and race.
To choose between the two models, Fixed Effects and Random Effects, the Hausman test will be performed. It determines whether the fixed effects and random effects estimators are significantly different. The difference between the estimators results from the existence of correlation between xit and αj.
The null hypothesis of the Hausman test is H0: cov(x,e) = 0 and the alternative hypothesis is cov(x,e) ≠ 0. If the null hypothesis is true, then the estimators-least squares and instrumental variables-are consistent. In this case the most efficient estimator (least squares) will be chosen. However, if the alternative hypothesis is true, we opt to use the least squares estimator. In other words, if after applying the Hausman test we accept the null hypothesis and reject the alternative one, the appropriate model is Random Effect. Conversely (our case), if we reject the null hypothesis and accept the alternative one, the appropriate model is Fixed Effect.
To validate the latest research hypothesis, (H6), we apply specific methods to the literature analysis, inductive and deductive, including the results of the panel methodology applied for the first research hypotheses.
4. Results and Discussions
The first step in the empirical analysis is to choose between the two possibilities of the given panel data methodology. After applying the Hausman test the results (chi2(6) = 31.03 and Prob > chi2 = 0.0000) lead to the rejection of the null hypothesis and the acceptance of the alternative that is: the model fitted with our analysis is Fixed Effects.
After applying Fixed Effects, the model equation can be written:
where:
ghg—the amount of greenhouse gases or carbon footprint;
gdp—the gross domestic product per capita;
aquaprod—the aquaculture production;
fertiliz—the amount of fertilizer used per unit of arable land;
invroad—the investments in road transport infrastructure;
agriorg—the organically cultivated area;
agriland—the area cultivated for agricultural purposes.
The first research direction, which involves assessing the carbon footprint under the influence of variables specific to agricultural chains, is general, covering the whole group of analysed European OECD member countries. The model is statistically significant as is shown by the value of F (6.393) of 85.30 and that of the
p-value of 0.0000. The results show that 56.56% of the carbon footprint variation is due to the variation of the explanatory variables over time, that 43.44% is due to the variation of the variables among countries, and 42.03% is due to both the variation among countries as well as to temporary dynamics (
Table 1). This last value of the coefficient of determination allows us to estimate the statistical significance of the model.
The particularities of the explanatory variables of the European OECD member countries such as interclass coefficient illustrate more than 99% of the variation in the carbon footprint. The explanatory variables are directly related to the carbon footprint in a relationship of medium to significant intensity, according to the value of the correlation coefficient (r = 0.659).
The model shows two direct relationships and four indirect relationships among variables as the value of non-standardised coefficients shows. A positive evolution of economic growth and organically cultivated area reduces the carbon footprint, while the increase in aquaculture production, fertiliser amount, agricultural areas and investments in road transport infrastructure lead to its expansion.
The non-standardised coefficients fall within the confidence intervals and, according to the t values, the explanatory variables have a significant influence on the carbon footprint, an aspect certified by the p-values. The increase by one unit of GDP per capita and of the organically cultivated area reduces the amount of emissions by 0.036 and 0.097, respectively. On other hand, the increase in aquaculture production, fertilisers, investments in road transport infrastructure and in agricultural area by one unit increases the carbon footprint. Therefore, the first conclusion of the empirical analysis is that European OECD member states should support economic growth. Moreover, in the agri-food chain framework, they should expand the areas cultivated organically and adapt to other specific activities, such as aquaculture production, production and use of fertilisers, and the manner of performance of agricultural activities and investments in road transport infrastructure to the new requirements of agricultural sustainability. The first research direction validates the first two research hypotheses, H1 and H2, and rejects the third one, H3.
Aquaculture production and investment in road infrastructure have the strongest negative impact on the environment and biodiversity, as t values show, followed by fertilisers and agricultural area. The results suggest the need to expand organically grown areas using traditional and extensive but less productive methods compared to the conventional ones, to properly calibrate the number of fertilisers and to support short agri-food chains which do not involve long-distance movement of products, all on the background of European economic growth.
It is demonstrated that the carbon footprint can be acted upon by using traditional methods of agricultural production, by using biofuels, by reducing the demand for fuel and feed [
5], by reducing the amount of chemical fertilisers used, by cultivating varieties adapted to the local environment, by increasing carbon storage in the soil and minimising the transport distance between markets [
7]. The transition from high-input agriculture to low-input agriculture, i.e., to traditional organic farming, may be a solution to reduce the carbon footprint, but the extent of coverage of the consumer demand is not known [
7].
Land use for agricultural purposes is one of the main factors with an impact on biodiversity in the EU, which places pressure on the environment [
45] and the use of large amounts of fertilisers generate surpluses of nutrients harmful to water, which is why it is necessary to optimize their use in agriculture [
12].
According to the OECD (2021) [
41], European agricultural and aquaculture production accounts for 16% of total globally, and estimates show a downward trend until 2030 due to slow growth in Western European countries but also the fact that sustainability has become a priority in the economic and consumer policy.
Transport infrastructure planning is essential in any carbon footprint reduction strategy because it is at the intersection of climate and development imperatives, and the impact of environmental policies on infrastructure investment is ambiguous [
25]. Food transport involves, in addition to pollution generated by moving from one location to another, the pollution caused by refrigerants used for products requiring special forms of transport [
45].
The second direction of research assesses the carbon footprint under the influence of country-specific variables. It outlines two European clusters (
Table 2). One consists of ten countries where agricultural chains reduce the carbon footprint (Belgium, the Czech Republic, Hungary, Ireland, Latvia, Lithuania, Portugal, Slovenia, Slovakia and Sweden). In the case of the other cluster, agricultural chains contribute to increasing the carbon footprint (Denmark, Estonia, Finland, Germany, Italy, the Netherlands and Poland). There are four additional countries outside these two clusters., four countries remain. In the case of two of them, France and Spain, only the increase in agricultural area reduces the carbon footprint, so we consider that they are falling to the second cluster, the one of the countries where agricultural chains extend the carbon footprint. Regarding the other two, Austria and Greece, only two variables each reduce the carbon footprint in the case of their growth with one unit: economic growth and organic farming in the case of Austria, and aquaculture production and agricultural area in the case of Greece.
The number of countries where agricultural chains are contributing to the carbon footprint contraction is significant, but not enough to characterise European agriculture as environmentally friendly. The ten states are from different regions and development groups. National characteristics are those which justify geographical and economic heterogeneity.
The second cluster, comprised of countries where agricultural chains have a polluting effect, includes European economies with developed agricultural sectors, such as Germany, Italy and France. This dichotomous situation shows that there is a need, in the EU, to adapt agricultural chains, so that their harmful effects on the environment diminish over time. The results of the second research direction partially validate the fourth hypothesis, H4, as agricultural chains do not reduce the carbon footprint in all European OECD Member States.
Studies show that there are differences among European regions in terms of agricultural sustainability. Mediterranean and Central countries have the highest contribution (Guth and Smḙdzic-Ambrožy, 2019) while, for developed Western European countries, sustainability has become a priority.
There are studies that identify, in the European area, three clusters in terms of sustainability and argue that agriculture is characterised by moderate sustainability [
46]. In Central European countries, agriculture has a high economic value, in the Mediterranean it bears a more positive influence on the environment compared to the rest of the regions, and in Eastern countries it contributes significantly to job creation. In contrast, Fanelli (2020) [
47] notes that the countries of Central Europe represent the group characterised by the highest degree of sustainability, and the Eastern states represent the group characterised by high agricultural intensity. A study by Czyźewski et al. (2021) [
48] reaches other conclusions, namely that Western European countries are the group where the intensification of agricultural production is increasingly sustainable, especially in states such as the Netherlands, Belgium, Denmark and Northern France, and the countries of Central and Eastern Europe and Greece are facing the most difficult situation in terms of sustainability.
The third research direction assesses, in temporary dynamics, the carbon footprint under the influence of variables specific to agricultural chains. The fact that in European countries a real interest in reducing pollution caused by agricultural activity is demonstrated by the influence of the variables analysed on the carbon footprint on temporary dynamics (
Table 3).
In the case of economic growth, the data are statistically representative since 2008, and in the case of aquaculture production, fertilisers, investments in transport infrastructure and agricultural land they are representative since 2009. With regard to the agricultural area, an exception is 2010, where the data are not statistically significant, and in the case of organically cultivated area, the only year for which we have statistically significant results is 2014.
The period 2008–2009 marks a change in the influence of European agriculture on the carbon footprint. Economic growth has led to a continuous and increasing reduction in the carbon footprint since 2016, aquaculture production has started to have less harmful effects since 2008, as well as the use of fertilisers. Investments in road infrastructure had a polluting effect until 2005, after which they were made at the same time as the slow reduction of the carbon footprint it generates. The positive effects of the organically cultivated area become visible from 2011, but the most significant impact on the reduction of the carbon footprint was recorded in 2014. The organically cultivated area has a fluctuating influence on the carbon footprint, but this effect was visible in the years 2018–2019, when it approached the level of 2014. The year 2009 marks the moment when the increase in the European agricultural area was achieved against the background of the carbon footprint decrease. The carbon footprint increased continuously and accentuated in the period 2009–2014, but afterwards, the expansion of European agricultural areas was achieved against the background of the carbon footprint reduction.
The European countries have taken measures to reduce the carbon footprint generated by agricultural activities since 2008–2009, even if not with spectacular results and not at a fast enough pace to solve the environmental problem generated by agricultural activities. The results of the third research direction validate the fifth research hypothesis, H5.
Similar studies show that, in the period 1990–2015, industrialized states kept the carbon footprint relatively constant at about 24%, the developing states reduced it from 68% in 1990 to 39% in 2015, and the more energy-intensive economies, including European ones, had the lowest contribution to the carbon footprint of agri-food activities [
18] due to land conversion and reduced deforestation [
19]. However, developing countries are considered as the largest contributors to the carbon footprint resulting from the agriculture sector because agri-food activity accounts for more than half of total economic activities [
19]. In terms of their contribution, Central European countries have the highest economic contribution, the Mediterranean countries have the highest environmental contribution, and the Eastern ones have the highest contribution to the labour market [
46]. Although the contribution of agriculture to economic growth in Europe is low, at around 1.6% of GDP, 4.5% of the labour market, 1.2% of exports and 1.4% of imports [
46], the pressure on the environment is high.
Considering that sustainability is based on extensive production methods and short transport distances [
49], one of the potential solutions for adapting agricultural and food systems to meet economic, demographic, and environmental challenges to ensure more sustainable food systems in order to guarantee food and nutrition security is to focus on small producers and short agricultural and food chains. In Europe, small producers contribute to food security, support short chains and contribute to reducing the carbon footprint by strengthening and diversifying agri-food systems [
50]. They should have access to technologies and practices which allow them to adapt to climate change, to receive support to increase their ability to connect to markets because, in the future, they will depend on social change [
51]. In the EU, the number of small agricultural producers decreased and their activity is concentrated in their own proximity, which makes it easier for them to integrate into short chains [
52]. Short agricultural and food chains, although they have a complicated, dynamic and fragile profile, closely related to the availability of products, guarantee their safe and unaltered supply from the producer to the final consumer [
53]. Short-distance transport generates emissions in small quantities, depending on the mode of transport and logistics, and distribution is important as long as it generates 80% of emissions after the production and processing stage [
54]. In addition, in order to reduce the impact of European agriculture on the environment, it is recommended to develop high-efficiency systems with low impact on the environment, based on techniques specific to both organic and conventional system [
33]. The big challenge is to improve the efficiency of fertilisers and develop new kinds of fertilisers with a high degree of efficiency, and an important role in the agricultural sector will be played by nanotechnology, now in an infancy phase, but which will provide the solution to increase production in less aggressive conditions with the environment [
55]. Simultaneously, it would be advisable for the consumers to adopt more sustainable and healthier choices, to change their diet to avoid waste, i.e., relieve pressure on the environment [
56].
In the near future, a global overlap of crises is foreseen, such as food, water and energy crises. Prior to the COVID-19 pandemic, more than a quarter of the world’s population did not have access to these products [
57], with malnutrition affecting one in ten people, especially in developing and less developed countries [
58]. The pandemic has worsened the global economic situation, and political conflicts are exacerbating the negative economic and social consequences. Conflicts have strong effects on trade, national income and global economic well-being. The costs are high and persistent, and the negative externalities are huge [
59]. The economic effects of conflicts are devastating in the long run in the countries where they occur and in the neighbouring countries [
60]. These aspects lead to economic and social crises. A crisis is defined as a threat, and is associated with uncertainty, which presents an unfavourable situation for the population [
61]. Developing and externally dependent countries are very vulnerable.
Therefore, all agricultural and food chain stages (production, processing, distribution and consumption) have been affected by the COVID-19 pandemic [
62], and the effects of the conflict in Europe significantly worsen the situation. According to the FOEE (2021) [
63], Europe imports 60% of the products needed to meet the consumers demand, and dependence will increase in tandem with the price of energy and fuel. The situation created in Europe emphasizes the risks and the degree of dependence on imported products for the countries in the area. Most European countries fail to meet the consumer demand from their own production, more specifically Austria, Cyprus, Croatia, Czech Republic, Estonia, Finland, Germany, Greece, Italy, Latvia, Luxembourg, Malta, Portugal, Romania, Slovakia, Slovenia, and Sweden [
64]. The population of developing European countries will have difficulty purchasing imported products because of the rising prices.
Crises create insecurity, but also opportunities for long-term, transformational change, leading to changes in patterns of political and economic interactions which would not have been possible otherwise [
61]. One solution would be to reduce external dependence. This implies a focus on streamlining the agricultural sector and increasing production. In terms of sustainability, the goal would include a focus on the development of local agri-food chains. High energy costs discourage agricultural producers from carrying out intensive activities and in many cases limit them to traditional ones, which describe the seasonal agricultural cycle. Agriculture follows the pattern of seasonality correlated with the product life cycle, the climate and soil physical characteristics [
65]. Reducing production affects food security and socio-economic stability, but local agri-food chains are crystallising as a possible solution, especially in countries where traditional agriculture is allowed by climate and relief conditions. In order to reduce the carbon footprint in agriculture, Farfan and Lohrmann (2019) proposed the elimination of pesticides and herbicides, fertilisers, and the reduction of water and transport. These solutions are in line with the development of local agri-food chains with the potential to support the environment and the demand of population in terms of reduced imports, rising prices due to shortages of fertilisers and rising energy prices. Therefore, agricultural chains, especially local ones, are seen as a solution for the environment and for the alleviation of food insecurity. Their development, the promotion and facilitation of consumer access is a way to support the population in benefiting from agri-food products made at lower costs compared to those resulting from intensive agriculture, in avoiding waste, losses and in optimising production. The performance of agricultural systems is extremely important [
66], and changes in agricultural patterns are needed to support the food security of the population [
67]. Of course, these effects are possible given the change in the producer behaviour in the agri-food sector because the supply of organic products should be excluded from the luxury goods market.
Understanding the role which agri-food chains play in alleviating food insecurity involves supporting small producers through economic policy, and cooperation of economic agents involved in all stages of the agri-food chain. Cooperation produces synergistic effects, including production costs and waste reduction, access to basic foodstuffs produced in sustainable conditions for the environment, local economy support and reduction of food insecurity. Therefore, agricultural and food chains are part of the agroecological system. Including organic farming, an agroecological system is a holistic approach in which we find ecological, economic, social elements [
68,
69] which are positively influenced by its proper functioning with the potential to revitalise the local economy and environment, and also to mitigate food insecurity during the energy crisis and the effects of conflicts among states. This conclusion validates the last proposed research hypothesis, (H
6).
5. Conclusions
In European OECD member countries, agricultural chains influence the carbon footprint. The results of the first research direction show that economic growth increases the carbon footprint, showing progress in meeting the targets set in the Green Pact for decoupling growth from resource consumption. An extension of the organically cultivated area bears a positive effect. In contrast, any increase in aquaculture production, fertilisers, investment in transport infrastructure and agricultural land increases the carbon footprint with harmful effects on the environment and biodiversity. Economic growth continues to represent a priority objective of economic policy in European countries, and in the field of agriculture it is recommended to shift towards organic farming, which is much more environmentally friendly. As long as the increase in agricultural areas does not reduce, on the contrary, it accentuates the harmful effects on the environment, it would be ideal for future food security to increase the share of organic methods in agricultural and aquaculture production, and to calibrate the number of fertilisers at an optimum level. Regarding the investments in road transport infrastructure, they are necessary and indispensable, but our results emphasize their harmful effects on the environment, so that, from the perspective of the subject under study, it is recommended to develop short agri-food chains. The results confirm, among other things, the conclusions reached by Aquilera et al. (2019) [
5], Litskas et al. (2020) [
7], Rivera et al. (2020) [
39], Wood et al. (2020) [
16], Mrówczyńska –Kamińska et al. (2021) [
17], Churchill et al. (2021) [
26], Erdogan (2020) [
27], Walling and Vaneeckhaute (2020) [
29], Tripathi et al. (2020) [
30], but refute those reached by Georgatzi et al. (2020) [
28] and Czyźewski et al. (2021) [
48].
The results obtained on the second research direction divide the European countries in two main clusters. The first consists of ten European countries where agricultural chains bear a less harmful effect on the environment, but the major European agricultural powers are not part of this cluster. These are found in the second cluster, a larger one, formed by economies where agricultural chains increase the carbon footprint. This situation involves an effort to adapt the methods employed without reducing the potential and efficiency of the agricultural sector and without affecting the population’s food security. Hence, this results in the need to adapt agricultural activities, so as to reduce the future impact on the environment by generating lower amounts of greenhouse gas emissions. It becomes necessary to adapt European and national economic policy measures as there is a great heterogeneity of the countries in the two clusters. This aspect draws attention to the differences in national characteristics of European countries. The results partially confirm those obtained by Dos Santos and Ahmad (2021) [
46], Fanelli (2020) [
47], Guth and Smḙdzic-Ambrožy (2019) [
4] and largely refute those obtained by Czyźewski et al. (2021) [
48].
The results of the third research direction show that European countries have adopted and implemented in time measures to reduce the carbon footprint of agricultural activities. This effect has been visible since 2008–2009, where we see the pollution reduction under the influence of the increase of variable values analysed, but not at the level and pace necessary to alleviate the environmental and biodiversity problem. These results confirm those of Lamb et al. (2021) [
15], Crippa et al. (2021) [
18], Tubiello et al. (2021) [
19], and Wood et al. (2020) [
16].
Local agricultural and food chains, in addition to making a positive contribution to the environment, are becoming a valve for alleviating food insecurity in vulnerable and recession-stricken economies. However, one condition would be to exclude organic products from the luxury category.
This study completes the literature, adds value by researching the effects of agricultural chains on reducing the carbon footprint in the European region, geographically and in temporary dynamics. The results of the study are useful to theorists interested in the subject, but also to economic policy makers and agricultural producers. There are clear limitations of the study related to the indicators analysed, the methods applied, the lack of data for all European countries and for a longer period.
Assessing the effects of numerous components of European agricultural chains on the carbon footprint allows us to provide some recommendations: on the one hand, to rethink and adapt agricultural strategies, in particular, and economic ones, in general. On the other hand, to raise awareness in both producers and consumers regarding the effects arising from the current relationship among the environment, agriculture and the economy, so that they voluntarily change their attitude and behaviour.


