Article

Integrated Organic-Inorganic Nitrogen Fertilization Mitigates Nitrous Oxide Emissions by Regulating Ammonia-Oxidizing Bacteria in Purple Caitai Fields

1
MOA Key Laboratory of Crop Ecophysiology and Farming System in the Middle Reaches of the Yangtze River, College of Plant Science & Technology, Huazhong Agricultural University, Wuhan 430070, China
2
Institute of Plant Nutrition, Resources and Environment, Beijing Academy of Agriculture and Forestry Sciences, Beijing 100097, China
*
Author to whom correspondence should be addressed.
Agriculture 2022, 12(5), 723; https://doi.org/10.3390/agriculture12050723
Submission received: 20 April 2022 / Revised: 17 May 2022 / Accepted: 18 May 2022 / Published: 20 May 2022
(This article belongs to the Special Issue Innovative Conservation Cropping Systems and Practices)

Abstract

:
Purpose Nitrogen (N) fertilizer application in agricultural soil is a primary anthropogenic nitrous oxide (N2O) source. Currently, the effect of the N fertilizer type on N2O emissions from upland soil has been rarely reported. To this end, impacts of various types of N fertilizer on N2O emissions in purple caitai (Brassica campestris L. ssp. chinensis var. purpurea) fields are investigated in this work. The field experiment was carried out with four treatments, including inorganic N fertilization (I), organic N fertilization (O), integrated organic-inorganic N fertilization (I+O) and no fertilization (CK). The nitrifier/denitrifier abundance was determined using absolute real-time quantitative PCR. Compared with I and O, I+O significantly increased dissolved organic C content, microbial biomass C and microbial biomass N by 24–63%, 12–38% and 13–36% on average, respectively. Moreover, the seasonal cumulative N2O-N emissions and fertilizer-induced N2O emission factor under I+O were significantly lower than those under I and O by 17–29% and 23–39%, respectively. The results indicate that N fertilizer type significantly affects the N2O emissions, and the integrated organic-inorganic N fertilization can mitigate the N2O emissions primarily by inhibiting the nitrification mediated by ammonia-oxidizing bacteria in purple caitai fields. Integrated organic-inorganic N fertilization is an ideal N fertilization regime to enhance soil fertility and yield and reduce N2O emissions in the upland fields.

1. Introduction

Nitrous oxide (N2O) is a bigger contributor to global warming compared with CO2 [1]. The N2O concentration in the atmosphere has risen by 20% since 1860 [1]. In addition, N2O is a dominant ozone-depleting substance and could remain the most threatening throughout the twenty-first century if its emissions are not controlled [2]. Considering that about 50–60% of N2O emissions are derived from agricultural soils [3], it is imperative to adopt proper agricultural practices to reduce N2O emissions.
Chemical nitrogen (N) fertilizers have been excessively applied worldwide to improve soil fertility and crop yields, consequently causing environmental losses such as soil degradation, water eutrophication and GHG emissions [4]. In recent years, it has been established that integrated inorganic-organic N fertilizer application could improve soil aggregation, soil structure and carbon (C) sequestration [5]. It has been found that N2O emissions is affected by the type and composition of the fertilizer [6]. Specifically, numerous studies have revealed that organic N fertilizers can lead to less N2O emissions than inorganic N fertilizers [7]. However, some other researchers observed greater N2O emissions under organic N fertilization than under mineral N fertilization [8]. In addition, Ding et al. [9] proposed use of compost and urea to reduce N2O emissions, whereas Agegnehu et al. [10] discovered that organic amendments incorporated with conventional N fertilizer could significantly increase N2O emissions. These diverse and inconsistent conclusions indicate that the dynamic responses of N2O emissions to organic and inorganic N fertilization are still elusive and require further research.
The N2O in the soil is mainly biologically produced by nitrification and denitrification [11]. Nitrification is the oxidation of ammonia first to nitrite and then to nitrate, which is predominantly performed by aerobic nitrifying microorganisms including ammonia-oxidizing bacteria (AOB) and archaea (AOA) [12]. The initial step of nitrification is catalyzed by ammonia monooxygenase (AMO) [13]. Owing to its importance in the energy-generating metabolism, amoA is primarily applied as a marker gene in nitrification studies [14]. Reversely, denitrification is a facultative anaerobic pathway during which nitrate is reduced to nitrite and free nitrogen [15]. Nitrite reductase (NIR) is an essential enzyme that converts nitrite to N2O, and the most widely used marker genes for NIR are nirK and nirS [16]. All these microbial processes are highly susceptible to environmental parameters and agricultural practices including fertilization. Therefore, quantifying the microbial functional genes in the process of nitrification and denitrification can provide important information for the mitigation of N2O emissions [17].
Purple caitai (Brassica campestris L. ssp. chinensis var. purpurea), also known as zicaitai, is a traditional vegetable crop widely planted in the south of China and has become increasingly popular due to its high nutrient content [18]. Usually, high rates of N fertilizer are applied to promote purple caitai growth and development, inevitably leading to a considerable amount of N2O emissions from the soil. This environmental impact varies with different types of N fertilizers as mentioned above, which, however, has been scarcely studied in purple caitai fields. Hence, this paper studied the impact of various types of N fertilizers on N2O emissions in purple caitai fields. We hypothesized that the combined application of inorganic/organic N fertilizers could reduce N2O emissions through decreasing nitrification and denitrification.

2. Material and Methods

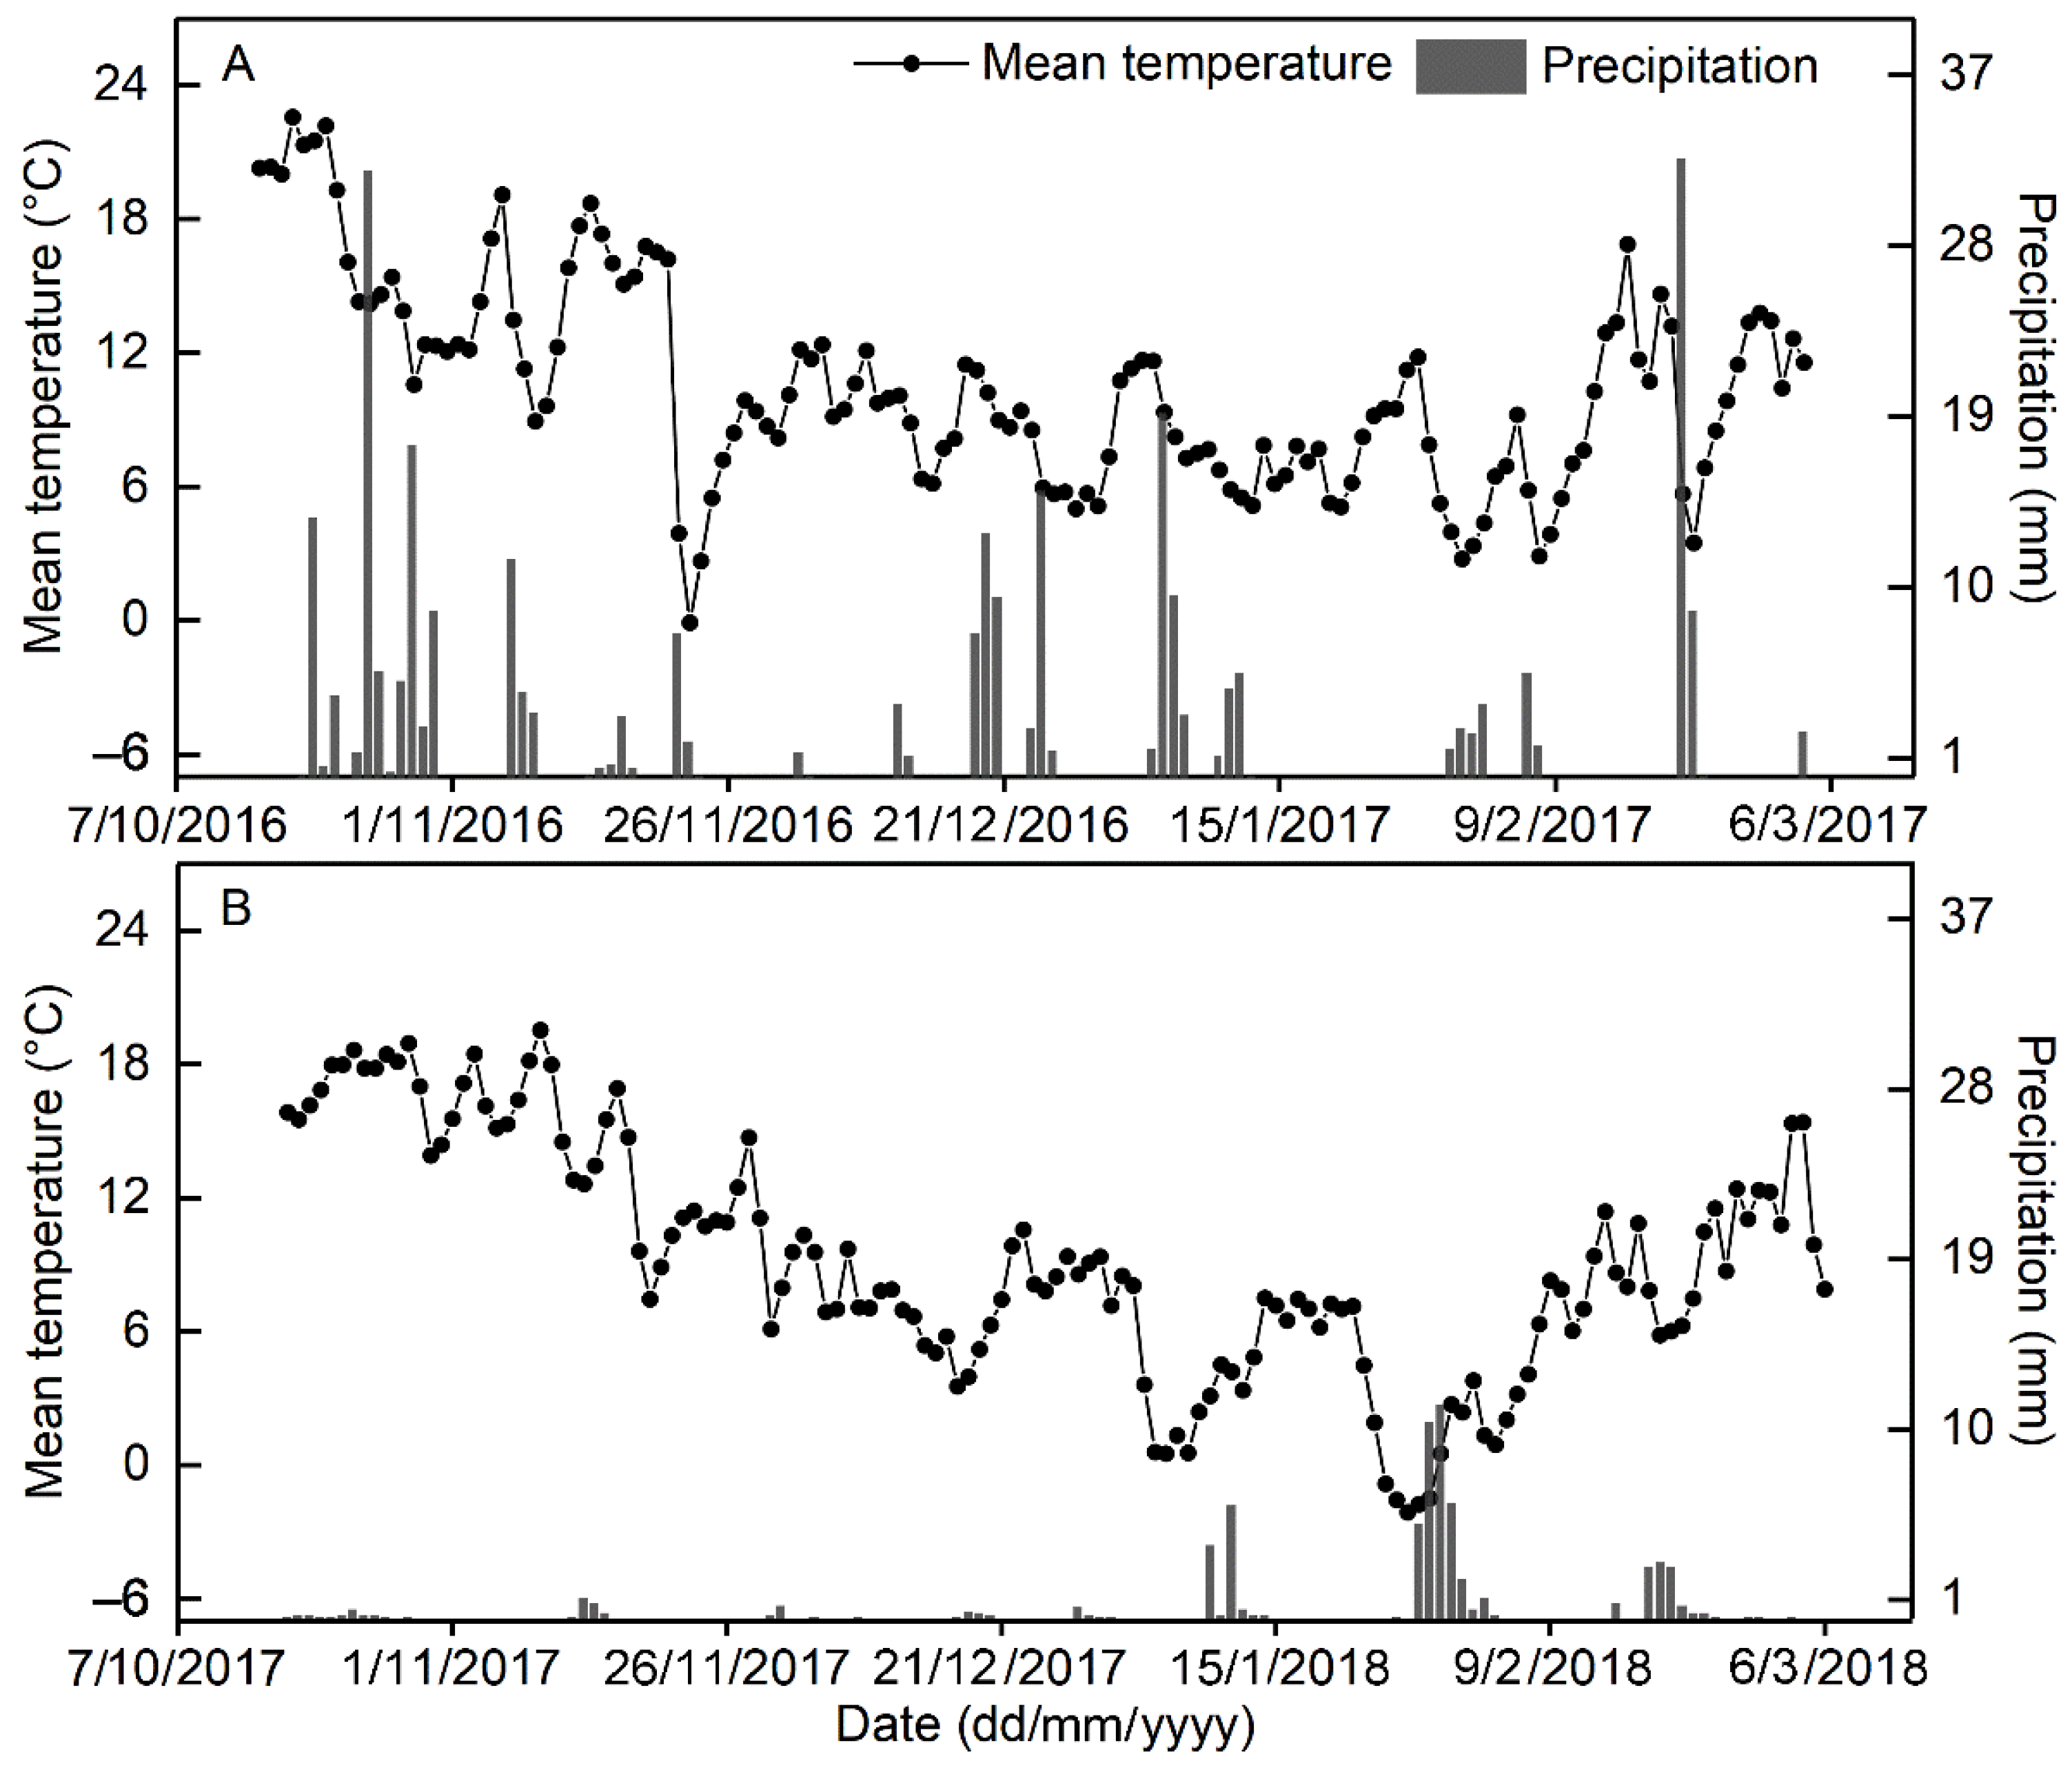
2.1. Experimental Site

The experimental site is located in Huazhong Agricultural University, Wuhan City, Hubei Province, China (30°28′21″ N latitude, 114°20′48″ E longitude), with an average annual temperature of 16.3 °C and an average annual precipitation of 1163 mm (rainfall mostly occurs between May and August) from 1961 to 2010 (Figure 1). The mean daily temperature and precipitation during the purple caitai growing seasons in 2016 and 2017 are shown in Figure 1. The total precipitation during the experimental period was 287.9 mm in 2016 and 66.1 mm in 2017, respectively. The soil is classified as Alisols with a clay loam texture (FAO soil clarification). The main soil properties before the experiment (measured in September 2016) were pH 7.03, organic C 9.13 g kg−1, total N 1.15 g kg−1, total phosphorus (P) 0.39 g kg−1, and total potassium (K) 8.67 g kg−1.

2.2. Experimental Design

An upland field experiment on purple caitai was carried out during the 2016 and 2017 growing seasons. The seedlings of purple caitai (HSCT, Brassica campestris L. ssp. chinensis var. purpurea) were transplanted in October and harvested in March of the next year, followed by a fallow season. Four treatments, including no fertilization (CK), inorganic N fertilization (I), organic N fertilization (O) and integrated organic-inorganic N fertilization (I+O) were implemented, and each treatment had three replications. Each plot was 12 m2 in area. Each treatment of the experimental field has been planted with purple caitai under the same N fertilization since 2011.
The soil was moldboard plowed to a depth of 15 cm beforehand. Compound fertilizer (N:P2O5:K2O = 15%:15%:15%), urea (46% N), calcium superphosphate (17% P2O5), potassium chloride (60% K2O) and pelleted organic fertilizer (N:P2O5:K2O = 10%:3%:2%, living bacteria count ≥ 2 × 10⁷ CFUs g−1; Compound Bio-NH4+-fertilizer, Wuhan Heyuan Green Organism Co., Ltd., Wuhan, China) were selectively incorporated into the topsoil (0–20 cm depth) to provide 225 kg N ha−1, 112.5 kg P2O5 ha−1 and 112.5 kg K2O ha−1 for the plots under fertilization treatments throughout the growing seasons. The P and K fertilizers were used as basal fertilizers. As for the N fertilizer, 50%, 100% and 75%, respectively, were applied to the plots under I, O and I+O treatments as basal fertilizer, while the rest was applied at the bolting stage as topdressing fertilizer. No fertilizer was applied to the CK plots. The specific fertilization regimes are shown in Table 1. After basal fertilization, 20-day-old seedlings of purple caitai were manually transplanted on the same day. The field was only irrigated once to 3 mm immediately after the transplanting of seedlings. No irrigation was conducted after this time.

2.3. Gas Sampling

Soil N2O fluxes throughout the growing seasons of purple caitai were measured by the static chamber-gas chromatography method [19] (Li et al., 2013). In brief, the sampling chamber was a 1.1 m high steel barrel with a diameter of 0.3 m. Chamber bases with a groove of the ring were installed in each plot. The air-tightness of the chambers during the gas sampling was ensured by filling water in the groove of the ring. After shutting down the chamber, the air was mixed using four fans on the top of the chamber. A 30 mL syringe was used to extract the gas from the barrel through the three-way valve and inject it into a 30 mL glass vial that had been vacuumed beforehand. The sampling interval was 10 min, and the sampling time was 0 min, 10 min, 20 min and 30 min. At the same time, the barrel height and air temperature inside the chamber were recorded. The sampling was carried out after every N fertilization event or every ten days otherwise (from 15 October 2016 to 4 March 2017 and from 17 October 2017 to 6 March 2018) between 8:30 am and 11:00 am, with four samples being successively collected per plot at the interval of 10 min (at 0 min, 10 min, 20 min and 30 min).
The N2O concentrations were measured by gas chromatography (Shimadzu, GC-14B, Tokyo, Japan) as described by Li et al. [19]. The N2O flux was calculated according to the method of Li et al. [19], and seasonal cumulative N2O emissions were measured according to the following equations:
C E = i n ( ( F i + F i + 1 ) / 2 × 24 × D i ) / 10 5 × 2 × 14 44
where CE is the cumulative N2O emissions over the whole growing season of purple caitai (kg ha−1), Fi and Fi+1 represent the N2O fluxes measured on two adjacent sampling dates (µg m−2 h−1), Di represents the length of the ith sampling interval (d), 14 represents the relative atomic mass of N, 44 is the relative molecular mass of N2O, and n represents the total number of sampling intervals.
The fertilizer-induced N2O emission factor (EFN2O) was calculated as the difference in seasonal cumulative N2O-N emissions between N fertilizer treatments and CK divided by the total amount of fertilized N [1].

2.4. Soil Sampling and Measurement

Five soil cores were collected from each plot on the same date as the gas sampling. After the removal of plant debris and stones, the soil cores from the same plot were mixed and homogenized into a composite sample. These composite samples were then divided into subsamples for chemical and biological analysis.
Chemical analysis was carried out for the soil samples obtained throughout the growing seasons of purple caitai (at an interval of one month). The contents of total C (TC) and N (TN) were measured using a FlashEA 1112 element analyzer (Thermo Fisher Scientific, Waltham, MA USA). The dissolved organic C (DOC) was extracted from a soil–water solution using the suction filtration method [20], and the microbial biomass C (MBC) and microbial biomass N (MBN) were extracted using the chloroform fumigation-extraction method [21]. Soil DOC, MBC and MBN contents were measured using the Walkley–Black method [22]. The soil NH4+–N and NO3–N were extracted by dissolving 20 g of fresh soil with 100 mL of 1 mol L-1 KCl solution and filtered through Whatman #1 filter paper after being shaken for one hour [23] (Zaman et al., 2009). The NH4+–N and NO3–N contents in the soil extracts were then analyzed using a flow injection analyzer. The gross nitrification and denitrification rates were measured using the method proposed by Yao et al. [20]. In brief, fresh soils were amended with ammonium sulfate or KNO3. The treated soil was thoroughly homogenized in the bottle and added deionized water. The bottles were covered by a polyethylene film with tiny holes and incubated at 30 °C. After 15 days of incubation, the treated soil was extracted with 2 mol L−1 KCl, and mineral N (NH4+ and NO3) was determined. The treated soils from the other bottles were incubated under anaerobic conditions at 30 °C for 5 days with NO3, extracted with KCl and determined using the continuous-flowing analyzer. Soils without ammonium sulfate or KNO3 were taken as the controls. The rates of nitrification and denitrification were calculated as the differences in mineral N concentrations or NO3 contents between the 0 and 7 or 5 day samples divided by the amounts of added ammonium sulfate or KNO3.

2.5. Measurement of Yield and Calculation of Yield-Scaled N2O Emissions

When the length of the red tender stems of the vegetable was more than 40 cm, the red tender stems from the plots were harvested and weighed.
The yield-scaled N2O emissions (t CO2-eq. t−1 yield) were calculated as the ratio of cumulative N2O emissions (converted into CO2 equivalents) to purple caitai yields.

2.6. Absolute Real-Time Quantitative Polymerase Chain Reaction (PCR) Analysis

Genomic DNA was extracted from the composite soil samples and then analyzed using a NanoDrop spectrophotometer (NanoDrop Technologies Inc., Wilmington, DE, USA). Absolute real-time quantitative PCR was carried out in 96-well PCR optical plates in triplicate per sample. The PCR protocol is shown in Table S1.
The proper dilution factor of the template DNA was determined by running quantitative PCR with different dilutions of template DNA in order to avoid PCR inhibition. Using a threshold cycle of 31 as the detection limit, a melting curve analysis was carried out to examine the specificity of the amplified products. Standards for all assays were prepared and then serially diluted for the construction of standard curves.

2.7. Statistical Analysis

One-way fixed effects ANOVA or two-way repeated measures ANOVA using the general linear model of SPSS software was conducted. Before ANOVA, the normality and homoscedasticity of data were tested, and the datasets that did not pass the tests were subjected to log transformation. One-way or two-way repeated measures ANOVA was conducted. If the ANOVA result was significant, the least significant difference test or Tukey’s HSD test was carried out. The significance of the difference was defined as p ≤ 0.05. A similarity percentage (SIMPER) analysis was performed to analyze the relative contribution of each functional gene to the variations in nitrifier/denitrifier abundance among different treatments with Past (Øyvind Hammer, University of Oslo, Oslo, Norway; Version 3.26). The partial correlation coefficient (r) was calculated using SPSS [24].

3. Results

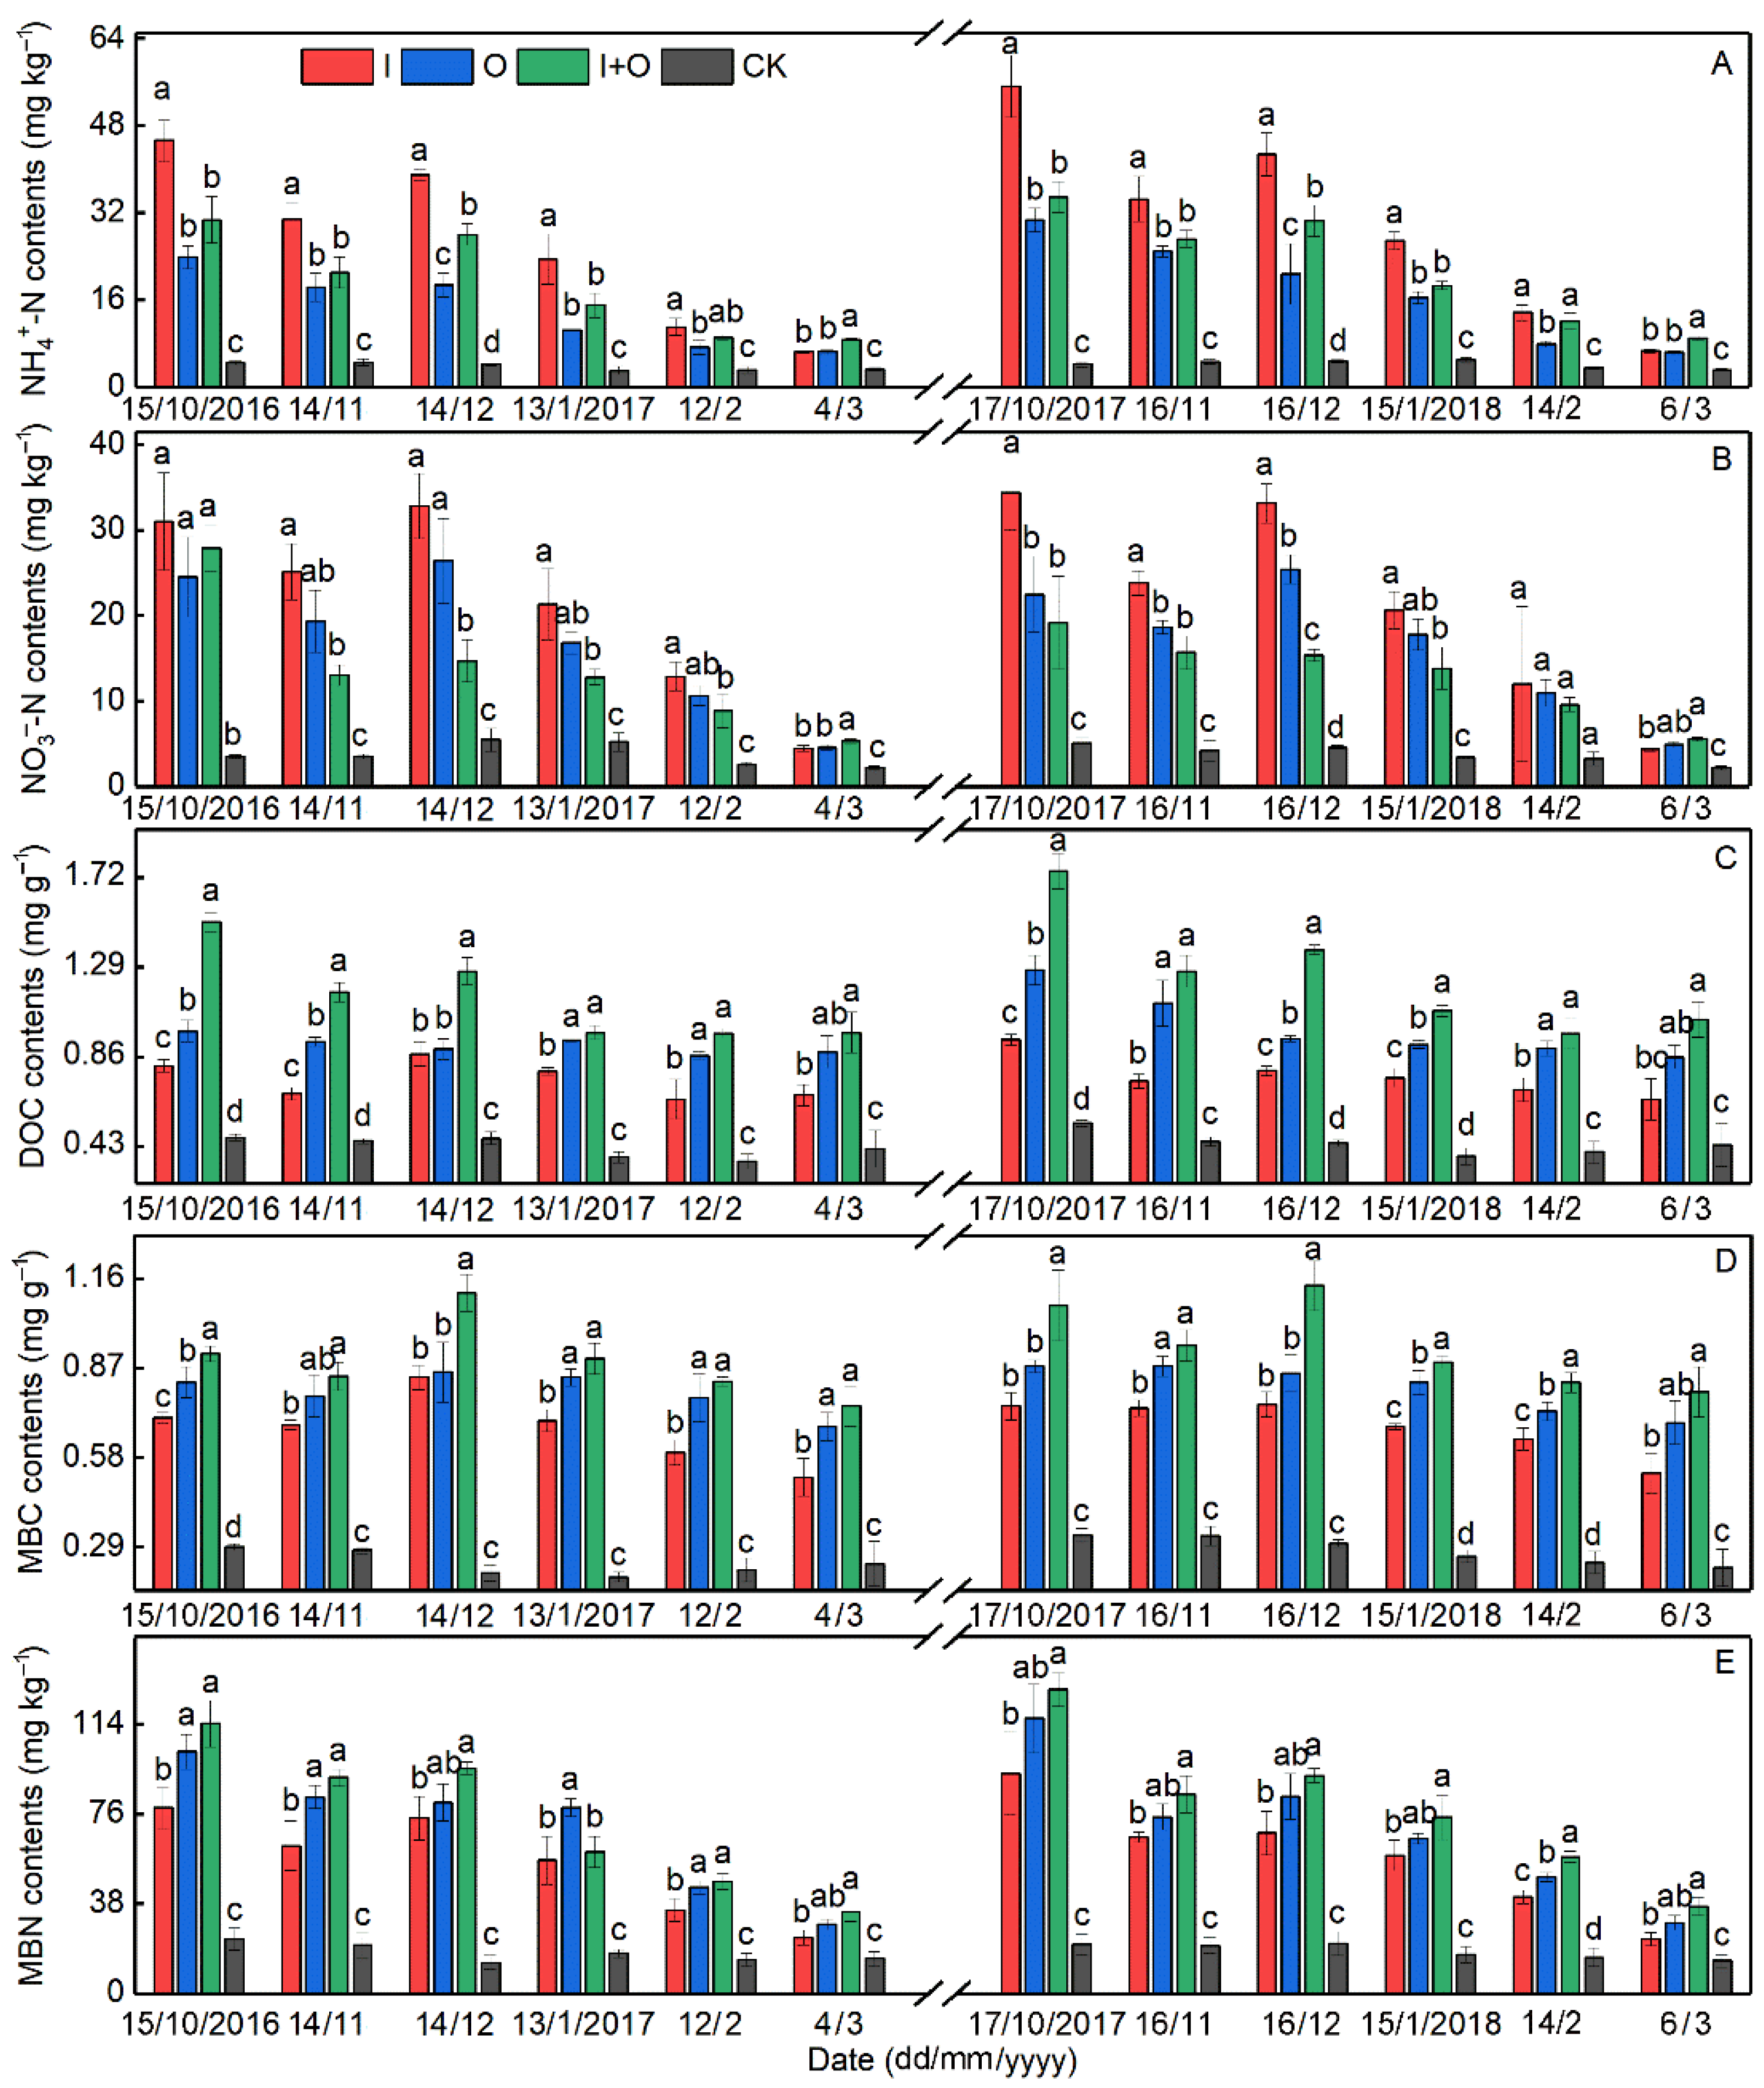
3.1. Soil Chemical Properties

Compared with CK, N fertilization treatments significantly enhanced the TC and TN contents at the harvest stages by 23–45% and 31–57%, respectively (Table S2). Furthermore, the N fertilizer type imposed a significant impact on TC, with significantly higher TC under I+O than under I and O by 7–18%. However, I+O only significantly increased TN in the 2017 growing season by 16–17% compared with I and O, while no significant differences were found between I, O and I+O in the 2016 growing season (Table S2).
The NH4+–N, NO3–N, DOC, MBC and MBN contents under N fertilization treatments varied similarly in the 2016 and 2017 growing seasons of purple caitai, and all peaked immediately after the application of basal and topdressing N fertilizers (15 October and 14 December 2016; 17 October and 16 December 2017) (Figure 2).
According to two-way repeated measures ANOVA, N fertilization treatments increased the contents of NH4+–N and NO3–N as compared with CK, (Figure 2A,B). Moreover, there were significant differences in the contents of soil NH4+–N and NO3–N among N fertilization treatments (Figure 2A,B). The NH4+–N contents from four sampling stages (15 October 2016 to 13 January 2017 and 17 October 2017 to 15 January 2018) under I+O were significantly lower than those under I by 21–37%. The NH4+–N contents on 14 December 2016, 4 March and 16 December 2017, and 14 February and 6 March 2018 under I+O 35–54% (p < 0.05) higher than under O. Meanwhile, the NO3–N contents from four sampling stages (15 October 2016 to 13 January 2017 and 17 October 2017 to 15 January 2018) under I+O were also significantly lower than those under I by 31–55%. The NO3–N contents on 12 December 2016 and 16 December 2017 under I+O were significantly lower than those under O by 40–44%.
As for the DOC, MBC and MBN contents, they were all significantly higher under N fertilization treatments than under CK (Figure 2C–E). Specifically, among N fertilization treatments, I+O caused higher DOC and MBC contents than I and O. In addition, in the 2016 growing season, the MBN contents were significantly higher under I+O than under I by 34% on average, while no significant differences were found between I+O and O. However, in the 2017 growing season, the MBN contents under I+O were significantly higher than under I and O by 13–36% on average.

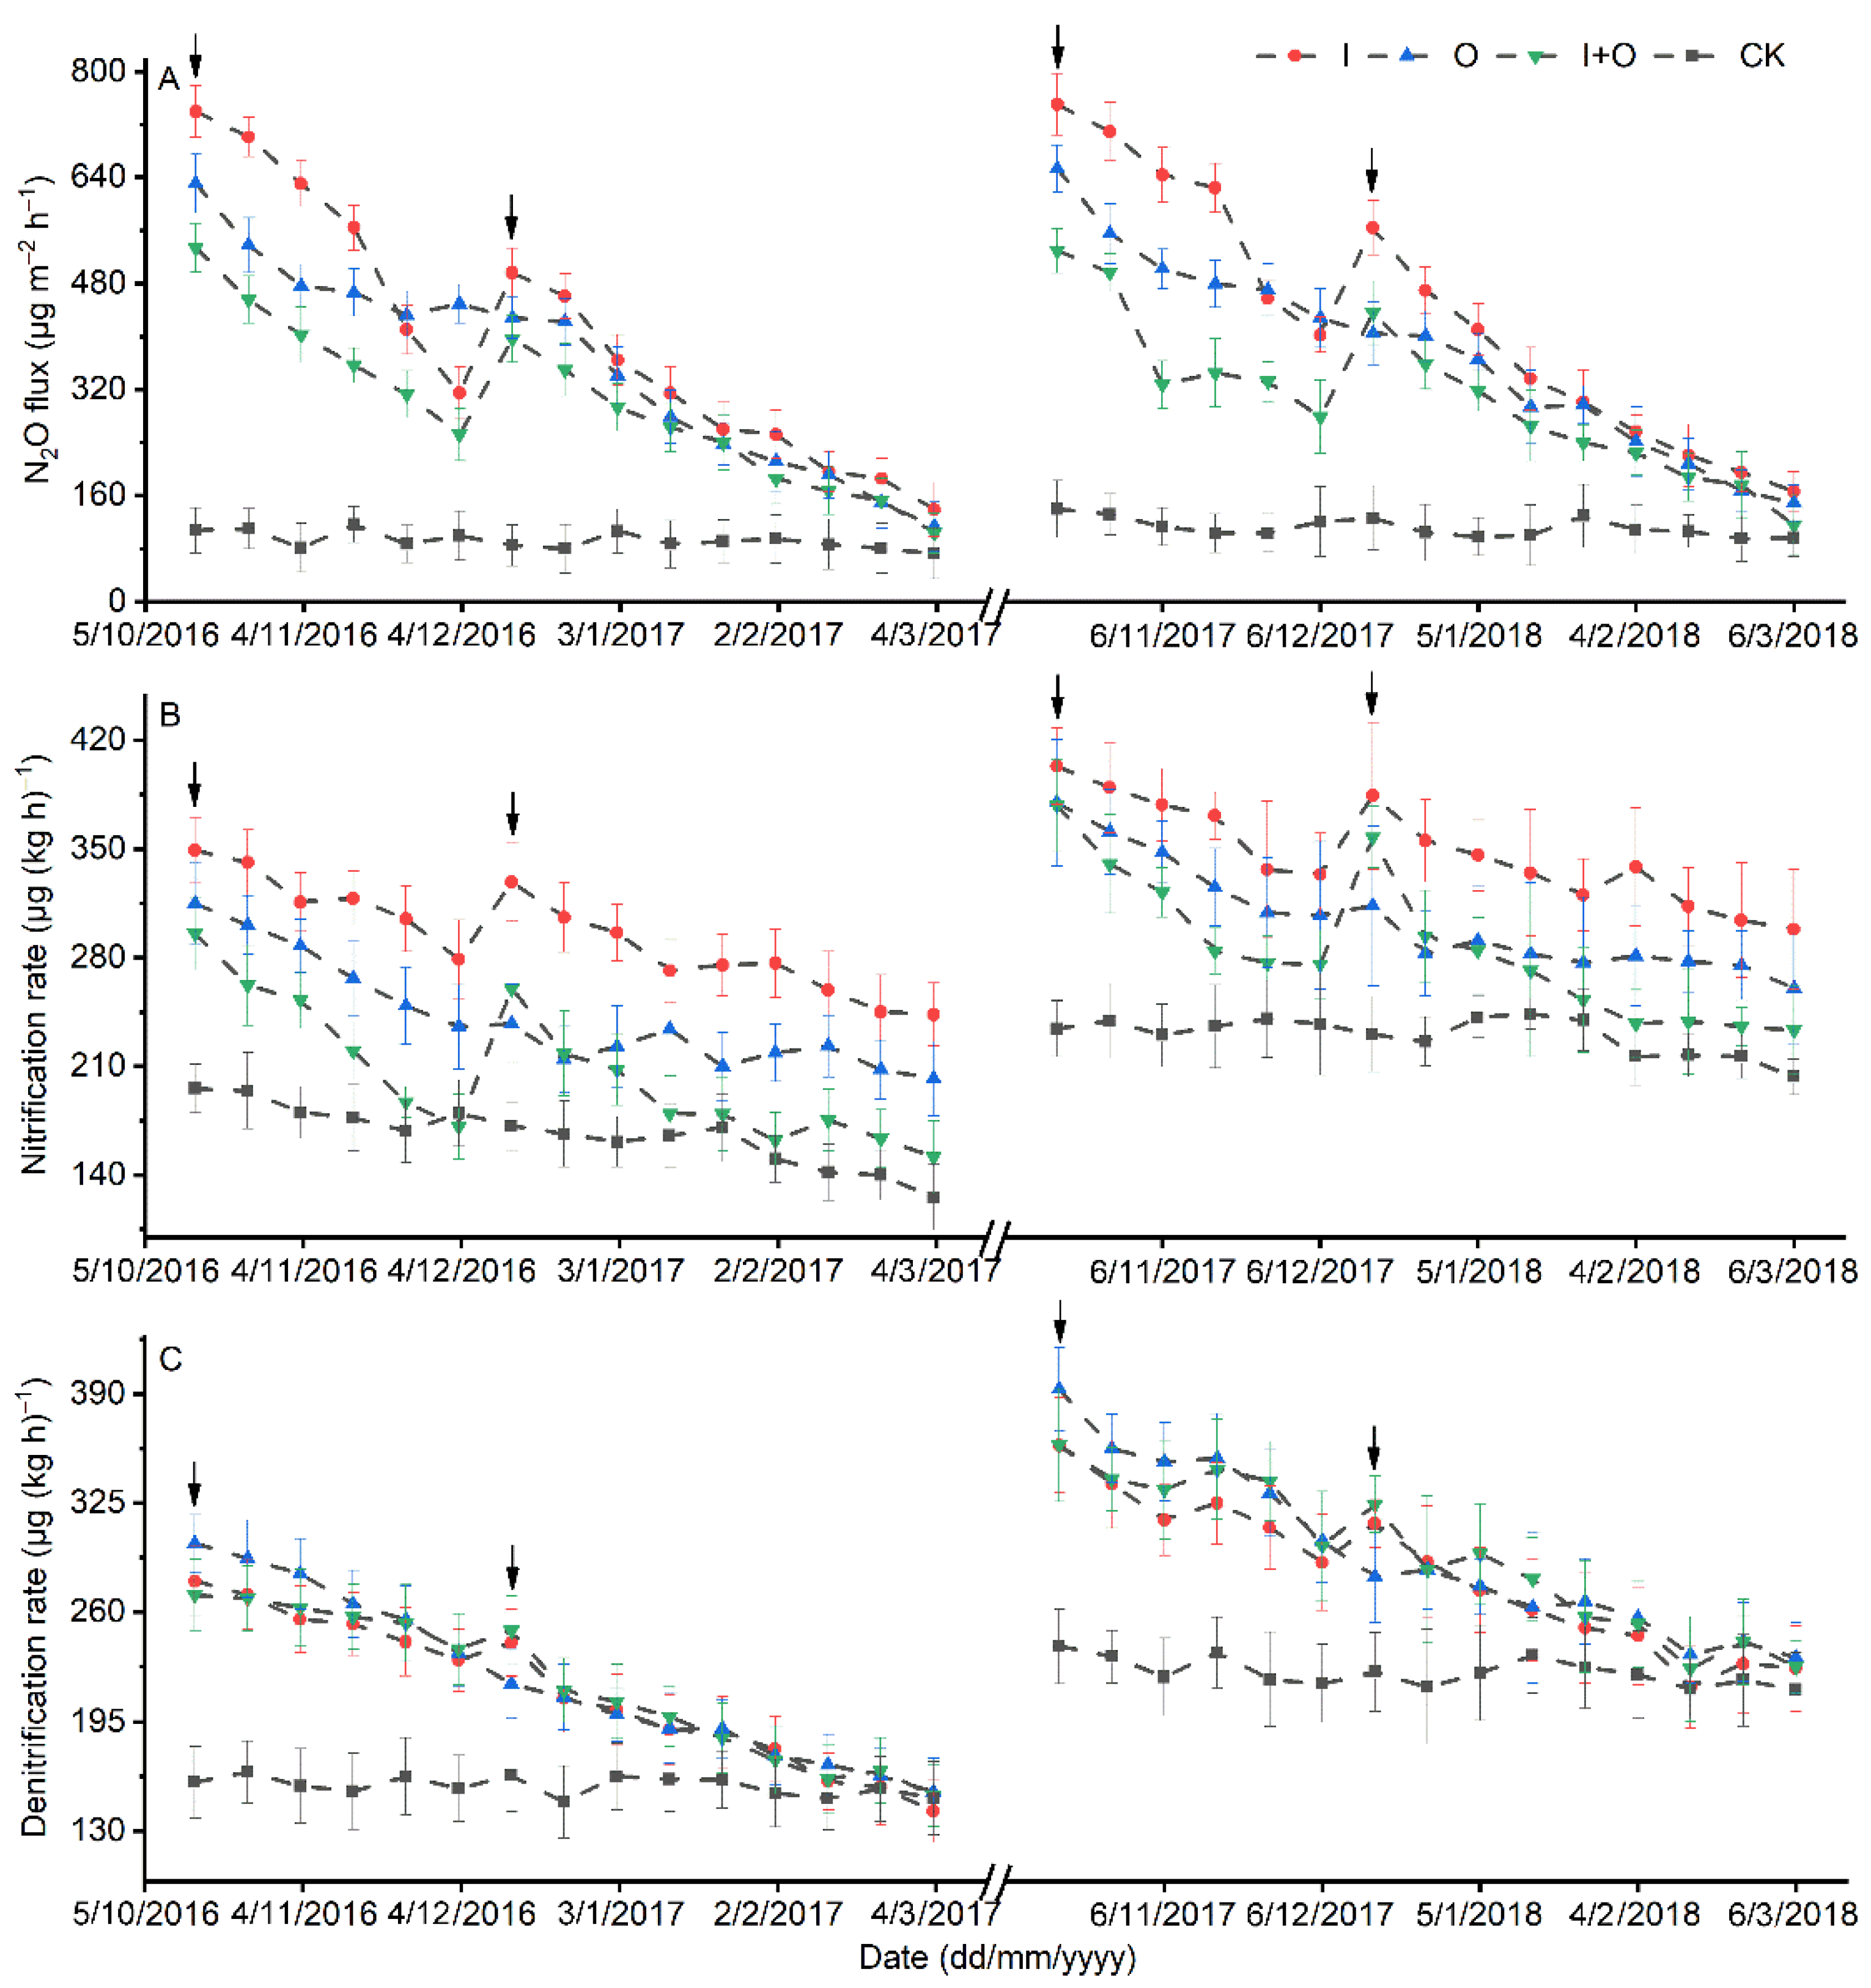
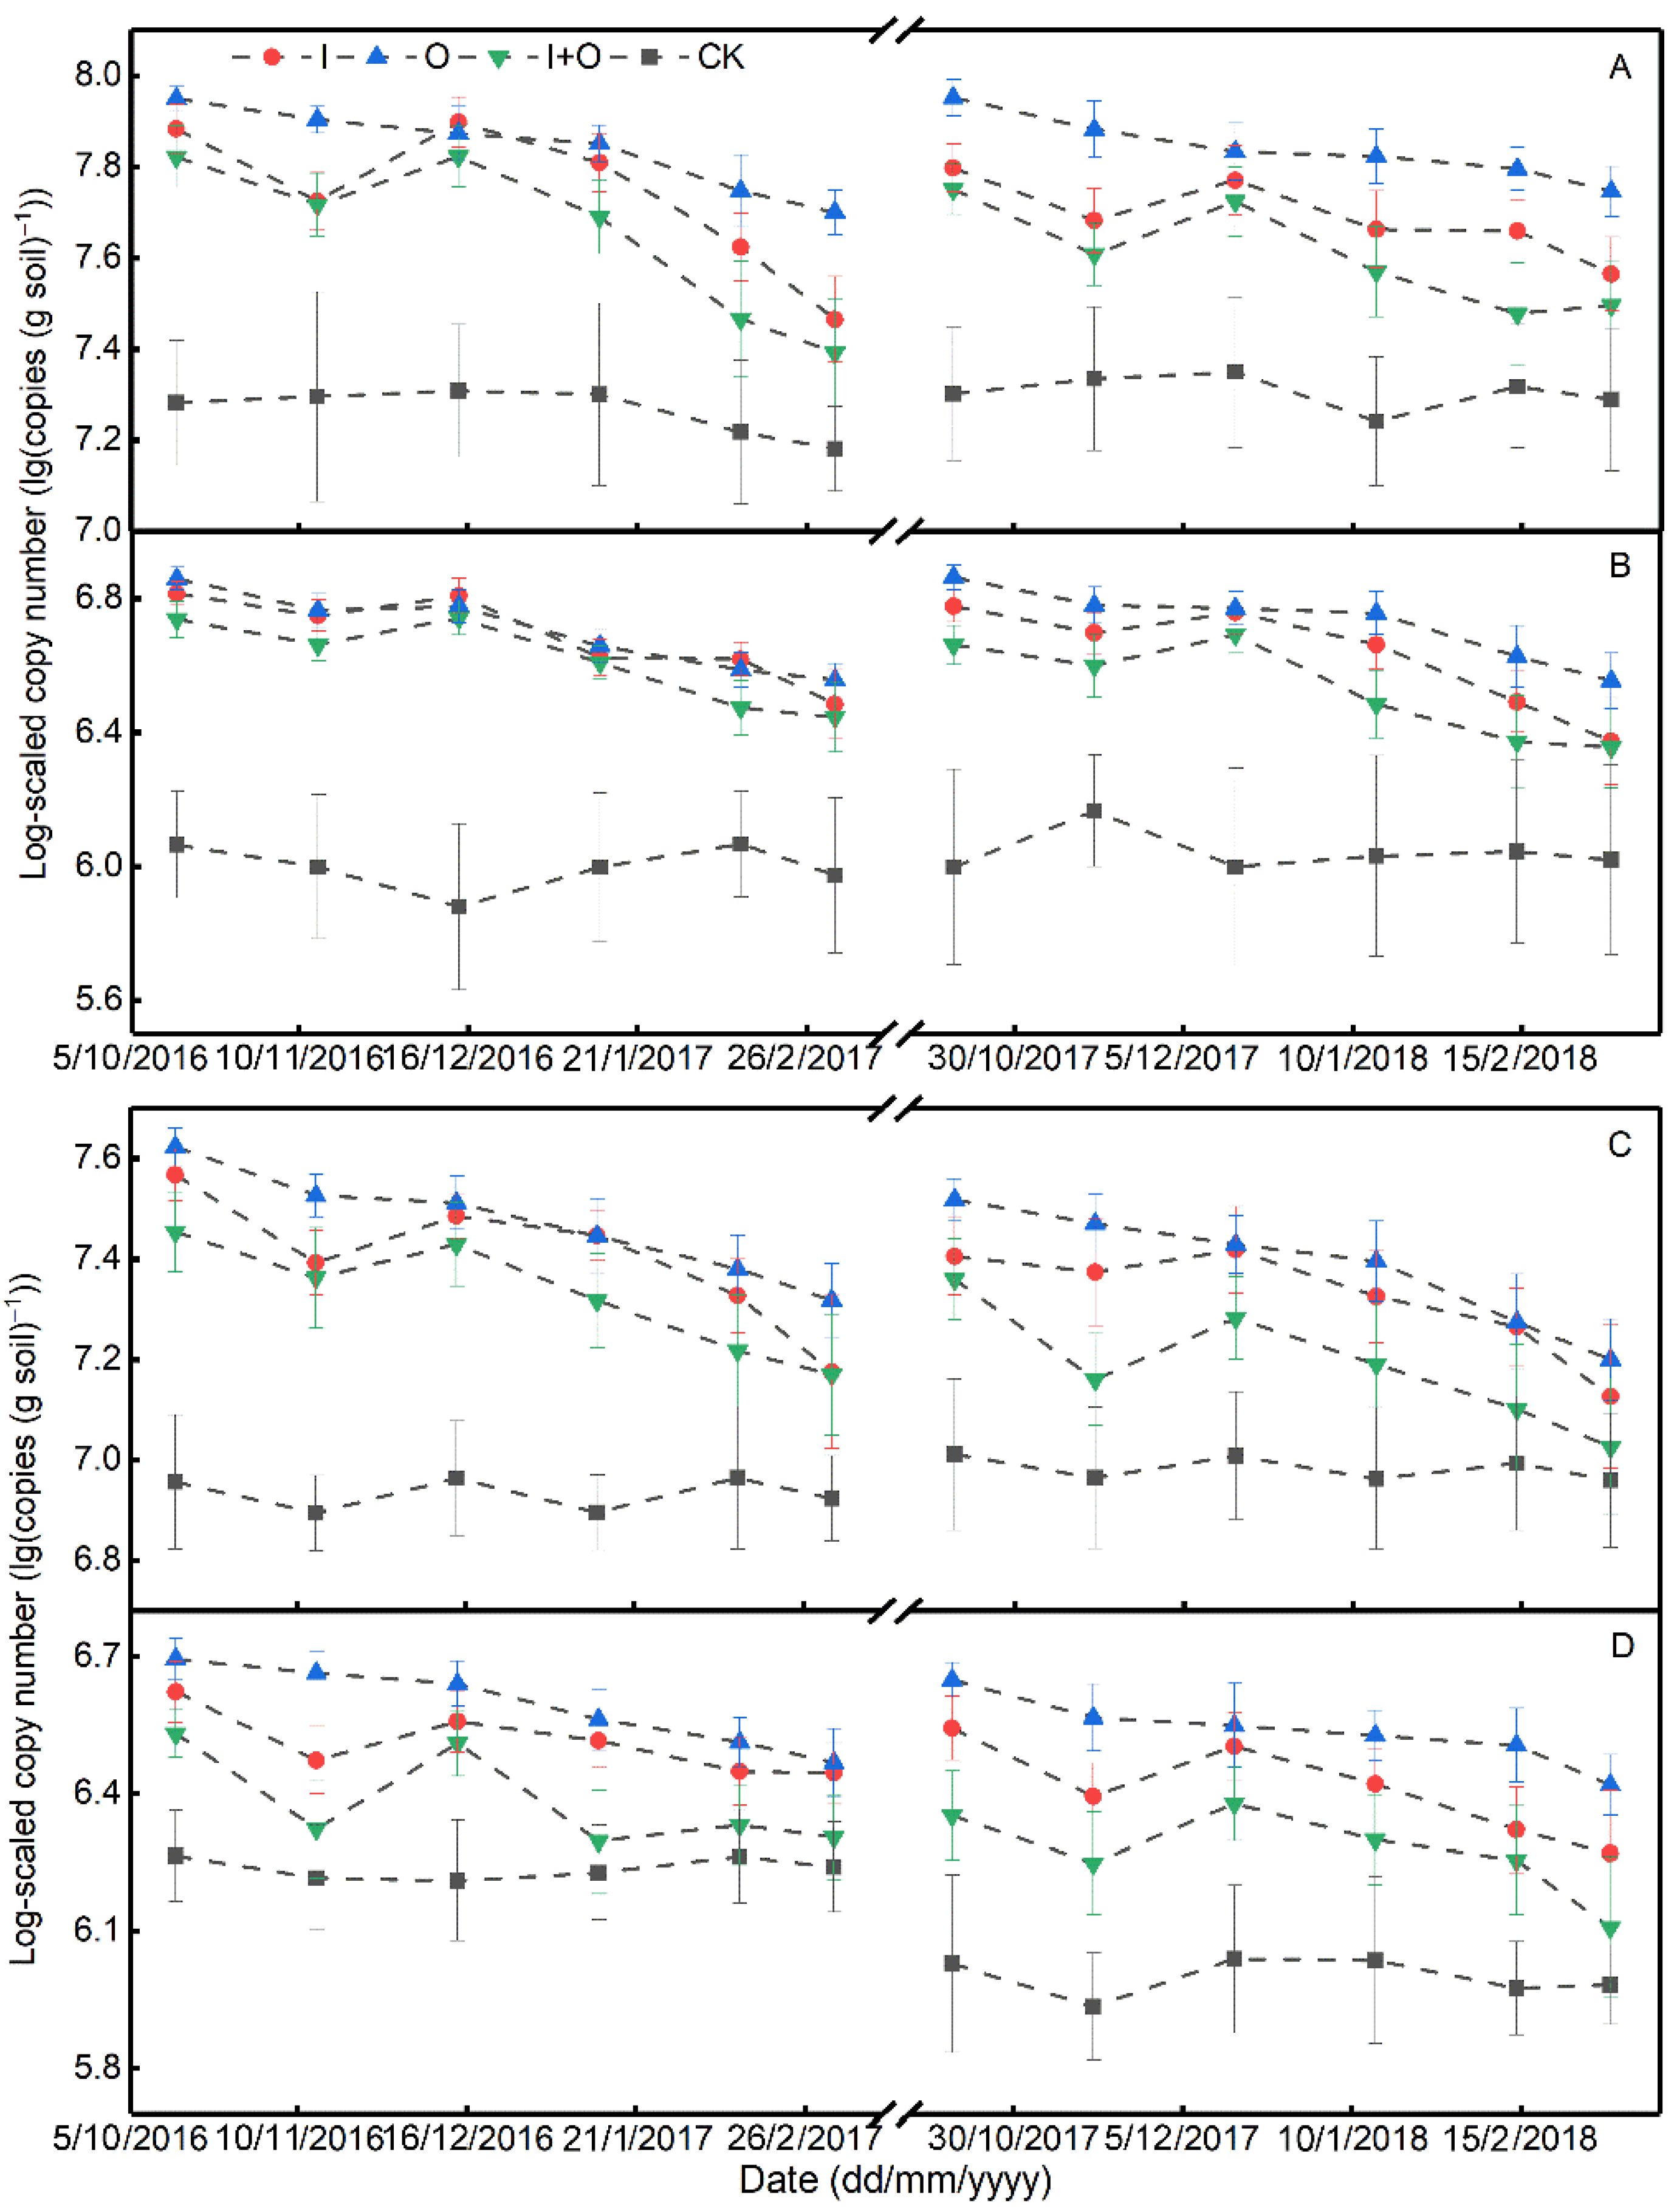
3.2. Soil Nitrification and Denitrification Rates, and Abundances of Nitrifier and Denitrifier Genes

The nitrification and denitrification rates throughout two growing seasons of purple caitai showed similar variations to the N2O fluxes (Figure 3).
Both the nitrification and denitrification rates under N fertilization treatments peaked immediately after the application of basal and topdressing fertilizers. The nitrification rates were 125.6–403.4 µg kg–1 h–1, and the denitrification rates were 141.9–392.7 µg kg–1 h–1. N fertilization treatments increased the nitrification and denitrification rates by 24–77% and 26–40% on average compared with CK, respectively. Moreover, N fertilizer types were found to have a significant impact on the nitrification rate. The nitrification rate under I+O was significantly lower than that under I and O by 6–30% on average. However, no significant differences in denitrification rates were found among I, O and I+O.
As illustrated in Figure 4, the abundances of nitrifier and denitrifier genes peaked immediately after the application of basal and topdressing fertilizers. N fertilization treatments increased the abundance of nitrifiers and denitrifiers compared with CK (Figure 4). Besides, the abundances of nitrifiers and denitrifiers were also significantly affected by N fertilizer type. The abundance of the AOB-amoA gene under I+O was lower than I and O, while there was no significant difference in AOA-amoA gene abundance among I, O and I+O. In addition, the abundances of both nirK and nirS genes under I+O were significantly lower than those under I and O by 16–35% and 24–44%, respectively.

3.3. N2O Emissions

The N2O fluxes under N fertilization treatments showed an identical trend in the 2016 and 2017 growing seasons of purple caitai and peaked immediately after the application of basal and topdressing N fertilizers (Figure 3A). The N2O fluxes were 139.2–750.0 µg m–2 h–1 under I, 113.2–652.8 µg m–2 h–1 under O, 103.7–533.7 µg m–2 h–1 under I+O, and 72.9–139.9 µg m–2 h–1 under CK.
The N fertilizer type showed a significant impact on the seasonal cumulative N2O emissions in purple caitai fields (Table 2). N fertilization treatments increased the cumulative N2O-N emissions by 176–332% compared with CK. Among N fertilization treatments, I+O caused the lowest seasonal cumulative N2O-N emissions, which were significantly lower than those under I and O. In addition, the type of N fertilizers showed significant effects on the EFN2O in purple caitai fields as well (Table 2). The EFN2O under I+O was significantly lower than that under I and O in two growing seasons.

3.4. Correlation among Soil Chemical Properties, Nitrifier/Denitrifier Abundance, Nitrification/Denitrification Rate and N2O Flux

The results showed that the AOB-amoA gene was the major contributor to the variations in nitrifier abundance among fertilization treatments, while nirK and nirS genes had roughly the same contribution to the variations in denitrifier abundance among fertilization treatments (Table 3). N2O flux was positively related to nitrification rate, while it showed no significant correlation with denitrification rate (Table 4). A SIMPER analysis was carried out to estimate the respective contributions of each functional gene to the variations in nitrifier/denitrifier abundance among different fertilization treatments.
Partial correlation coefficients were used to measure the correlations among soil chemical properties, nitrifier/denitrifier abundance, nitrification/denitrification rate and N2O flux in the 2016 and 2017 growing seasons of purple caitai (Table 4). There was a weak positive correlation between AOB-amoA and NO3–N in the 2016 growing season, while there were negative correlations between AOB-amoA and MBC/MBN in both growing seasons. AOA-amoA was in positive relation with NO3–N but in negative relation with DOC, though the correlations were not strong. nirK and nirS were both weakly positively correlated with NO3–N. Moreover, nitrification rate was in a moderate and a weak positive relation with NH4+–N and NO3–N, respectively, but in a moderate negative relation with DOC, MBC and MBN. There was a strong positive relation between nitrification rate and AOB-amoA, while the correlations between nitrification rate and the other three functional genes were all weakly positive. However, no significant correlations of denitrification rate with other variables, except for the weak positive one with nirS in the 2016 growing season, were observed.

3.5. Yield and Yield-Scaled N2O Emission

The N fertilization significantly increased the yield by 82–172% compared with CK (Table 2). Among N fertilization treatments, I+O caused the highest yield in both 2016 and 2017, followed by I and O. Moreover, N fertilizer types significantly affected the yield-scaled N2O emissions. Among N fertilization treatments, I+O treatment resulted in the lowest yield-scaled N2O emission.

4. Discussion

4.1. Effect of N Fertilizer Type on Soil Properties

The N fertilizer type had a great influence on the soil properties in the purple caitai fields. The contents of available N in topsoil (0–20 cm) under integrated organic-inorganic N fertilization were significantly lower than that under inorganic N fertilization (Figure 2A,B), which was directly induced by the higher and faster mineral N input from inorganic fertilizers. Besides, the application of integrated organic and inorganic N fertilizers significantly increased the storage of labile soil organic C (SOC) and N (Figure 2) as compared with the single application of organic or inorganic N fertilizer. Research has been reported on the combined application of organic and inorganic N fertilizers, which could stimulate soil microbial activity compared with the single application of organic or inorganic N fertilizer [25,26], which thereby boosts organic matter mineralization and facilitate SOC turnover and nutrient availability in soil. Moreover, compared with organic N fertilization, integrated organic-inorganic N fertilization could lead to an increase in labile SOC and N pool due to a stronger priming effect of root exudates on soil organic matter owing to the promoted plant growth under faster mineral N input [27]. So, higher DOC, MBC and MBN were observed under I+O than I and O (Figure 1), which also suggests that the application of integrated organic-inorganic fertilizers could help maintain soil fertility by enhancing the labile organic C and N. Similar results were reported by Ali et al. [28], who indicated that the combined application of inorganic-organic N fertilizers could improve soil quality with more labile SOC fractions. Interestingly, we observed higher DOC immediately after the N application. This may be because this study was preceded by continuous cultivation of purple caitai under different N fertilization for 5 years, thus leading to higher initial DOC contents under I+O at the beginning of this study.

4.2. Effect of N Fertilizer Type on the Abundance and Activity of Nitrifiers/Denitrifiers

Higher abundance and greater activity of nitrifiers/denitrifiers were observed immediately after the application of basal and topdressing fertilizers during the two growing seasons as well as under N fertilization treatment compared with CK (Figure 3B,C and Figure 4). Moreover, the activity and abundance of nitrifiers/denitrifiers are positively correlated with the N fertilization intensity [29], and thus N addition significantly increased AOB abundance [30].
The abundances of AOB-amoA, nirK and nirS genes under I+O were all significantly lower than those under I and O, whereas there was no significant difference in abundance of AOA-amoA genes among various N fertilization treatments (Figure 4), indicating that AOA are less sensitive to the variations in N fertilizer type than other N-cycling microbial communities, which is consistent with the results of SIMPER analysis (Table 3). Similarly, many studies have shown that N fertilization can induce obvious changes in the AOB community but not in the AOA community [31]. Moreover, different N fertilizer types only altered the activity of nitrifiers but not that of denitrifiers (Figure 3B,C), contradicting the variations in denitrifier abundance (Figure 4). This inconsistency was probably because of the coupled effects of the denitrification-controlling abiotic factors such as oxygen (O2) content and organic C/N substrates [32].
The MBC and MBN contents under I+O were higher than those under I and O (Figure 2D,E), implying that the integrated N fertilization could enhance the microbial abundance in soil. It has been noted that heterotrophic bacteria usually have higher abundance and activity than nitrifying bacteria [33]. Thus, with more O2 being consumed by other microorganisms, the growth of AOB was inhibited, resulting in the lower abundance of AOB, which agrees well with the negative correlation between AOB and MBC/MBN (Table 4). Besides, the lower NH4+–N availability under I+O compared with that under I may further inhibit the nitrification (Figure 2A). Moreover, the nitrification rate was only strongly correlated with AOB (Table 4), so the decline in AOB abundance was most responsible for the significantly lower nitrification rate under I+O compared with that under I and O. The abundances of nirK and nirS genes under I+O were both significantly lower than those under I and O (Figure 4C,D) probably owing to the significantly lower NO3–N contents (Figure 2B and Table 4), given that the availability of N oxides is key to denitrification [34]. However, the inhibiting effects of the decreased denitrifier abundance on denitrification rate under I+O might have been offset by the stimulating effects of O2 depletion under higher microbial activity and labile organic C amendment due to higher DOC contents (Figure 2C–E), considering that most denitrifiers are heterotrophic anaerobes [35].

4.3. Effect of N Fertilizer Type on N2O Emissions

The N2O fluxes in the soil under N fertilization treatments peaked immediately following N fertilization in both growing seasons (Figure 3A), which agrees well with previously reported results [36]. This is possibly due to a drastic boost in the nitrification rates (Figure 3B and Table 4). Moreover, the N2O emissions from CK ranged from 1.98 kg ha−1 to 2.38 kg ha−1 during the purple caitai growing seasons. The emissions are higher than 0.68 kg ha−1−1.28 kg ha−1 of background N2O emissions from Chinese vegetable soils [37], which could be attributed to the relatively higher air temperature and soil N availability in this study. Moreover, the total seasonal precipitation ranged from 66.1 to 287.9 mm during the experimental periods. Moreover, high rainfall and air temperature and neutral soil pH (7.03) can be beneficial to soil nitrification and denitrification [37,38], thus inducing relatively large N2O from CK in this study.
The integrated organic-inorganic fertilization significantly decreased the EFN2O (Table 2). The EFN2O in this study was within the range of 1.86–3.05% (Table 2), which is larger than the default IPCC value [1] as well as other estimates in Chinese croplands [39]. Aside from the possible systemic error caused by the choice of a linear regression model for flux calculation as well as the inaccuracies in measurements of sampling time, temperature and chamber volume [19], a high EFN2O value might result from the regional discrepancies such as temperature and soil type [40]. Besides, N2O emission factors actually increase with N additions [41]. Hence, the relatively high N inputs in our study might have led to higher EFN2O.
In line with previously reported results [42], the combined application of organic and inorganic N fertilizer significantly reduced the N2O emissions compared with the single application (Figure 3A and Table 2). As soil N2O emissions from nitrification and denitrification depend on soil available N, N fertilizer application is an important driver of N2O emissions in the soil [42]. Application of inorganic N fertilizer alone can increase soil mineral-N contents from the applied N fertilizers in excess of crop requirements [42]. Higher contents of NH4+–N and NO3–N (Figure 2) under I than under I+O support this view in this study. Therefore, higher N2O emissions from I than from I+O were found (Table 2). Although O caused lower soil NH4+–N contents than I+O (Figure 2), higher nitrification under O than under I+O (Figure 4) due to improved soil porosity under O [26] (Ali et al. 2014) ultimately results in more N2O emissions under O. Studies proposed that nitrification imposes a greater effect on N2O emissions [38]. In this study, there was a significant positive relation between N2O flux and nitrification rate, while no significant correlation existed between N2O flux and denitrification rate (Table 4). Besides, the nitrification rates significantly declined under I+O, whereas N fertilizer type had no significant impact on the denitrification rates (Figure 3B,C). The above results indicate that the declined nitrification plays a more important role than denitrification in lowering N2O emissions under I+O and the integrated organic-inorganic N fertilization diminishes N2O emissions primarily through the regulation of nitrification. In conclusion, integrated organic-inorganic N fertilization can be recommended as the optimum fertilization regime for enhancing soil fertility and mitigating N2O emissions in purple caitai fields.

4.4. Effect of N Fertilizer Type on Yield and Yield-Scaled N2O Emission

The effects of combined inorganic/organic N fertilizers on crop yield have been frequently studied [25,26]. Studies reported that combined inorganic/organic N fertilizers could significantly increase crop yield compared with the single N application. Similar results were observed in our study (Table 2). Enhanced yield in the present study may be ascribed to improved N use efficiency through increased soil N supply and improved soil microbial activity (Figure 2) [25]. Moreover, compared with I, O resulted in a lower purple caitai yield. This may be because organic N fertilizer alone does not provide enough available N for vegetable growth (Figure 2) due to low mineralization relative to chemical N fertilizer [26].
The yield-scaled N2O emission, an index for evaluating the source or sink of soil N2O per ton of yield [3], not only considers crop yield but also incorporates N2O emissions. Therefore, the index can be used to investigate the relationship between agronomic productivity and environmental sustainability (e.g., greenhouse gas emissions) in agricultural production [37]. In this study, among N fertilization treatments, I+O showed the lowest yield-scaled N2O emissions due to the highest yield and the lowest N2O emissions (Table 2), suggesting that combined inorganic/organic N fertilization could reduce soil N2O emissions and contribute to high purple caitai productivity. Moreover, the combination could improve the soil fertility (Figure 2), and thus it can be concluded that the combined inorganic/organic N fertilization is a sustainable agricultural technology for reducing soil N2O emissions while improving soil fertility and yield of purple caitai.

5. Conclusions

The response of nitrous oxide (N2O) emissions to the combined application of inorganic and organic nitrogen (N) fertilizers from upland soils remains still unclear. In this view, this study hypothesized that the combined application could mitigate N2O emissions from purple caitai fields compared with the single application of inorganic or organic N fertilizers by decreasing nitrification and denitrification. The results showed that compared with the single application, the combined application significantly improved soil N availability, promoted microbial biomass, and diminished the N2O emissions. Moreover, partial correlation and similarity percentage analyses revealed that the ammonia-oxidizing bacteria (AOB) community was the major contributor to N2O production, and the integrated fertilization mitigated the N2O emissions primarily through inhibiting the nitrification by AOB in purple caitai fields. Therefore, we recommend the integrated organic-inorganic N fertilization as an optimum N fertilization practice to enhance the soil fertility and yield and mitigate the N2O emissions in the upland fields.

Supplementary Materials

The following supporting information can be downloaded at: https://www.mdpi.com/article/10.3390/agriculture12050723/s1, Table S1: Primers and protocols for RT-qPCR. Table S2: TC and TN contents in soil under different treatments at the harvest stages in the 2016 and 2017 growing seasons of purple caitai.

Author Contributions

C.L. conceived and designed the research; D.F. provided experimental data; D.F. conducted the measurement; D.F. and C.L. performed statistical analysis; D.F. wrote the manuscript; C.L. and C.C. commented on and revised the manuscript. All authors have read and agreed to the published version of the manuscript.

Funding

This work was funded by the Key Research and Development Project of Hubei Province (2021BBA224).

Institutional Review Board Statement

Not applicable for studies not involving humans or animals.

Informed Consent Statement

This paper does not contain any studies with human participants and/or animals. Informed consent was obtained from all individual participants included in this study.

Data Availability Statement

The data presented in this study are available on request from the corresponding author.

Conflicts of Interest

The authors declare that they have no conflict of interest.

References

  1. IPCC. 2013 Climate Change—The Physical Science Basis, Contribution of Working Group I to the Fifth Assessment Report of the Intergovernmental Panel on Climate Change; Stocker, T.F., Qin, D., Plattner, G.K., Tignor, M., Allen, S.K., Boschung, J., Nauels, A., Eds.; Cambridge University Press: Cambridge, UK; New York, NY, USA, 2013. [Google Scholar]
  2. Ravishankara, A.R.; Daniel, J.S.; Portmann, R.W. Nitrous oxide N2O. The dominant ozone-depleting substance emitted in the 21st century. Science 2009, 326, 123–125. [Google Scholar] [CrossRef] [Green Version]
  3. Mosier, A.; Kroeze, C.; Nevison, C.; Oenema, O.; Seitzinger, S.; van Cleemput, O. Closing the global N2O budget, nitrous oxide emissions through the agricultural nitrogen cycle. Nutr. Cycl. Agroecosyst. 1998, 52, 225–248. [Google Scholar] [CrossRef]
  4. Schindler, D.W.; Hecky, R.E. Eutrophication, More Nitrogen Data Needed. Science 2009, 324, 721–722. [Google Scholar] [CrossRef] [PubMed]
  5. Wen, Y.; Xiao, J.; Liu, F.; Goodman, B.A.; Li, W.; Jia, Z.; Ran, W.; Zhang, R.; Shen, Q.; Yu, G. Contrasting effects of inorganic and organic fertilisation regimes on shifts in Fe redox bacterial communities in red soils. Soil Biol. Biochem. 2018, 117, 56–67. [Google Scholar] [CrossRef]
  6. Urzedo, D.I.; Franco, M.P.; Pitombo, L.M.; Carmo, J.B. Effects of organic and inorganic fertilizers on greenhouse gas GHG emissions in tropical forestry. For. Ecol. Manag. 2013, 310, 37–44. [Google Scholar] [CrossRef]
  7. Aguilera, E.; Lassaletta, L.; Sanz-Cobena, A.; Garnier, J.; Vallejo, A. The potential of organic fertilizers and water management to reduce N2O emissions in Mediterranean climate cropping systems. A review. Agric. Ecosyst. Environ. 2013, 164, 32–52. [Google Scholar] [CrossRef] [Green Version]
  8. Verdi, L.; Kuikman, P.J.; Orlandini, S.; Mancini, M.; Napoli, M.; Marta, A.D. Does the use of digestate to replace mineral fertilizers have less emissions of N2O and NH3? Agric. For. Meteorol. 2019, 269–270, 112–118. [Google Scholar] [CrossRef]
  9. Ding, W.; Luo, J.; Li, J.; Yu, H.; Fan, J.; Liu, D. Effect of long-term compost and inorganic fertilizer application on background N2O and fertilizer-induced N2O emissions from an intensively cultivated soil. Sci. Total Environ. 2013, 465, 115–124. [Google Scholar] [CrossRef]
  10. Agegnehu, G.; Bass, A.M.; Nelson, P.N.; Bird, M.I. Benefits of biochar, compost and biochar-compost for soil quality, maize yield and greenhouse gas emissions in a tropical agricultural soil. Sci. Total Environ. 2016, 543, 295–306. [Google Scholar] [CrossRef]
  11. Case, S.D.C.; McNamara, N.P.; Reay, D.S.; Stott, A.W.; Grant, H.K.; Whitaker, J. Biochar suppresses N2O emissions while maintaining N availability in a sandy loam soil. Soil Biol. Biochem. 2015, 81, 178–185. [Google Scholar] [CrossRef] [Green Version]
  12. Sandrin, T.R.; Herman, D.C.; Maier, R.M. Physiological Methods. In Environmental Microbiology; Maier, R.M., Pepper, I.L., Gerba, C.P., Eds.; Academic Press: Cambridge, MA, USA, 2009; pp. 191–223. [Google Scholar]
  13. Richarson, D.J. Bacterial respiration, a flexible process for a changing environment. Microbiology 2000, 146, 551–571. [Google Scholar]
  14. Norton, J.M.; Alzerreca, J.J.; Suwa, Y.; Klotz, M.G. Diversity of ammonia monooxygenase operon in autotrophic ammonia-oxidizing bacteria. Arch. Microbiol. 2002, 177, 139–149. [Google Scholar] [CrossRef] [PubMed]
  15. Jones, C.M.; Stres, B.; Rosenquist, M.; Hallin, S. Phylogenetic analysis of nitrite, nitric oxide, and nitrous oxide respiratory enzymes reveal a complex evolutionary history for denitrification. Mol. Biol. Evol. 2008, 25, 1955–1966. [Google Scholar] [CrossRef] [PubMed]
  16. Levy-Booth, D.J.; Prescott, C.E.; Grayston, S.J. Microbial functional genes involved in nitrogen fixation, nitrification and denitrification in forest ecosystems. Soil Biol. Biochem. 2014, 75, 11–25. [Google Scholar] [CrossRef]
  17. Yang, L.; Zhang, X.; Ju, X. Linkage between N2O emission and functional gene abundance in an intensively managed calcareous fluvo-aquic soil. Sci. Rep. 2017, 7, 43283. [Google Scholar] [CrossRef]
  18. Wang, C.; Li, H.; Li, Y.; Meng, Q.; Xie, F.; Xu, Y.; Wan, Z. Genetic characterization and fine mapping BrCER4 in involved cuticular wax formation in purple cai-tai Brassica rapa L. var purpurea. Mol. Breed. 2019, 39, 12. [Google Scholar] [CrossRef]
  19. Li, C.; Zhang, Z.; Guo, L.; Cai, M.; Cao, C. Emissions of CH4 and CO2 from double rice cropping systems under varying tillage and seeding methods. Atmos. Environ. 2013, 80, 438–444. [Google Scholar] [CrossRef]
  20. Yao, K.Y. Determination of soil microbial activities and character. In Soil Microbial Ecology and Experimental Technology; Yao, K.Y., Huang, C.Y., Eds.; Science Press: Beijing, China, 2006; pp. 187–192. (In Chinese) [Google Scholar]
  21. Witt, C.; Gaunt, J.L.; Galicia, C.C.; Ottow, J.C.G.; Neue, H.U. A rapid chloroform-fumigation extraction method for measuring soil microbial biomass carbon and nitrogen in flooded rice soils. Biol. Fertil. Soils 2000, 30, 510–519. [Google Scholar] [CrossRef]
  22. Allison, L.E. Organic carbon. In Methods of Soil Analysis Part II; Black, C.A., Ed.; American Society of Agronomy Publications: Madison, WI, USA, 1965; pp. 1367–1376. [Google Scholar]
  23. Zaman, M.; Saggar, S.; Blennerhassett, J.D.; Singh, J. Effect of urease and nitrification inhibitors on N transformation, gaseous emissions of ammonia and nitrous oxide, pasture yield and N uptake in grazed pasture system. Soil Biol. Biochem. 2009, 41, 1270–1280. [Google Scholar] [CrossRef]
  24. Evans, J.D. Straight Forward Statistics for the Behavioral Sciences; Brooks/Cole Publishing: Pacific Grove, CA, USA, 1996. [Google Scholar]
  25. Pan, G.; Zhou, P.; Li, Z.; Smith, P.; Chen, X. Combined inorganic/organic fertilization enhances N efficiency and increases rice productivity through organic carbon accumulation in a rice paddy from the Tai Lake region, China. Agric. Ecosyst. Environ. 2009, 131, 274–280. [Google Scholar] [CrossRef]
  26. Zhang, J.; Zhuang, M.; Shan, N.; Zhao, Q.; Li, H.; Wang, L. Substituting organic manure for compound fertilizer increases yield and decreases NH3 and N2O emissions in an intensive vegetable production systems. Sci. Total. Environ. 2019, 670, 1184–1189. [Google Scholar] [CrossRef] [PubMed]
  27. Neumann, G. Root Exudates and Nutrient Cycling. In Nutrient Cycling in Terrestrial Ecosystems. Soil Biology; Marschner, P., Rengel, Z., Eds.; Springer: Berlin/Heidelberg, Germany, 2007; pp. 123–157. [Google Scholar]
  28. Ali, M.A.; Sattar, M.A.; Islam, M.N.; Inubushi, K. Integrated effects of organic, inorganic and biological amendments on methane emission, soil quality and rice productivity in irrigated paddy ecosystem of Bangladesh, field study of two consecutive rice growing seasons. Plant Soi. 2014, 378, 239–252. [Google Scholar] [CrossRef]
  29. Wang, F.; Chen, S.; Wang, Y.; Zhang, Y.; Hu, C.; Liu, B. Long-term nitrogen fertilization elevates the activity and abundance of nitrifying and denitrifying microbial communities in an upland soil, implications for nitrogen loss from intensive agricultural systems. Front. Microbiol. 2018, 23, 02424. [Google Scholar] [CrossRef] [Green Version]
  30. Tian, X.; Hu, H.; Ding, Q.; Song, M.; Xu, X.; Zheng, Y.; Guo, L. Influence of nitrogen fertilization on soil ammonia oxidizer and denitrifier abundance, microbial biomass, and enzyme activities in an alpine meadow. Biol. Fertil. Soils 2013, 50, 703–713. [Google Scholar] [CrossRef]
  31. Han, J.; Shi, J.; Zeng, L.; Xu, J.; Wu, L. Impacts of continuous excessive fertilization on soil potential nitrification activity and nitrifying microbial community dynamics in greenhouse system. J. Soil Sediments 2017, 17, 471–480. [Google Scholar] [CrossRef]
  32. Grießmeier, V.; Leberecht, K.; Gescher, J. NO3 removal efficiency in field denitrification beds, key controlling factors and main implications. Environ. Microb. Rep. 2019, 11, 316–329. [Google Scholar] [CrossRef]
  33. Kindaichi, T.; Ito, T.; Okabe, S. Ecophysiological interaction between nitrifying bacteria and heterotrophic bacteria in autotrophic nitrifying biofilms as determined by microautoradiography-fluorescence in situ hybridization. Appl. Environ. Biol. 2004, 70, 1641–1650. [Google Scholar] [CrossRef] [Green Version]
  34. Martens, D.A. Denitrification. In Encyclopedia of Soils in the Environment; Hillel, D., Ed.; Academic Press: Cambridge, MA, USA, 2005; pp. 378–382. [Google Scholar]
  35. Inglett, P.W.; Reddy, K.R.; Corstanje, R. Anaerobic soils. In Encyclopedia of Soils in the Environment; Hillel, D., Ed.; Academic Press: Cambridge, MA, USA, 2005; pp. 72–78. [Google Scholar]
  36. Zhang, J.; Zhang, F.; Yang, J.; Wang, J.; Cai, M.; Li, C.; Cao, C. Emissions of N2O and NH3, and nitrogen leaching from direct seeded rice under different tillage practices in central China. Agric. Ecosyst. Environ. 2011, 140, 164–173. [Google Scholar]
  37. Xu, Y.; Guo, L.; Xie, L.; Yun, A.; Li, Y.; Zhang, X.; Zhao, X.; Diao, T. Characteristics of background emissions and emission factors of N2O from major upland fields in China. Sci. Agric. Sin. 2016, 49, 1729–1743. [Google Scholar]
  38. Bateman, E.J.; Baggs, E.M. Contributions of nitrification and denitrification to N2O emissions from soils at different water-filled pore space. Biol. Fertil. Soils. 2005, 41, 379–388. [Google Scholar] [CrossRef]
  39. Ding, W.; Cai, Y.; Cai, Z.; Yagi, K.; Zheng, X. Nitrous oxide emissions from an intensively cultivated maize–wheat rotation soil in the north china plain. Sci. Total. Environ. 2007, 373, 501–511. [Google Scholar] [CrossRef] [PubMed]
  40. Dobbie, K.; Smith, K. Nitrous oxide emission factors for agricultural soils in Great Britain, the impact of soil water-filled pore space and other controlling variables. Glob. Chang. Biol. 2003, 9, 204–218. [Google Scholar] [CrossRef]
  41. Shcherbak, I.; Millar, N.; Robertson, G.P. Global metaanalysis of the nonlinear response of soil nitrous oxide N2O emissions to fertilizer nitrogen. Proc. Natl. Acad. Sci. USA 2014, 111, 9199–9204. [Google Scholar] [CrossRef] [PubMed] [Green Version]
  42. Nyamadzawo, G.; Wuta, M.; Nyamangara, J.; Smith, J.L.; Rees, R.M. Nitrous oxide and methane emissions from cultivated seasonal wetland dambo soils with inorganic, organic and integrated nutrient management. Nutr. Cycl. Agroecosyst. 2014, 100, 161–175. [Google Scholar] [CrossRef]
Figure 1. Changes in average daily temperature and rainfall during purple caitai growing seasons in 2016 (A) and 2017 (B).
Agriculture 12 00723 g001
Figure 2. Soil chemical properties including NH4+–N (A), NO3–N (B), DOC (C), MBC (D) and MBN (E) contents under different treatments throughout two growing seasons of purple caitai. Different letters indicate significant differences at the level of 0.05. DOC, dissolved organic C; MBC, microbial biomass C; MBN, microbial biomass N; I, inorganic N fertilization; O, organic N fertilization; I+O, integrated organic/inorganic N fertilization; CK, no fertilization.
Agriculture 12 00723 g002
Figure 3. The N2O fluxes (A), gross rates of nitrification (B) and denitrification (C) in soil under different treatments throughout two growing seasons of purple caitai. Arrows indicate N fertilization. I, inorganic N fertilization; O, organic N fertilization; I+O, integrated organic/inorganic N fertilization; CK, no fertilization.
Agriculture 12 00723 g003
Figure 4. The abundance of nitrifier genes, including AOB-amoA (A) and AOA-amoA (B), and denitrifier genes including nirK (C) and nirS (D) at log-scale in soil under different treatments throughout two growing seasons of purple caitai. AOB, ammonia-oxidizing bacteria; AOA ammonia-oxidizing archaea; I, inorganic N fertilization; O, organic N fertilization; I+O, integrated organic/inorganic N fertilization; CK, no fertilization.
Agriculture 12 00723 g004
Table 1. Fertilization regimes of different treatments.
TreatmentBasal Fertilizer
(15 October 2016 and 17 October 2017)
Topdressing Fertilizer
(14 December 2016 and 16 December 2017)
I750 kg compound fertilizer ha−1245 kg urea ha−1
O2250 kg organic fertilizer ha−1 + 112.5 kg KCl ha−1 + 264.5 kg calcium superphosphate ha−1
I+O1125 kg organic fertilizer ha−1 + 375 kg compound fertilizer ha−1 + 56 kg KCl ha−1 + 133 kg calcium superphosphate ha−1122.3 kg urea ha−1
CK
I, inorganic N fertilization; O, organic N fertilization; I+O, integrated organic-inorganic N fertilization; CK, no fertilization.
Table 2. Seasonal cumulative N2O–N emissions, EFN2O, yield and yield-scaled N2O emission under different treatments in two growing seasons of purple caitai.
YearTreatmentCE (kg ha−1)EFN2O (%)Yield (t ha−1)Yield-Scaled N2O Emission
(t CO2-eq. t−1 Yield)
2016I8.54 ± 0.05 a2.92 ± 0.07 a17.09 ± 0.65 b0.13 ± 0.00 b
O7.63 ± 0.09 b2.51 ± 0.10 b13.08 ± 0.84 c0.16 ± 0.01 a
I+O6.33 ± 0.13 c1.94 ± 0.12 c18.65 ± 1.05 a0.09 ± 0.00 c
CK1.98 ± 0.13 d6.76 ± 0.59 d0.08 ± 0.00 d
2017I9.24 ± 0.16 a3.05 ± 0.08 a15.76 ± 1.29 b0.16 ± 0.01 b
O7.96 ± 0.16 b2.48 ± 0.08 b11.69 ± 0.73 c0.18 ± 0.01 a
I+O6.58 ± 0.21 c1.86 ± 0.10 c17.74 ± 0.76 a0.10 ± 0.00 c
CK2.38 ± 0.02 d6.42 ± 0.14 d0.10 ± 0.00 c
Different small letters between treatments in a line mean significant differences at p < 0.05. CE stands for seasonal cumulative N2O–N emissions. EFN2O stands for fertilizer-induced N2O emission factor. Different letters in the same column indicate significant differences at the level of 0.05. I, inorganic N fertilization; O, organic N fertilization; I+O, integrated organic-inorganic N fertilization; CK, no fertilization.
Table 3. Respective contribution of each nitrifier (AOB-amoA and AOA-amoA) and denitrifier (nirK and nirS) gene to community abundance variations (%) among fertilization treatments during two growing seasons of purple caitai.
Growing SeasonTreatmentsAOB-amoAAOA-amoAnirKnirS
2016I vs. O38.914.025.821.3
I vs. I+O39.912.924.023.2
O vs. I+O38.210.123.328.4
2017I vs. O36.715.323.524.5
I vs. I+O37.810.626.625.0
O vs. I+O35.013.723.527.8
AOB, ammonia-oxidizing bacteria; AOA ammonia-oxidizing archaea; I, inorganic N fertilization; O, organic N fertilization; I+O, integrated organic-inorganic N fertilization.
Table 4. Partial correlation coefficients among soil chemical properties, nitrifier/denitrifier abundance and nitrification/denitrification rates in two growing seasons of purple caitai.
Growing SeasonVariableAOB-amoAAOA-amoAnirKnirSNRDNRN2O Flux
2016NH4+–Nnsnsnsns0.42 **ns0.39 **
NO3–N0.29 *0.47 **0.30 *0.32 *0.25 **ns0.47 **
DOCns–0.21 *nsns–0.52 **ns–0.34 *
MBC–0.52 *nsnsns–0.46 **ns–0.58 **
MBN–0.65 *nsnsns–0.40 **ns–0.45 **
AOB-amoA10.61 **0.77 **0.60 **0.72 **ns0.46 **
AOA-amoA-10.52 **0.62 **0.22 *nsns
nirK--10.62 **0.33 *ns0.40 **
nirS---10.36 **0.28 *0.35 **
NR----1ns0.56 **
DNR-----1ns
2017NH4+–Nnsnsnsns0.46 **ns0.34 **
NO3–Nns0.38 **0.42 **0.35 **0.31 *ns0.35 **
DOCns–0.31 *nsns–0.47 *ns–0.39 **
MBC–0.48 *nsnsns–0.49 *ns–0.47 **
MBN–0.72 **nsnsns–0.54 *ns–0.34 *
AOB-amoA10.68 **0.68 **0.72 **0.74 **ns0.58 *
AOA-amoA-10.49 **0.70 **nsnsns
nirK--10.69 **0.35 *ns0.36 **
nirS---10.31 **ns0.27 *
NR----1ns0.49 **
DNR-----1ns
DOC, dissolved organic C; MBC, microbial biomass C; MBN, microbial biomass N; AOB, ammonia-oxidizing bacteria; AOA ammonia-oxidizing archaea; NR, nitrification rate; DNR, denitrification rate. ns, not significant; * p ≤ 0.05; ** p ≤ 0.01.
Publisher’s Note: MDPI stays neutral with regard to jurisdictional claims in published maps and institutional affiliations.

