Article

Risk Factor Assessment of the Smallholder Baby Vegetable Production in Eswatini

by
Daisy Delsile Dlamini
*,
Jethro Zuwarimwe
,
Joseph Francis
and
Godwin R. A. Mchau
Institute for Rural Development, School of Agriculture, University of Venda, X5050, Thohoyandou 0950, South Africa
*
Author to whom correspondence should be addressed.
Agriculture 2022, 12(5), 643; https://doi.org/10.3390/agriculture12050643
Submission received: 30 December 2021 / Revised: 4 February 2022 / Accepted: 22 February 2022 / Published: 29 April 2022
(This article belongs to the Section Agricultural Economics, Policies and Rural Management)

Abstract

:
The transition from subsistence to commercial production poses uncertainty and risks that require putting in place adaptive systems. Such systems are imperative for agricultural production where weather and food markets are always changing. Disregarding risk factors has a cumulative negative impact on the intended outcomes. The marginality of smallholder farmers’ operational environment renders them limited to strive without government interventions. Research has proven that smallholder farmers face numerous challenges in vegetable value chains. The study sought to identify and characterise smallholder growers risk factors when producing for this value chain. A sequential mixed-method research design was adopted, and data collected from fifty-eight growers from three producer groups in the Manzini and Hhohho regions. Discriminant analysis validated the heterogeneity of respondents using the experience on risk factors. The growers were significantly affected by market and production risks. The clustered growers had a high probability of losses in the value of the harvest whereas the private growers had a high probability of yield changes. Fruit size and postharvest handling contributed to changes in the value of the harvest. An improved cold chain system could enable symmetry in the harvest scheduling and grade information as well as prompt payments. Interventions toward enabling access and use of quality farm inputs would curb yield variations. Future research could quantify yield losses at each stage of postharvest handling toward informing the risk management strategy.

1. Introduction

Smallholder farmers have a high risk of failure as economic players in high-value chains because they have limited access to information and productive assets as well as less capacity to adjust to shocks [1]. The authors argue that a value chain analysis should consider the complexity of the value chains and the risk management capacity of the actors. A risk management system is informed by identified and predictable risks associated with each value chain. Lipton’s theory on risk management alludes to risk identification and prediction to establish strategies for enabling positive outcomes [2]. However, risk management is a continuous process, as illustrated in Figure 1. Therefore, the capacity of smallholder farmers to make informed decisions begins with enlightenment on risk exposure and predictability.
The transition from subsistence farming has an inherent risk exposure, which the farmer needs to embrace for successful commercialisation. Hardaker et al. [3] identified five transitional risks associated with commercialisation. These are production risks, market risks, institutional risks, financial risks, and business risks. Therefore, information on enterprise risks enables a farmer to decide, given risk-averse and downside risk assumptions. Risk-averse people forgo risky opportunities whereas downside risk stimulates production within a safety principle. This is possible with predetermined risk information.
Firm commitments to development of a risk management strategy led to success in smallholder farm transformation in Thailand [4]. This was achieved through investment into adaptive research on market risks and financial access for farmers. Paramount to the transformation was adaptation through short-term investments into the high risk and volatile commodity markets. The risk perception of the farmers and experience of market failure stimulated the adoption of contract farming [5,6]. Similarly, smallholder farmers engage in farming contracts mainly for their potential to reduce market risks and the production for effective management [7]. As a tool for smallholder farmer inclusion, a well-specified contract includes extension and assistance programs that reduce barriers to capital investments and compliance with industry standards [8].
Risk orientation in the cassava value chain was the most significant factor for technology adoption in South-East Asia. Smith et al. [9] analysed risk orientation using a diffusion framework. The risk orientation was an important indicator of adoption as they noted that technology incentives contributed significantly to the diffusion. Islam et al. [10] concluded that smallholder farmers are risk-averse and lack capacity to minimise risks. Smallholder production is related to the socio-economic function where grower market conditions and resource availability require state intervention to enable a competitive ability.
The methodological basis for a risk assessment in an enterprise by Stepanuk [11] presented four risk management measurements, namely: the risk requisites, the risk factors, and the risk situation. Risk requisites are within an enterprise and its external environment, influencing the threats and opportunities of the farms. Risk factors are attributed to the conditions that increase the probability of a negative situation [12]. These rely on the precondition that a high probability of the occurrence of an event is undesirable and would cause a deviation in the strategic goals. In mental health, risk identification constitutes the causes of risk and a phenomenon that renders the promise of trouble [12]. A risk situation is a condition deemed to be a threat to the realisation of a plan. A risk function consists of significant risk factors and their probability of occurrence within an enterprise.
The major risk factors that were identified among rice farmers were market price, biological factors and climate factors [10]. Behzadi et al. [13] and Reddy et al. [14] presented two types of risk in agribusiness; these were the risks on the demand and supply sides. Supply is related to the seasonality of the production and climate effects whereas demand is concerned with resource capacity variability and market prices. Ali et al. [15] established that price and production risks are major risk factors for vegetable and fruit production. These authors advocated an improved information system and financial markets as well as the promotion of market-based pricing systems and yield insurance schemes.
The perception of farmers of risks and the ability to manage them is greatly affected by their risk attitude [10]. Heterogeneity is crucial in the development of interventions targeting smallholder growth through mitigation constrained-performance in delivering to the market [16,17,18,19]. Discriminant analyses have been widely used in research to establish heterogeneity in groups using common traits [20,21,22] as well as in classifying external observations and perceived experiences in agriculture [23,24,25]. Therefore, a classification analysis confirms proper clustering by using probability traits to associate with a given group. The objective of this study was to determine and characterise the smallholder baby vegetable enterprise risk factors and the risk function thereof. It sought to establish the heterogeneity of growers on risk exposure as well as provide an insight into the risk factors toward the establishment of a risk management strategy for the cold chain.

2. Materials and Methods

A descriptive, explanatory research design that employed mixed research methods to characterise the risk factors for smallholder baby vegetable production in Eswatini. Baby vegetable production is targeted for import substitution where local vegetable consumption is heavily dependent (70%) on imports; it covers 42 metric tonnes per year [26]. A census of growers was used, and purposive sampling enabled the use of participation in the government-led smallholder development. A list of growers in the Hhohho and Manzini regions was sourced from the buyer, the National Marketing Board. These regions are diverse in climate and growers use different irrigation systems. Smallholder farm production was classified into three classes using the irrigation scheme membership: clustered production, semi-dependent production, and private production. Clustered production was on a piece of land that had an irrigation system and was divided into individual plot holdings. Semi-dependent production was an irrigation scheme held on different landholdings where members had access to irrigating water through the scheme network. The irrigation scheme infrastructure was funded by the government. Private production used an individually financed irrigation infrastructure and was not a member of any irrigation scheme.
The data were collected in two phases. A structured questionnaire administered through face-to-face interviews was employed in phase 1. A Likert scale was used to rank risk exposure where 1 = not likely, 2 = less likely, 3 = not sure, 4 = likely, and 5 = more likely. The data were analysed using a discriminant analysis through the Social Package and Service Solution, version 26. The respondents varied in the irrigation system used and location. Phase 2 used focused mini-group discussions to gather qualitative data from eight mini-groups, which engaged twenty-eight participants. Each mini group had an average of four members. The mini-groups used the group labour gang that the growers used in joint farm activities during the 2018/2019 harvesting season. It was at the peak of the harvesting season and the discussions were embedded in shared farming experiences, opportunities, and market environments. An open-ended questionnaire was used to guide the discussions to bring insight into the quantitative data. The qualitative data consisted of details of the most important risks as well as details of its sources and consequences [27]. These were transcribed and coded for a thematic analysis in ATLAS.ti, version 8.
The analysis of the data adopted a discriminant analysis approach. This is a predictive classification method developed by Fisher [28]. It used the risk perspectives of the farmer as explanatory variables and the farming groups as the dependent variables.
The specification of the discriminant function is given as follows:
Z = a0 + a1X1 + a2X2 + a3X3 + a4X4 +……+ an Xn
where a0 = the constant; a1, a2…an = the discriminant coefficients; X1, X2, …. Xn = the discriminant variables or the risk variables identified by the farmers; and Z = a predictor rank, which was used to synthesise the risk exposure rate of the baby vegetable enterprise concerning the risk variables. The aim was to explain this value by predicting the probability of exposure of each enterprise. Therefore, Z was the irrigation scheme membership category.
The discriminant analysis enabled a classification through a series of diagnostic tests on the dataset. The hypothesis test of equality of the group required the distillation of the classifying factors through a discrimination of the ratios. The Fisher test measured the significant difference among these discriminate factors; a higher F-value indicated a higher discriminating power of the risk factor. Wilks’ Lambda test presented the existence and significance of a relationship between the farm category and the risk factor. A value closest to zero was the most desirable. Small Lambda values reflected a smaller intra-category variation and a substantial inter-cluster variation, which represented significantly different cluster means.
Wilks’ Lambda (Ꝩ) = 1 − (inter-cluster variance ÷ total variance)
Box’s M test of equality of covariance matrices was adopted to test if the variance-covariance matrix was identical from one factor to another. The null hypothesis of the equality variance-covariance matrix was tested. A covariance matrix for different clusters must not be equal such that the M-value is the largest and the p-value is significant.
A canonical correlation presented the variation between clusters given the total discriminant function. It indicated the fraction of the variation of the function following the differences recorded among the categories. Correlation values that were closer to one were the most desirable. The number of Eigenvalues was the number of categories minus 1 (k − 1); here, this was represented as (3 − 1) = 2. This was used for Wilks’ test of significance of the mean differences in the discriminant function. Furthermore, the discriminating power presented by the standardised canonical discriminant function coefficients enabled a better grouping of the farm categories where Z was the linear relationship of the risk factors.

3. Results

3.1. Loading Risk Factors for Smallholder Irrigation Production

Using the results of the Likert scale with a mean = 3, the most frequent loading risk factors were identified for each grower group. The mean rank of the risk factors is presented in Table 1. The risk factors are the matters, problems, or objects that can ultimately influence the magnitude of change in the master plan and the cost-effectiveness indicators provided for the activity [12]. It represents the reasons, circumstances, and conditions that create an adverse situation with negative results in these enterprises.
The results showed the five most frequent loading risk factors for the group; namely, untimely payments (3.61 (1.79)), yield changes (3.54 (1.3)), high input prices (3.4 (1.45)), product collection (3.3 (1.49)), and fluctuating product prices (3.18 (1.3)), respectively. The least frequent loading risk factor was product demand, indicating an unsaturated product market. A strong agreement was recorded for product payment as a loading factor, threatening the sector with a standard deviation of 1.79. Delayed payments affect the liquidity of farms, which impacts on the timing of production activity and the inherent quantity of the harvest obtained. Hired labour constitutes 25% of the labour costs in vegetable farms, thereby increasing the demand for liquidity.
The growers recorded that product losses rose two weeks into the harvest when the collection demand rose beyond the capacity of the buyer. The respondents recorded that an alternative market could absorb the excess crop. The respondents alluded to a greater reduction in the value of sales than anticipated. Full grading information could harmonise the sale projections between the growers and the buyer. The irrigation schemes had no cold storage facilities and means for product delivery. A long distance and load conditions contributed to the inevitably unguaranteed value of deliveries. The farms were located more than 80 km from the warehouse of the buyer, a portion of which was gravel roads.
The clustered growers were significantly prone to market risks. Unique to this group were product collection failure (4.2 (0.8)), labour unavailability (4.1 (0.92)), and a decrease in the product price (3.8 (1.01)). Labour unavailability was inherent from the harvest labour demands that engaged hired labour. A high wage rate in Hhohho was influenced by a proximity to competing commercial plantations that paid more than the going wage rate. It showed a hike of 75% from the E40 per day rate in agriculture. Labour availability in critical periods constrains sustainable vegetable production [29].
The loading risk factors for semi-dependent growers were yield changes (2.79 (0.98)) and delayed payments (3.75 (1.73)), presenting a high exposure to both market and production risks. The yield variation was rated highly by those who had experienced crop losses to livestock, rodents, and overgrown products due to the inability to harvest on time. Delayed harvest could be due to the prolonged rain, which made it difficult to enter the fields. As a result, the overgrown products could not be sold.
The semi-dependent growers were significantly prone to and affected by production risks, which were yield changes as well as pests and diseases. These used various irrigation systems and cultivated separated fields, which prevented them from harnessing knowledge to improve disease and pest management from rodents. This group was also prone to weather extremes that affected the crop conditions. An intervention with crop-protecting technologies through greenhouses would enable a controlled plant growth and quality.
The private growers recorded a vulnerability to market risks where product payment was the most significant loading risk factor (4.75 (0.85)). Yield changes and high input prices were also significant market factors. The supply of farm inputs was non-competitive, which presented high prices.

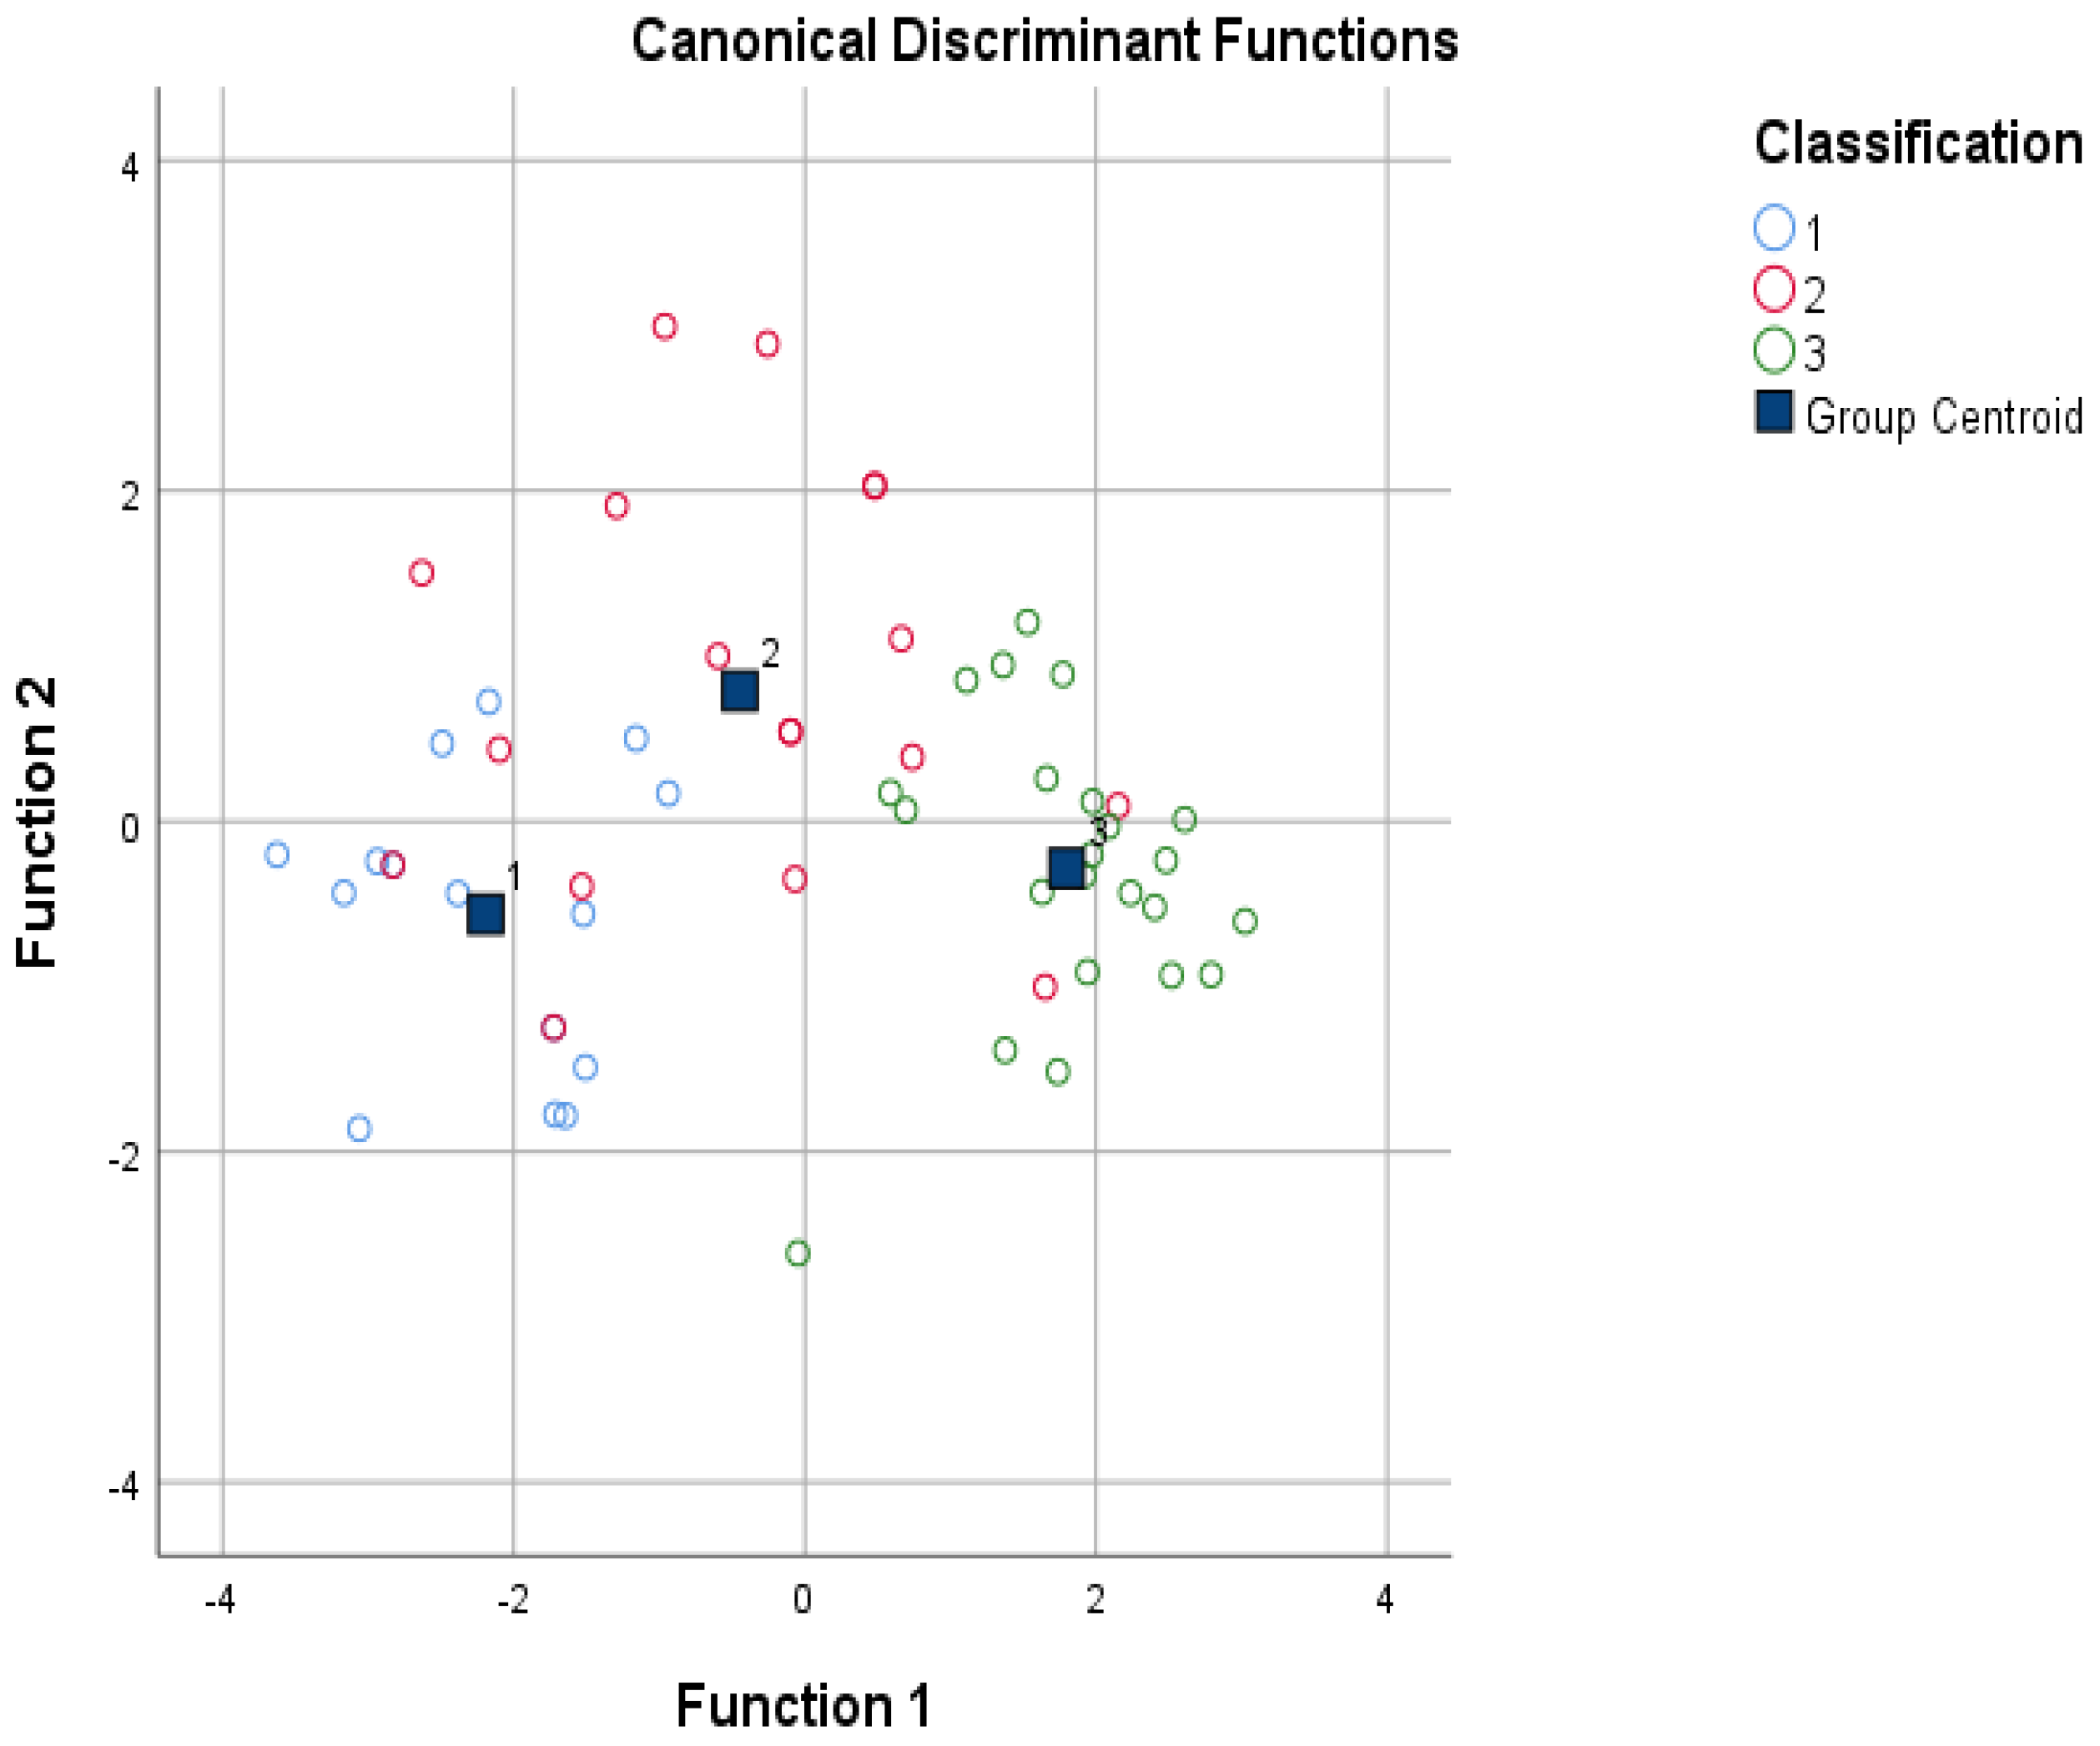
Group Classification Using Risk Experiences

A discriminant analysis was adopted to classify the respondents based on the mean ranks of the risk factors. The purpose was to establish if any group dynamics needed to be addressed by a policy in the risk management interventions. An equality test of the means of the risk variables showed that Wilks’ Lambda values were above 0.5 and were statistically significant for all variables that formed the covariance matrix. No variable was equal to 1.
Referring to Table 2, the lowest, yet most significant, Lambda value was seen in the product price. However, changes in the wage rate and crop disease occurrence were insignificant factors. An equality of means test presented the market risks, product price changes (0.43), and product payments (0.5) as the most significant risk factors for this group. These factors had a Lambda value closest to zero, reflecting that they contributed most to the recorded variability of the group. A drop in the price was attributable to the variation in the product quality of the harvest when the value was lost to postharvest handling and asymmetry in the grading system.
Risk factors are subjective or objective activities that entail unwanted development in future events that negatively affect realising of enterprise goals [30,31]. The matrix shows the significant risk factors for the functions and the coefficients present the relative contribution of the variables in predicting the dependent variable.
The structural matrix in Table 3 shows the significant risk factors that were used to compare the production clusters, referring to Equations (3) and (4). The classification using the loading risk factors showed that the loading risk factors significantly defined the farmer groups.
The probabilities of risk in each group, therefore, were represented by the coefficient functions below.
Z1 = 0.672 FPP − 0.833 PP + 0.002 PD + 0.059 LA − 0.340 WR
Z2 = 0.106 YC + 0.343 PDs − 0.114 IPP − 0.328PCF + 0.295Py
The probability of experiencing risks in each production group is presented in Table 3. Larger values indicated the high predictive power of the risk factor.
The results showed that fluctuating product prices (−0.66) were a high loading risk factor and negatively influenced the future outcomes in the clustered grower enterprises, here referred to as Z1. Positive and high loading was a fluctuating product price (0.57) in the clustered irrigation scheme. The large coefficient for the fluctuating product price (−0.83) and product payment (0.67) showed that the clustered growers were prone to market risks and delays in product payments were frequently observed. Contrary, yield changes (0.4) and disease and pesticides (0.41) positively and significantly influenced the future outcomes in private grower enterprises (Z2). Negatively influencing outcome in the private group was product collection failure. Yield changes, pests and diseases are production related risks.
The growers were classified into clustered and semi-dependent growers by improving the classification error from 17.5% to 100%. The results presented that 87% of the clustered production was correctly classified whereas 13% was incorrectly classified. In the semi-dependent production, 58% were correctly classified and 42% were not. The results showed that the two types of irrigation systems were exposed to different risk factors. This could be attributable to regional locations, weather differences, and group formations.
The study verified that the variance-covariance matrices were identical from one risk variable to another, as shown in Table 4.
A null hypothesis was tested, which stated:
Hypothesis 0 (H0):
Equal variance-covariance matrices for the intra-classes; p > 0.05.
Hypothesis 1 (H1):
Covariance matrix of the intra-classes is not equal; p < 0.05.
The null hypothesis was rejected, and H1 was accepted, presenting that the covariance matrix of the intra-classes was not equal. Therefore, the condition of the unequal variance-covariance matrices was verified. Box’s M test allowed the results to be concluded best if the Fisher was significant at p = 0.000; therefore, the discriminant analysis for this study was validated. It can be concluded that there was a variation in the risk factors experienced by the different respondents in the survey. Figure 2 presents the classification plot for the group, reflecting an overlap of the risk factors of the semi-dependent group across the clustered and private growers.

4. Discussion

There were 76% full-time growers; 24% were part-time with an off-farm income. Kusunose [32] observed that a limitation of smallholder farmers to access credit forced a dependency on an off-farm income. Ali et al. [33] reported that market and production risk factors were significant in vegetable production. Our results confirmed that production and marketing risks were significant in these baby vegetable enterprises. High input prices were attributable to the non-competitive supply of the inputs. Input prices, credit constraint, farm size, and the unavailability of input on time are major factors of input supply in agriculture [33,34,35]. Also, access to quality inputs limited productivity in small-scale irrigation in Zimbabwe [36,37]. The average farm size was 1.4 ha for this group.
Fluctuating product prices were attributable to the grade value where multicoloured fruit, overgrown and a wilted harvest were under-graded and discarded. Elik et al. [38] presented that maturity standards, field packaging, and transportation drive losses in product quality in vegetables. A product collection failure contributed to a lower product grade through limited farm capacity in postharvest handling. Delays in product deliveries and methods of transportation are contributors to postharvest losses in vegetables [39,40]. The determinants of a method of transportation are the distance to market, product perishability, and value of the harvest [38,41].
The irrigation schemes had no cold storage facilities and means for product delivery. A long distance and load conditions contributed to the inevitably unguaranteed value of the deliveries. The harvest quality of fragile and perishable vegetables depends on transport conditions [42,43,44].
Labour unavailability was inherent from the harvest labour demands that engaged hired labour. A high wage rate in Hhohho was also influenced by the proximity to competing commercial plantations that paid higher than the going wage rate. It showed a hike of 75% of the E40 per day in agriculture. Labour unavailability in critical periods, such as harvesting, constrain sustainable vegetable production [15].
Overgrown fruit sizes could not be sold. Similarly, smallholder farms lacked capital investment into production technologies such as greenhouses, as observed in China [45,46]. These facilities assist with weather protection. The cost of inputs such as limited financial resources and labour during peak periods are factors that influence the yield variation [39]. Yield changes are presented through the inability to treat several pests that persist in the seasons as well as the effects of weather variations.
The high probability of product prices variation and delayed payments in the clustered production could be a lack of bargaining power [46]. Delayed payments limit the financial resources of enterprises and the use of quality inputs [36,37,38,39,40]. Yield changes, disease, and pesticides positively and significantly influenced the future outcomes of private grower enterprises in this group. In agreement, Stringer et al. [47] concluded that the production scale, distance to market, and producer contract details were the characteristics of risks in vegetable supply chains. The results present that a regard for heterogeneity in smallholder interventions is paramount in enabling the attainment of the developmental goal. Furthermore, the influence of farm resource endowment on the significance of the observed risk factors and the risk orientation of these groups should be established to guide the risk management strategy.

5. Summary and Conclusions

The use of the discriminant analysis classification method was a validated method for classifying smallholder baby vegetable growers in Eswatini. This technique improved the classification from 83% to 100% using the perceived risk factors recorded; therefore, this presented the factors of heterogeneity in these farms. The sector was significantly affected by market risks. These were expressed through low cash inflows and high input prices. Non-compliance with terms of sale in the contracts affected the cash flow of these enterprises. Delayed product payments influenced the liquidity of the farms by affecting the capital investments and the timely access and use of quality inputs in the production. The non-competitive supply of farm inputs contributed to high input prices. Product returns fluctuated through the product quality lost after harvest, lowering the value of returns. This presented an asymmetry of grading information beyond the farm gate.
The clustered growers were more prone to market risk factors whereas the semi-dependent and private farms were predominantly exposed to both market and production risk factors. Yield changes under production risks were dominant and influenced by high input prices and crop losses to weather variability. The semi-dependent growers shared the market risk factors of both the clustered and the private growers.
Recommended are improvements to the cold chain logistic system to preserve the value and shelf life of the harvest. It should improve transportation and logistical planning as well as the symmetry of the grade information. Improvements should also be directed to investments in protecting the harvest value. Improved access of farmers to credit and the quality farm inputs is recommended to enable liquidity and yield maximisation in these enterprises.
Future research should aim to establish the farm resource endowment on the significance of the observed risk factors as well as the risk orientation of the growers, the results of which could also guide a cold chain risk mitigation strategy.
The study used a census of producing growers in the Manzini and Hhohho regions. The results should not be inferred to other regions nor generalised for the industry. However, our methodologies enabled the establishment of heterogeneity using the risk factors experienced by the group. The significance of the structural matrix and Box’s M test validated the suitability of the discriminant analysis in classifying the growers using the risk factors. Furthermore, the risk probability estimates thereof presented the signals of possible deviations from the smallholder development of the master plan.

Author Contributions

This work was undertaken through a collaborative contribution from the co-authors. D.D.D. was responsible for the conceptualisation, methodology, investigation, formal analysis, and drafting of the work. J.Z., J.F. and G.R.A.M. contributed through supervision, reviewing the methodologies, and discussions. All authors have read and agreed to the published version of the manuscript.

Funding

This research was funded by the Regional Universities Forum for Capacity Building in Agriculture (RUFORUM), grant number GTA/DRG-026 and the APC was funded by the Directorate of Research and Innovation, University of Venda, project number SARDF/18/IRD/11/2906.

Institutional Review Board Statement

The study was conducted according to the guidelines of the Declaration of Helsinki and approved by the Ethics Committee of the University of Venda (protocol code SARDF/18/IRD/11/2906 on 4 July 2018.

Informed Consent Statement

Informed consent was obtained from the all the research subjects involved in the study.

Data Availability Statement

The data presented in this study are available on request from the corresponding author. The data are not publicly available due to ethical considerations.

Conflicts of Interest

The authors declare no conflict of interest.

References

  1. Orr, A.; Donovan, J.; Stoian, D. Smallholder value chains as complex adaptive systems: A conceptual framework. J. Agribus. Dev. Emerg. Econ. 2018, 8, 14–33. [Google Scholar] [CrossRef]
  2. Lindahl, F.W. Accounting standards and Olson’s theory of collective action. J. Account. Public Policy 1987, 6, 59–72. [Google Scholar] [CrossRef]
  3. Hardaker, J.B.; Huirne, R.B.M.; Anderson, J.R.; Lien, G. Coping with Risk in Agriculture, 2nd ed.; CABI Publishing: Wallingford, UK, 2004. [Google Scholar] [CrossRef]
  4. Byerlee, D.; Kyaw, D.; Thein, U.S.; Kham, L.S. Agribusiness Models for Inclusive Growth in Myanmar: Diagnosis and Ways Forward. MSU International Development Working Paper 133 No. 1096-2016-May. 2014, pp. 36–38. Available online: https://www.canr.msu.edu/resources/agribusiness-models-for-inclusive-growth-in-myanmar-diagnosis-and-ways-forward (accessed on 1 September 2021).
  5. Arumugam, N.; Mohamed, A.F.; Chiew, F.E.; Mohamed, Z. Determinants of fresh fruits and vegetables (FFV) farmers ‘participation in contract farming in peninsular malaysia. Int. J. Agric. Manag. Dev. 2011, 1, 65–71. [Google Scholar]
  6. Key, N.; Runsten, D. Contract farming, smallholders, and rural development in Latin America: The organisation of agro-processing firms and the scale of outgrower production. World Dev. 1999, 27, 381–401. [Google Scholar] [CrossRef]
  7. Arumugam, N.; Fatimah, M.; Chiew, E.E.F.; Zainalabidin, M. Supply chain analysis of fresh fruits and vegetables (FFV): Prospects of contract farming. Agric. Econ. 2010, 56, 435–442. [Google Scholar] [CrossRef] [Green Version]
  8. Maertens, M.; Swinnen, J. Agricultural Trade and Development: A Value Chain Perspective (No. ESRD-2015-04); WTO Staff Working Paper; World Trade Organization (WTO): Geneva, IL, USA, 2015. [Google Scholar] [CrossRef]
  9. Smith, D.; Newby, J.; Cramb, R. Developing Value-Chain Linkages to Improve Smallholder Cassava Production in Southeast Asia; The University of Queensland: Brisbane, Australia, 2018; pp. 1–9. [Google Scholar]
  10. Stepanuk, Z. Concept of Risk and Monitoring of Classification Significance of Risk. Caucasus 2017, 6, 26–29. [Google Scholar]
  11. Islam, D.I.; Rahman, A.; Sarker, N.I.; Sarker, S.R.; Jianchao, L. Factors Influencing Rice Farmers’ Risk Attitudes and Perceptions in Bangladesh amid Environmental and Climatic Issues. Pol. J. Environ. Stud. 2020, 30, 177–187. [Google Scholar] [CrossRef]
  12. Offord, D.R.; Kraemer, H.C. Risk factors and prevention. Evid.-Based Ment. Health 2000, 3, 70–71. [Google Scholar] [CrossRef] [Green Version]
  13. Behzadi, G.; O’Sullivan, M.J.; Olsen, T.L.; Zhang, A. Agribusiness supply chain risk management: A review of quantitative decision models. Omega 2018, 79, 21–42. [Google Scholar] [CrossRef]
  14. Ali, J.; Kapoor, S. Farmers’ perception on risks in fruits and vegetables production: An empirical study of Uttar Pradesh. Agric. Econ. Res. Rev. 2008, 21, 317–326. [Google Scholar]
  15. Tittonell, P.; Vanlauwe, B.; de Ridder, N.; Giller, K. Heterogeneity of crop productivity and resource use efficiency within smallholder Kenyan farms: Soil fertility gradients or management intensity gradients? Agric. Syst. 2007, 94, 376–390. [Google Scholar] [CrossRef]
  16. Poole, N.D.; Chitundu, M.; Msoni, R. Commercialisation: A meta-approach for agricultural development among smallholder farmers in Africa? Food Policy 2013, 41, 155–165. [Google Scholar] [CrossRef]
  17. Gollin, D.; Rogerson, R. Productivity, transport costs and subsistence agriculture. J. Dev. Econ. 2014, 107, 38–48. [Google Scholar] [CrossRef]
  18. Schoneveld, G.C.; van der Haar, S.; Ekowati, D.; Andrianto, A.; Komarudin, H.; Okarda, B.; Jelsma, I.; Pacheco, P. Certification, good agricultural practice and smallholder heterogeneity: Differentiated pathways for resolving compliance gaps in the Indonesian oil palm sector. Glob. Environ. Chang. 2019, 57, 101933. [Google Scholar] [CrossRef]
  19. Kan, M.; Shan, S.; Zhang, H.; Lao, S.; Chen, X. Multi-View Discriminant Analysis. IEEE Trans. Pattern Anal. Mach. Intell. 2016, 38, 188–194. [Google Scholar] [CrossRef]
  20. Ogbanje, C.E.; Chedibelu, S.; Nweze, N.J. Discriminant function analysis of factors affecting off-farm diversification among small-scale farmers in North Central Nigeria. J. Econ. Sustain. Dev. 2014, 5, 127–135. [Google Scholar]
  21. Lekshmi, P.S.; Chandrakandan, K.; Balasubramani, N. Discriminating Factors of High and Low Adopters of Shrimp Farmers in Nagapattinam of Tamil Nadu. Indian Res. J. Extn. Edu. 2013, 13, 120–125. [Google Scholar]
  22. Khemais, Z.; Nesrine, D.; Mohamed, M. Credit Scoring and Default Risk Prediction: A Comparative Study between Discriminant Analysis & Logistic Regression. Int. J. Econ. Financ. 2016, 8, 39. [Google Scholar] [CrossRef]
  23. Fakayode, S.; Rahji, M.; Adeniyi, S. Economic analysis of risks in fruit and vegetable farming in Osun state, Nigeria. Bangladesh J. Agric. Res. 2012, 37, 473–491. [Google Scholar] [CrossRef] [Green Version]
  24. Ariyo, O.S.; Arogundade, O.; Abdul-Rafiu, A.M. Discriminant and classification analysis of health status of bell pepper (Capsicum annuum). Res. J. Math. Stat. 2011, 3, 77–81. [Google Scholar]
  25. National Marketing Board (NAMBOARD). Annual Report 2019. Available online: https://www.namboard.co.sz/reports (accessed on 8 October 2021).
  26. Fisher, R.A. The use of multiple measurements in taxonomic problems. Ann. Eugen. 1936, 7, 179–188. [Google Scholar] [CrossRef]
  27. Ali, M.; Abedullah, D. Nutritional and economic benefits of enhanced vegetable production and consumption. J. Crop Prod. 2002, 6, 145–176. [Google Scholar] [CrossRef]
  28. Filina, L.; Filin, S. An analysis of influence of lack of the electricity supply to reefer containers serviced at sea ports on storing conditions of cargoes contained in them. Pol. Marit. Res. 2008, 15, 96–102. [Google Scholar] [CrossRef] [Green Version]
  29. Galawe, N.J. Endogenous and Exogenous Risk Factors in the Success of South African Small-Medium Enterprises. Ph.D. Thesis, University of the Witwatersrand, Johannesburg, South Africa, 2017. [Google Scholar]
  30. Kusunose, Y.; Mason-Wardell, N.; Tembo, S. The Role of Liquidity in Preventing Dis-investment in Crop Inputs: Evidence from Zambia. J. Afr. Econ. 2020, 29, 375–396. [Google Scholar] [CrossRef]
  31. Kenea, T.; Umer, A.; Ambisa, Z. Constraints of agricultural input supply and its impact on small scale farming: The case of Ambo District, West Shewa, Ethiopia. Int. J. Agric. Econ. 2019, 4, 80–86. [Google Scholar] [CrossRef]
  32. Mdemu, M.V.; Mziray, N.; Bjornlund, H.; Kashaigili, J.J. Barriers to and opportunities for improving productivity and profitability of the Kiwere and Magozi irrigation schemes in Tanzania. Int. J. Water Resour. Dev. 2017, 33, 725–739. [Google Scholar] [CrossRef] [Green Version]
  33. Moyo, M.; Van Rooyen, A.; Chivenge, P.; Bjornlund, H. Irrigation development in Zimbabwe: Understanding productivity barriers and opportunities at Mkoba and Silalatshani irrigation schemes. Int. J. Water Resour. Dev. 2017, 33, 740–754. [Google Scholar] [CrossRef] [Green Version]
  34. Elik, A.; Yanik, D.K.; Istanbullu, Y.; Guzelsoy, N.A.; Yavuz, A.; Gogus, F. Strategies to Reduce Post-Harvest Losses for Fruits and Vegetables. Int. J. Sci. Technol. Res. 2019, 5, 29–39. [Google Scholar] [CrossRef]
  35. Nagaraj, N.; Chandrakanth, M.G.; Chengappa, P.G.; Roopa, H.S.; Chandakavate, P.M. Contract farming and its implications for input-supply, linkages between markets and farmers in Karnataka. Agric. Econ. Res. Rev. 2008, 21, 307–316. [Google Scholar]
  36. Harris, S.R. Production is Only Half the Battle; Training Manual; Food and Agriculture Organization of United Nations: Bridgetown, Barbados, 1988; pp. 1–156. [Google Scholar]
  37. de Oliveira, L.G.; Batalha, M.O. Conditioning factors to market fruits and vegetables from family farms to supermarket supply chains. Ciência Rural 2021, 51, 1–8. [Google Scholar] [CrossRef]
  38. Tray, B.; Garnevska, E.; Shadbolt, N. Linking smallholder producers to high-value markets through vegetable producer cooperatives in Cambodia. Int. Food Agribus. Manag. Rev. 2021, 24, 905–920. [Google Scholar] [CrossRef]
  39. Dlamini-Mazibuko, B.P.; Ferrer, S.; Ortmann, G. Factors affecting the choice of marketing outlet selection strategies by smallholder farmers in Swaziland. Afr. J. Sci. Technol. Innov. Dev. 2019, 11, 569–577. [Google Scholar] [CrossRef]
  40. Reardon, T.; Barrett, C.; Berdegué, J.A.; Swinnen, J. Agrifood Industry Transformation and Small Farmers in Developing Countries. World Dev. 2009, 37, 1717–1727. [Google Scholar] [CrossRef]
  41. Wang, H.; Dong, X.; Rozelle, S.; Huang, J.; Reardon, T. Producing and Procuring Horticultural Crops with Chinese Characteristics: The Case of Northern China. World Dev. 2009, 37, 1791–1801. [Google Scholar] [CrossRef]
  42. Hu, D.; Reardon, T.; Rozelle, S.; Timmer, P.; Wang, H. The Emergence of Supermarkets with Chinese Characteristics: Challenges and Opportunities for China’s Agricultural Development. Dev. Policy Rev. 2004, 22, 557–586. [Google Scholar] [CrossRef]
  43. Stringer, R.; Sang, N.; Croppenstedt, A. Producers, Processors, and Procurement Decisions: The Case of Vegetable Supply Chains in China. World Dev. 2009, 37, 1773–1780. [Google Scholar] [CrossRef]
  44. Reddy, G.P.; Murthy, M.R.K.; Meena, P.C. Value chains and retailing of fresh vegetables and fruits, Andhra Pradesh. Agric. Econ. Res. Rev. 2010, 23, 455–460. [Google Scholar]
  45. Ahmad, B.; Hassan, S.; Bakhsh, K. Factors affecting yield and profitability of carrot in two districts of Punjab. Int. J. Agric. Biol. 2005, 7, 794–798. [Google Scholar]
  46. Alamerie, K.; Ketema, M.; Gelaw, F. Risks in vegetables production from the perspective of smallholder farmers: The case of Kombolcha Woreda, Oromia region, Ethiopia. Agric. For. Fish. 2014, 3, 1–5. [Google Scholar] [CrossRef]
  47. Gurses, A.P.; Dietz, A.S.; Nowakowski, E.; Andonian, J.; Schiffhauer, M.; Billman, C.; Abashian, A.M.; Trexler, P.; Osei, P.; Benishek, L.E.; et al. Human factors–based risk analysis to improve the safety of doffing enhanced personal protective equipment. Infect. Control Hosp. Epidemiol. 2019, 40, 178–186. [Google Scholar] [CrossRef]
Figure 1. Risk Management Process by Smith and Merritt (2002).
Agriculture 12 00643 g001
Figure 2. Discriminant classification plot.
Agriculture 12 00643 g002
Table 1. Risk factor loading on enterprises.
Risk VariableClustered
Production
(n = 15)
Semi-Dependent Production
(n = 19)
Independent Scheme
(n = 23)
Group Total
(n = 57)
Mean RankStd. DevMean RankStd. DevMean RankStd. DevMean RankStd. Dev
Market Risks
Product Payments1.671.2343.741.7274.780.8503.611.790
High Input Price2.401.0563.631.2573.871.5463.401.450
Produce Collection Failure4.200.8623.111.5952.961.5513.331.492
Fluctuating Product Prices3.471.4073.580.9022.651.3693.181.297
Drop In Produce Price3.801.0143.261.1951.350.7142.631.447
Wage Rate Changes3.271.2802.740.9332.261.3892.681.270
Product Demand3.871.3022.371.4221.481.1232.401.580
Production Risks
Yield Changes2.601.2423.790.9763.961.2963.541.297
Labour Availability4.130.9153.111.5241.871.3252.881.582
Pest and Diseases2.330.9002.891.3292.131.5172.441.337
Table 2. The role of predictors in explaining the risk variation.
Risk VariableWilks’ LambdaFSig.
Market Risks
Fluctuating Product Prices0.8873.4450.039 *
Produce Collection Failure0.8763.8390.028 *
High Input Price0.8215.8930.005 *
Product Demand0.62915.9200.000 *
Product Payments0.50726.3020.000 *
Drop In Produce Price0.43734.7160.000 *
Production Risks
Yield Changes0.8046.5710.003 *
Labour Availability0.65714.0690.000 *
* = p < 0.05. less than 0.05, strong factor in classification of group.
Table 3. The discriminating risk functions.
VariablesStructural MatrixCoefficients
Function 1Function 2Function 1Function 2
Market Risk
Fluctuating Produce Price (FPD)−0.661 *0.447−0.8330.720
Product Payments (PP)0.571 *0.4430.6720.342
Product Demand (PD)−0.449 *−0.2890.002−0.609
Wage Rate (WR)−0.202 *−0.060−0.340−0.313
Input Price Prices (IPP)0.2500.358 *−0.023−0.114
Product Collection Failure (PCF)−0.197−0.315 *0.146−0.328
Product Price (Py)−0.1850.306 *0.2700.295
Production Risks
Labour Availability (LA)−0.433 *−0.0240.0590.097
Yield Changes (YC)0.2590.409 *0.3420.106
Pest and Diseases (PDs)−0.0660.401 *−0.2800.343
* Largest absolute correlation between each variable and any discriminant function. Values > 0.3.
Table 4. The overall testing of the linear discriminant analysis model.
ParameterResults
Box’s M259.2
F approx. (p-value)1.686 (0.000) ***
Eigenvalue2.839
% of variation89.1
Canonical correlation0.855
Wilks’ Lambda0.2 (0.000) ***
Chi-squared, p-value80.40 (0.000) ***
*** = significant at 1 % .
Publisher’s Note: MDPI stays neutral with regard to jurisdictional claims in published maps and institutional affiliations.

