Article

Long-Term Monocultures of American Ginseng Change the Rhizosphere Microbiome by Reducing Phenolic Acids in Soil

1
School of Environmental Science and Engineering, Qilu University of Technology (Shandong Academy of Sciences), Jinan 250353, China
2
China–Australia Joint Laboratory for Soil Ecological Health and Remediation, Ecology Institute, Qilu University of Technology (Shandong Academy of Sciences), Jinan 250013, China
3
School of Agriculture, Food and Wine, The University of Adelaide, Urrbrae 5064, Australia
*
Author to whom correspondence should be addressed.
Agriculture 2022, 12(5), 640; https://doi.org/10.3390/agriculture12050640
Submission received: 16 March 2022 / Revised: 23 April 2022 / Accepted: 27 April 2022 / Published: 28 April 2022
(This article belongs to the Topic Plant-Soil Interactions)

Abstract

:
American ginseng (Panax quinquefolius L.) is an important cash crop, but long-term monoculture often results in serious root rot disease and yield reduction. The dynamics of soil phenolic acids perform an important function in soil microbe–plant interactions, but the extent to which changes in phenolic acids that occur under the continuous monoculture of American ginseng influence growth and the rhizosphere microbial community are unclear. In this study, American ginseng was planted in soil that had been used for 3 years of continuous monoculture (3 yr) and into a soil with no history of planting American ginseng (0 yr). Soil phenolic acids, rhizosphere microbiome characteristics, and pathogen suppression were analyzed. In the findings, the diversity and structure of the rhizosphere microbial community were affected by monoculture history, as the diversity of fungi and bacteria in 3 yr soil was higher than in 0 yr soil. The physiological performance of American ginseng in 3 yr soil was significantly lower than that in 0 yr soil. Soil phenolic acid contents decreased with the longer monoculture history, and high concentrations of phenolic acids suppressed the growth of American ginseng-specific pathogens. Soil phenolic acids appeared to modulate the pathogen population and the rhizosphere microbiome in American ginseng monocultures.

1. Introduction

American ginseng (Panax quinquefolius L.) is a perennial herb of the Araliaceae family, commonly used in medicine and health products [1,2]. Due to the high economic and medicinal value of American ginseng, the area of planting is significantly increasing, and continuous monoculture systems are widely used, leading to outbreaks of soil-borne diseases and a reduction in yield and quality (antioxidant and anti-inflammatory effects) through several pathways. First, monocultures are usually accompanied by unstable soil microbial communities [3], with increased abundances of pathogens and reduced beneficial microorganisms, resulting in outbreaks of soil-borne diseases on a large scale for apple and Panax plants [4]. In addition, the long-term continuous cropping of maize influences the soil’s physical and chemical properties to inhibit plant growth, such as soil acidification and salinization, organic matter degradation, and nutrient depletion [5]. Finally, yield reductions from monocultures are related to autotoxic substances in rhizosphere soil [6]. These autotoxic substances promote the absorption and utilization of nutrients for pathogens through the regulation of nutrition metabolism, and they aggravate the infection process of pathogens by destroying the cell walls and defense systems of the host, resulting in an increase in pathogenic microorganisms in the rhizosphere soil [7]. Therefore, the growth of American ginseng under monocultures is likely influenced by the interactions of root exudation, soil properties, microbiome activities, and pathogen dynamics.
Phenolic acids, such as p-coumaric acid, vanillic acid and azelaic acid, are aromatic compounds and important secondary metabolites from plant root exudates in a wide range of horticultural species, including Cucumis sativus L. [8], Fragaria ananassa Duch. [9] and Angelica sinensis (Oliv.) Diels [10]. Phenolic acids can promote the development and growth of soil-borne pathogens. For example, p-hydroxybenzoic acid released from the root exudates of cucumber can promote pathogen growth, increase rhizosphere bacterial and fungal density, and inhibit seedling growth, and is therefore considered the cause of autotoxicity in continuous cucumber monocrop systems [11]. Conversely, phenolic acids were found to have stimulated the growth of Fusarium oxysporum f. sp. niveum (a watermelon pathogen from long-term monoculture) at a low concentration, but strongly suppressed pathogen growth at a high concentration [12], indicating that phenolic acids can suppress pathogens at certain concentrations. Moreover, recent evidence suggests that soil phenolic acids from root exudates influence the structure of the microbial community because they can provide diverse C sources affecting soil C cycling, and they serve as chemotactic signals for microbe–plant communications to enrich certain microbes in the rhizosphere [13,14,15]. Therefore, our hypothesis is that phenolic compounds can occur at high concentrations in the soil after the accumulation effect of long-term monocultures of American ginseng, which may in turn modulate soil microbiomes, pathogen populations, and plant growth, although this has not been verified.
In the present study, pot experiments were carried out using soils that had different American ginseng cropping histories. The composition and concentration of phenolic acids in the soils, growth of American ginseng planted in the soils, and microbiome characteristics were determined. The objectives were to evaluate changes in soil phenolic acid content and the rhizosphere microbial community of American ginseng grown in soil from long-term monoculture, compared with the neighbored soil that had previously not been used to grow American ginseng, to identify potential mechanisms for limiting the yield of American ginseng in the interactions between soil metabolites, pathogen suppression, and root-associated microbiome.

2. Materials and Methods

2.1. Soil Samples Collection

The field site for soil collection was at the American ginseng planting base in Rongcheng (33°09′ N; 122°25′ E), Weihai City, Shandong Province, China. The soil samples of neighboring fields with different American ginseng growing histories were collected, identified hereafter as soils with no American ginseng growing (0 yr) and 1-year (1 yr), 2-year (2 yr), and 3-year (3 yr) monoculture.
An “S” pattern sampling method was used to collect soil in the fields. Bulk soils (0–20 cm depth) were sampled using a core sampler (5 cm diameter). Then, the bulk soil samples were thoroughly homogenized and packed in aseptic polyethylene sealed packets [16]. All soil samples were transported in an icebox to the laboratory at 4 °C.

2.2. Soil Analysis

Total nitrogen (TN), total phosphorus (TP), total potassium (TK), alkali-hydrolyzable nitrogen (AN), available phosphorus (AP), available potassium (AK), and organic matter (OM) of the soil samples were measured. TN was determined using the Kjeldahl method (ALVA, Shandong, China). TP and AP were measured by sodium bicarbonate extraction and molybdenum–antimony colorimetry [17]. Flame photometry was used to determine TK and AK (Shanghai Precision Instrument Co., Ltd., Shanghai, China) [18]. AN was measured by the conductometric titration method [19]. OM was quantified by the dry combustion method [20]. The work was completed by the Shandong Analysis and Test Center, Jinan, Shandong Province.
Phenolic acids were extracted from the soils using a modified method described by Wu, et al. [21]. The soil samples were air-dried and screened through a 100-mesh sieve (100 openings per inch) to remove plant residues; then, 20 g of each sample was placed in a flask with a stopper, to which 150 mL of a 2 M NaOH solution was added. All flasks were shaken at 120 rpm at 30 °C for 12 h. The soil extracts were centrifuged at 10,000 rpm for 5 min; then, 100 mL supernatant was collected, and the pH was adjusted to 2.5 with a 5 M HCl solution. The supernatant was then extracted with ethyl acetate. All extracts were combined and evaporated to dryness at 45 °C. The residue was dissolved in 2 mL of 80% methanol and filtered with a 0.22 μm filter membrane to prepare for HPLC analysis.
Authentic samples of p-hydroxybenzoic acid, vanillin, vanillic acid, p-coumaric acid, cinnamic acid, benzoic acid, syringic acid, ferulic acid, and salicylic acid (Sangon Biotech, Shanghai, China) were prepared as 100 mg L−1, 50 mg L−1, 25 mg L−1, 12.5 mg L−1, 6.25 mg L−1, and 3.125 mg L−1 standard solutions with 80% methanol as the solvent. The phenolic acids in the soil extracts were detected using Agilent 1260 infinity II HPLC (Agilent Technologies Inc., Palo Alto, CA, USA) with a Symmetry C-18 reversed column (4.6 mm × 250 mm, 5 μm). A 5 μL sample was injected into the column at 35 °C, and the chromatograms were monitored at 280 nm. The mobile phase was 0.5% acetic water (A) and methanol (B) with a flow rate of 0.7 mL min−1. The chromatographic conditions were as follows: 0–10 min, 95–80% A and 5–20% B; 10–13 min, 80–65% A and 20–35% B; 13–33 min, 65–50% A and 35 –50% B; 33–43 min, 50–5% A and 50–95% B; 43–53 min, 5–95% A and 95–5% B.

2.3. American Ginseng Pot Experiment

A pot experiment was undertaken using the soils with a 3-year monoculture of American ginseng (3 yr), the longest duration of monoculture in the collected field soil, and no American ginseng growing history (0 yr). Four American ginseng seeds were sown in each pot (250 mL) with 150 g of soil, and pots without plants were used to sample bulk soil. Three pots per treatment were set up as the three replicates. The plants were cultivated for 2 months in the greenhouse with watering once a week. The germination rate, plant height, chlorophyll content of leaves, incidence of root rot, root fresh weight, fibrous root numbers, and root activity (indicated by respiration rate) were measured.
The chlorophyll content was measured by a modified acetone extraction method [22]. The specific method was as follows: 10 fresh and clean leaves were removed from each pot; a uniform circular piece of leaf tissue was extracted from each leaf using a hole punch and then cut into pieces with scissors, removing the midrib. The sample was put into a mortar with quartz sand and 3 mL of 80% acetone solution. The mixture was ground with a grinding rod until the leaf blade tissue became white. The homogenate was passed through filter paper to remove leaf tissue, and the residual chlorophyll on the filter paper was washed out with 80% acetone and transferred into a volumetric flask together with the filtrate. Acetone solution (80%) was used as the control. After 10-fold dilution, absorbance was measured at 470 nm, 649 nm, and 665 nm. The following formula was used to calculate chlorophyll content:
C a = 12.21 A 663 2.81 A 646
C b = 20.13 A 646 5.03 A 663
C XC = 1000 A 470 3.27 C a 104 C b 229
Chlorophyll   content = C × V × 10 11.3 mg · cm 2
A470, A646, and A663 are the absorbances of chlorophyll extract at 470 nm, 646 nm, and 663 nm, respectively. Ca is the concentration of chlorophyll a, Cb is the concentration of chlorophyll b, and CXC is the concentration of carotenoids. C is chlorophyll concentration, and V is extract volume.
Root activity was measured by the triphenyl tetrazolium chloride (TTC) method [23], which started by mixing 0.5 g root tip, 5 mL of 0.1 M phosphoric acid buffer solution, and 0.4% TTC solution in a beaker until the root sample was completely immersed. After dark incubation at 37 °C for 1.5 h, 2 mL of 1 M sulfuric acid was added to stop the reaction. After the reaction, each root sample was dried with sterile filter paper and transferred into a mortar with quartz sand and 3 mL ethyl acetate for grinding. The mortar and grinding rod were then washed with ethyl acetate, and the washed liquid was collected in a volumetric flask and brought up to 10 mL with ethyl acetate. Absorbance was measured at 485 nm. Ethyl acetate was used as control. According to the standard curve equation, reduction in the amount of tetrazolium was calculated. The root activity was calculated as follows:
Root   activity = Reduction   in   amount   of   tetrazolium Fresh   weight   of   root × Dark   processing   time mg / g · h
The incidence of root rot was calculated by the following formula [24]:
I = Nd Nt × 100 %
where I was incidence of root rot (%); Nd was the number of American ginseng seedlings with disease in each pot; and Nt was the total number of American ginseng seedlings in each pot.
Rhizosphere soil was collected for high-throughput sequencing of the soil microbial community. The topsoil of 0 to 2 cm was removed. For the whole root system of American ginseng, the roots closely adhering soil (about 1–3 mm) were gently shaken off; the soil was collected and defined as rhizosphere soil. Rhizosphere soils of the four plants in one pot were pooled as one replicate. Soils from the pot with no plants were sampled as bulk soil. All samples were categorized into four groups, i.e., bulk soil from the soils with no American ginseng growing history (0 yr-bs); rhizosphere soil from the soils with no American ginseng growing history (0 yr-rs); bulk soil from the soils with 3-year American ginseng monoculture (3 yr-bs); and rhizosphere soil from the soils with 3-year American ginseng monoculture (3 yr-rs).
The total metagenomic DNA of the soil was extracted from 0.3 g soil using DNeasy PowerSoil DNA Isolation Kit (Qiagen, Germany) according to the manufacturer’s instructions. The quality and concentration of extracted DNA were estimated by 0.8% agarose gel electrophoresis and stored at −20 °C for high-throughput sequencing.
The fungal ITS1 region was amplified by universal primers ITS3F: (5′-GCATCGATGAAGAACGCAGC) and ITS4R: (5′-TCCTCCGCTTATTGATATGC). The bacterial 16S region was amplified by universal primers 341F: (5′-CCTACGGGNGGCWGCAG) and 805R: (5′-GACTACHVGGGTATCTAATCC). Each of the 30 reactions contained Phusion Master Mix (2×) (Thermo Fisher Scientific, Waltham, MA, USA) 15 μL, primer (2 μmol L−1) 3 μL, template DNA (1 ng μL−1) 10 μL, and ddH2O 2 μL. The PCR reaction procedure was as follows: a pre-denaturation step at 98 °C for 1 min, followed by 30 cycles at 98 °C for 10 s, 50 °C for 30 s, and 72 °C for 30 s, and the last step at 72 °C for 5 min. High-throughput sequencing used the Illumina Miseq platform, completed by Sangon Biotech (Shanghai) Co., Ltd., Shanghai, China.

2.4. Effects of Exogenous Phenolic Acid Concentration and Extracts of Soils with Different American Ginseng Growing History on Pathogen Suppression

American ginseng roots infected with soil-borne diseases were collected from the fields to isolate pathogenic fungi, using the techniques and the pathogen list of Durairaj, et al. [25]. Infected roots were surface-sterilized with 70% ethanol for 5 min, washed with distilled water, and then incubated on potato dextrose agar (PDA) at 25 °C for 7 days. The initial isolation was based on colony morphology, followed by culture purification on PDA. The primary identification of the purified isolates was based on morphological characteristics under the microscope (Olympus Corporation, Tokyo, Japan). With the primary identification outcomes, the ITS sequence of the isolates to be identified were amplified by Sangon Biotech. After blast sequence homology comparison, the isolates were finally identified as strains of Fusarium solani, Fusarium oxysporum, and Rhizoctonia solani. These strains were then inoculated to disease-free American ginseng to confirm their pathogenicity.
Four strains, including the three species isolated above, i.e., F. solani, F. oxysporum, and R. solani, and one strain of Cylindrocarpon destructans (ACCC39132) purchased from the Agricultural Culture Collection of China, were considered target pathogens in this analysis. Based on the type and content of phenolic acid in the soil determined by HPLC in this study, six different phenolic acids including p-coumaric acid, p-hydroxybenzoic acid, vanillic acid, vanillin, benzoic acid, and cinnamic acid were used. The solutions containing six phenolic acids were sterilized with a 0.22 μm filter membrane (Sangon, China) and added to PDA medium with a final concentration of 0, 2.5, 5, 10, and 50 mg L−1. Mycelial discs (5 mm diameter each) of pure cultures of the pathogens were incubated on PDA plates with different concentrations of phenolic acid at 25 °C for 4 days. Colony growth was assessed by measuring the diameters according to the “cross” method [26], and the response index of each pathogen was calculated using following formula [27]:
RI = 100 % C T × 100 %         T C RI = T C × 100 % 100 %           ( T < C )
where RI was response index (%); T was the colony diameter of the pathogen on plates with added phenolic acid; C was the colony diameter of the pathogen on control plates; RI > 0 indicates promotion to growth of the pathogen, and RI < 0 indicates inhibition of growth of the pathogen.
To evaluate the effects of soil extracts on the inhibitory activity of four pathogens from American ginseng, soils with 3-year monoculture history (3 yr) and no growing history (0 yr) were extracted using methanol in methanol-to-soil ratios of 2:1 and 5:1 for both treatments. The mixture of soil and methanol was shaken at 140 rpm at 30 °C for 12 h, and treated with ultrasound at 26 °C for 1 h, then centrifuged at 6000 rpm for 2 min. The supernatants were sterilized with a 0.22 μm filter membrane, then added to PDA at the ratio of 15 mL soil extract per 540 mL PDA. The 5 mm mycelial discs were incubated on the PDA plates supplemented with soil extracts at 25 °C for 4 days. An equivalent amount of methanol was added to the control disks. The colony diameter was measured, and the response index was calculated with 0 yr soil extract as control.

2.5. Bioinformatics

All raw data were uploaded and saved in the Genome Sequence Archive (GSA) database (accession number: CRA005813). The paired-end sequence data were obtained by sequencing. According to the overlap relationship between the PE reads, the paired reads were merged into one sequence. Then, each sample’s data were identified and differentiated according to the barcode label sequence, and finally, the quality of each sample’s data was filtered by quality control. Low-quality bases were removed, sequences smaller than 100 bp were discarded by splicing, specific amplified sequences and chimeras were removed, and the sequences were classified as operational taxonomic units (OTUs) at a 97% similarity level. Representative sequences of OTUs were annotated using the mothur method [28]. For ITS sequences, we used Blast to compare with the UNITE database [29], and for 16S sequences we used Blast to compare with the GTDB database. Finally, the community composition of each sample was determined at each classification level: domain, phylum, class, order, family, genus, and species. Plant-associated OTUs in the fungal microbiome were removed (Table A2).

2.6. Statistical Analysis

The significance of the differences between treatments was evaluated by analysis of variance (ANOVA) using SPSS 19.0 (IBM Corporation, Armonk, NY, USA); Duncan’s multiple range test was used for comparison. Fungal and bacterial OTUs shared among compartments were analyzed using the “VennDiagram” package in R (v3.6.0). Similarity and difference analysis of fungal and bacterial communities in 0 yr and 3 yr monoculture soils was performed using Principal Coordinate Analysis (PCoA) based on Bray–Curtis distance on the “Vegan” package in R. Linear discriminant analysis effect size (LEfSe) was used to find the microbial lineages that could best explain the differences between groups in different soil samples. The Kruskal–Wallis (KW) rank-sum test was used to detect significant differences in abundance between groups, and the (unpaired) Wilcoxon rank-sum test was used to check the consistency of differences. Linear discriminant analysis effect size (LEfSe) was used to identify the microbial taxonomic groups most likely to explain the difference between two treatments (http://huttenhower.sph.harvard.edu/lefse/, accessed on 28 April 2022).

3. Results

3.1. Physical and Chemical Properties, and Phenolic Acid Content of Soils with Different American Ginseng Cropping Histories

There was no significant difference in OM, TN, and TK in soils with different American ginseng cropping histories (Table 1). In addition, the content of AN in the 1 yr and 2 yr soils was significantly lower than that in 0 yr and 3 yr, and the content of TP and AK in the 2 yr soil was lower than that in other soils. There was no significant difference in any physical or chemical properties between the 3 yr and 0 yr soils.
The six phenolic acids with the highest content in the soils were p-coumaric acid, p-hydroxybenzoic acid, vanillic acid, vanillin, benzoic acid, and cinnamic acid when assessed using HPLC (Figure 1). The content of total phenolic acid in the soils significantly decreased from 0 yr to the 2 yr monocultures but did not differ between the 2 yr and 3 yr soils. The relative amount of p-coumaric acid was highest among the six phenolic acids, and it significantly decreased with the increase in monoculture years, which declined from 19.64 μg g−1 in 0 yr soil to 5.60 μg g−1 in 2 yr soil and 6.12 μg g−1 in 3 yr soil. The content of the other five phenolic acids showed no significant differences between different soil samples (Figure 1).

3.2. Effects of Soils with Different Monoculture Histories on the Growth of American Ginseng

Soils with 0 yr and 3 yr monoculture had no significant effect on the germination rate of American ginseng (Figure 2a). In terms of aboveground growth, the plant height of American ginseng grown in soil with 3 yr monoculture was 4.96 cm, which was significantly lower than 5.98 cm in 0 yr soil (Figure 2b). The chlorophyll content of plants grown in soil with no American ginseng growing history was higher than that of plants grown in soil after 3-year monoculture (Figure 2c). The effects of soils with different monoculture histories on the morphological and physiological traits of American ginseng roots were more obvious. The 3 yr monoculture soil led to morphological disorders of the roots (Figure 2d). Root rot incidence in 3 yr soil was 25% higher than in 0 yr soil (Figure 2e). The average fresh weight of American ginseng roots grown in soil with no American ginseng planting history was 0.26 g, which was significantly higher than in the 3 yr monoculture soil (0.15 g) (Figure 2f). Monocultured soil significantly reduced the root activity (Figure 2g) and fibrous root numbers (Figure 2h) of American ginseng.

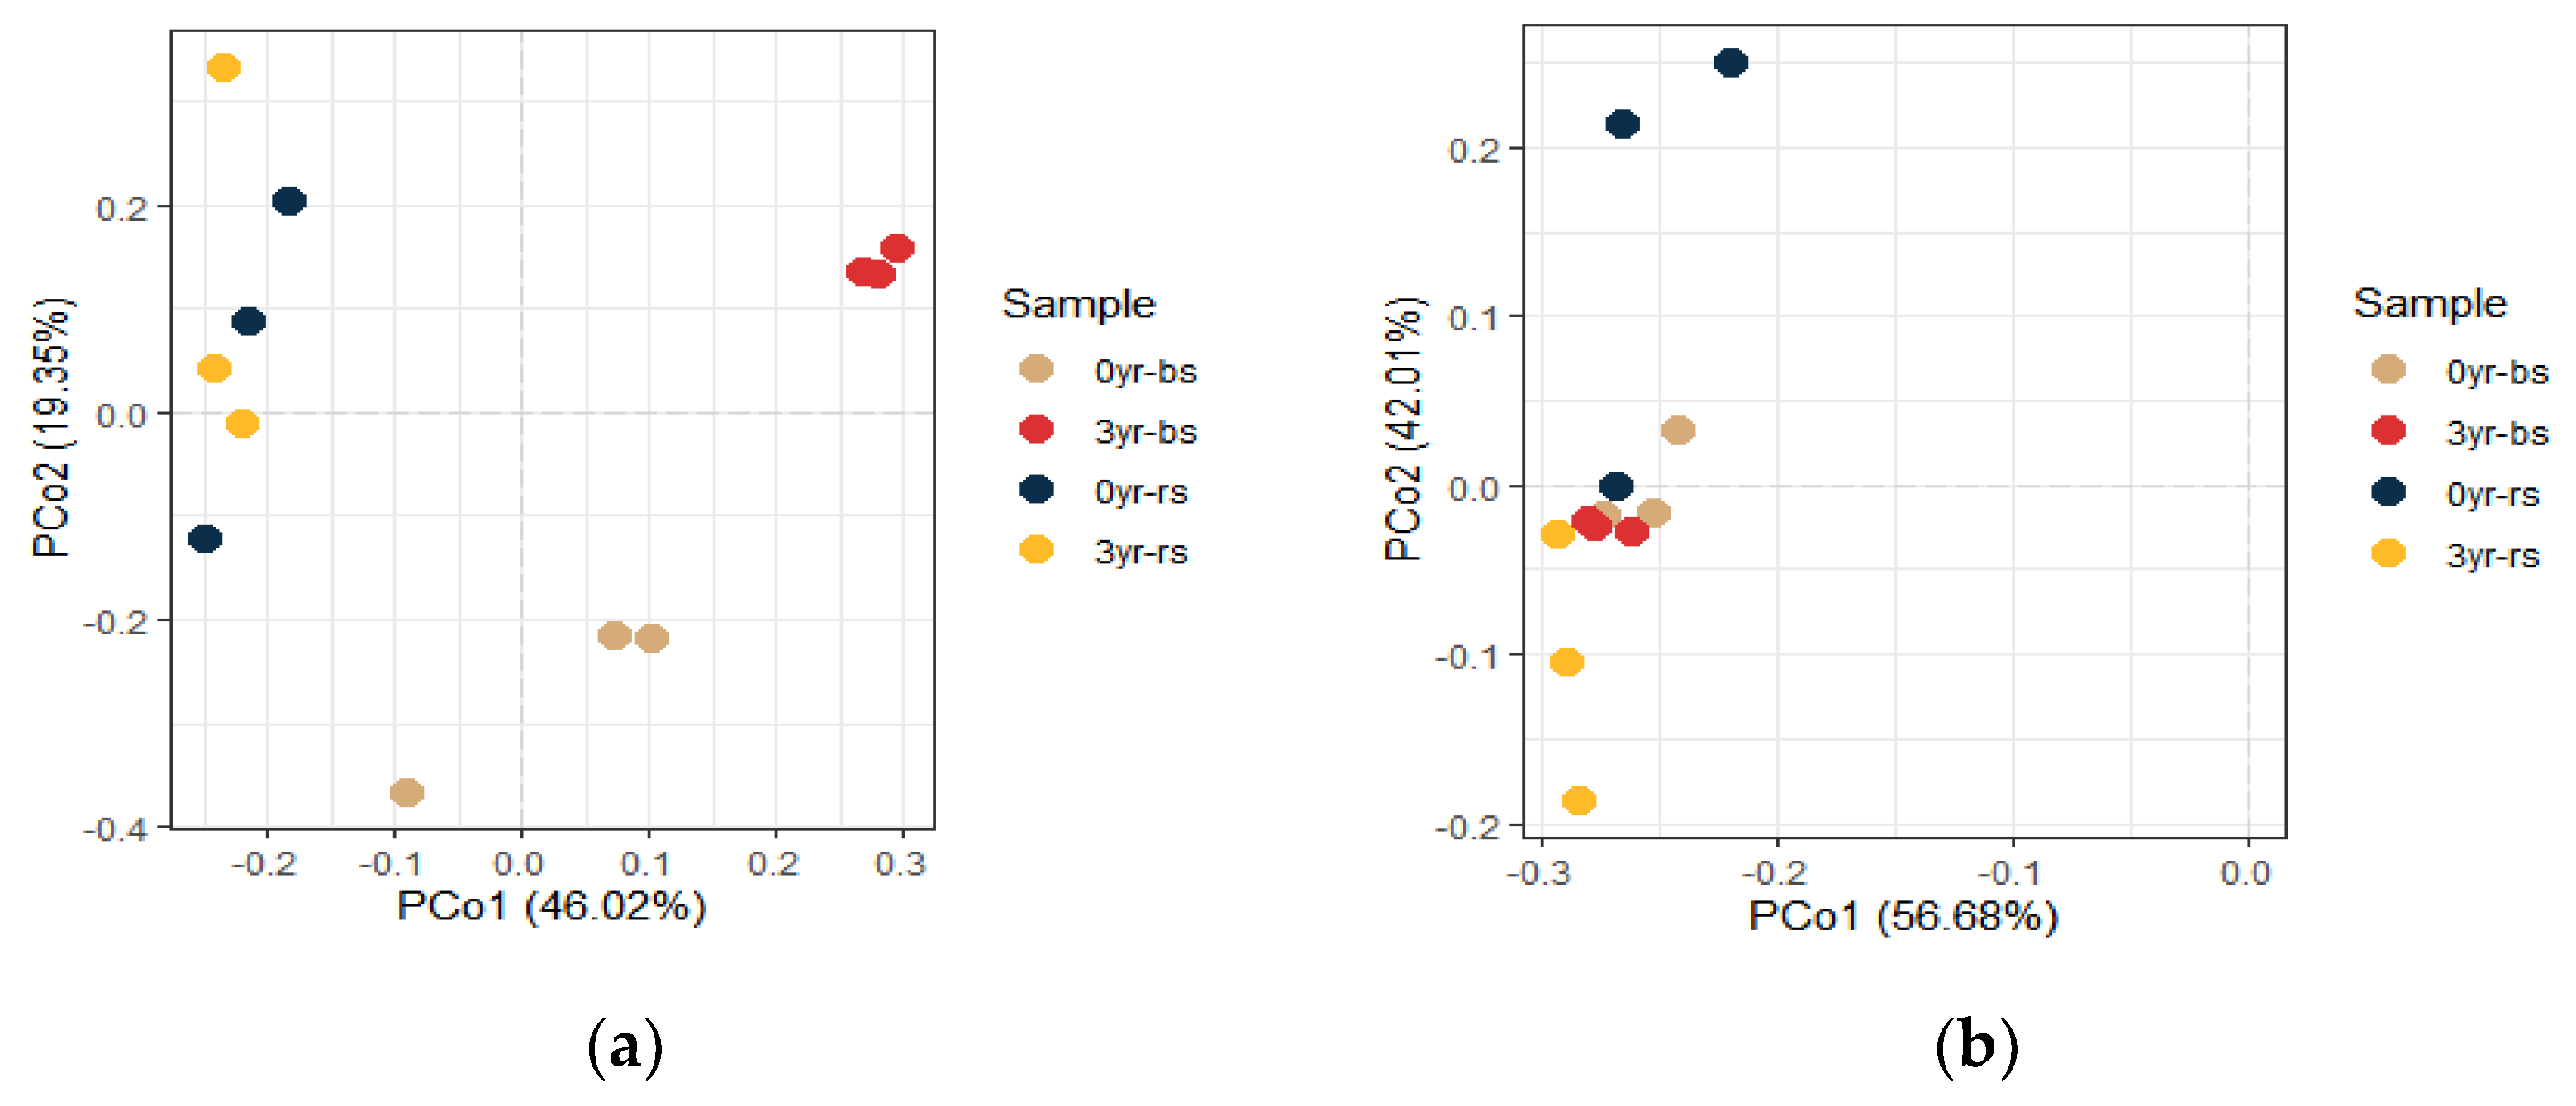
3.3. Rhizosphere Microbial Community of American Ginseng Influenced by Soils with Different Monoculture Histories

Richness and the Shannon index were used to describe the diversity of the microbial community. The fungal OTU richness of the bulk soil and rhizosphere soil with 3 yr monoculture was greater than in soils with no ginseng growing history (Figure 3a). The Shannon index of the fungal community in 0 yr-rs was higher than that of 3 yr-rs (Figure 3b), but there was no significant change between 0 yr-bs and 3 yr-bs. For the bacterial community, the OTU richness in the rhizosphere soil was higher than in the bulk soil, and 3 yr-rs was higher than 0 yr-rs; however, there was no significant difference between 0 yr-bs and 3 yr-bs (Figure 3c). The bacterial Shannon index of 3 yr-bs was significantly lower than that of 0 yr-bs, but the Shannon index of 3 yr-rs was significantly higher than that of 3 yr-bs (Figure 3d).
PCoA analysis based on Bray–Curtis distance was used to further evaluate the differences between fungal communities in the bulk soil and rhizosphere of American ginseng grown in 0 yr and 3 yr monoculture soils (Figure 4a). The interpretation degrees of the first and second principal coordinates of the differences in soil fungal communities were 46.02% and 19.35%. The rhizosphere fungal communities of the two soils (0 yr-rs and 3 yr-rs) were clustered and were closer than for bulk soils (0 yr-bs and 3 yr-bs). For bacterial communities, the interpretation degrees of the first and second principal coordinates of the differences in soil bacterial communities were 56.68% and 42.01%. The bulk soil from the two soil types were grouped closely and differed from the rhizosphere bacterial microbiome (Figure 4b).
Changes in the relative abundance of the top ten phyla and genera were studied. The results showed that the dominant fungal phylum in the four soil treatments belonged to the Ascomycota. The relative abundance of Ascomycota in the bulk soil was higher in the monoculture soils than in the soil with no growing history, but in the rhizosphere, Ascomycota abundance was higher in 0 yr-rs than in 3 yr-rs. Mortierellomycota, Basidiomycota, and Mucoromycota showed no significant difference between 0 yr-bs and 3 yr-bs (Figure 5a).
A further classification at the genus level showed that the dominant fungi in 0 yr-bs belonged to Humicola, Mortierella, and Pseudolaria (Figure 5b). The dominant fungi in 3 yr-bs belonged to Alternaria, Mortierella, Fusarium, and Cladosporium. The relative abundance of Fusarium, Alternaria, and Cladosporium in 3 yr-bs were 1.8%, 13%, and 7.6% higher than that in 0 yr-bs, respectively. In addition, the dominant fungi in the rhizosphere (0 yr-rs and 3 yr-rs) belonged to Fusarium. The relative abundance of Fusarium in 0 yr-bs and 3 yr-bs increased by 3.9% and 10.4%, respectively. In contrast, the relative abundance of Alternaria in 0 yr-rs decreased by 16% compared to that in 0 yr-bs, and in 3 yr-rs decreased by 4.3% compared to that in 0 yr-bs.
The dominant bacterial phyla in all the samples were Proteobacteria and Acidobacteria, with no significant difference between 0 yr-bs and 3 yr-bs. In the rhizosphere for soils with 0 yr and 3 yr growing history, the relative abundance of Proteobacteria significantly increased. However, the relative abundance of Acidobacteria significantly decreased (Figure 5c).
For bacterial genera, GP2 was dominant in 0 yr-bs and 3 yr-bs with 8% and 8.7%, respectively, and there was no significant difference between them. GP1 increased in the rhizosphere of 0 yr-rs and 3 yr-rs, with relative abundance of 7.2% and 7.5%, respectively. In rhizosphere soil, the relative abundance of Burkholderia significantly increased, 5.3% and 5% in 0 yr-rs and 3 yr-rs, respectively, while its relative abundance in 0 yr-bs and 3 yr-bs was less than 1% (Figure 5d).
The differences between fungal communities in different soil samples were studied at multiple taxonomic levels. LEfSe analysis was performed to identify the fungal taxa contributing the most to the difference in fungal communities between 0 yr-bs and 3 yr-bs and between 0 yr-rs and 3 yr-rs. LEfSe results showed that the fungal genera that played an important role in 3 yr-bs soil samples included Cladosporium, Calycina, and Plectosphaerella (Figure 6a). Representative taxa in 0 yr-bs included lineage from Humicola, Pseudoleuria, and Ascobolus (Figure 6a).
In the rhizosphere, the representative fungal genera of 3 yr-rs included lineage from Helicoma, Cyberlinkera, Saitozyma, and unclassified Capnodiales (Figure 6b). The representative genera in 0 yr-rs were Pseudolaria, unclassified Auriculariales, and unclassified Aordariaceae (Figure 6b). These results showed that pathogenic fungi played a leading role in differing the soil fungal community under continuous cropping from the soil with no American ginseng cropping history.

3.4. Effects of Exogenous Phenolic Acids and Soil Extracts on Suppression of American Ginseng Root Pathogens

Compared with the control group, the mycelial growth of F. solani, C. destructans, and R. solani was significantly promoted by phenolic acids at low concentration (2.5–10 mg L−1) but was inhibited at 50 mg L−1 with response indexes of −12.7%, −13.9%, and −11.1%, respectively (Table 2). The mycelial growth of F. oxysporum was inhibited at all given concentrations (2.5, 5, 10, 50 mg L−1) of phenolic acid, and the inhibitory effect was directly related to the concentration of phenolic acid (Table 2). Compared with non-American-ginseng soil (0 yr), soil extracts from 3-year monoculture (3 yr) increased the mycelial growth of the four pathogens of American ginseng, indicated by the positive RI values in both methanol:soil ratios (2:1 and 5:1, Table 3).

4. Discussion

This study illustrated significant mechanisms for inhibiting the growth of American ginseng in long-term monocultures. Growth reduction in American ginseng was detected in monocultured soils. The structure and diversity of the rhizosphere microbiome were distinct compared with soils that had not been used to grow American ginseng, even though there was no difference in the physical properties and elemental contents between the soils. We found that monoculture duration decreased the phenolic acid contents in the soil, which was contrary to our original hypothesis, and confirmed that high concentrations of phenolic acids were able to suppress the in vitro growth of pathogens infecting American ginseng. Therefore, the interactions of soil phenolic acids, pathogen population, and rhizosphere microbiome could lead to the inhibition of American ginseng growth after long-term monoculture.

4.1. Monoculture Changed the Rhizosphere Soil Microbial Community of American Ginseng

The soil microbial community is an important factor affecting crop growth and quality [30]. PCoA analysis showed that the change of fungal and bacterial community structures from bulk soil to rhizosphere was similar in 0 yr and 3 yr cultivated soils, which may be driven by the same factor in the two soils, such as root exudation by American ginseng. The diversity of fungi and bacteria was significantly higher in 3 yr cultivated soil than 0 yr soil, which is similar to a report on the increase in fungal diversity during Panax notoginseng continuous cropping [4]. The diversity of soil microorganisms is related to soil quality and health [31]. In addition, we found that the relative abundance of Fusarium and Burkholderia increased after monoculture of American ginseng, and the accumulation of pathogens in the soil may lead to the outbreak of soil-borne diseases [32]. LEfSe analysis showed that the dominant fungal community in the rhizosphere had changed from the bulk soil, possibly due to the rapid enrichment of certain fungi in the rhizosphere soil.

4.2. Phenolic Acids Promote the Succession of the Rhizosphere Microbial Community of American Ginseng

Many factors affect the structure of the soil microbial community, among which root exudates are some of the most important [33]. Through bioassay, we found that phenolic acids at lower concentration levels promoted the growth of Fusarium solani, Cylindrocarpon destructans, and Rhizoctonia solani in vitro. Saponins exuded from the roots of American ginseng were reported to promote the growth of pythiaceous fungi [34]. More importantly, the 3 yr soil extract had a greater stimulating effect on American ginseng pathogens than the 0 yr soil extract, possibly due to the lower phenolic acid content in the 3 yr soil. Given the differences in the soil microbial community between the 0 yr and 3 yr soil after monoculture of American ginseng, we speculate that changes in the phenolic acid concentration promote the succession of the rhizosphere soil microbial community in the process of monoculture with American ginseng. This can in turn enrich pathogens at specific low concentrations and may be a key mechanism leading to the outbreak of root rot in American ginseng in 3 yr monoculture soil.

4.3. Phenolic Acids Hinder the Growth of American Ginseng

A seedling bioassay based on shoot and root growth is an effective method to evaluate plant growth [35]. In a pot experiment, monoculture soil seriously hindered the growth of American ginseng, leading to lower leaf chlorophyll content, fresh root weight, and root metabolic activity by causing root deformity compared to plants grown in 0 yr soil. Root deformity will impede the normal function of roots and can limit growth [36]. Studies have shown that in the process of continuous monoculture, many perennial and annual crop species have problems, such as the reduction in growth vitality and a decline in crop yield and quality. The reasons for this phenomenon are complex and can be accompanied by changes in the soil’s physical and chemical properties, as well as changes in the microbial community [37,38]. Since there were no significant differences in the physical and chemical properties between the two soils in this study, we infer that the decrease in soil phenolic acids probably hinder the growth of American ginseng in monocultures. The reduced soil phenolic acids observed with the increased duration of monoculture with American ginseng was possibly a result of the fact that maize had been planted for a long term in the same field before growing American ginseng, and it has been demonstrated that maize root secretes a high concentration of phenolic acids [39]. Previous studies reported that phenolic acids were a key variety of secondary metabolites in ginseng root [40], but they may not be released into the soils as root exudates.

5. Conclusions

The results showed that the abundance of pathogenic microflora gradually increased, and the microbial community structure changed to a greater extent during the monoculture of American ginseng for up to 3 years. Moreover, microbial community diversity was different in non-American-ginseng soil and three years after sowing. American ginseng under the monoculture had lower physiological indexes (root activity and leaf chlorophyll content), which can possibly be attributed to the effects of soil phenolic acids on suppressing pathogens at certain levels. Soil phenolic acid concentrations were highly associated with the monoculture systems. The mechanisms identified in this study provide potential solutions, such as improving soil phenolic acid concentrations, to overcome obstacles in monoculture American ginseng.

Author Contributions

Conceptualization, Y.W., H.L. and Y.Z.; methodology, J.L. and Y.W.; software, J.H. and Y.Z.; formal analysis, Z.Z., J.P. and Y.Z.; data curation, S.A.; writing—original draft preparation, S.A., Y.W. and Z.Z.; writing—review and editing, J.P., M.R., R.T., Y.Z. and M.D.D.; funding acquisition, J.L. All authors have read and agreed to the published version of the manuscript.

Funding

This research was funded by the Qilu University of Technology (Shandong Academy of Sciences) science, education, and industry integration innovation pilot project (International Cooperation) (Grant number: 2020KJC-GH07); the “20 items” (independent cultivation of innovation team) project of colleges and universities in Jinan (Grant number: 2020GXRC003); the Qilu University of Technology (Shandong Academy of Sciences) University-Research Collaborative Innovation Fund (Grant number: 2020-CXY42); the Shandong Province Key R&D Program (Major Scientific and Technological Innovation Project) (Grant number: 2020CXGC010803-02); and the Natural Science Foundation of Shandong Province of China (Grant number: ZR2019BC076).

Institutional Review Board Statement

Not applicable.

Informed Consent Statement

Not applicable.

Data Availability Statement

All sequencing raw data were uploaded to the Genome Sequence Archive (GSA) database (accession number: CRA005813).

Acknowledgments

We sincerely thank the Qilu University of Technology (Shandong Academy of Sciences) and the University of Adelaide for their support.

Conflicts of Interest

The authors declare no conflict of interest.

Appendix A

Table A1. The degrees of freedom, F value, and p value for the ANOVA used in the present study.
DFFp-Value
Table 1. The physical and chemical properties of the soils
with different monoculture history of American ginseng.
OM112.4580.137
TN113.5360.068
AN1138.741<0.01
TP115.2850.027
AP11109.014<0.01
TK112.7680.111
AK1133.944<0.01
Table 2. The effect of phenolic acid concentrations on the
growth of American ginseng pathogens.
Fusarium solani1112.634<0.01
Cylindrocarpon destructans1131.704<0.01
Rhizoctonia solani1115.271<0.01
Fusarium oxysporum1166<0.01
Table 3. The effect of soil extracts on the growth of
American ginseng pathogens.
Fusarium solani53.2450.015
Cylindrocarpon destructans57.539<0.01
Rhizoctonia solani52.4980.189
Fusarium oxysporum50.0010.98
Figure 1. The effect of monoculture history of American
ginseng on soil phenolic acid.
Total phenolic acid1180.527<0.01
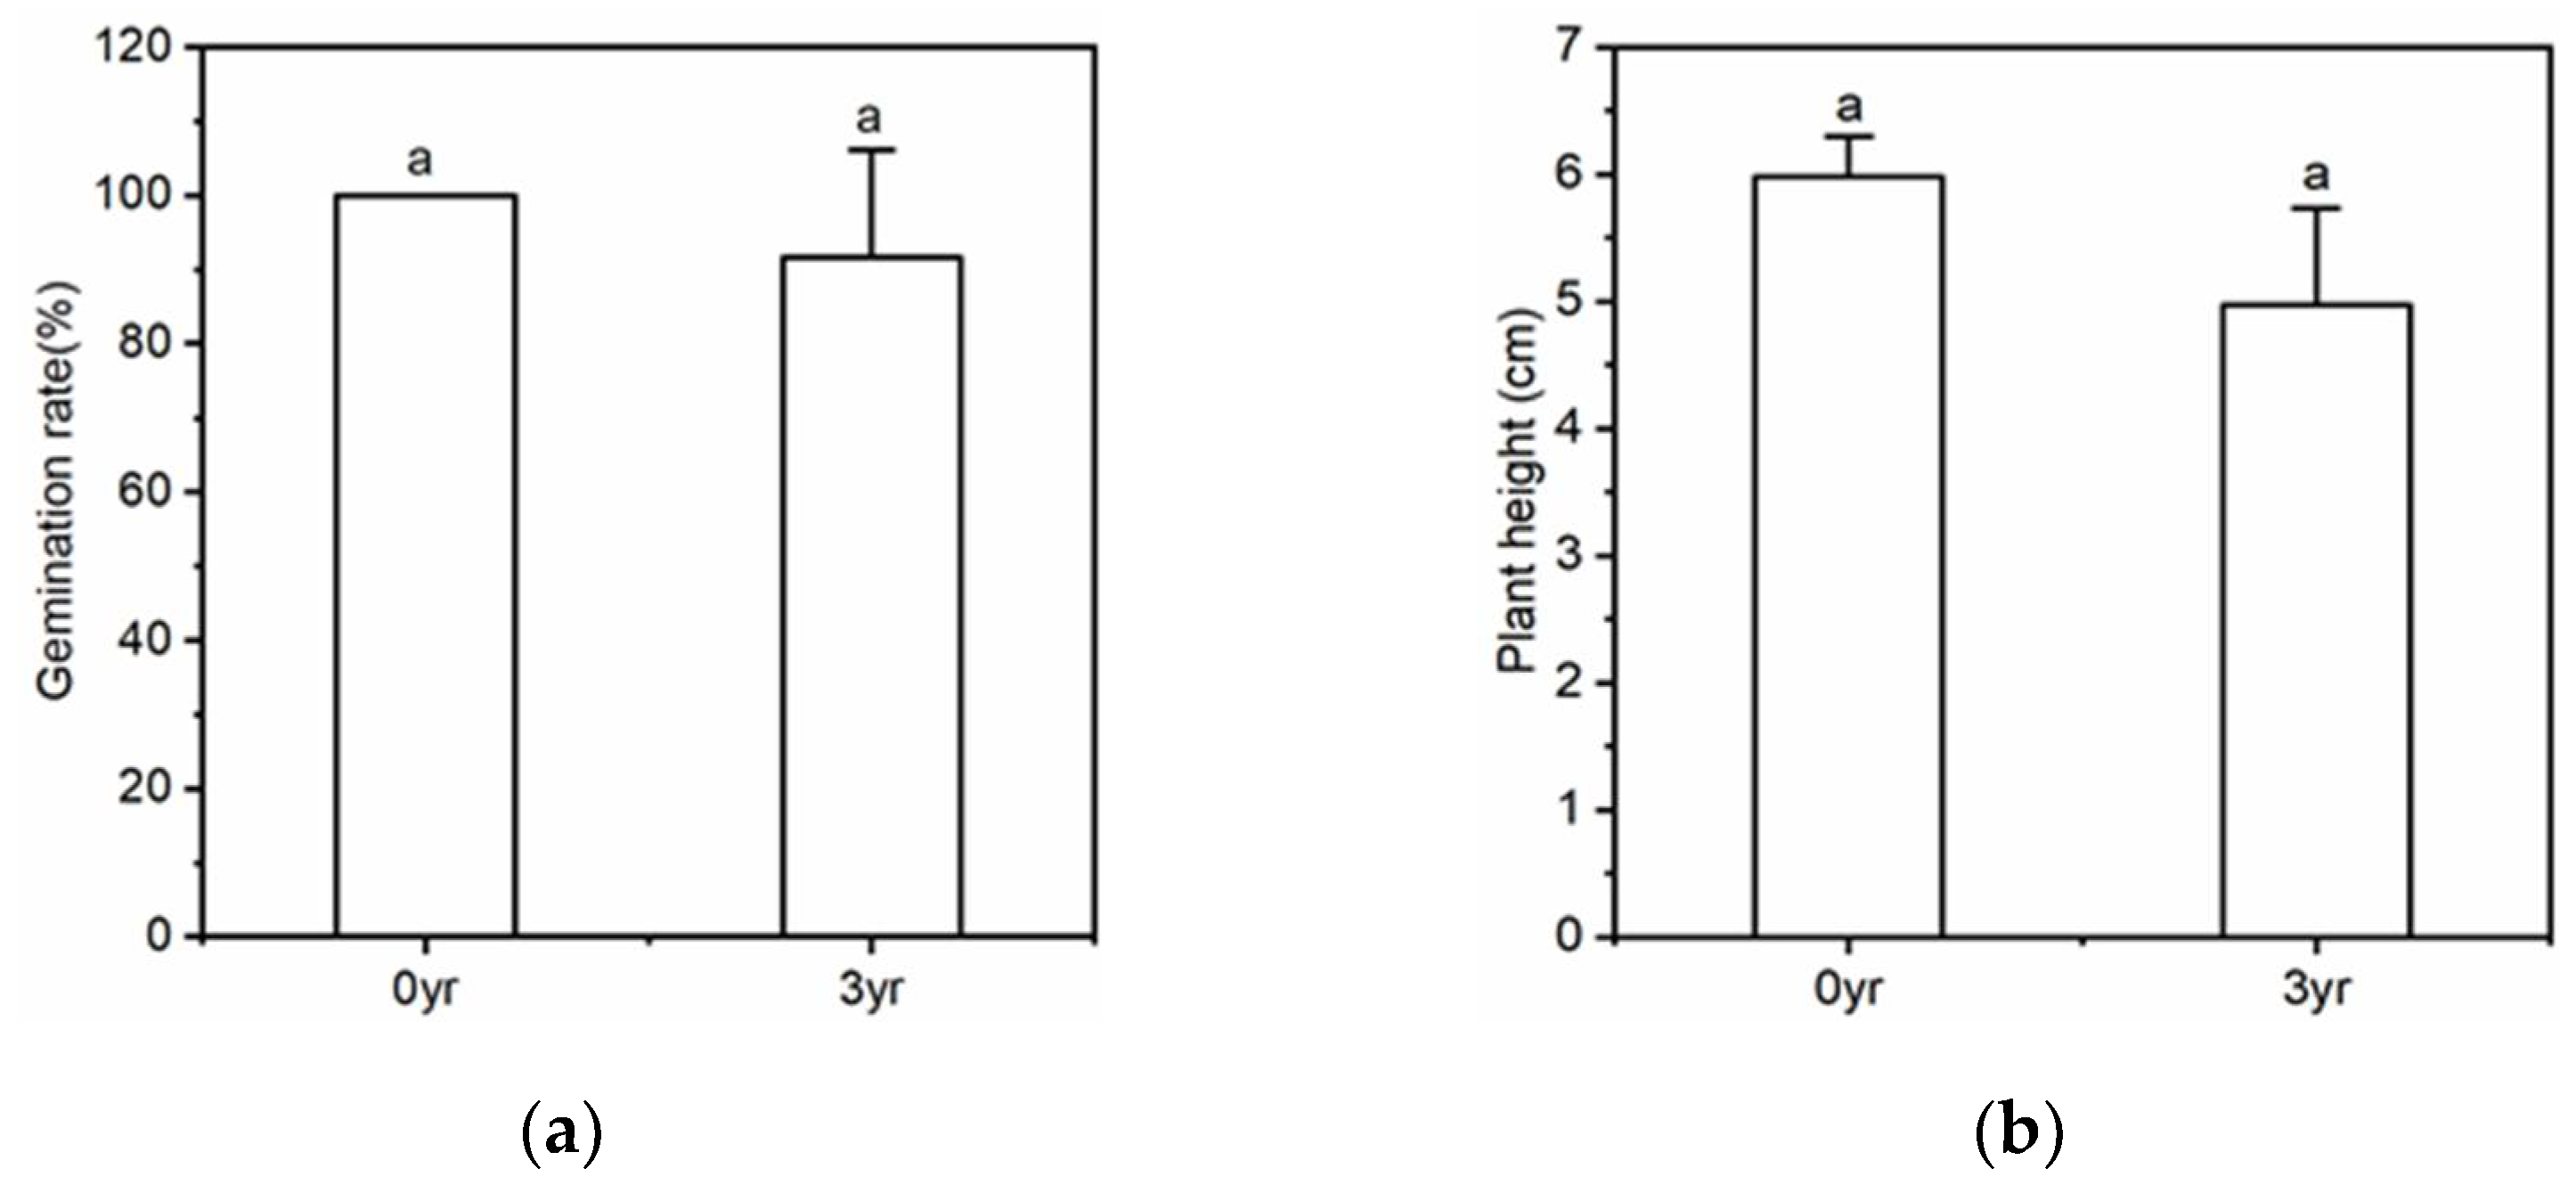
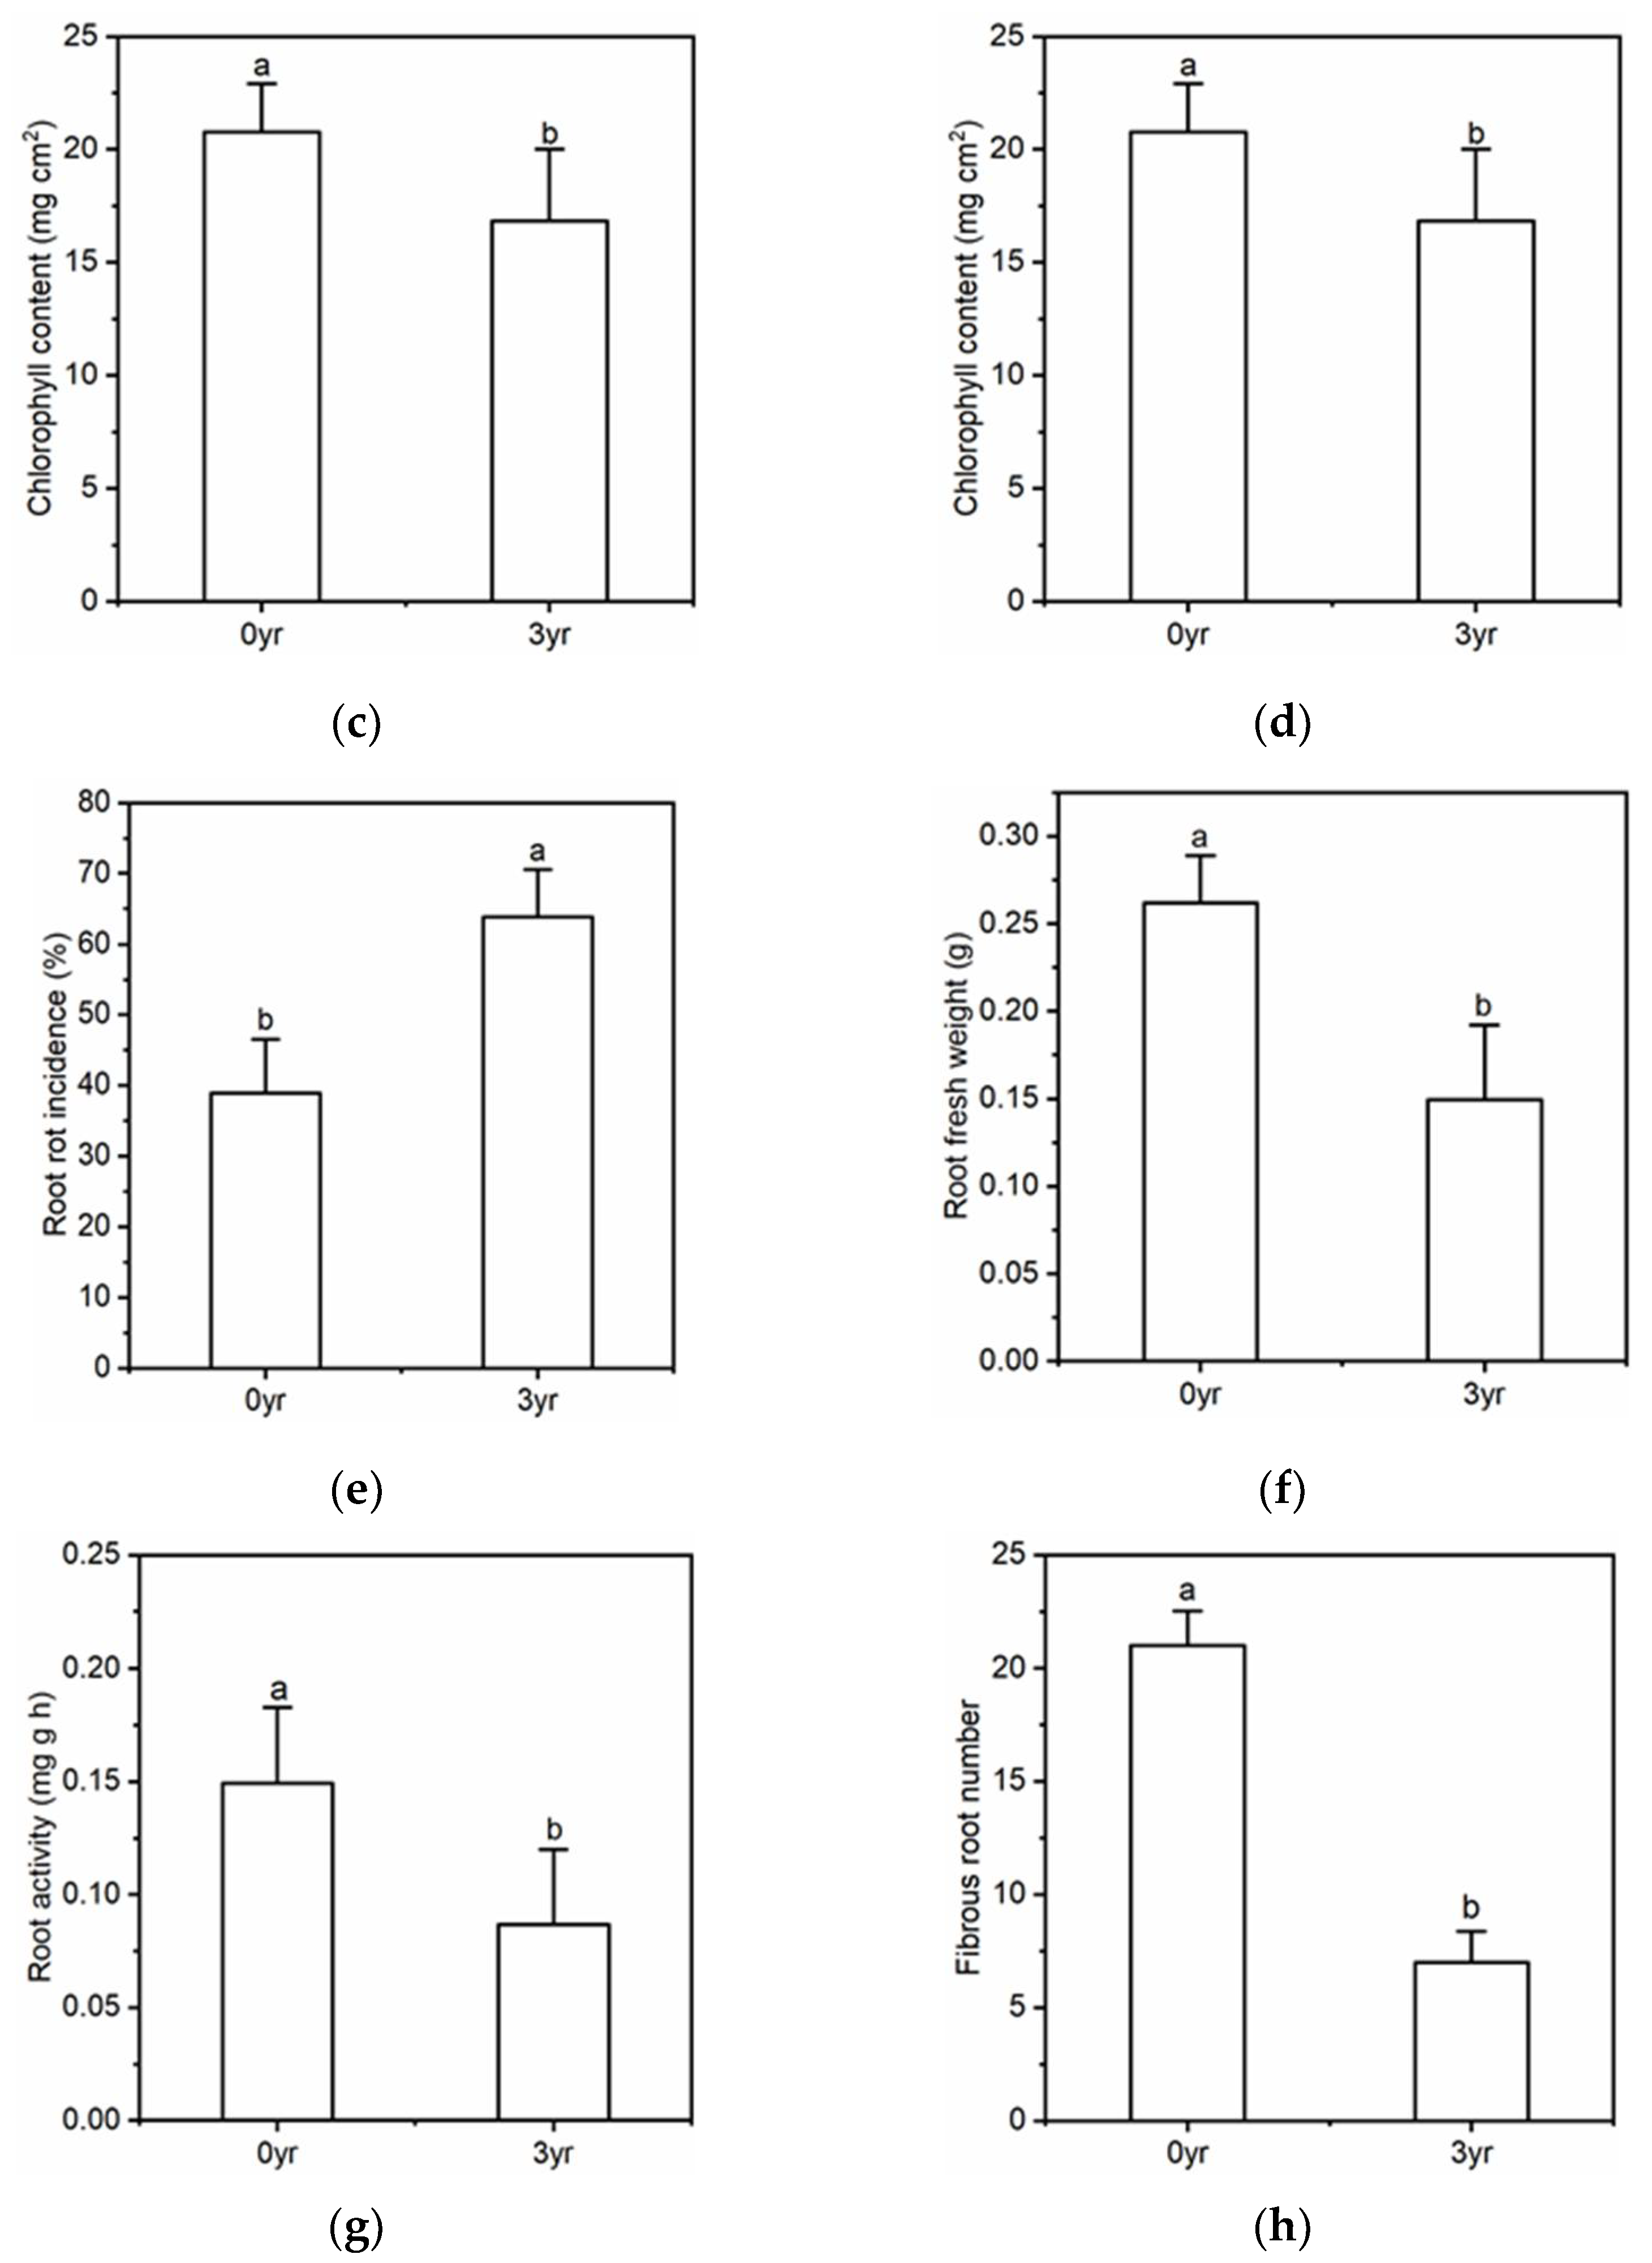
Figure 2. The effect of soil with different monoculture
history on the growth of American ginseng.
Germination rate510.374
Plant height54.5680.099
Chlorophyll content53.1850.015
Root rot incidence51.373<0.01
Root fresh weight514.6080.019
Root activity55.064<0.01
Fibrous root numbers554.2260.018
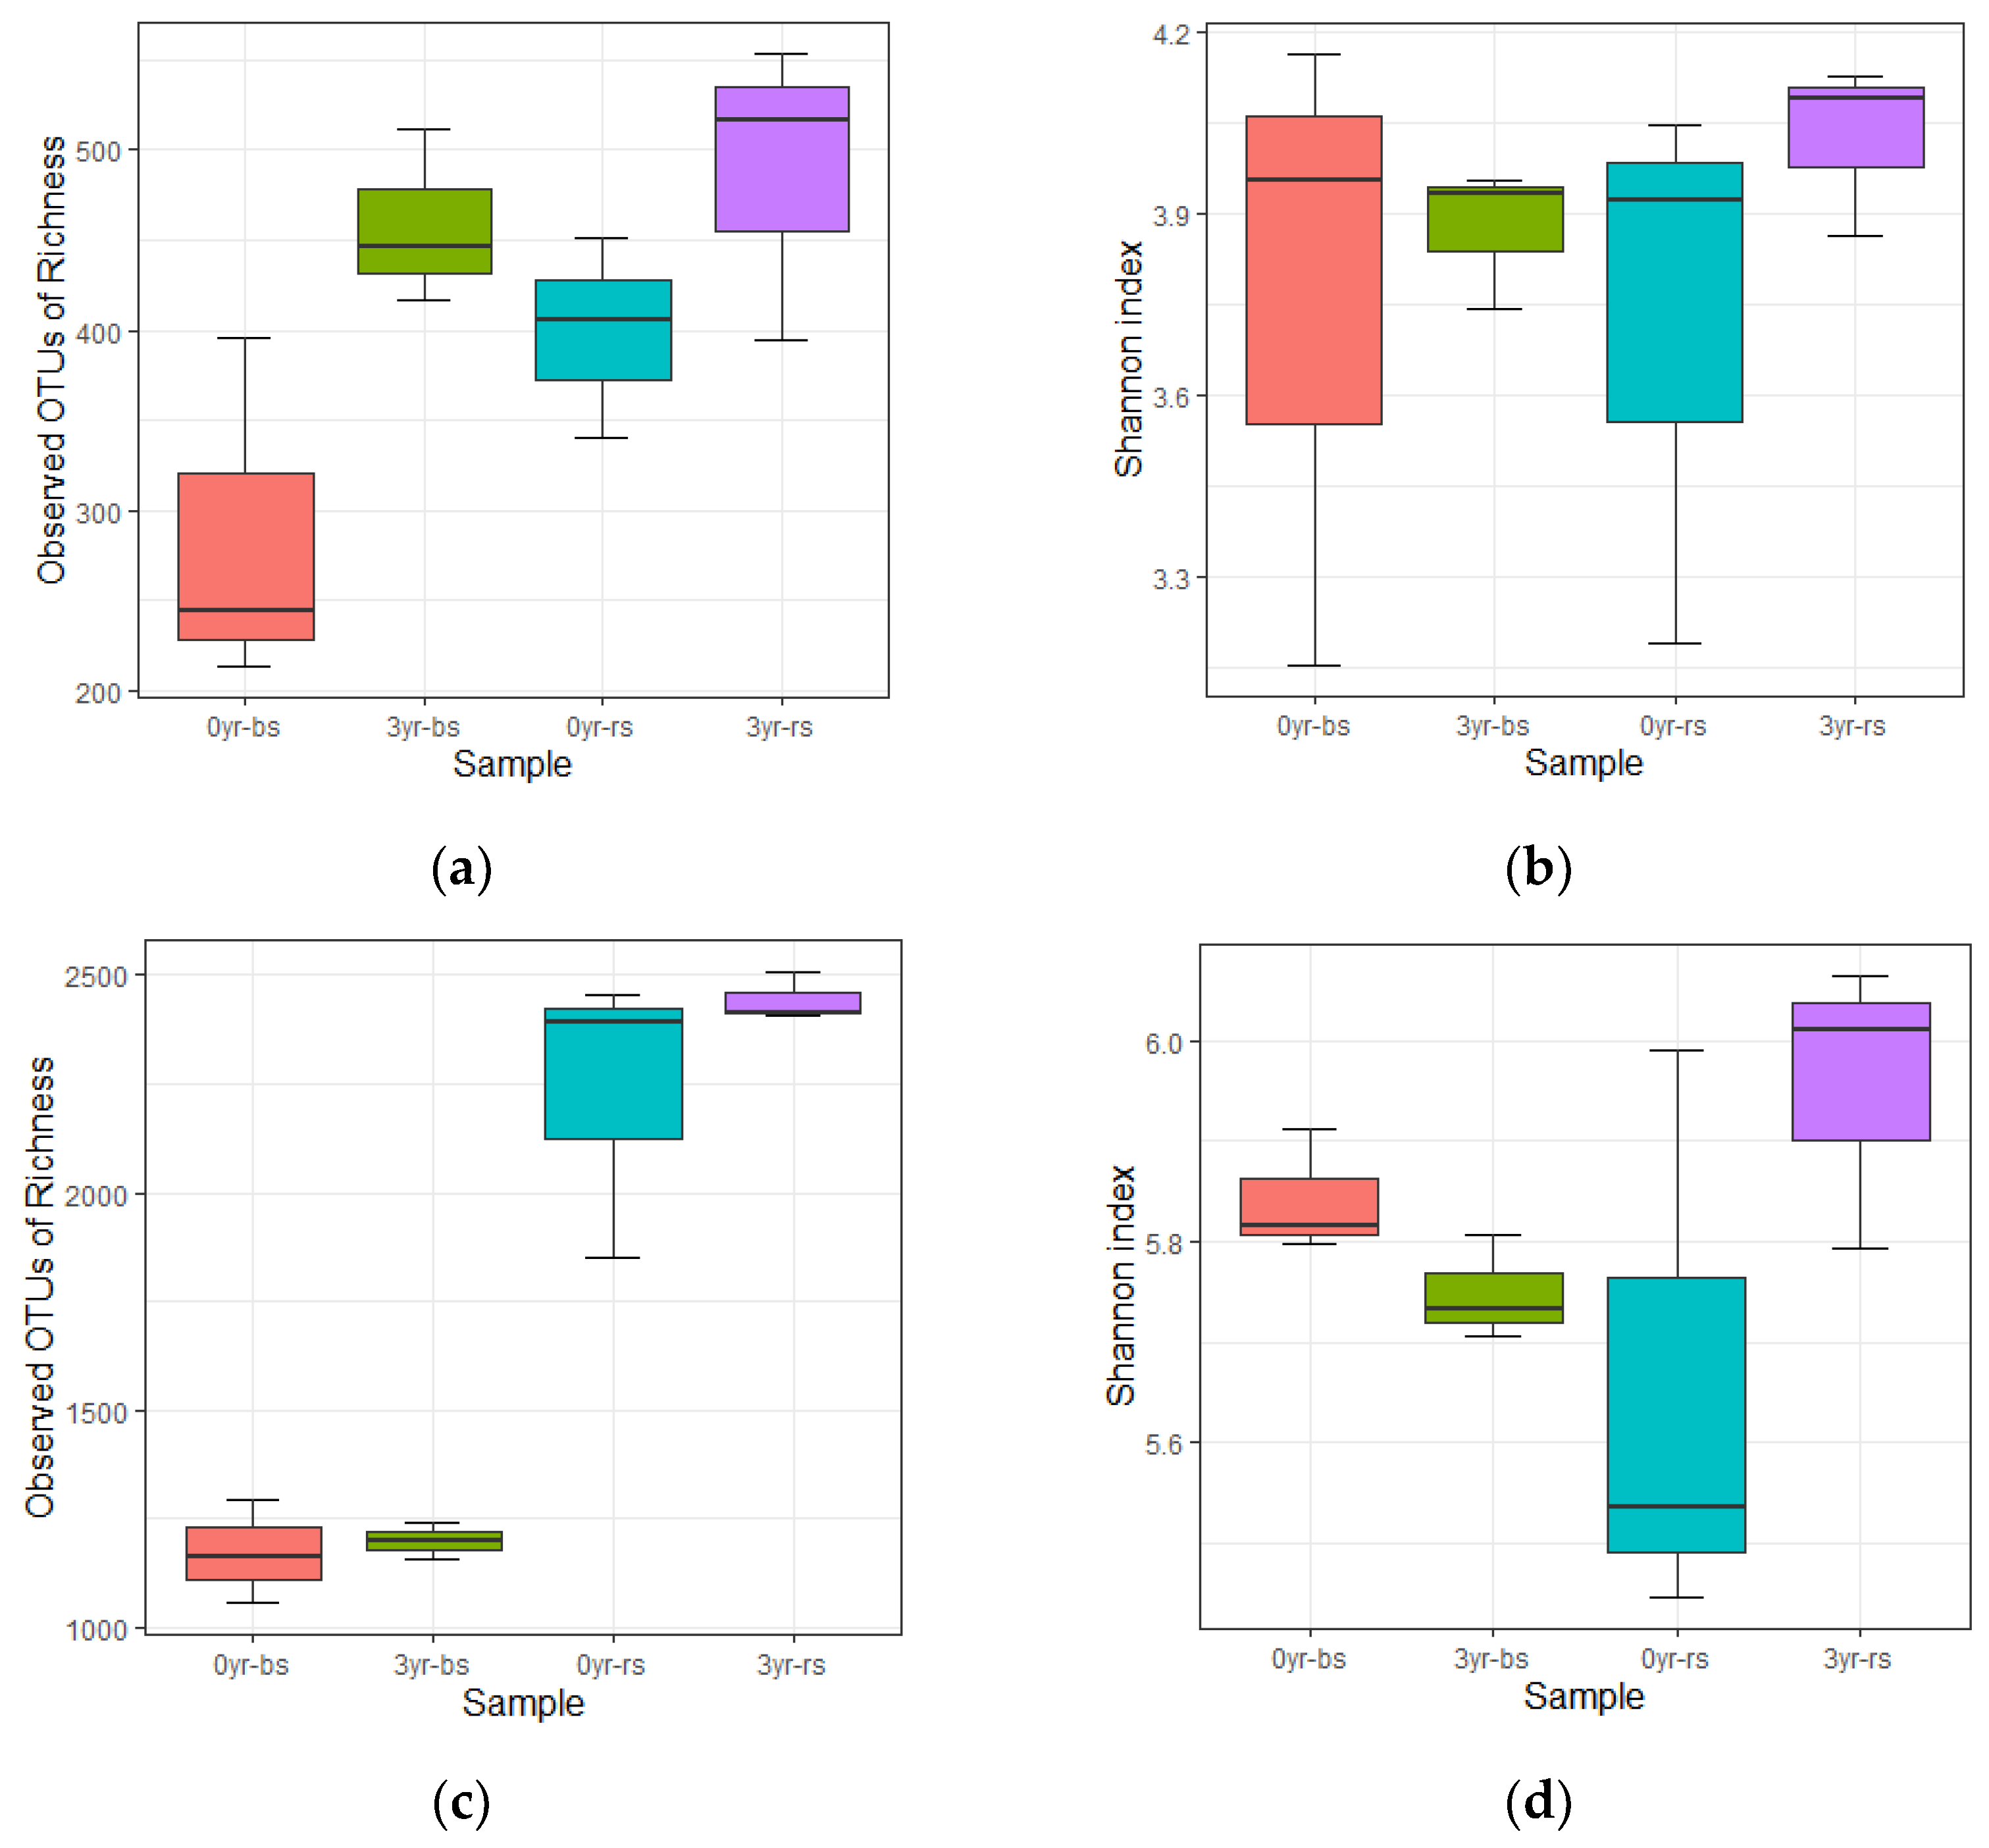
Figure 3. Microbiome diversity in bulk soil and American
ginseng rhizosphere when grown in soils with different monoculture history.
Fungal OTUs114.4410.041
Fungal Shannon110.4320.736
Bacterial OTUs1142.157<0.01
Bacterial Shannon115.750.023
Table A2. The number of reads filtered from the ITS gene.
Sample IDRawAfter Quality ControlAnnotated as Fungi
0 yr-bs161,23361,14155,637
0 yr-bs223,96323,70721,277
0 yr-bs345,56245,42138,851
3 yr-bs147,81947,75343,188
3 yr-bs263,15463,09756,345
3 yr-bs350,59150,49944,698
0 yr-rs161,84361,83528,026
0 yr-rs242,74642,74121,609
0 yr-rs357,47257,4719697
3 yr-rs161,94061,92641,707
3 yr-rs257,76857,75438,278
3 yr-rs347,37847,37114,066

References

  1. Qi, L.W.; Wang, C.Z.; Yuan, C.S. Ginsenosides from American ginsen: Chemical and pharmacological diversity. Phytochemistry 2011, 72, 689–699. [Google Scholar] [CrossRef] [PubMed] [Green Version]
  2. Wang, J.; Wang, S.; Ge, X.; Zhang, M. Authentication of American ginsen (Panax quinquefolius L.) from different origins by linear discriminant analysis of multi-elements. Eur. Food Res. Technol. 2021, 247, 2657–2666. [Google Scholar] [CrossRef]
  3. Manici, L.M.; Kelderer, M.; Franke-Whittle, I.H.; Rühmer, T.; Baab, G.; Nicoletti, F.; Caputo, F.; Topp, A.; Insam, H.; Naef, A. Relationship between root-endophytic microbial communities and replant disease in specialized apple growing areas in Europe. Appl. Soil Ecol. 2013, 72, 207–214. [Google Scholar] [CrossRef]
  4. Tan, Y.; Cui, Y.; Li, H.; Kuang, A.; Li, X.; Wei, Y.; Ji, X. Rhizospheric soil and root endogenous fungal diversity and composition in response to continuous Panax notoginseng cropping practices. Microbiol. Res. 2017, 194, 10–19. [Google Scholar] [CrossRef] [PubMed]
  5. Wolińska, A.; Kruczyńska, A.; Podlewski, J.; Słomczewski, A.; Grządziel, J.; Gałązka, A.; Kuźniar, A. Does the use of an intercropping mixture really improve the biology of monocultural soils & mdash; a search for bacterial indicators of sensitivity and resistance to long-term maize monoculture. Agronomy 2022, 12, 613. [Google Scholar]
  6. Cui, J.; Zhang, E.; Zhang, X.; Wang, Q.; Liu, Q. Effects of 2,4-di-tert-butylphenol at different concentrations on soil functionality and microbial community structure in the Lanzhou lily rhizosphere. Appl. Soil Ecol. 2022, 172, 104367. [Google Scholar] [CrossRef]
  7. Huang, L.F.; Song, L.X.; Xia, X.J.; Mao, W.H.; Shi, K.; Zhou, Y.H.; Yu, J.Q. Plant-Soil feedbacks and soil sickness: From mechanisms to application in agriculture. J. Chem. Ecol. 2013, 39, 232–242. [Google Scholar] [CrossRef]
  8. Chen, S.; Yu, H.; Zhou, X.; Wu, F. Cucumber (Cucumis sativus L.) seedling rhizosphere Trichoderma and Fusarium spp. communities altered by vanillic acid. Front. Microbiol. 2018, 9, 2195. [Google Scholar] [CrossRef] [Green Version]
  9. Tian, G.L.; Bi, Y.M.; Cheng, J.D.; Zhang, F.F.; Zhou, T.H.; Sun, Z.J.; Zhang, L.S. High concentration of ferulic acid in rhizosphere soil accounts for the occurrence of Fusarium wilt during the seedling stages of strawberry plants. Physiol. Mol. Plant Pathol. 2019, 108, 101435. [Google Scholar] [CrossRef]
  10. Xin, A.; Li, X.; Jin, H.; Yang, X.; Zhao, R.; Liu, J.; Qin, B. The accumulation of reactive oxygen species in root tips caused by autotoxic allelochemicals—A significant factor for replant problem of Angelica sinensis (Oliv.) Diels. Ind. Crops Prod. 2019, 138, 111432. [Google Scholar] [CrossRef]
  11. Zhou, X.; Yu, G.; Wu, F. Responses of soil microbial communities in the rhizosphere of cucumber (Cucumis sativus L.) to exogenously applied p-hydroxybenzoic acid. J. Chem. Ecol. 2012, 38, 975–983. [Google Scholar] [CrossRef] [PubMed]
  12. Wu, H.S.; Shen, S.H.; Han, J.M.; Liu, Y.D.; Liu, S.D. The effect in vitro of exogenously applied p-hydroxybenzoic acid on Fusarium oxysporum f. sp. niveum. Phytopathol. Mediterr. 2009, 48, 439–446. [Google Scholar]
  13. Ray, S.; Mishra, S.; Bisen, K.; Singh, S.; Sarma, B.K.; Singh, H.B. Modulation in phenolic root exudate profile of Abelmoschus esculentus expressing activation of defense pathway. Microbiol. Res. 2018, 207, 100. [Google Scholar] [CrossRef] [PubMed]
  14. Badri, D.V.; Chaparro, J.M.; Zhang, R.; Shen, Q.; Vivanco, J.M. Application of natural blends of phytochemicals derived from the root exudates of Arabidopsisto the soil reveal that phenolic-related compounds predominantly modulate the soil microbiome. J. Biol. Chem. 2013, 288, 4502–4512. [Google Scholar] [CrossRef] [Green Version]
  15. Zwetsloot, M.J.; Kessler, A.; Bauerle, T.L. Phenolic root exudate and tissue compounds vary widely among temperate forest tree species and have contrasting effects on soil microbial respiration. New Phytol. 2018, 218, 530–541. [Google Scholar] [CrossRef] [Green Version]
  16. Chen, J.; Gong, J.; Xu, M. Implications of continuous and rotational cropping practices on soil bacterial communities in pineapple cultivation. Eur. J. Soil Biol. 2020, 97, 103172. [Google Scholar] [CrossRef]
  17. Li, L.; Yao, Y.F.; Qin, F.C. Spatial variability of soil total nitrogen, available phosphorus and available potassium in huanghuadianzi watershed. Chin. J. Ecol. 2015, 34, 373–379. [Google Scholar]
  18. Bilias, F.; Barbayiannis, N. Potassium availability: An approach using thermodynamic parameters derived from quantity-intensity relationships. Geoderma 2019, 338, 355–364. [Google Scholar] [CrossRef]
  19. Roberts, T.; Ross, W.; Norman, R.; Slaton, N.; Wilson, C. Predicting nitrogen fertilizer needs for rice in arkansas using Alkaline Hydrolyzable-Nitrogen. Soil Sci. Soc. Am. J. 2011, 75, 1161. [Google Scholar] [CrossRef]
  20. Swift, R.S. Organic Matter Characterization, Methods of Soil Analysis; Part 3; Chemical Methods; Soil Science Society of America: Madison, WI, USA, 1996; pp. 1011–1070. [Google Scholar] [CrossRef]
  21. Wu, L.; Jie, L.; Wang, W.; Dai, D.; Cheng, X.; Zhang, Z.; Yang, Y. Identification and content determination of phenolic acids of rhizosphere soil of Panax Notoginseng. Mod. Tradit. Chin. Med. Mater. Med.-World Sci. Technol. 2014, 12, 825–829. [Google Scholar] [CrossRef]
  22. Chen, M.; Xie, L.; FU, Z.; Zou, J. Comparison of two methods for measurement of phytoplanktonic chlorophyll-a. Environ. Monit. Manag. Technol. 2016, 28, 46–48. [Google Scholar]
  23. Zhu, X.; Liang, M.; Ma, Y. A review report on the experiments for the determination of root activity by TTC Method. Guangdong Chem. Ind. 2020, 47, 211–212. [Google Scholar]
  24. Li, J.; Philp, J.; Li, J.; Wei, Y.; Li, H.; Yang, K.; Ryder, M.; Toh, R.; Zhou, Y.; Denton, M.; et al. Trichoderma harzianum inoculation reduces the incidence of clubroot disease in Chinese cabbage by regulating the rhizosphere microbial community. Microorganisms 2020, 8, 1325. [Google Scholar] [CrossRef] [PubMed]
  25. Durairaj, K.; Velmurugan, P.; Park, J.H.; Chang, W.S.; Park, Y.J.; Senthilkumar, P.; Choi, K.M.; Lee, J.H.; Oh, B.T. An investigation of biocontrol activity pseudomonas and bacillus strains against Panax ginseng root rot fungal phytopathogens. Biol. Control 2018, 125, 138–146. [Google Scholar] [CrossRef]
  26. Yao, C.Z.; Jiang, Y.T.; Yang, Y.T.; Ma, Y.Y.; Pan, L.I.; Li, Y.I.; Sun, Y.Q.; Chen, J.; Zhao, J. Allelopathic effect of extracts from Panax notoginseng mono-cropped soil on its root rot pathogens. Chin. J. Appl. Ecol. 2020, 31, 2227–2235. [Google Scholar] [CrossRef]
  27. Bruce Williamson, G.; Richardson, D. Bioassays for allelopathy: Measuring treatment responses with independent controls. J. Chem. Ecol. 1988, 14, 181–187. [Google Scholar] [CrossRef]
  28. Schloss, P.D.; Westcott, S.L.; Ryabin, T.; Hall, J.R.; Hartmann, M.; Hollister, E.B.; Lesniewski, R.A.; Oakley, B.B.; Parks, D.H.; Robinson, C.J.; et al. Introducing mothur: Open-source, platform-independent, community-supported software for describing and comparing microbial communities. Appl. Environ. Microbiol. 2009, 75, 7537–7541. [Google Scholar] [CrossRef] [Green Version]
  29. Kõljalg, U.; Nilsson, R.H.; Abarenkov, K.; Tedersoo, L.; Taylor, A.F.; Bahram, M.; Bates, S.T.; Bruns, T.D.; Bengtsson-Palme, J.; Callaghan, T.M.; et al. Towards a unified paradigm for sequence-based identification of fungi. Mol. Ecol. 2013, 22, 5271–5277. [Google Scholar] [CrossRef] [Green Version]
  30. Benitez, M.S.; Ewing, P.M.; Osborne, S.L.; Lehman, R.M. Rhizosphere microbial communities explain positive effects of diverse crop rotations on maize and soybean performance. Soil Biol. Biochem. 2021, 159, 108309. [Google Scholar] [CrossRef]
  31. Dong, L.; Xu, J.; Zhang, L.; Yang, J.; Liao, B.; Li, X.; Chen, S. High-throughput sequencing technology reveals that continuous cropping of American ginseng results in changes in the microbial community in arable soil. Chin. Med. 2017, 12, 18. [Google Scholar] [CrossRef] [Green Version]
  32. Ji, L.; Tian, L.; Nasir, F.; Chang, J.; Chang, C.; Zhang, J.; Li, X.; Tian, C. Impacts of replanting American ginseng on fungal assembly and abundance in response to disease outbreaks. Arch. Microbiol. 2021, 203, 2157–2170. [Google Scholar] [CrossRef] [PubMed]
  33. Li, X.G.; Ding, C.F.; Hua, K.; Zhang, T.I.; Zhang, Y.N.; Zhao, L.; Yang, Y.R.; Liu, J.G.; Wang, X.X. Soil sickness of peanuts is attributable to modifications in soil microbes induced by peanut root exudates rather than to direct allelopathy. Soil Biol. Biochem. 2014, 78, 149–159. [Google Scholar] [CrossRef]
  34. Nicol, R.W.; Yousef, L.; Traquair, J.A.; Bernards, M.A. Ginsenosides stimulate the growth of soilborne pathogens of American ginseng. Phytochemistry 2003, 64, 257–264. [Google Scholar] [CrossRef]
  35. Inderjit; Streibig, J.C.; Olofsdotter, M. Joint action of phenolic acid mixtures and its significance in allelopathy research. Physiol. Plant 2002, 114, 422–428. [Google Scholar] [CrossRef]
  36. Cecile, B.; Yang, X.H.; Weston, L.A. The role of root exudates and allelochemicals in the rhizosphere. Plant Soil 2003, 256, 67–83. [Google Scholar] [CrossRef]
  37. Aparicio, V.; Costa, J.L. Soil quality indicators under continuous cropping systems in the Argentinean Pampas. Soil Tillage Res. 2007, 96, 155–165. [Google Scholar] [CrossRef]
  38. Zhang, X.; Lang, D.; Zhang, E.; Wang, Z. Effect of autotoxicity and soil microbes in continuous cropping soil on Angelica sinensis seedling growth and rhizosphere soil microbial population. Chin. Herb. Med. 2015, 7, 88–93. [Google Scholar] [CrossRef]
  39. Zhang, H.; Yang, Y.; Mei, X.; Li, Y.; Wu, J.; Li, Y.; Wang, H.; Huang, H.; Yang, M.; He, X.; et al. Phenolic acids released in maize rhizosphere during maize-soybean intercropping inhibit Phytophthora blight of soybean. Front. Plant Sci. 2020, 11, 886. [Google Scholar] [CrossRef]
  40. Chung, I.-M.; Lim, J.-J.; Ahn, M.-S.; Jeong, H.-N.; An, T.-J.; Kim, S.-H. Comparative phenolic compound profiles and antioxidative activity of the fruit, leaves, and roots of Korean ginseng (Panax ginseng Meyer) according to cultivation years. J. Ginseng Res. 2016, 40, 68–75. [Google Scholar] [CrossRef] [Green Version]
Figure 1. Content of phenolic acids extracted from soils with different monoculture history of American ginseng. 0 yr: no growing history, 1 yr: 1-year monoculture, 2 yr: 2-year monoculture, 3 yr: 3-year monoculture. Bars: standard error of the mean (n = 3); different letters and the asterisk indicate significant differences in total concentration according to one-way ANOVA analysis (p < 0.05). The detailed information of the ANOVA results are shown in Table A1.
Agriculture 12 00640 g001
Figure 2. The effects of soil with different monoculture history on the growth of American ginseng: germination rate (a); plant height (b); leaf chlorophyll content (c); root morphology (d); incidence of root rot (e); root fresh weight (f); root activity (g); numbers of fibrous root (h); 0 yr: no growing history; 3 yr: 3-year monoculture. Bar: standard error of the mean (n = 3); different letters represent significant differences according to one-way ANOVA analysis (p < 0.05). The detailed information of the ANOVA results are shown in Table A1.
Agriculture 12 00640 g002aAgriculture 12 00640 g002b
Figure 3. Fungal and bacterial OTU richness and Shannon index of American ginseng rhizosphere when grown in soils with different monoculture history: fungal OTU richness (a); fungal Shannon index (b); bacterial OTU richness (c); bacterial Shannon index (d); 0 yr-bs: bulk soil with no American ginseng growing history; 3 yr-bs: bulk soil with 3-year monoculture; 0 yr-rs: rhizosphere in the soil with no American ginseng growing history; 3 yr-rs: rhizosphere in the soil with 3-year monoculture. The detailed information of the ANOVA results are shown in Table A1.
Agriculture 12 00640 g003
Figure 4. Principal component analysis of American ginseng rhizosphere when grown in soils with different monoculture history for fungi (a) and bacteria (b); 0 yr-bs: bulk soil with no American ginseng growing history; 3 yr-bs: bulk soil with 3-year monoculture; 0 yr-rs: rhizosphere in the soil with no American ginseng growing history; 3 yr-rs: rhizosphere in the soil with 3-year monoculture.
Agriculture 12 00640 g004
Figure 5. The relative abundance of the main fungal and bacterial groups present in the American ginseng rhizosphere when grown in soils with different monoculture history, at the phylum level and the genus level: (a,b) are fungi, (c,d) are bacteria. Only the top ten phyla and genera in relative abundance are displayed. 0 yr-bs: bulk soil with no American ginseng growing history; 3 yr-bs: bulk soil with 3-year monoculture; 0 yr-rs: rhizosphere in the soil with no American ginseng growing history; 3 yr-rs: rhizosphere in the soil with 3-year monoculture.
Agriculture 12 00640 g005
Figure 6. Phylogenetic dendrogram of biomarkers of the American ginseng rhizosphere when grown in soils with different monoculture history including bulk soil (a) and rhizosphere (b). 0 yr-bs: bulk soil with no American ginseng growing history; 3 yr-bs: bulk soil with 3-year monoculture; 0 yr-rs: rhizosphere in the soil with no American ginseng growing history; 3 yr-rs: rhizosphere in the soil with 3-year monoculture. Only biomarkers with LDA > 3.8 are displayed (Kruskal–Wallis rank-sum test, p < 0.05).
Agriculture 12 00640 g006
Table 1. The physical and chemical properties of the soils with different monoculture history of American ginseng.
Characteristics0 yr1 yr2 yr3 yr
OM (g kg−1)22.77 ± 2.88 a21.50 ± 0.92 a21.60 ± 0 a19.33 ± 0.95 a
TN (g kg−1)1.63 ± 0.08 a1.57 ± 0.08 a1.48 ± 0.05 a1.49 ± 0.07 a
AN (mg kg−1)189.33 ± 0.58 b177.67 ± 2.52 ba184.00 ± 1.73 ba191.67 ± 1.53 a
TP (g kg−1)0.60 ± 0.07 a0.51 ± 0.34 a0.49 ± 0.01 b0.57 ± 0.03 a
AP (mg kg−1)115.67 ± 1.15 a96.40 ± 0.82 b115.33 ± 1.54 a114.33 ± 2.52 a
TK (g kg−1)19.20 ± 0.79 a19.63 ± 0.76 a19.03 ± 0.29 a20.50 ± 0.75 a
AK (g kg−1)0.14 ± 0.01 a0.16 ± 0.01 a0.11 ± 0.01 b0.15 ± 0.01 a
Organic matter: OM, total nitrogen: TN, alkali-hydrolyzable nitrogen: AN, total phosphorus: TP, available phosphorus: AP, total potassium: TK, available potassium: AK. Data are presented as mean ± standard error (n = 3); different letters in each row indicate statistically significant differences according to one-way ANOVA analysis (p < 0.05). The detailed information of the ANOVA results are shown in Table A1.
Table 2. The effect of phenolic acid concentrations on the growth of American ginseng pathogens.
Concentration (mg L−1)Fusarium
Solani
Cylindrocarpon DestructansRhizoctonia SolaniFusarium
Oxysporum
RI%RI%RI%RI%
2.59.75 ± 0.06 a5.23 ± 0.02 a4.79 ± 0.02 a−3.45 ± 0 a
5.08.58 ± 0.04 a2.67 ± 0.02 a5.51 ± 0.05 a−3.45 ± 0 a
107.31 ± 0.02 a3.90 ± 0.04 a10.68 ± 0.04 a−6.90 ± 0.03 a
50−12.70 ± 0.07 b−13.89 ± 0.02 b−11.11 ± 0.05 b−22.99 ± 0.02 b
Data are presented as mean ± standard error (n = 3); different letters in each row indicate statistically significant differences according to one-way ANOVA analysis (p < 0.05). RI is response index, and RI < 0 indicates suppressing pathogen growth. The detailed information of the ANOVA results are shown in Table A1.
Table 3. The effect of soil extracts on the growth of American ginseng pathogens.
Ratio
(Methanol:Soil)
Fusarium SolaniCylindrocarpon DestructansRhizoctonia SolaniFusarium
Oxysporum
RI%RI%RI%RI%
2:111.94 ± 0.04 a13.72 ± 0.03 b28.97 ± 0.02 a5.35 ± 0.03 a
5:17.30 ± 0.04 b22.58 ± 0.05 a26.17 ± 0.02 a5.42 ± 0.03 a
Data are presented as mean ± standard error (n = 3); different letters in each column indicate statistically significant differences according to one-way ANOVA analysis (p < 0.05). RI is response index between the soils with 3-year monoculture and no growing history, and RI > 0 indicates promoting pathogen growth in the 3-year monoculture soil compared with soils with no American ginseng growing history. The detailed information of the ANOVA results are shown in Table A1.
Publisher’s Note: MDPI stays neutral with regard to jurisdictional claims in published maps and institutional affiliations.

