Article

Environmental Impact Analysis of Natural Cork Stopper Manufacturing

by
Francisco Javier Flor-Montalvo
1,*,
Eduardo Martínez-Cámara
2,
Jorge Luis García-Alcaraz
3,
Emilio Jiménez-Macías
4,
Juan-Ignacio Latorre-Biel
5 and
Julio Blanco-Fernández
2
1
Higher School of Engineering and Technology, International University of La Rioja (UNIR), 26004 Logroño, La Rioja, Spain
2
Department of Mechanical Engineering, University of La Rioja, 26004 Logroño, La Rioja, Spain
3
Department of Industrial and Manufacturing Engineering, Autonomous University of Ciudad Juarez, Ciudad Juárez 32315, Mexico
4
Department of Electrical Engineering, University of La Rioja, 26004 Logroño, La Rioja, Spain
5
Department of Mechanical Engineering, Public University of Navarra, Av de Tarazona s/n, 31500 Tudela, Navarra, Spain
*
Author to whom correspondence should be addressed.
Agriculture 2022, 12(5), 636; https://doi.org/10.3390/agriculture12050636
Submission received: 23 February 2022 / Revised: 25 April 2022 / Accepted: 26 April 2022 / Published: 28 April 2022

Abstract

:
For both wine makers and customers, natural cork stoppers are a symbol of quality. Moreover, they are essential for maintaining the organoleptic properties of bottled wines throughout their lifespan. This research relied on the life-cycle assessment (LCA) methodology to analyze the relationship between the efficient usage of cork planks and the environmental impact of the cork stopper manufacturing industry. The goals of this research were to analyze and determine the environmental impact of producing 1 kg of natural cork stoppers. The analysis considered cork stoppers of two sizes—24 × 44 mm and 26 × 44 mm—and two manufacturing methods—punching and turning. Our findings indicated that the 24 × 44 mm cork stoppers produced with the punching method had a slightly lower environmental impact (1.36 kg CO2 eq/kg) across the ten analyzed impact categories. Conversely, 26 × 44 mm turned corks had the highest impact on the environment (1.49 kg CO2 eq/kg). Additionally, a comparison of same-sized punched and turned cork stoppers showed that the former had a lower environmental impact. This phenomenon is directly related to plank usage. In conclusion, there is a clear relationship between environmental impact and the efficient usage of raw material. In turn, an efficient usage of raw material depends on both the manufacturing method and stopper size.

1. Introduction

1.1. Cork and Wine

Cork is a non-wood product material primarily obtained from Quercus suber—also known as the cork oak tree, which is endemic to Europe and North Africa. Top cork manufacturers include Portugal, Spain, Algeria, Morocco, Italy, France, and Tunisia [1]. According to Spain’s National Institute of Statistics (INE, by its Spanish acronym), cork production in Spain surged to 60,431.51 tons in 2016 [2].
Cork quality depends on the quality of the bark of the tree. Cork’s properties make it suitable as a material for a wide range of every-day products, including handbags, decorations, toys, acoustic instruments, and insulation materials. In fact, cork’s microstructure and low density make it a near-impermeable and stable thermoacoustic insulator [3]. Additionally, cork is used in bio-absorbent technologies and energy-absorbing technologies within the space industry. Finally, since ancient times, cork has been widely used to manufacture bottle stoppers.
Nowadays, food products for human consumption are required to comply with special and strict quality, safety, and environmental regulations. Cork stoppers are a fundamental part of the wine industry; they play a crucial role in the closure of sparkling and still wines. However, in recent years, alternative wine closures have gained popularity over traditional natural closures, particularly due to their economic and organoleptic advantages.
In the wine-making process, cork stoppers are important at the bottling stage. Due to their elasticity, cork stoppers exert pressure against the glass surface and form an excellent seal without causing any damage to wine bottles. Moreover, cork stoppers allow oxygen to slightly ingress into the bottle, thus having a positive impact on wine aging [4]. From this perspective, the quality of cork stoppers is highly important for both young and aged wines and helps them preserve their organoleptic properties.
Despite their remarkable advantages, cork stoppers also have certain drawbacks. For instance, cork causes cork taint, which is one of the most frequent organoleptic defects in wines. Cork taint is caused by chemical compounds—chiefly trichloroanisole (TCA)—that are present in the cork stopper and are transferred into the wine after bottling [5]. Additionally, cork stoppers can result in excessive gas permeability that causes wine to oxidize and ultimately degrade [6].
Cork is an inherently heterogeneous and buoyant material. Its properties and characteristics chiefly depend on aspects such as geographical location, tree age, cork age (e.g., first harvest and second harvest), and the state of the planks cut out from the trees [7,8]. Common food standards and regulations to be complied with in the cork manufacturing industry include those from the European Council (EC), the International Food Standard (IFS), and the British Retail Consortium (BRC). All these policies serve as tools to audit food manufacturers in terms of the quality and safety assured in their food products. By complying with international food standards, regulations, and norms, food manufacturers can commercialize their products, ensure the quality of their production processes, and guarantee customers safe food products that pose no known health risks.
Cork stoppers are available in many models, thus varying in terms of shape, the type of cork material used, and the production process. All these variables determine the quality, class, and economic value of a cork stopper. The most common types of cork stoppers include multi-piece corks, colmated corks, technical corks, agglomerated corks, the ProCork, T-Corks, champagne corks, the Helix cork, and (most importantly) natural corks. For both wine makers and customers, cork stoppers are a symbol of quality and are essential for maintaining the organoleptic properties of bottled wines throughout their lifespan. In fact, research has proven that wine stoppers manufactured with other materials, such as plastic, cause spillages and may be a source of health risks for consumers [9,10,11].
Natural cork stoppers are directly manufactured from the cork material (raw material), which makes them 100% natural, as the name suggests. Additional characteristics that make natural cork stoppers ideal for wine closure include color, density, elasticity, porosity, and the absence of alterations [12,13,14]. In the Spanish industry, cork material is visually classified into nine quality grades based on two important criteria: thickness (one layer = 2.25 mm) and appearance (the presence or absence of alterations). Additionally, natural cork stoppers can be classified according to their dimensions. For instance, cork stoppers manufactured under the Spanish UNE 56921/2020 norms can be of four possible sizes: 44 × 24 mm, 46 × 24 mm, 49 × 24 mm, and 54 × 24 mm.
Despite the importance of cork stoppers in the wine industry, few life-cycle assessments (LCA) have been conducted to study the environmental impact of cork stopper manufacturing. In their work, Rives et al. [15] analyzed the environmental impact of raw cork extraction in Spain and determined the carbon dioxide balance of the forestry systems under study, with a tree lifespan of approximately 200 years. Additionally, Rives et al. [16] analyzed the environmental impact of natural cork production, and Rives et al. [17] analyzed cork granule production. From a similar perspective, Demertzi et al. [18] conducted a comprehensive analysis of the environmental impact of the cork stopper supply chain in Portugal and identified the key stages and processes involved in order to suggest both improvement actions and alternative production scenarios.

1.2. Research Context

The goals of this research were to analyze and determine the environmental impact of producing 1 kg of natural cork stoppers. The analysis considered not only the final product (i.e., cork stoppers) but also the co-products and by-products that are generated throughout the production process. Moreover, because cork planks entering factories may vary in visual quality and thickness, it would be impossible to conduct a reliable LCA of cork stopper production without considering both co-products and by-products.
  • Co-Products:
    Thin cork planks (used to manufacture multi-piece corks).
    Thin cork planks (used to manufacture agglomerated corks).
  • By-Products:
    Granules (used to manufacture agglomerated corks).
    Waste from bark and stoppers (used as biomass).
    Sawdust (used to produce colmated corks).
The analysis considered cork stoppers of two sizes—24 × 44 mm and 26 × 44 mm—and two manufacturing methods—punching and turning. Ten lots per cork size and manufacturing methods were analyzed. To have a point of reference, all the lots were manufactured from the same cork plank, which increased the reliability of the results.
It was necessary to consider that the cork diameter selection is made based on the origin and density, among other factors. An enologist determines the closure to control de amount of air in contact with the wine and, consequently, its evolution (it should be considered that the bottle neck size can be the same for a 24 mm and a 26 mm cork; in this case, what changes is the mass amount in the bottle neck; this effect could be achieved in other ways, such as varying the density of the selected cork.).
This research is useful for cork producers and wine makers. The information contained in this study is needed by cork producers because many wine producers demand the carbon footprint of their product to comply with the requirements of wine distributors.

2. Materials and Methods

2.1. Goals and Scope

This research was a gate-to-gate study that used the measures obtained at each stage of the cork stopper production process as its basis. The LCA stages considered in this study ranged from the moment raw cork planks arrive in the manufacturing facilities to the packaging of cork stoppers. At each process stage, the data were directly gathered from the production facilities. The amount of incoming raw material that was used, both in the production process and discarded from it, was recorded. Similarly, aspects such as energy consumption, water consumption, and the use of other production materials were measured. This study allowed us to identify the key operations in the manufacture of natural cork stoppers.
To conduct the analysis, the SimaPro 8.3 software and the baseline V3.04/EU25 CML-IA calculation method were used. Furthermore, ten impact categories were considered: abiotic depletion (AD), global warming (GWP100—GW), ozone layer depletion (OLD), human toxicity (HT), freshwater aquatic ecotoxicity (FWAE), marine aquatic ecotoxicity (MAE), terrestrial ecotoxicity (TE), photochemical oxidation (PO), acidification (AC), and eutrophication (EU).

2.2. Functional Unit

A functional unit was defined as 1 kg of fully processed and packaged natural cork stoppers.

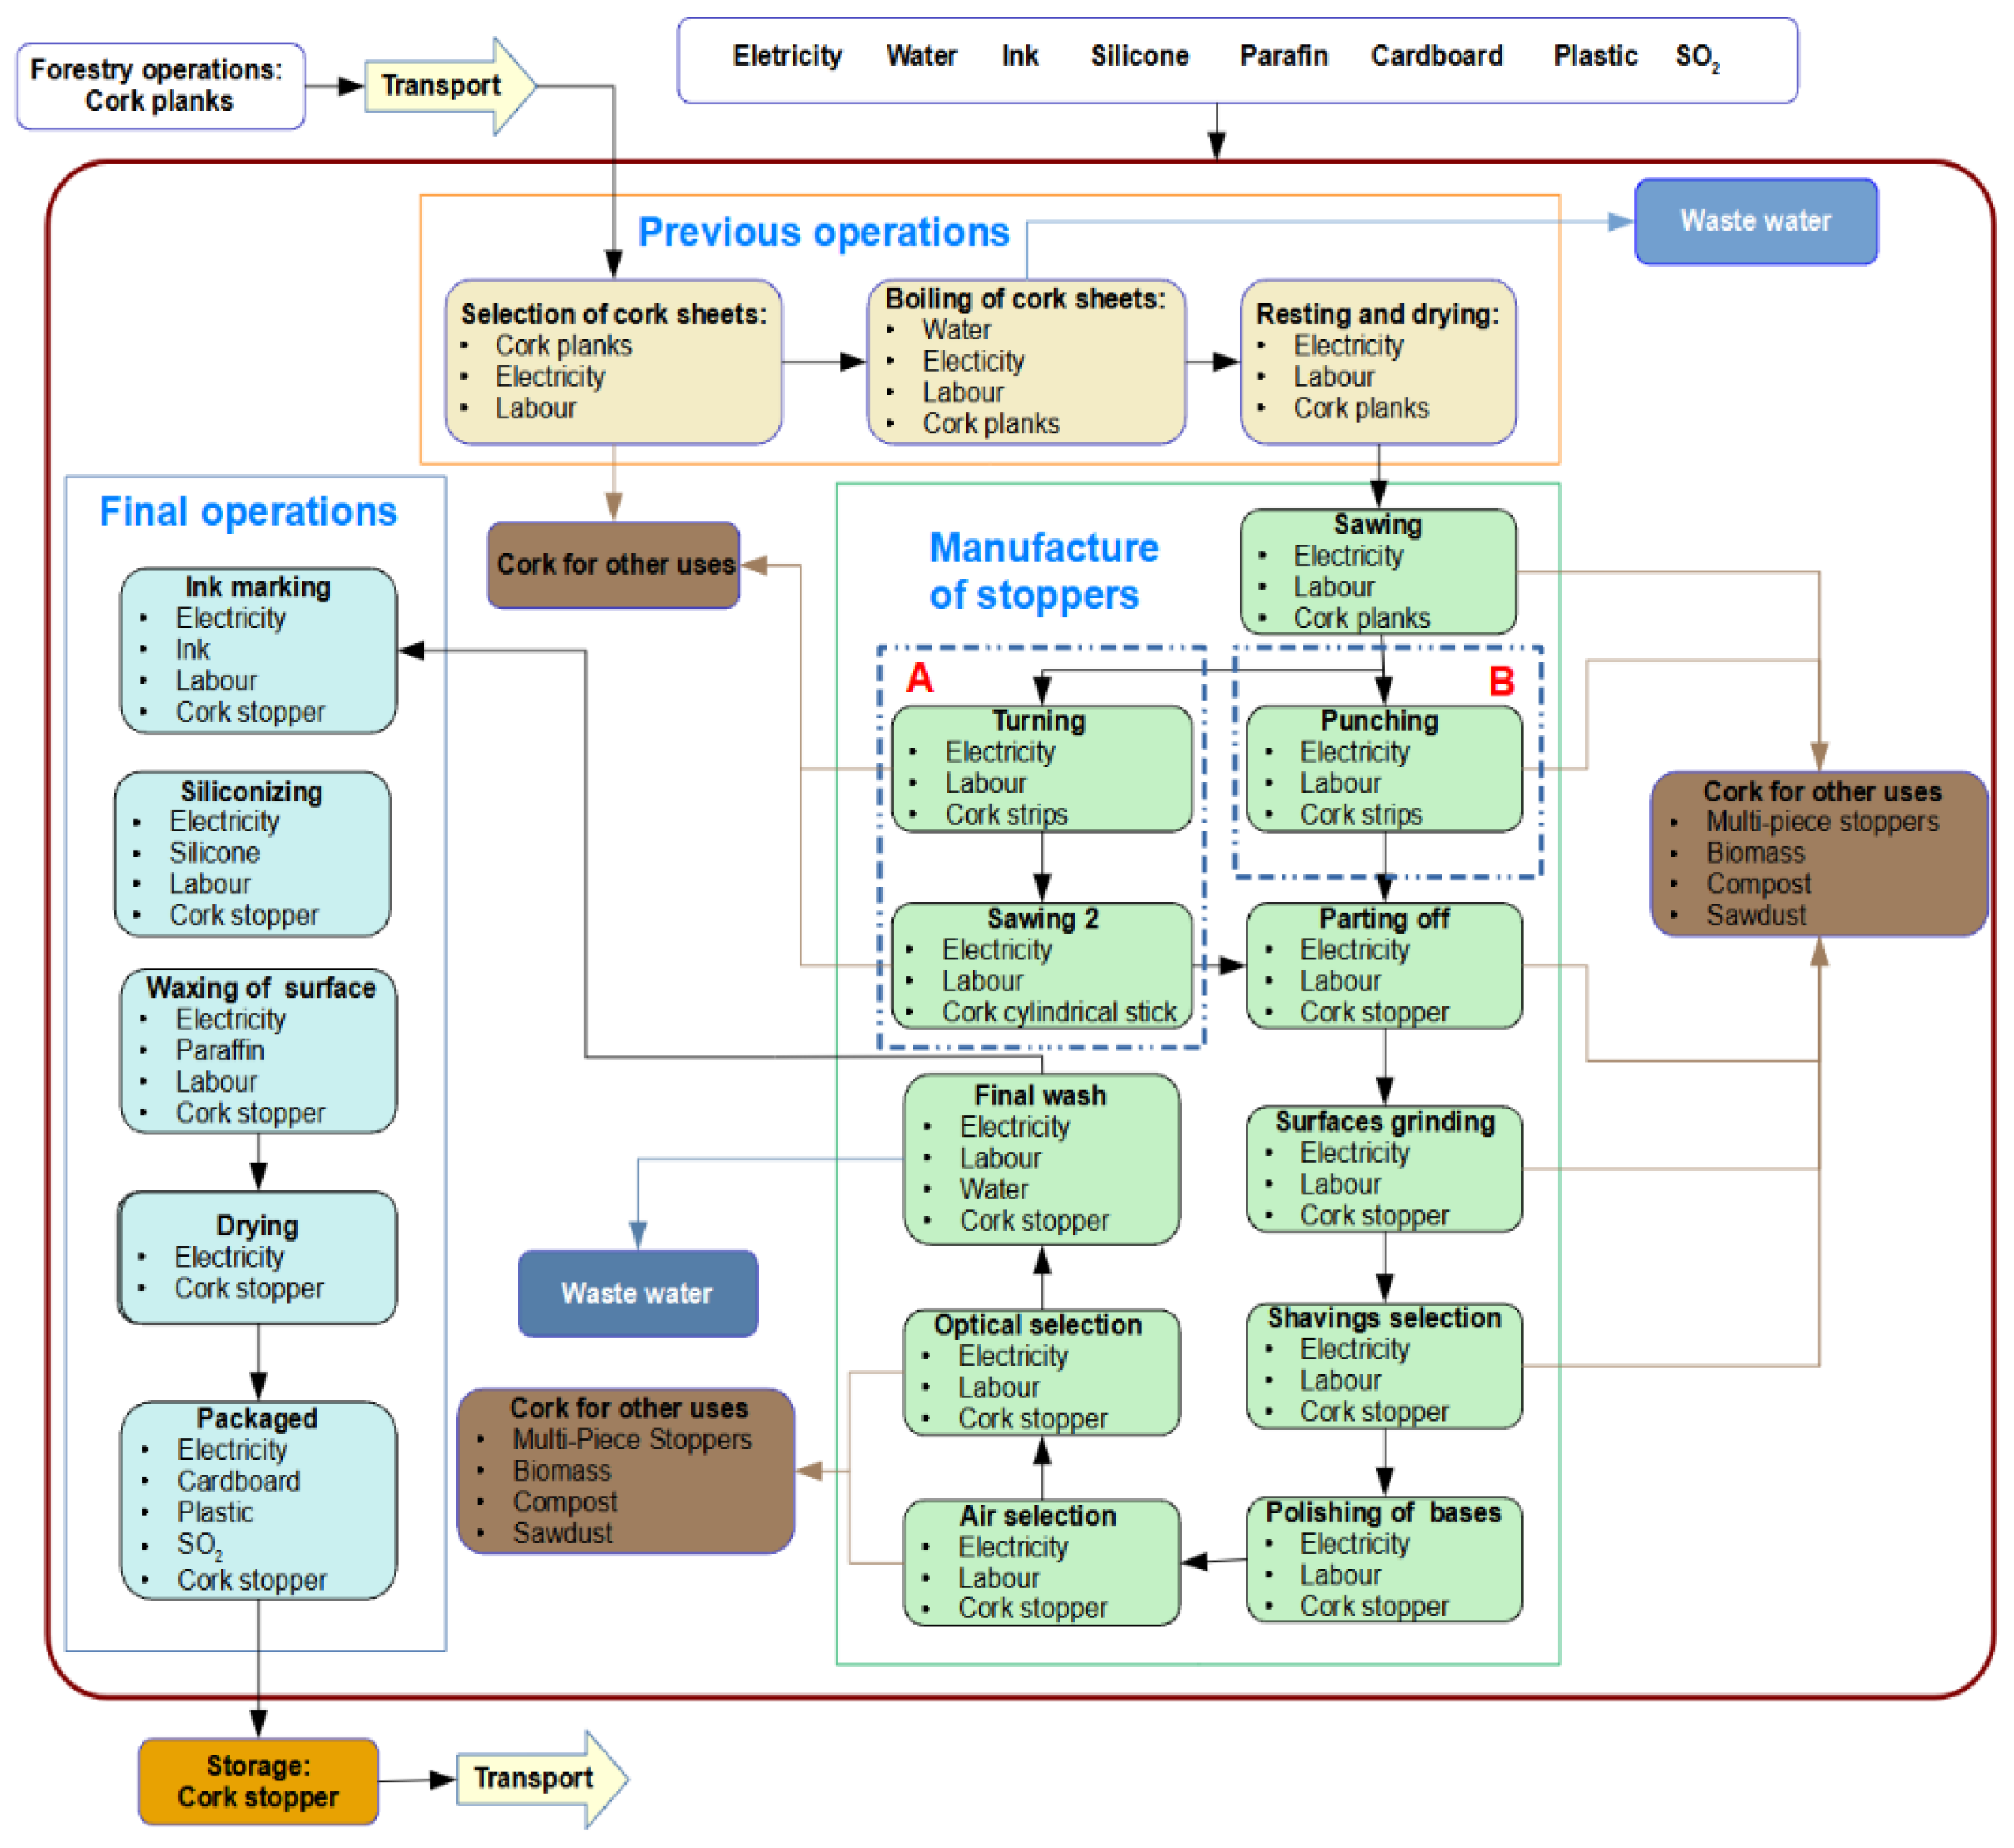
2.3. System Boundaries

The system boundaries (Figure 1) were all processes and operations needed to manufacture and package a functional unit of natural cork stoppers obtained from raw cork planks.
The input flows through the system boundaries are as follows:
  • Electricity.
  • Water.
  • Auxiliary materials (ink, silicone, … plastic, SO2).
  • Cork planks at the factory gate.
The output flows are as follows:
  • Cork stoppers packaged.
  • Treated wastewater.
  • By-product 1, by-product 2, and co-product 1.

2.4. Technical Specifications

The technical specifications of the study are as follows:
  • Lot characteristics: medium load platform (365 kg).
  • Number of lots studied: 10 per manufacturing technique and stopper size.
  • Cork density: 166.07 kg/m3.
  • Cork stopper volume: 1.99051 × 10⁻⁵ m3 (for 24 × 44 mm) and 2.33609 × 10⁻⁵ m3 (for 26 × 44 mm).
  • A functional unit comprises approximately 300 units of 24 × 44 mm stoppers and 260 units of 26 × 44 mm stoppers.

2.5. Inventory

The process of manufacturing natural cork stoppers comprises multiple operations, grouped into three major phases. Table 1 summarizes the inventory required for producing ten lots of cork stoppers per manufacturing method and stopper size. The data were obtained from cork-producing and transforming industries located in Extremadura and la Rioja (Spain). The datasets used to process inventory data were:
  • Cork, raw {RoW}| cork forestry | Cut-off, U.
  • Tap water {RER}| market group for | Cut-off, U.
  • Electricity, medium voltage {ES}| market for | Cut-off, U.
  • Printing ink, offset, without solvent, in 47.5% solution state {GLO}|market for | Cut-off, U.
  • Silicone product {GLO}| market for | Cut-off, U.
  • Paraffin {GLO}| market for | Cut-off, U.
  • Carton board box production, with offset printing {GLO}| market for |Cut-off, S.
  • Packaging film, low density polyethylene {GLO}| market for | Cut-off, U.
  • Sulfur dioxide, at plant/RER.

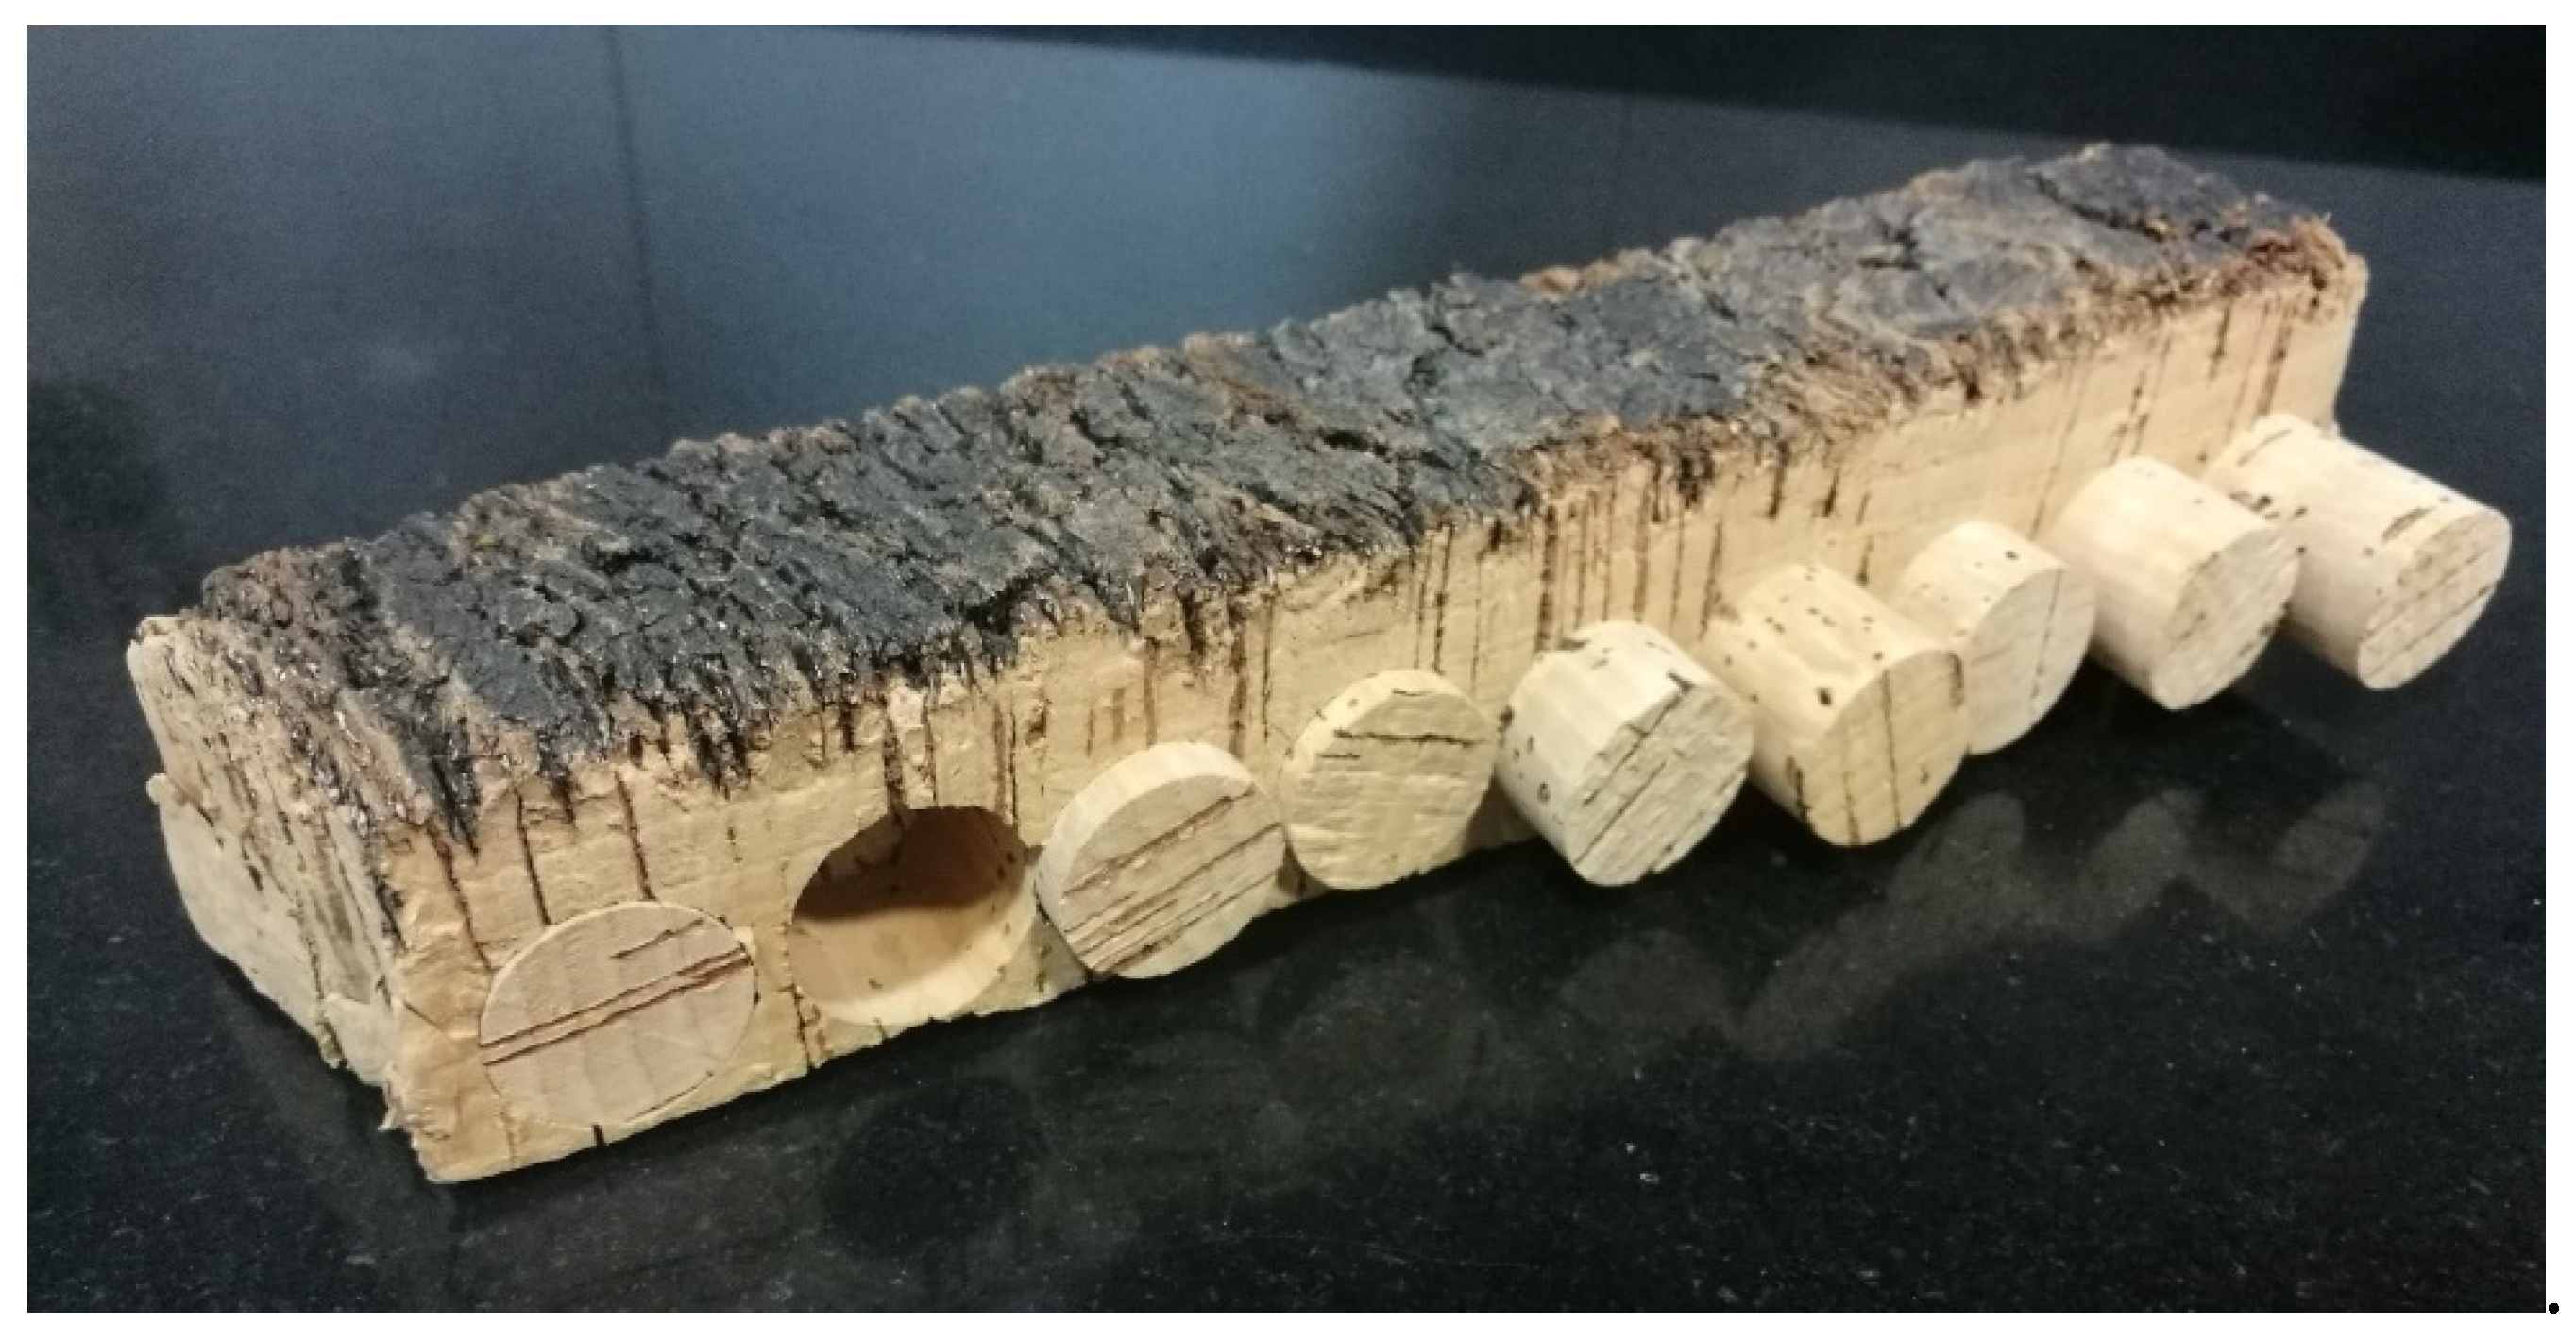
2.5.1. Phase 1: Preparing Raw Cork Planks

Selecting cork plank: Once cork is extracted from the bark, the freed cork portions, known as planks, are visually inspected to remove those that do not comply with the required quality and visual specifications.
Boiling cork plank: The planks are boiled at 100 °C to soften and clean them. Sometimes, manufacturing companies add phenolic additives to better clean the cork, extract soluble substances, and increase cork thickness (up to 20%), flexibility, and elasticity (in this study, we analyzed 365 kg batches of cork boiled in a 10 kW stainless-steel electric boiler for 60 min). Water w reused in two consecutive boils. Subsequently, wastewater is drained out from the boilers and treated.
Treating wastewater: Wastewater to be treated contains wood particles (capacity: 5.00 × 10⁹ L/year). The wastewater treatment comprises three stages—mechanical treatment, biological treatment, and chemical treatment, including sludge digestion (fermentation).
Resting and drying: Once boiled, cork planks are stored in warehouses and left to rest. The planks gradually dry until they reach the right thickness and humidity for industrial processing. This phase usually lasts for 15 days, though it may extend to several months, depending on the characteristics of the planks.

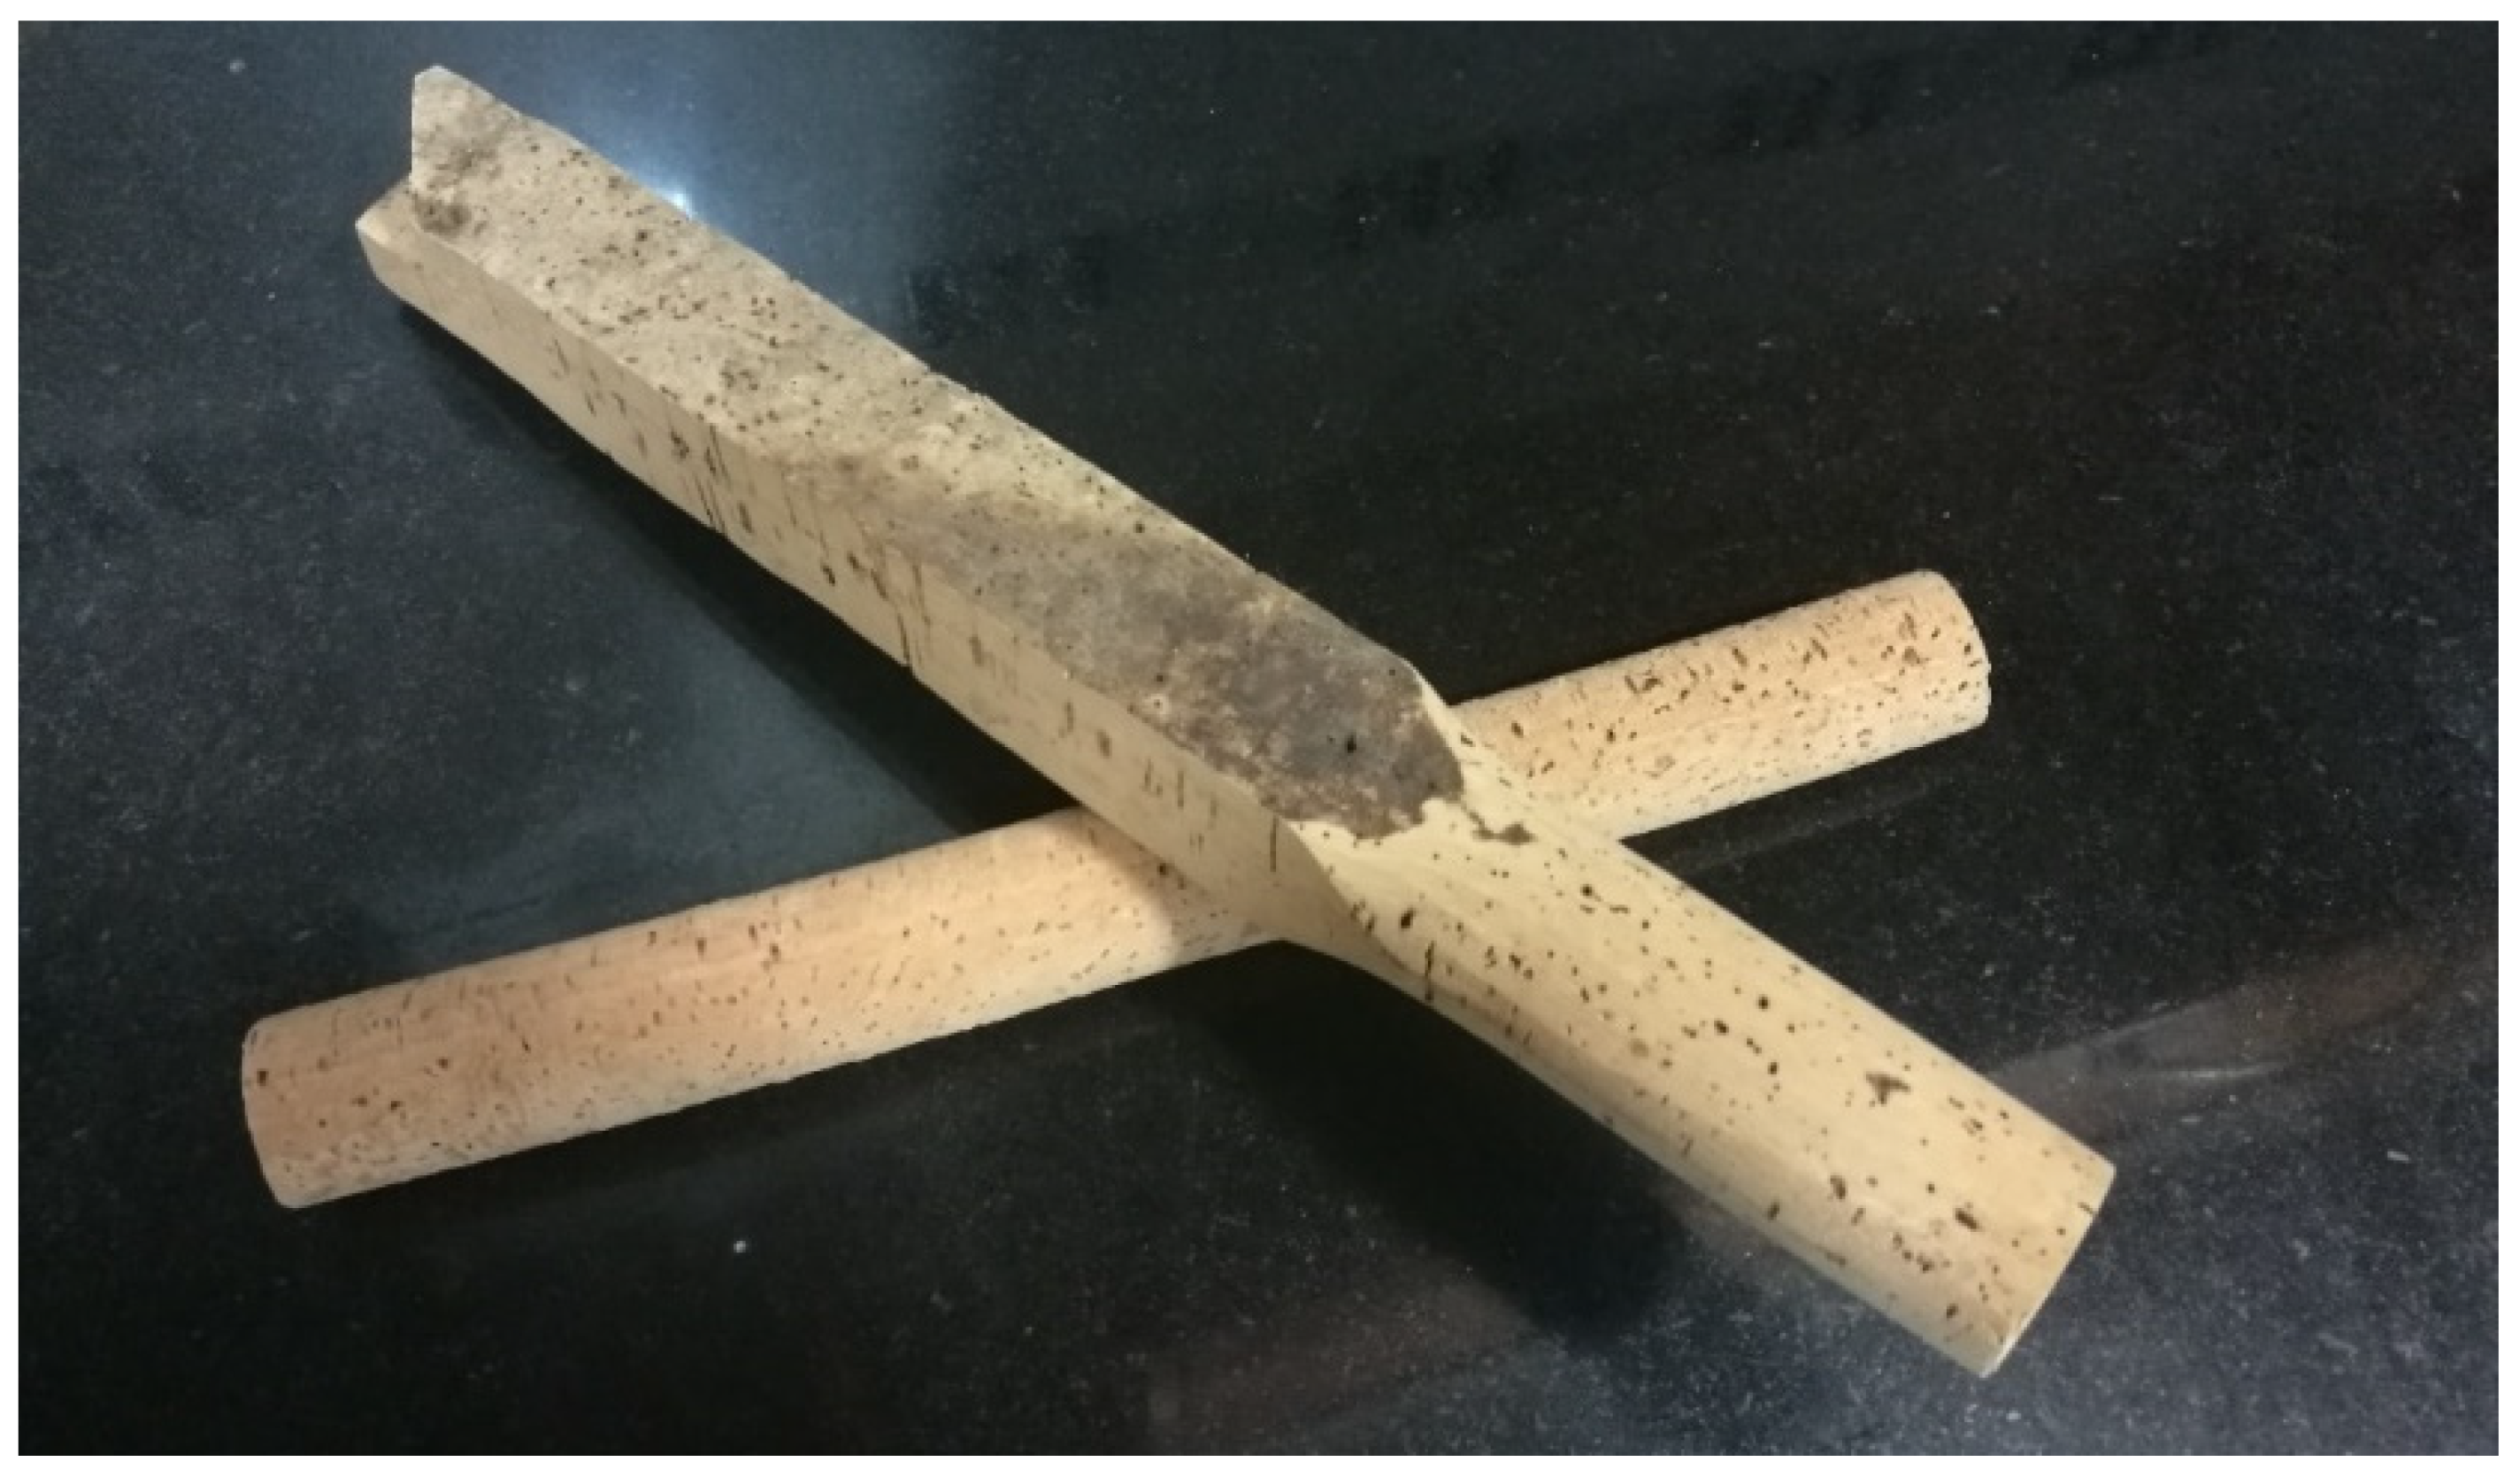
2.5.2. Phase 2: Manufacturing

This phase involves multiple mechanical processes. At this phase, cylindrical cork stoppers with the desired dimensions are manufactured from the treated cork planks. The manufacturing phase initiates by discarding tainted or flawed planks that are not suitable for producing cork stoppers.
Cutting: Cork planks are cut lengthwise into strips. The width of a strip is slightly greater than the width of a cork stopper.
Following the cutting of the planks, the production flow can be of two forms: either punching corks or turning corks, as seen in Figure 2.
Flow A; Cylindrical turning: The cork strips are placed in a turning lathe and shaped as rods (see Figure 2). The width of a rod is slightly greater than that of the actual cork stopper.
Cutting 2: The rods are cut into two pieces, each slightly longer than a cork stopper.
Flow B; Punching: Cork strips are fed through a machine that punches hollow metal tubes through them, removing cylinders of cork stoppers (see Figure 3). The punched diameter is greater than the diameter of a cork stopper.
The stoppers then undergo parting off, grinding, shaving selection, and polishing. Then, at the selection process, also known as the choosing operation, the finished stoppers are sorted into different grades. This is achieved optically by a machine (optical sorting) and then again by eye (visual sorting).
Final wash: The cork stoppers are washed after the selection or choosing process to disinfect them and ensure their optimal organoleptic properties.

2.5.3. Phase 3: Final Operations

At the last phase of the production process, the cork stoppers undergo surface finishing.
Ink printing or heat marking: The printing method depends on customer specifications. In this research, we studied the ink printing process.
Siliconizing: The surface of cork stoppers is treated with silicon to give the stoppers a homogenous color.
Waxing: The surface of cork stoppers is treated with paraffin to make stoppers easier to insert in and extract from a bottle.
Drying: The finished cork stoppers are left to dry.
Packaging: The finished cork stoppers are packed in plastic bags with SO2 to prevent microbiological proliferation during their transportation and storage. Each cork package contains 1000 units of stoppers and weighs approximately 3.5 kg (packaging included).
Wastewater treatment: This process involves removing wood particles (capacity: 5.00 × 10⁹ L/Year) from the water used to boil the cork planks. Wastewater treatment comprises three stages—mechanical treatment, biological treatment, and chemical treatment, including sludge digestion (fermentation).
Construction and demolition of building infrastructures and machinery manufacturing and maintenance: The study was conducted within a 1000 m2 industrial plant with machinery undergoing standard maintenance when needed.

3. Results

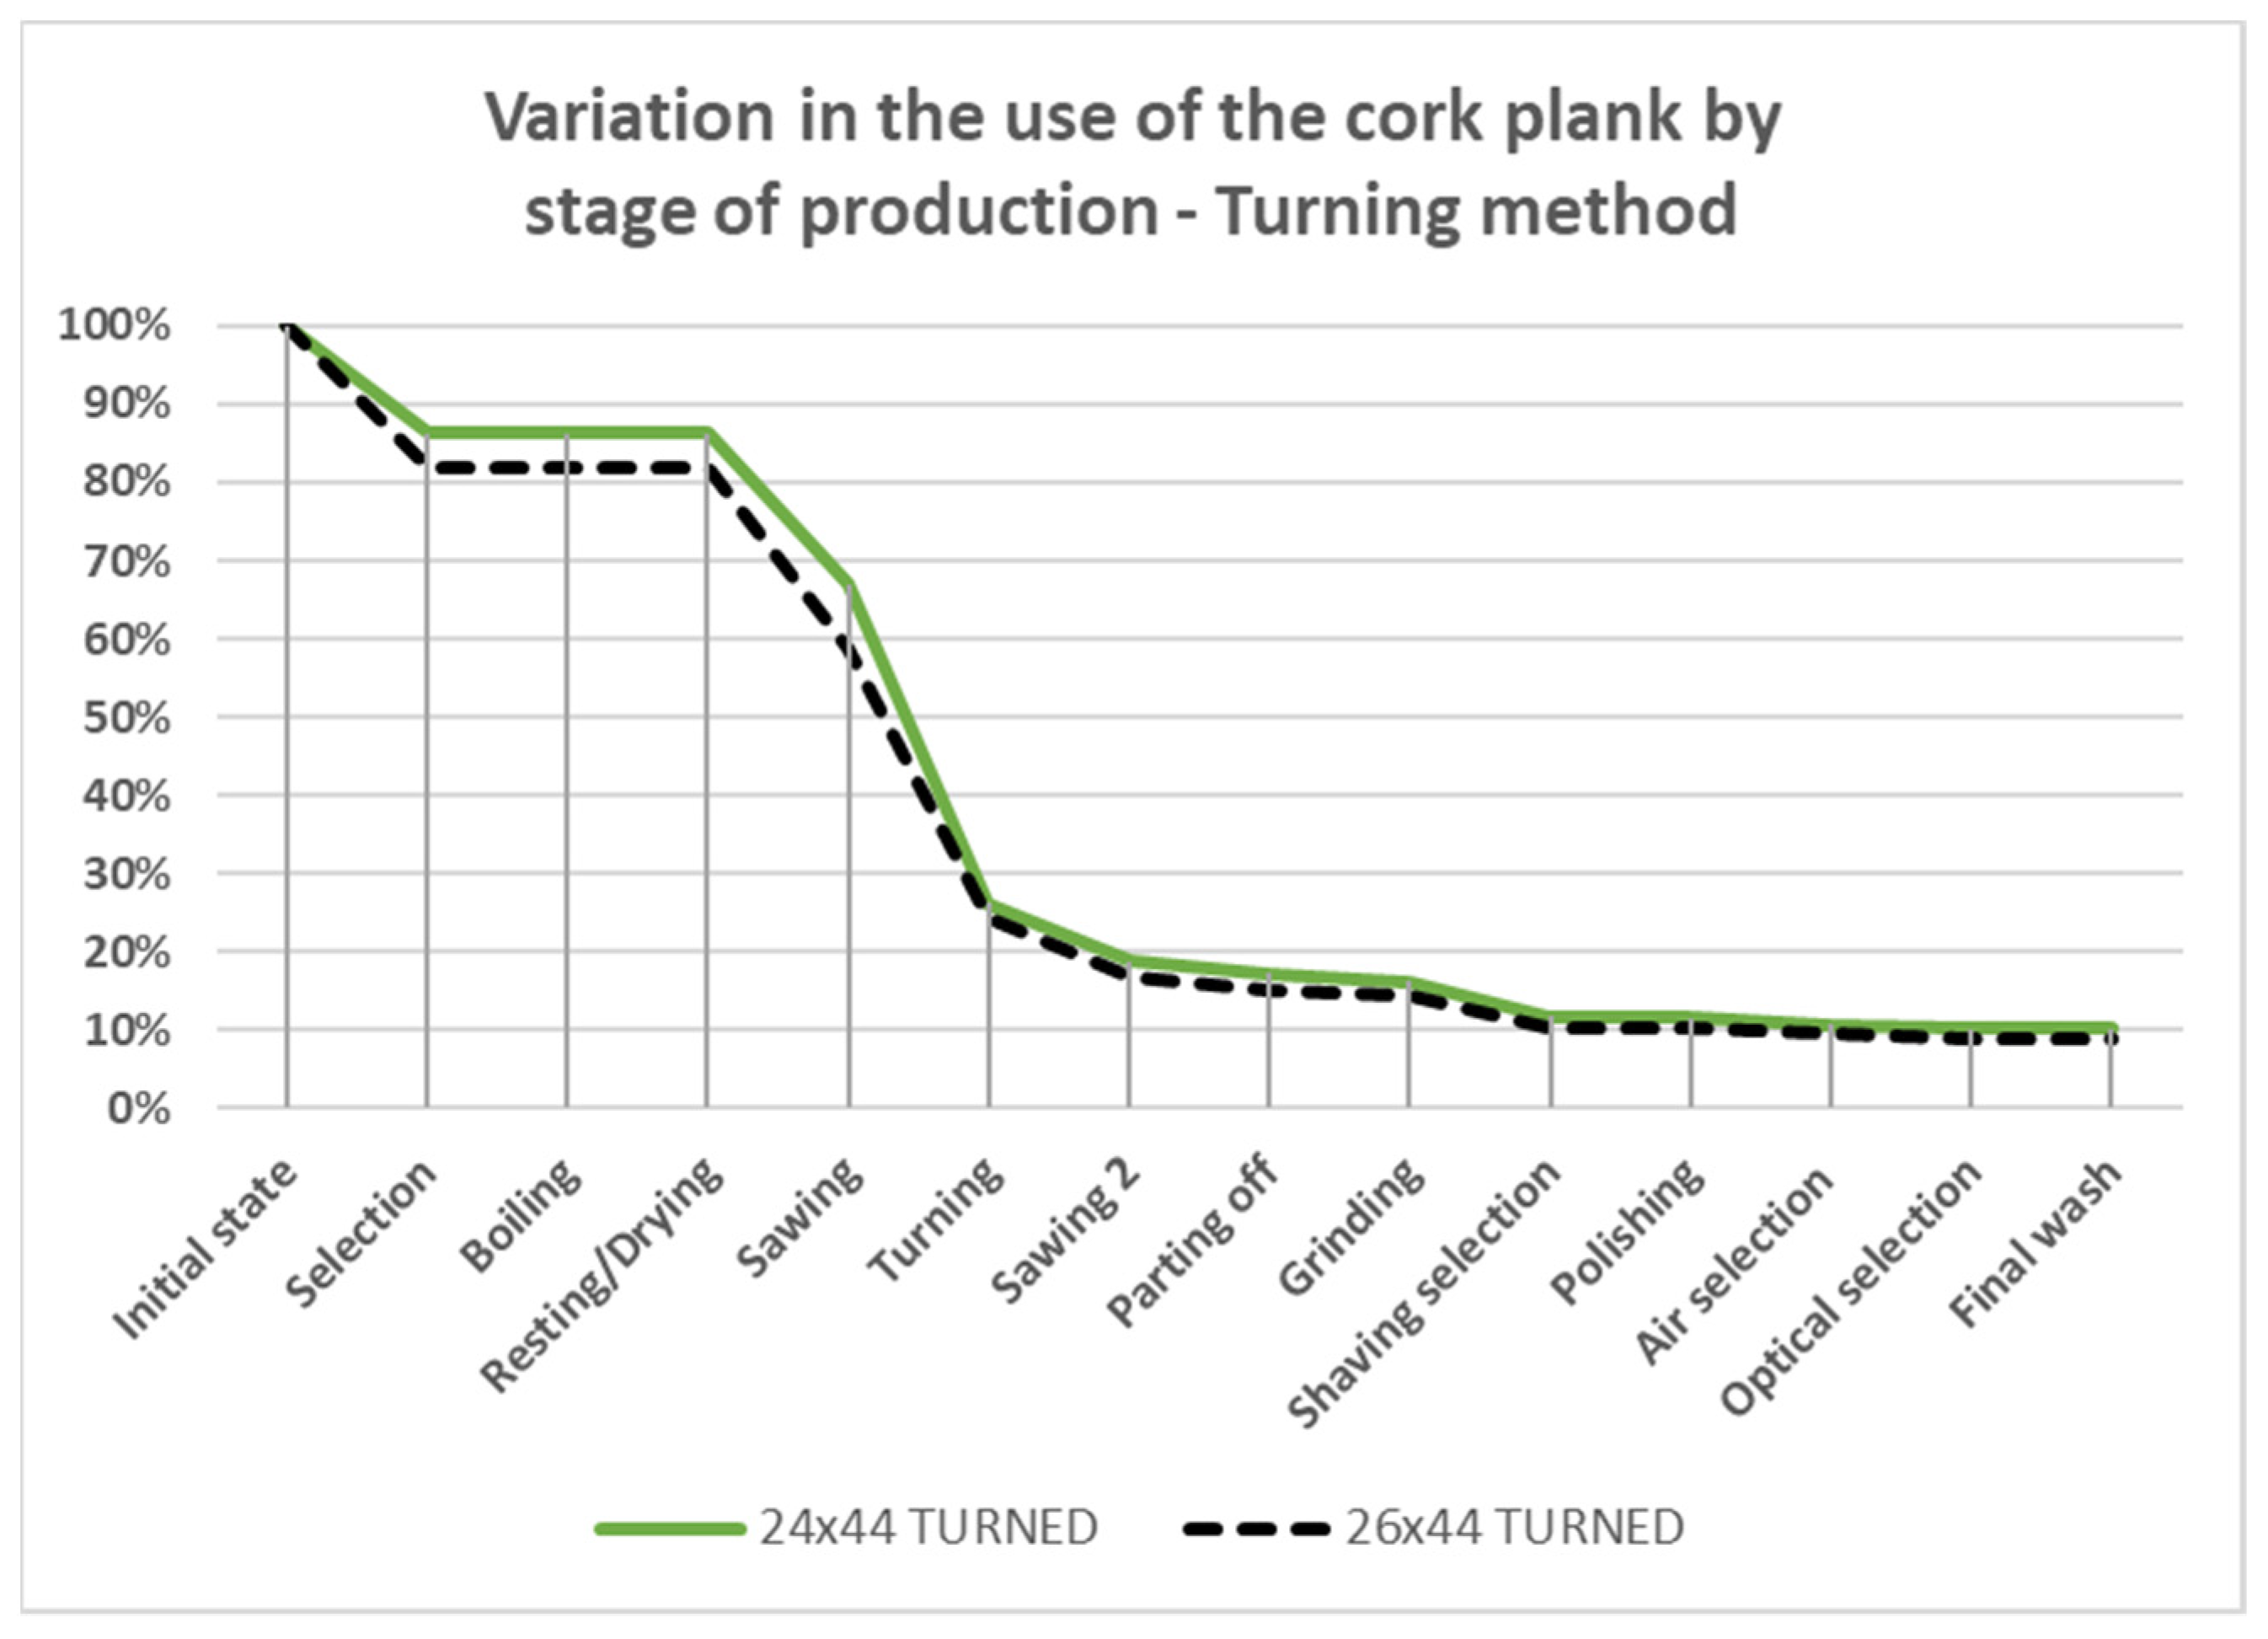
3.1. Environmental Impact of Raw Material Utilization, Products, By-Products, and Co-Products

Table 2 summarizes the analysis results per cork size and manufacturing method. Both mean percentages and standard deviation values were computed. The table also summarizes the results for the co-products and by-products. As discussed in Section 2.4, the analysis considered ten lots of 365 kg of raw cork.
To date, no study had integrated recoverable by-products into the LCA of cork stopper production, even though such by-products greatly contribute to the environmental footprint of the cork industry. According to Rives et al. (2011), only approximately 27% of collected cork is used to manufacture cork stoppers, and the environmental impact of the resulting waste has not been thoroughly assessed. From a similar perspective, Rives et al. (2013) found that in the cork industry, 19% of the cork collected from forests is actually used in natural stoppers, 41% in champagne stoppers, and 14% in cork granules, and the remaining 26% becomes cork waste. Such findings were obtained after studying separate batches, each destined for the production of a different kind of cork stopper. A study of this nature may not be highly convenient, since the main goal of conducting an LCA in the cork industry should be to find a way to produce cork stoppers with the highest possible added value while causing the least damage to the environment.
Table 2 also demonstrates that the production of natural cork stoppers has a low resource exploitation rate. Hence, since only a small percentage of a cork batch is suitable for manufacturing natural cork stoppers, an LCA of the main product (i.e., stoppers) would not be reliable to comprehensively understand the environmental impact of natural cork production, since 100% of the environmental impact would be associated with only 10% of the final product. In addition, as Table 2 demonstrates, it is important to identify which production stages influence the batch usage rate, as material losses are generated at three clearly differentiated stages.
As shown in Figure 4, with the punching method, most of the co-product and by-product material was generated during the initial selection of the raw cork planks (19%), then when cutting the planks into strips (32%), and (finally) when punching the corks out of the strips (34%). As for the turning method (see Figure 5), most of the co-product and by-product material appeared during the initial selection of the raw cork planks (19%), then when cutting the planks into strips (19% for 24 × 44 mm stoppers and 33% for 26 × 44 mm stoppers), and (finally) when turning the strips into rods (from 20% to 24%). In conclusion, Figure 4 and Figure 5 show that most of the waste is generated during the early phase of the manufacturing process; that is, during those stages involving the selection and handling of cork planks. In fact, the suitability of a cork plank for manufacturing natural cork stoppers depends on a strict set of quality requirements, such as average plank thickness, porosity, structural defects, stains, and hardness.
One of the challenges of conducting an LCA in the cork industry is successfully calculating the environmental impact of the main product (i.e., cork stoppers) and each of the by-products and co-products generated throughout the production process. According to the ISO 14044: 2006 standard, if it is impossible to identify a relevant underlying physical relation between the secondary material and the primary material as the basis for percentage allocation, this percentage must be assigned in a way that reflects other relationships among such materials. For instance, input and output data could be allocated between co-products and waste with respect to their commercial value. This is known as economic allocation.
As shown in Table 3, the environmental impact percentages were allocated in a way that reflected the relation between cork products and by-products with respect to their commercial value. Applying the economic allocation procedure demonstrated that the greatest impact percentage was allocated to the product generating the greatest added value; that is, natural cork stoppers. Multiple researchers have relied on this allocation procedure. For instance, Ardente and Cellura [19] conducted an extensive study to compare economic allocation with other feasible allocation alternatives. Likewise, economic allocation was used by Ayer et al. [20] to assess the environmental impact of co-products generated in the seafood industry, as well as by Lauri et al. [21] to study wood products. Finally, Thomassen and de Boer [22] used economic allocation to evaluate the environmental effects of a dairy production system.
As previously mentioned, both market price and the percentage of recoverable product, co-products, and by-products to estimate environmental impact allocation percentages were considered. Table 4 shows the results, as estimated using Equation (1), which is widely used in LCA studies [19,23]:
R i = p i · i 0 n p i · i
where Ri stands for the percentage of environmental impact allocated to each product; pi is the percentage of product, co-product, or by-product generated in the production process; and €i is the sale price.
Table 4 also summarizes the results from the environmental impact allocation analysis obtained by applying the distribution criterion. This criterion considers the usage and sale costs of products, co-products, and by-products. As can be observed, natural cork stoppers (the main product) demonstrated the highest environmental impact, having the highest added value. There was a slight variation of 2% across the batches, which depended on stopper size and manufacturing method. Additionally, 15.59–15.84% of the total environmental impact was allocated to cork granules, which have low sale costs. Additionally, the thin plank co-product assumed a stable allocation of around 2%. The environmental impact percentages allocated to the remaining by-products (biomass and sawdust) were merely residual.

3.2. Environmental Impact

3.2.1. Analysis of Global Environmental Impact

The CML-IA baseline V3.05/EU25 method was used to analyze the environmental impact of producing two types of cork stoppers (sizes 24 × 44 mm and 26 × 44 mm) with two different manufacturing methods, turning and punching. Table 5 summarizes the results found in the global warming (GWP100a) category. Table 6 illustrates the environmental impact by phase. The remaining results can be found in the Supplementary Materials Tables S1–S3.
As can be observed, the 24 × 44 mm punched cork stoppers had the lowest environmental impact, whereas the 26 × 44 mm turned cork stoppers had the highest impact. After comparing same-sized punched and turned cork stoppers, it was found that the former had a slightly lower environmental impact. This behavior was directly related to efficient plank usage. For instance, in terms of global warming, the 26 × 44 mm turned cork stoppers were found to have a greater environmental impact (i.e., 1.49 × 100 kg CO2 eq/kg) than the 26 × 44 mm punched stoppers.
The environmental impact of cork co-products and by-products has effects on subsequent production operations. The co-products generated by the turning method were found to have a greater environmental impact than those generated by the punching method. For example, 1 kg of thin plank is used to manufacture multi-piece cork stoppers, and it was found to generate a maximum environmental impact of 3.72 × 10⁻² kg CO2 eq/kg. On the other hand, granules used in the manufacture of agglomerated corks were found to have an environmental impact of 2.76 × 101 kg CO2 eq/kg. Finally, residues for biomass seemed to have a low impact on the environment.
The results of this study significantly differ from those reported in similar works. For instance, Rives et al. [24] estimated the environmental impact of natural cork stopper manufacturing to be 1.82 × 100 kg CO2 eq/kg, with a variability range between 51% and 157%. However, the authors did not consider cork co-products and by-products in their analysis, so they allocated the entire environmental impact estimates only to the main product: the cork stoppers. On the other hand, in their analysis of the environmental impact of cork stoppers versus that of aluminum and plastic closures, Amorim and Sgps [25] considered the CO2 absorption phase from cork oak trees for 100 years, thus resulting in negative findings. For the study, the researchers used survey data collected among cork manufacturers in Portugal. It is also worth mentioning that neither Rives, Fernandez-Rodriguez, Rieradevall, and Gabarrell [24] nor Amorim and Sgps [25] integrated water treatment in their LCA studies. Moreover, in both works, 100% of closure waste is destined to landfills.

3.2.2. Environmental Impact Analysis by Phases

In addition to conducting a global environmental impact analysis, the environmental impact of each individual phase of the cork stopper production process was also examined. To this end, the key phase operations were identified and their importance determined with respect to their environmental impact. Table 6 summarizes the results of the analysis in terms of global warming impact per stopper size and manufacturing method.
Phase 1, initial operations: This phase of the cork production process comprises the selection, boiling, and resting of cork planks. At this phase, boiling had the greatest environmental impact in terms of global warming, namely 68%, ranging from 1.02 × 100 kg CO2 eq/kg of natural cork stoppers (26 × 44 mm turned cork stoppers) to 9.16 × 10⁻¹ kg CO2 eq/kg (24 × 44 mm punched cork stoppers).
Phase 2, manufacturing: This phase involves nine operations in the punching method and ten operations in the turning method. The results indicated that producing turned cork stoppers consumed more energy than producing punched stoppers. For instance, punching 24 × 44 mm cork stoppers out of the planks had an environmental impact of 1.55 × 10⁻² kg CO2 eq/kg, whereas turning cork strips and cutting them (both tasks are necessary to make turned cork stoppers) had an environmental impact of 5.62 × 10⁻² kg CO2 eq per kg of natural cork stoppers. Following such results, and considering the previous findings on efficient plank usage, producing 1 kg of 26 × 44 mm turned cork stoppers had the greatest environmental impact in terms of global warming. On the other hand, the environmental impact of wastewater treatment at the final stage was not shown to be significant. In this case, the production process consumed little water, since the resulting leachates contained only small traces of cork powder.
Phase 3, final operations: This phase encompasses branding and packaging operations. Overall, all the final operations had a low impact on global warming, with waxing being the greatest contributor due to factors such as energy consumption and paraffin use. In this phase of the production process, 24 × 44 mm turned cork stoppers had the highest environmental impact (9.88 × 10⁻² kg CO2 eq/kg).
Considering the high environmental impact generated by the use of electricity from the grid, it is possible to address options for reductions in environmental impact with the use of renewable energy sources. By installing 100 kW/h of photovoltaic solar energy for domestic use, it is possible to reduce the environmental impact in the boiling stage from 9.16 × 10⁻¹ to 1.88 × 10⁻¹ kg CO2 eq/kg in the punching of 24 × 44 mm cork stoppers, i.e., with a reduction of up to 80% of the impact.
This solution is viable from the environmental perspective, but it would need the support of the power grid for the months with low performance levels of the photovoltaic panels. If the solution is adopted by a biomass facility of 100 kW/h, it would be possible to reduce the environmental impact of the boiling stage down to 4.2 × 10⁻¹ kg CO2, that is, a reduction of 55%.
Overall, the production of natural punched stoppers was found to have a lower environmental impact than the production of natural turned stoppers. Even though variations across the two manufacturing methods are of little significance, a difference of 9% was found for the 26 × 44 mm stoppers and a difference of 4% was reported for the 24 × 44 mm stoppers. Regarding the production stages; Phase 1 was found to have the highest effects on the environment. Specifically, the plank boiling and wastewater treatment stages accounted for nearly 68% of the total environmental impact of the entire production process. Such results might compromise efforts from cork manufacturers to reduce the environmental footprint of cork stopper production to some extent, since the operations involved in Phase 1 are irreplaceable within the production process. Finally, infrastructure construction and machinery manufacturing and maintenance were found to have minimal environmental impacts due to both long amortization periods and the fact that most infrastructure materials and machinery components can be eventually recycled. In fact, according to the La Rioja 2016–2026 Waste Management Plan and its indexed statistics (Rioja, 2017), 69.431% of concrete waste was recycled in 2016, whereas 100% of metal machinery components can be recycled.

4. Conclusions

The authors of this research studied the environmental impact of the natural cork stopper production process. To this end, two manufacturing methods—turning and punching—and two stopper sizes—24 × 44 mm and 26 × 44 mm—were studied. An environmental analysis per manufacturing method and cork stopper size was conducted by considering effective usage of raw material. Similarly, the environmental impact of the commercial by-products generated throughout the entire manufacturing process were assessed. The results were obtained after analyzing ten productive lots per cork stopper size and manufacturing method. The LCA results indicated that the punching method made a more efficient use of raw materials than the turning method. Specifically, producing 24 × 44 mm and 26 × 44 mm punched cork stoppers increased efficient plank usage by 10.47% and 10.10%, respectively. Conversely, producing 24 × 44 and 26 × 44 mm turned cork stoppers reduced efficient plank usage to 10.13% and 8.97%, respectively.
The LCA of the study considered not only the main product (cork stoppers) but also the co-products and by-products resulting from the cork manufacturing process. To this end, allocation estimations were performed to determine the percentage of environmental impact of each product. For an allocation analysis, the ISO 14044: 2006 standard claims that if the physical relationship cannot be used as the basis for allocation, inputs must be allocated to the products in a way that reflects other relationships between them, such as their commercial value. According to the results, granules (used for manufacturing agglomerated corks) were allocated 13.6–15.8% of the total environmental impact, whereas the co-product used for multi-piece corks were allocated much less (1.85–2.06% of the total environmental impact). Other significant sub-products include material for biomass (6.50–6.91% of the total environmental impact) and sawdust (3.35–4.34% and 0.12–0.18% of environmental impact).
The findings of this research also indicate that the 24 × 44 mm stoppers produced with the punching method had a low environmental impact. In terms of global warming, the 24 × 44 mm punched cork stoppers had an impact of 1.360 kg CO2 eq/kg, whereas the 26 × 44 mm turned cork stoppers had the highest impact, i.e., 1.490 kg CO2 eq/kg. The production stages of boiling and wastewater treatment—both comprising Phase 1—had the greatest environmental impact at nearly 68% of the total estimated, as cork boiling uses a significant amount of water and energy. In this sense, the potential use of cork biomass as a partial substitute for electrical energy could slightly reduce environmental impacts. On the other hand, at the plank boiling stage, replacing water with steam at 120 °C in an autoclave would substantially minimize water consumption and thus the environmental impact of initial cork manufacturing operations; however, this solution might increase energy consumption rates.
It is also worth highlighting that the use of energy self-consumption facilities based on solar energy and/or biomass help to reduce the environmental impact of the high energy consumption stages. For instance, by installing 100 kW/h of photovoltaic energy, the environmental impact in the boiling stage can be reduced to 80%.
In conclusion, there is a clear relationship between the environmental impact and efficient usage of raw material. In turn, the efficient use of cork planks depends on both the cork manufacturing method and stopper size. Finally, this research also demonstrates that production lots are a key element when assessing the environmental impact of cork stopper production. There is not an ideal lot that can make 100% efficient use of the raw material.

Supplementary Materials

The following supporting information can be downloaded at https://www.mdpi.com/article/10.3390/agriculture12050636/s1: Table S1: Global environmental impact per kg of natural cork stopper, CML methodology, and comparative by size and method of manufacture; Table S2: Distribution of global environmental impact per kg of natural cork stopper, CML and punched methodologies; Table S3: Distribution of global environmental impact per kg of natural cork stopper, CML and turned methodologies.

Author Contributions

Conceptualization, F.J.F.-M. and J.B.-F.; methodology, E.M.-C. and E.J.-M.; software, J.L.G.-A.; validation, F.J.F.-M. and E.M.-C.; formal analysis, J.L.G.-A., J.-I.L.-B. and E.M.-C.; investigation and resources, F.J.F.-M.; data curation, E.M.-C.; writing—original draft preparation, J.L.G.-A. and J.B.-F.; writing—review and editing, E.M.-C.; visualization, J.B.-F. and J.-I.L.-B.; supervision, F.J.F.-M.; project administration, F.J.F.-M. All authors have read and agreed to the published version of the manuscript.

Funding

This research has received funding from the Instituto de Estudios Riojanos “IER” within the project “Newcork2Wine”.

Institutional Review Board Statement

Not applicable.

Informed Consent Statement

Not applicable.

Data Availability Statement

Please contact the corresponding author.

Acknowledgments

The companies Espadan Corks S.L. and Double Cork S.L. are thanked for their contributions and for allowing access to their facilities for data collection.

Conflicts of Interest

The authors declare no conflict of interest.

References

  1. Dehane, B. Caracterización del crecimiento y de la calidad de corcho de los alcornocales del Noroeste de Argelia (región de Orán). Rev. Ecosistemas 2019, 28, 97–105. [Google Scholar]
  2. MAPA. Annual Statistics of Other Forest Uses—Estadística Anual de Otros Aprovechamientos Forestales; Ministry of Agriculture, Fisheries and Food—Ministerio de Agricultura, Pesca y Alimentación: Madrid, Spain, 2017. [Google Scholar]
  3. Pereira, H. Cork: Biology, Production and Uses, 1st ed.; Elsevier Science: Berlin, Germany, 2007. [Google Scholar]
  4. Silva, A.; Lambri, M.; De Faveri, M. Evaluation of the performances of synthetic and cork stoppers up to 24 months post-bottling. Eur. Food Res. Technol. 2003, 216, 529–534. [Google Scholar] [CrossRef]
  5. Chatonnet, P.; Labadie, D.; Boutou, S. Study of chloroanisoles assay and tca assay validation in wine and cork stoppers soaked in dilute alcohol solution using SIDA-HSSPME-GC-MS/EI-SIM. OENO One 2005, 39, 137–147. [Google Scholar] [CrossRef]
  6. Brajkovich, M.; Tibbits, N.; Peron, G.; Lund, C.M.; Dykes, S.I.; Kilmartin, P.A.; Nicolau, L. Effect of screwcap and cork closures on SO2 levels and aromas in a Sauvignon blanc wine. J. Agric. Food Chem. 2005, 53, 10006–10011. [Google Scholar] [CrossRef]
  7. Conde, E.; Cadahía, E.; García-Vallejo, M.C.; Fernández de Simón, B.; González Adrados, J.R. Low molecular weight polyphenols in cork of Quercus suber. J. Agric. Food Chem. 1997, 45, 2695–2700. [Google Scholar] [CrossRef]
  8. Mazzoleni, V.; Caldentey, P.; Silva, A. Phenolic compounds in cork used for production of wine stoppers as affected by storage and boiling of cork slabs. Am. J. Enol. Vitic. 1998, 49, 6–10. [Google Scholar]
  9. Garza, J.A.V.; Caballero, H.S. El corcho, un material irremplazable. In Investigación y Ciencia; Universidad Autónoma de Aguascalientes: Aguascalientes, Mexico, 2003; pp. 48–51. [Google Scholar]
  10. Liu, D.; Xing, R.R.; Li, Z.; Yang, D.M.; Pan, Q.H. Evolution of volatile compounds, aroma attributes, and sensory perception in bottle-aged red wines and their correlation. Eur. Food Res. Technol. 2016, 242, 1937–1948. [Google Scholar] [CrossRef]
  11. Reynolds, D.; Rahman, I.; Bernard, S.; Holbrook, A. What effect does wine bottle closure type have on perceptions of wine attributes? Int. J. Hosp. Manag. 2018, 75, 171–178. [Google Scholar] [CrossRef]
  12. Benito Lázaro, D. Revisión y Desarrollo de Modelos de Clasificación del Corcho en Plancha. 2014. Available online: https://oa.upm.es/30795/1/PFC_DAVID_BENITO_LAZARO_1.pdf (accessed on 2 February 2018).
  13. Sánchez-González, M.; Pérez-Terrazas, D. Assessing the percentage of cork that a stopper should have from a mechanical perspective. Food Packag. Shelf Life 2018, 18, 212–220. [Google Scholar] [CrossRef]
  14. Sánchez-González, M.; Pérez-Terrazas, D. Dataset of mechanical properties from different types of wine stopper: Micro-agglomerated, natural cork and synthetic. Data Brief 2018, 21, 2103–2109. [Google Scholar] [CrossRef] [PubMed]
  15. Rives, J.; Fernandez-Rodriguez, I.; Rieradevall, J.; Gabarrell, X. Environmental analysis of raw cork extraction in cork oak forests in southern Europe (Catalonia—Spain). J. Environ. Manag. 2012, 110, 236–245. [Google Scholar] [CrossRef] [PubMed]
  16. Rives, J.; Fernandez-Rodriguez, I.; Rieradevall, J.; Gabarrell, X. Integrated environmental analysis of the main cork products in southern Europe (Catalonia—Spain). J. Clean. Prod. 2013, 51, 289–298. [Google Scholar] [CrossRef]
  17. Rives, J.; Fernandez-Rodriguez, I.; Gabarrell, X.; Rieradevall, J. Environmental analysis of cork granulate production in Catalonia—Northern Spain. Resour. Conserv. Recycl. 2012, 58, 132–142. [Google Scholar] [CrossRef]
  18. Demertzi, M.; Silva, R.P.; Neto, B.; Dias, A.C.; Arroja, L. Cork stoppers supply chain: Potential scenarios for environmental impact reduction. J. Clean. Prod. 2016, 112, 1985–1994. [Google Scholar] [CrossRef]
  19. Ardente, F.; Cellura, M. Economic allocation in life cycle assessment: The state of the art and discussion of examples. J. Ind. Ecol. 2012, 16, 387–398. [Google Scholar] [CrossRef]
  20. Ayer, N.W.; Tyedmers, P.H.; Pelletier, N.L.; Sonesson, U.; Scholz, A. Co-product allocation in life cycle assessments of seafood production systems: Review of problems and strategies. Int. J. Life Cycle Assess. 2007, 12, 480. [Google Scholar] [CrossRef]
  21. Lauri, L.; Roope, H.; Atsushi, T.; Tuovi, V.; Olli, D. Environmental product declaration of timber products: The impact of allocation method to the impact categories. J. Clean. Prod. 2020, 256, 120386. [Google Scholar] [CrossRef]
  22. Thomassen, M.A.; de Boer, I.J.M. Evaluation of indicators to assess the environmental impact of dairy production systems. Agric. Ecosyst. Environ. 2005, 111, 185–199. [Google Scholar] [CrossRef]
  23. Guinée, J.B.; Heijungs, R.; Huppes, G. Economic allocation: Examples and derived decision tree. Int. J. Life Cycle Assess. 2004, 9, 23. [Google Scholar] [CrossRef] [Green Version]
  24. Rives, J.; Fernandez-Rodriguez, I.; Rieradevall, J.; Gabarrell, X. Environmental analysis of the production of natural cork stoppers in southern Europe (Catalonia–Spain). J. Clean. Prod. 2011, 19, 259–271. [Google Scholar] [CrossRef]
  25. PwC/Ecobilan. Evaluation of the Environmental Impacts of Cork Stoppers versus Aluminum and Plastic Closures: Analysis of the Life Cycle of Cork, Aluminium and Plastic Wine Closures, Report Prepared for Corticeira Amorim, SGPS, SA by PricewaterhouseCoopers/ECOBILAN. October 2008. Available online: https://documents.pub/document/amorim-lca-final-report.html?page=1 (accessed on 1 January 2022).
Figure 1. System boundaries.
Agriculture 12 00636 g001
Figure 2. Turning of cork strips (Source: authors).
Agriculture 12 00636 g002
Figure 3. Punched cork stoppers (Source: authors).
Agriculture 12 00636 g003
Figure 4. Variation in cork plank usage by production stage—punching method.
Agriculture 12 00636 g004
Figure 5. Variation in cork plank usage by production stage—turning method.
Agriculture 12 00636 g005
Table 1. Inventory summary.
InventoryPunching
24 × 44 mm
Turning
24 × 44 mm
Punching
26 × 44 mm
Turning
26 × 44 mm
ItemUnit
Phase 1
Cork plankskg9.5529.9059.87111.152
ElectricitykWh0.0790.0800.0810.092
WaterL19.49720.21720.14822.763
Phase 2
ElectricitykWh0.6240.4120.5150.333
WaterL0.0030.0030.0020.002
Phase 3
ElectricitykWh0.0550.0540.0440.043
Inkg0.1900.1900.1900.190
Silicong1.2101.2101.0301.030
Paraffing6.0506.0505.1605.160
Cardboardg34.20034.20034.20034.200
Plasticg4.3004.3004.3004.300
SO2g0.8600.8600.8600.860
Table 2. Use rate of raw material.
Cork Stopper Size/Production Method/Usage
Item24 × 44 mm Punching26 × 44 mm Punching24 × 44 mm Turning26 × 44 mm Turning
Cork stoppers10.47% ± 0.93%10.10% ± 0.91%10.13% ± 0.91%8.97% ± 0.82%
Materials for Co-Products and by-Products
Thin plank6.16% ± 0.58%7.41% ± 0.69%6.05% ± 0.57%7.12% ± 0.66%
Granules72.75% ± 1.98%72.65% ± 1.99%72.57% ± 1.99%73.22% ± 1.96%
Biomass6.64% ± 0.62%6.50% ± 0.61%6.91% ± 0.64%6.77% ± 0.63%
Sawdust3.98% ± 0.38%3.35% ± 0.32%4.34% ± 0.43%3.93% ± 0.38%
Table 3. Commercial value of natural cork stoppers and by-products.
Cork Stopper Size/€ per kg
Item24 × 44 mm 26 × 44 mm
Cork stoppers53.8064.70
Co-products and by-products/€ per kg
Thin plank2.05
Granules1.45
Biomass0.06
Sawdust0.27
Table 4. Environmental impact allocation of product, co-products, and by-products.
Item24 × 44 mm Punching26 × 44 mm Punching24 × 44 mm Turning26 × 44 mm Turning
Cork stoppers82.49%84.29%82.05%82.60%
Co-products and by-products
Thin plank1.85%1.96%1.87%2.06%
Granules15.45%13.59%15.84%15.11%
Biomass0.06%0.05%0.06%0.06%
Sawdust0.16%0.12%0.18%0.15%
Table 5. Global environmental impact of natural cork stopper production (kg CO2 eq/kg).
24 × 44 mm26 × 44 mm
PunchingTurningPunchingTurning
Cork stop × 10 rs1.36 × 1001.43 × 1001.38 × 1001.49 × 100
Co-products and by-products
Thin plank3.05 × 10−23.25 × 10−23.16 × 10−23.72 × 10⁻²
Granul × 10 s2.54 × 10−12.76 × 10−12.19 × 10−12.73 × 10⁻¹
Biomass9.88 × 10−41.04 × 10−38.05 × 10−41.08 × 10⁻³
Sawdust2.63 × 10−33.13 × 10−31.93 × 10−32.71 × 10⁻³
Table 6. Environmental impact by phase (kg CO2 eq/kg of natural cork stoppers).
Punching Turning
OperationSize: 24 × 44 mmSize: 26 × 44 mmOperationSize: 24 × 44 mmSize: 26 × 44 mm
Phase 1: Initial Operations
Selection1.19 × 10−11.26 × 10⁻¹Selection1.22 × 10−11.39 × 10⁻¹
Boiling9.16 × 10−19.36 × 10⁻¹Boiling9.44 × 10−11.02 × 100
Resting/Drying1.16 × 10−11.23 × 10⁻¹Resting/Drying1.19 × 10−11.36 × 10⁻¹
Phase 2: Manufacturing
Cutting1.13 × 10−21.38 × 10⁻²Cutting 11.19 × 10−21.38 × 10−2
Punching1.49 × 10−21.84 × 10⁻²Turning2.02 × 10−22.59 × 10⁻²
Cutting 22.34 × 10−22.91 × 10−2
Parting off3.48 × 10−34.64 × 10⁻³Parting off3.51 × 10−34.45 × 10⁻³
Grinding2.31 × 10−22.88 × 10⁻²Grinding2.24 × 10−22.77 × 10⁻²
Shaving3.24 × 10−34.11 × 10⁻³Shavings selection3.09 × 10−33.94 × 10⁻³
Polishing3.61 × 10−34.54 × 10⁻³Polishing3.42 × 10−34.35 × 10⁻³
Optical selection2.22 × 10−32.84 × 10⁻³Optical selection2.09 × 10−32.71 × 10⁻³
Visual selection1.98 × 10−32.52 × 10⁻³Visual selection1.85 × 10−32.41 × 10⁻³
Final wash8.59 × 10−29.87 × 10⁻²Final wash8.40 × 10−29.82 × 10⁻²
Phase 3: Final Operations
Ink printing2.85 × 10−33.24 × 10⁻³Ink printing2.53 × 10−33.14 × 10⁻³
Siliconizing5.78 × 10−36.80 × 10⁻³Siliconizing5.55 × 10−36.66 × 10⁻³
Waxing8.50 × 10−31.01 × 10⁻²Waxing8.20 × 10−39.88 × 10⁻³
Drying1.22 × 10−31.47 × 10⁻³Drying1.15 × 10−31.42 × 10⁻³
Packaging1.91 × 10−32.30 × 10⁻³Packaging1.80 × 10−32.21 × 10⁻³
Construction and Demolition of Building Infrastructures and Machinery Manufacturing and Maintenance
1.51 × 10−21.54 × 10−2 1.50 × 10−21.51 × 10−2
Publisher’s Note: MDPI stays neutral with regard to jurisdictional claims in published maps and institutional affiliations.

