Article

Urbanization and Grain Production Pattern of China: Dynamic Effect and Mediating Mechanism

1
College of Economics and Management, Northwest A & F University, Xianyang 712100, China
2
Center for Resource Economics and Environment Management, Northwest A & F University, Xianyang 712100, China
3
School of Economics, Hebei University, Baoding 071000, China
4
Research Center of Resources Utilization and Environmental Conservation, Hebei University, Baoding 071000, China
*
Author to whom correspondence should be addressed.
Agriculture 2022, 12(4), 539; https://doi.org/10.3390/agriculture12040539
Submission received: 24 February 2022 / Revised: 4 April 2022 / Accepted: 8 April 2022 / Published: 9 April 2022
(This article belongs to the Section Agricultural Economics, Policies and Rural Management)

Abstract

:
The flow and reallocation of agricultural production factors induced by urbanization play an important role in the changes of the grain production pattern (GPP). Using provincial panel data from 1996 to 2018 in China as the research sample, the center of gravity transfer–standard deviation ellipse model was applied to understand the change characteristics of GPP. Next, a dynamic spatial panel econometric model was established to test the impact of urbanization on GPP, and a spatial mediated effect model was used to identify the mediated transmission paths played by cropland utilization, planting structure adjustment, and agricultural technology progress in this impact process. The main conclusions showed that (1) the grain production COG of China transferred to the northeast, gradually resulting in a spatial pattern from the northeast to the southwest; (2) the urbanization process has a significant negative impact on the GPP, with each unit increase in urbanization resulting in a 0.30% decrease in the grain production concentration index; (3) cropland utilization, planting structural adjustment, and agricultural technology progress play significant mediating roles in the impact of urbanization on the GPP, and their mediating effects can weaken the direct negative impact of urbanization, among which the mediating effect of planting structure adjustment is the highest (13.9%). The study findings provide a new perspective for further understanding the relationship between urbanization and grain production pattern and also provide theoretical references and practical insights for improving the allocation efficiency of agricultural production factors and formulating scientific regional planning policies for grain production in the high-quality transformation of urbanization.

1. Introduction

As China’s economic development entered a new normal, the quantity-oriented extensive growth shifted to quality-oriented intensive development. Urbanization and food security are undoubtedly the driving force and basic guarantee of China’s high-quality economic transformation. Although China is currently well capable of securing the supply of grain and important agricultural products, food security remains a deep concern for the Chinese government. With the progress of reform and opening up, the regulatory policies limiting rural population’s employment in urban areas were gradually relaxed, and a large number of rural laborers moved to urban areas for employment, which stimulated the momentum of China’s urbanization, leading China into an unprecedented rapid urbanization process [1]. The urbanization rate measured by the urban resident population increased from 17.92% in 1978 to 60.60% in 2019, while grain production increased from 304,765,000 tons to 663,840,000 tons. In reality, the progress of urbanization has not led to a proportional decrease in grain production, and grain supply has shifted from a long-term shortage to a basically balanced level [2]. However, the imbalanced progress of urbanization has caused a significant imbalance in grain self-sufficiency between regions in China [3] and significant changes in the spatial pattern of grain production, as evidenced by the decreasing proportion of grain production in the south and the increasing proportion in the north. With the grain production proportion rising from 40.90% in 1978 to 59.15% in 2019, the north has fully surpassed the south in grain production, resulting in the spatial pattern transformation from “southern grain to the north” to “northern grain to the south” [4,5].
Ensuring food security is an important guarantee for the promotion of urbanization. Under the dual urban–rural institutional structure, the conflicts and contradictions among different types of land use mean that the urbanization expansion requires urban land to spread to rural areas, and the rural labor force will gradually shift and flow to urban areas according to certain industries (agricultural sector → non-agricultural sector) and locations (rural areas → small towns → small and medium cities → big cities), meaning that the reduction of cropland and population flow caused by urbanization expansion can directly act on grain production [6], triggering the adjustment of the input structure of production factors and resulting in the loss of cropland and structural shortage of labor, leading to the non-agricultural transformation of cropland [7]. In an open market environment, farmers in different regions face a reduction in cropland and changes in farming labor, which will force farmers to adjust their cropland utilization according to the rise in production costs and changes in expected returns, either by increasing the intensity of factor inputs and adjusting the planting structure to improve unit output and returns or by directly abandoning the land and resorting to land circulation. At the macro level, the urbanization process has accelerated the spatial flow of production factors and the agricultural technology progress [8]. As a result, the intensity and allocation of factor inputs on the stock of cropland have been altered, triggering changes in the cropland utilization in different regions. The upgrades to the industrial structure and rising production costs have eliminated the comparative advantages of grain production in regions with high urbanization levels, and the proportion of grain production has gradually decreased. In short, this is the result of self-balancing between different grain planting behaviors and cropland utilization by micro-farmers in different regions facing urbanization and socioeconomic and institutional constraints, which at the macro level manifests itself in the spatial imbalance of grain production pattern (GPP) triggered by the regional endowment characteristics of grain production and the spatial flow of factors [9]. Thus, the effect of urbanization on GPP and the paths of those effects are of interest in academic circles. Answering these questions could, on the one hand, help us to further understand the relationship between urbanization and GPP and, on the other hand, provide important theoretical reference for stabilizing China’s grain production, grasping the development of the grain production pattern, and formulating scientific grain production policies during the high-quality transformation of urbanization. In the meantime, China’s experience in rapid urbanization and steadily increasing grain production could also provide lessons for the United Nations to achieve the sustainable development goals of poverty and hunger eradication.
Since 1995, scholars have shifted their focus to the changes in characteristics of the GPP and concluded that the center of grain production in China has gradually transferred northward through either qualitative or quantitative methods [10,11,12]. More attention was paid to the causes behind the northward transfer of the grain production center. Most of the existing studies investigating the effects of natural and socioeconomic factors such as cropland endowment [13], technological progress [14], economic growth [15], natural conditions [16], and agricultural policies [17] on the GPP have been based on the analysis of the spatial characteristics of the changes in the grain production pattern. Zheng et al. [18] found that the shift from southern grain to the north to northern grain to the south in China occurred in the mid-1980s due to the difference in the comparative advantages of grain production in the regional economic development of the south and the north during the market-oriented reform, where farmers reallocated, their resources mainly based on the relative prices and comparative returns of factors. In contrast, most of the existing studies on the relationship between urbanization and grain production explored dimensions such as food security [19,20], technical efficiency of grain production [21,22], and rural labor outflow [23,24]. Thus, studies exploring changes in the GPP from the urbanization perspective are still lacking. A study by Yang et al. [14] based on the county perspective found distinct spatial regional pattern characteristics in China’s grain production. Farmers in regions with rapid urbanization have been mostly engaged in industries with higher income than agriculture, resulting in grain production declining, especially in the southern coastal regions.
There is a rich body of literature on the causes of changes in the GPP. However, there an in-depth understanding the effects of urbanization—one of the direct causes of cropland reduction—on the GPP and its action path is still lacking, which warrants further theoretical and econometric tests. Firstly, most of the existing studies have demonstrated the direct effect of urbanization on the GPP, while the changes in the GPP were path-dependent in the time dimension and did not occur overnight. Thus, the time cumulative effect must be considered when analyzing the causes of changes in the GPP. Secondly, the cross-regional flow of rural labor and agricultural machinery services in the urbanization process resulted in spatial spillover effects of grain production between regions, which necessitated the consideration of the spatial lag effects in the analysis of the changes in the GPP. Thirdly, the action path of urbanization on GPP is still unclear, and a comprehensive theoretical framework is required to identify the intermediary transmission paths between the two.
In order to clarify the impact of urbanization on the GPP and its action path, this study characterized the GPP by the grain production concentration index (GPCI) [11] based on panel data of 30 provinces in China from 1996 to 2018 and incorporated urbanization and GPP in an explanatory framework. Upon understanding the spatiotemporal evolution characteristics of the GPP, a dynamic spatial panel econometric model considering the path-dependence and spatial spillover effects of the GPP was built to test the direction and extent of the effect of urbanization on the GPP. Then, the spatial mediating effect model was established to identify the transmission paths by which urbanization affected the GPP from the perspective of changes in mediation factors such as agricultural technology progress, cropland utilization, and planting structure. The differences in the mediation effects of different factors were compared. The above research can help us to further understand the effects of urbanization on the GPP and its action path and provide a theoretical basis and practical reference for realizing balanced coordination and sustainability between urbanization and changes in the GPP.

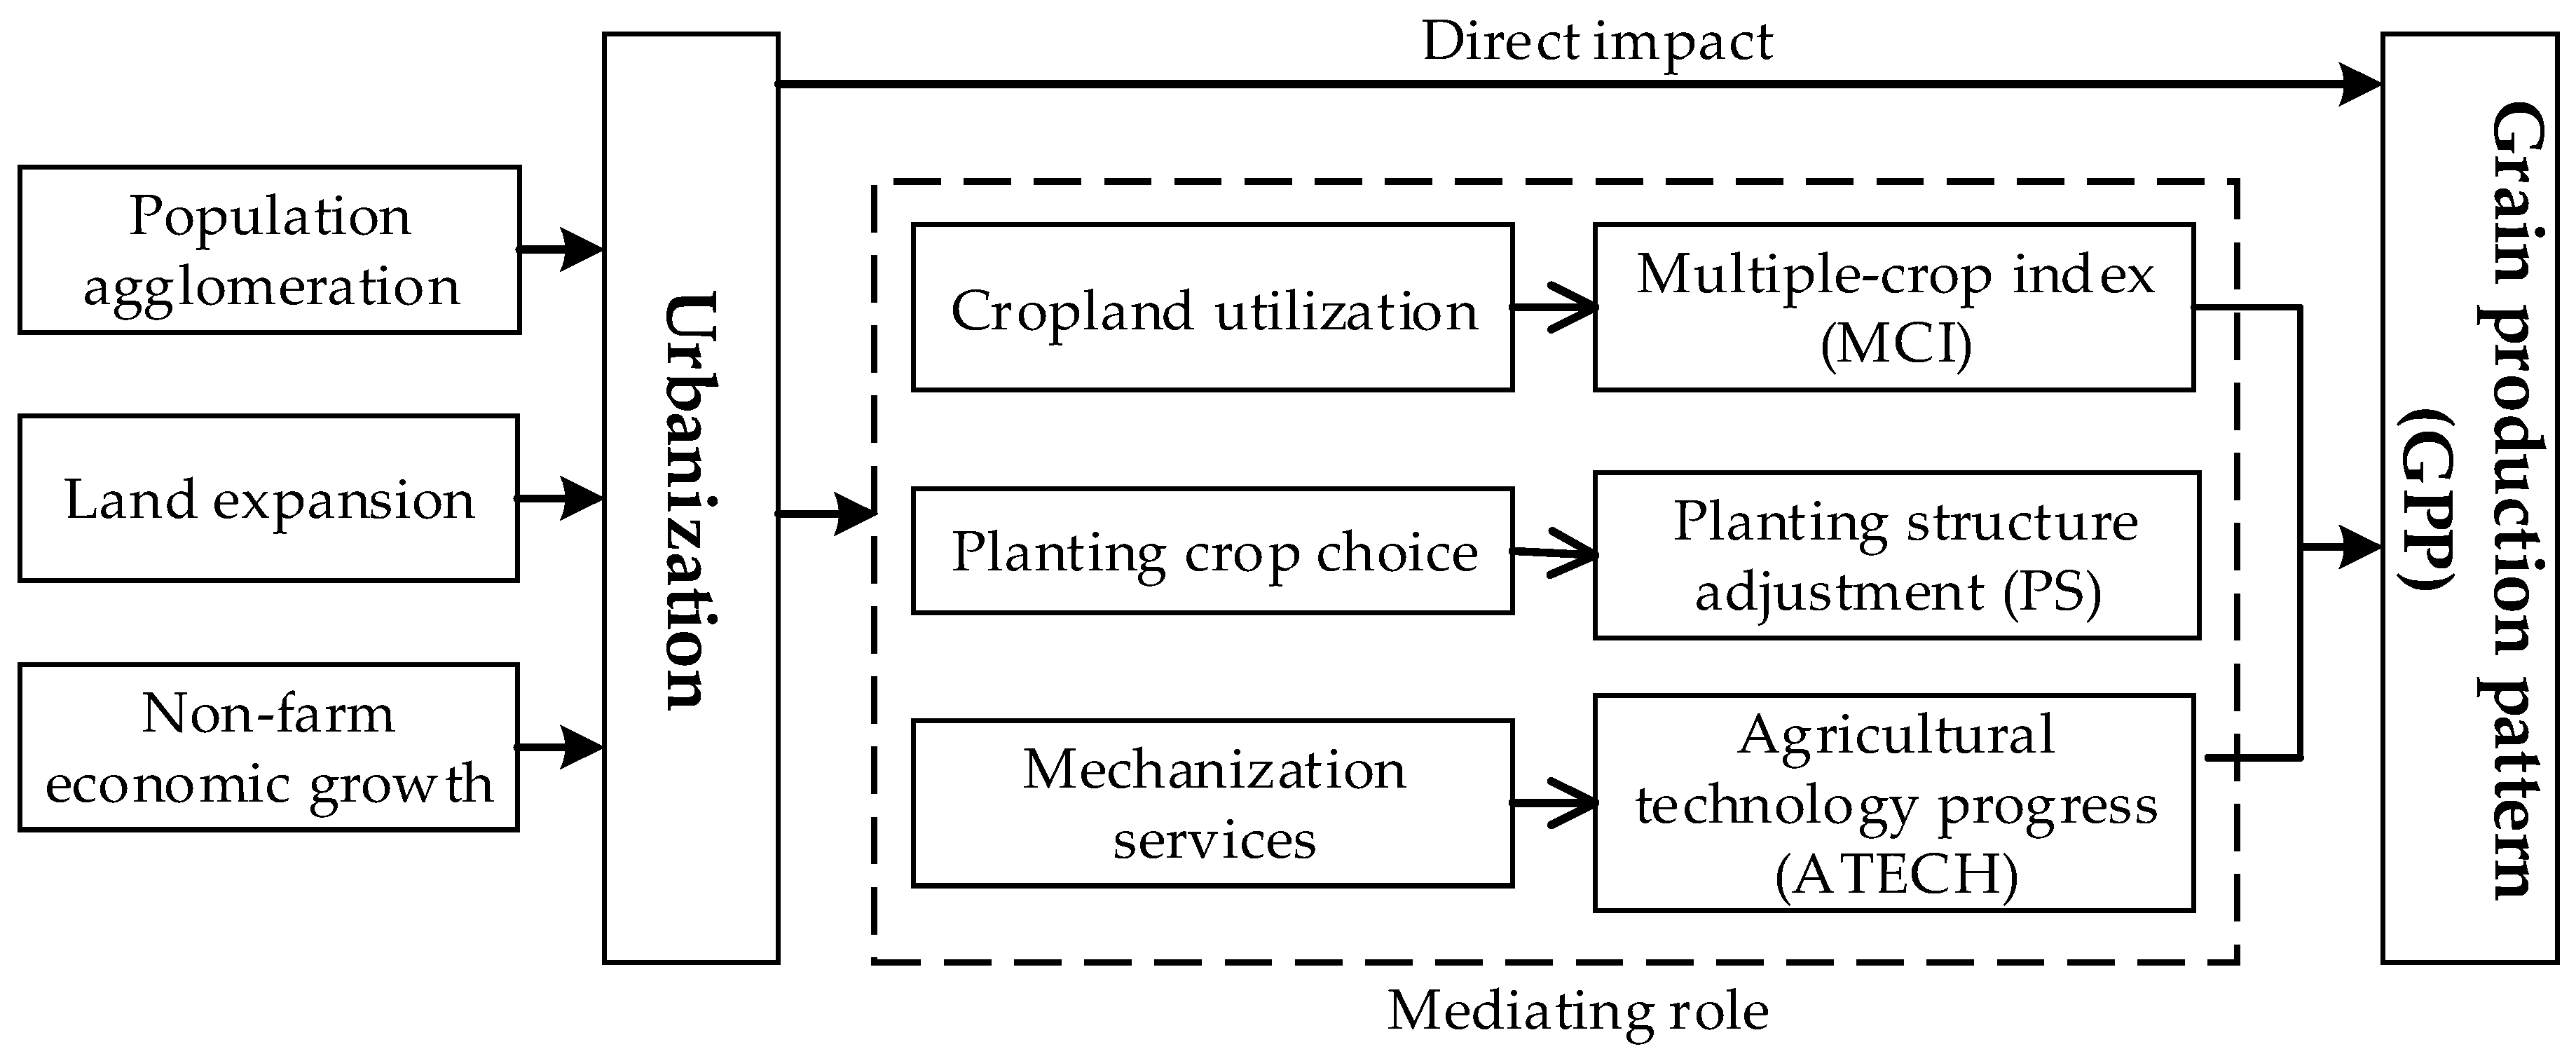
2. Theoretical Analysis and Hypothesis

Urbanization is a process of changes in social structure, spatial structure, and economic structure, which is intuitively manifested by the movement of population to cities and towns, the transformation of agricultural land into construction land, and the resulting changes in industrial structure. Under the dualistic urban–rural institutional structure, the migration and agglomeration of rural population to urban areas constitutes the main driving force for urbanization in China [25]. However, the limited urban land area inevitably limits the population carrying capacity. As a result, the urban land boundaries extend continuously from the suburban areas to the rural hinterland. In academic circles, the GPP is often characterized by the grain production concentration index (GPCI), which is the share of grain production in a region [11]. As the material basis for grain production, cropland resources can be reallocated and adjusted due to urbanization and converted to industrial or urban construction land with the expansion of cities and towns [26], resulting in the withdrawal of cropland resources and fluctuations in grain supply and changes in the GPP. Despite the policy of balancing land occupation and compensation in urbanization, which aimed to protect cropland, the quality of cropland is often reduced due to insufficient or neglected compensation for occupied cropland. Changes in the quantity and quality of cropland in different regions inevitably lead to differential fluctuations in grain production and trigger changes in the GPP. The consequent scarcity of cropland also drives up the cost of grain production, which reduces the incentives of farmers to engage in grain production. These rigid constraints on cropland and labor may be detrimental to grain production [27]. Urbanization also has an impact on the ecological environment, and this environmental impact on agriculture is mainly manifested in pollution and destruction to water bodies, soil, and other ecosystems of farmland, and these negative environmental externalities may have a negative impact on local grain production [28]. In addition, urbanization also comes with industrial structure upgrades that promote the flow of factors and resources to secondary and tertiary industries. As a result, the factor inputs in the agricultural sector are restructured, and farmers are less likely to plant grains in cropland, which is also detrimental to regional grain production. In conclusion, the constraining effect of urbanization on grain production inevitably affects the GPP and decreases the GPCI. Therefore, the following hypothesis can be formulated.
Hypothesis 1 (H1).
Urbanization can directly and negatively affect GPP—i.e., urbanization decreases the GPCI.
The reduced cropland due to urbanization, on the one hand, leads to changes in the cropland utilization manifested as the reallocation of input intensity and the structure of production factors, triggering fluctuations in the multiple-crop index (MCI). On the other hand, facing a rise in production cost, farmers must choose to continue planting grain, planting non-grain crops, or abandoning farming for land circulation, thus triggering a change in planting structure (PS). In addition to the changes in agricultural production methods, urbanization also contributes to the advancement of agricultural technology (ATECH). At the macro level, urbanization affects the GPP mainly through the reallocation effect of cropland utilization, the structural effect of planting choices, and the progress effect of agricultural technology. Specifically, the indirect effect mechanism of urbanization on GPP is mainly reflected in the following transmission paths (Figure 1).
The purpose of cropland utilization is to improve the output and economic efficiency of cropland based on its stock by redistributing production factor inputs and tapping the potential of cropland utilization [29]. The reduction of cropland directly changes the intensity and structure of farmers’ production factor inputs and resource inputs. Farm households of different sizes have significantly different value orientations and intensification preferences on cropland utilization [30]. Due to climatic conditions, the planting and cropping system is difficult to change in the short term. The reduction of cropland and farmers’ choices could change the extent and potential of cropland utilization. Facing decreases in cropland, the farming practices and cropland utilization adopted by farmers of different regions vary due to the regional heterogeneity of endowment conditions, mainly manifested as regional differences in the MCI [31], which is also the result of farmers’ choices in the face of various economic, social, and institutional constraints. Farmers in regions rich in cropland resources could redistribute production funds and factor inputs by adjusting the intensity and structure of production material factor inputs such as chemical fertilizers, pesticides, and agricultural films per unit area of cropland. They may also increase the planting area through hedging and intercropping, thus raising the MCI and improving agricultural production conditions. Farmers in regions with poorer cropland resources often face difficulties in achieving the scale effect, and their willingness to engage in grain production is often reduced. As a result, the likelihood of their abandoning farming and resorting to land circulation increases, leading to a decrease in the MCI. Changes in the cropland utilization, as characterized by MCI, lead to regional variability in grain production, which in turn affects the GPP. Therefore, the following hypothesis can be formulated.
Hypothesis 2 (H2).
Urbanization affects GPP through changes in the MCI—i.e., cropland utilization plays a mediating role.
The planting structure (PS) represents the proportion of grain crops in all crops planted. Urbanization promotes the flow of labor. Facing changes in the comparative returns of planting grain crops due to rising production costs, grain farmers must choose between planting grain crops or non-grain crops, which in turn leads to changes in the PS. On the one hand, the increase in non-farm employment opportunities brought about by urbanization contributes to the increase in the income level of rural residents. As a result, food consumption shifts and is upgraded from a focus on sustenance to a focus on food safety and nutrition, which is manifested as a decrease in the direct market consumption of food products and a strong demand for high value-added agricultural products. Thus, changes in the demand structure of agricultural products lead to adjustments in the production structure [2]. On the other hand, the micro-level changes in the GPP are the results of farmers’ active choices. Since the rising cost of planting grain crops reduces the comparative returns of grain production and cash crops have higher comparative returns, rational farmers would adjust their farming behavior and planting structure in response to market demand and price changes, thus increasing the possibility of planting non-grain crops. Adjustments in the PS may negatively affect the proportion of grain production in a region, gradually contributing to changes in the GPP. Therefore, the following hypothesis can be formulated.
Hypothesis 3 (H3).
Urbanization affects GPP through PS—i.e., planting structure adjustment plays a mediating role.
Due to cropland and labor constraints on grain production brought by the rapid urbanization and the advancement of agricultural market reforms, farmers are enticed to improve land productivity and labor productivity through agricultural technology progress. Agricultural technology progress (ATECH) is mainly achieved through independent technology innovation and technology transfer from non-agricultural industries. Urbanization facilitates the transfer of technology from urban to rural areas and from non-agricultural industries to agriculture, mainly in the form of large-scale agricultural production and the popularization of mechanized operations. The outflow of the prime-age labor force and feminization and aging trends have changed the size and structure of the labor force [32]. The application of fertilizers, pesticides, and agricultural films and other farming operations have undergone a transformation from manual labor to mechanization services. Thus, rural labor is effectively substituted, and farmers can achieve larger-scale grain production with less labor. In addition, the application and popularization of various new technologies such as breeding technology and water-saving irrigation technology in grain production are mostly implemented through mechanized means, but the technological progress of seeds themselves is difficult to quantify. Overall, ATECH can be characterized by the popularization of mechanization services. However, the heterogeneity in endowment conditions such as topography has resulted in prominent regional imbalances in the ATECH induced by urbanization [33]. As a result, the effects on grain production differ in different regions, which in turn triggers changes in the GPP. Therefore, the following hypothesis can be formulated.
Hypothesis 4 (H4).
Urbanization affects GPP through ATECH—i.e., agricultural technology progress plays a mediating role.

3. Materials and Methods

3.1. Methodology

3.1.1. Urbanization Assessment: Entropy Method

As a typical objective weighting method, the entropy method can make full use of the information value index contained in each index to measure its contribution to the comprehensive evaluation results, thereby effectively overcoming the information overlap and subjective bias between variables [34] with high accuracy and reliability. The magnitude of the entropy value is the variability of each indicator, and the weight of each indicator can be calculated according to the entropy value [35].
First, the indicators need to be standardized. Due to the difference in dimensions among indicators, the indicators can only be comparable after standardization. The extreme difference method is used to standardize, the judgment matrix of the index data {Xij}m×n is constructed, and Xij is the index value of the j-th item in the i-th region.
Positive   indicators :   X i j = x i j min ( x i j ) max ( x i j ) min ( x i j )
Negative   indicators :   X i j = max ( x i j ) x i j max ( x i j ) min ( x i j )
Second, the specific entropy method calculation process is as follows:
P i j = X i j i = 1 n X i j ;   e j = k i = 1 n P i j ln P i j ;   d j = 1 e j
ω j = d j j = 1 m d j ;   U i j = ω j P i j ;   U i = j = 1 m U i j
In the above equation, Pij is the proportion of the j-th indicator in the i-th region to the sum of the indicators. ej is the entropy value of the j-th indicator; if xij is equal for a given j, then Pij = 1/n, at which ej takes the maximum value; i.e., e j = k i = 1 n ( 1 n ) ln ( 1 n )   = k ln m , and let k = 1 / ln ( n ) > 0 , then 0 e j 1 . dj is the redundancy of information entropy, ωj is the weight of each indicator, Uij is the score of individual indicators, and Ui is the comprehensive assessment index of urbanization in the i-th region.
Considering the advantages of the entropy method in indicator weighting, this paper therefore assigns weights to different dimensional indicators by the entropy method and comprehensively evaluates the level of urbanization.

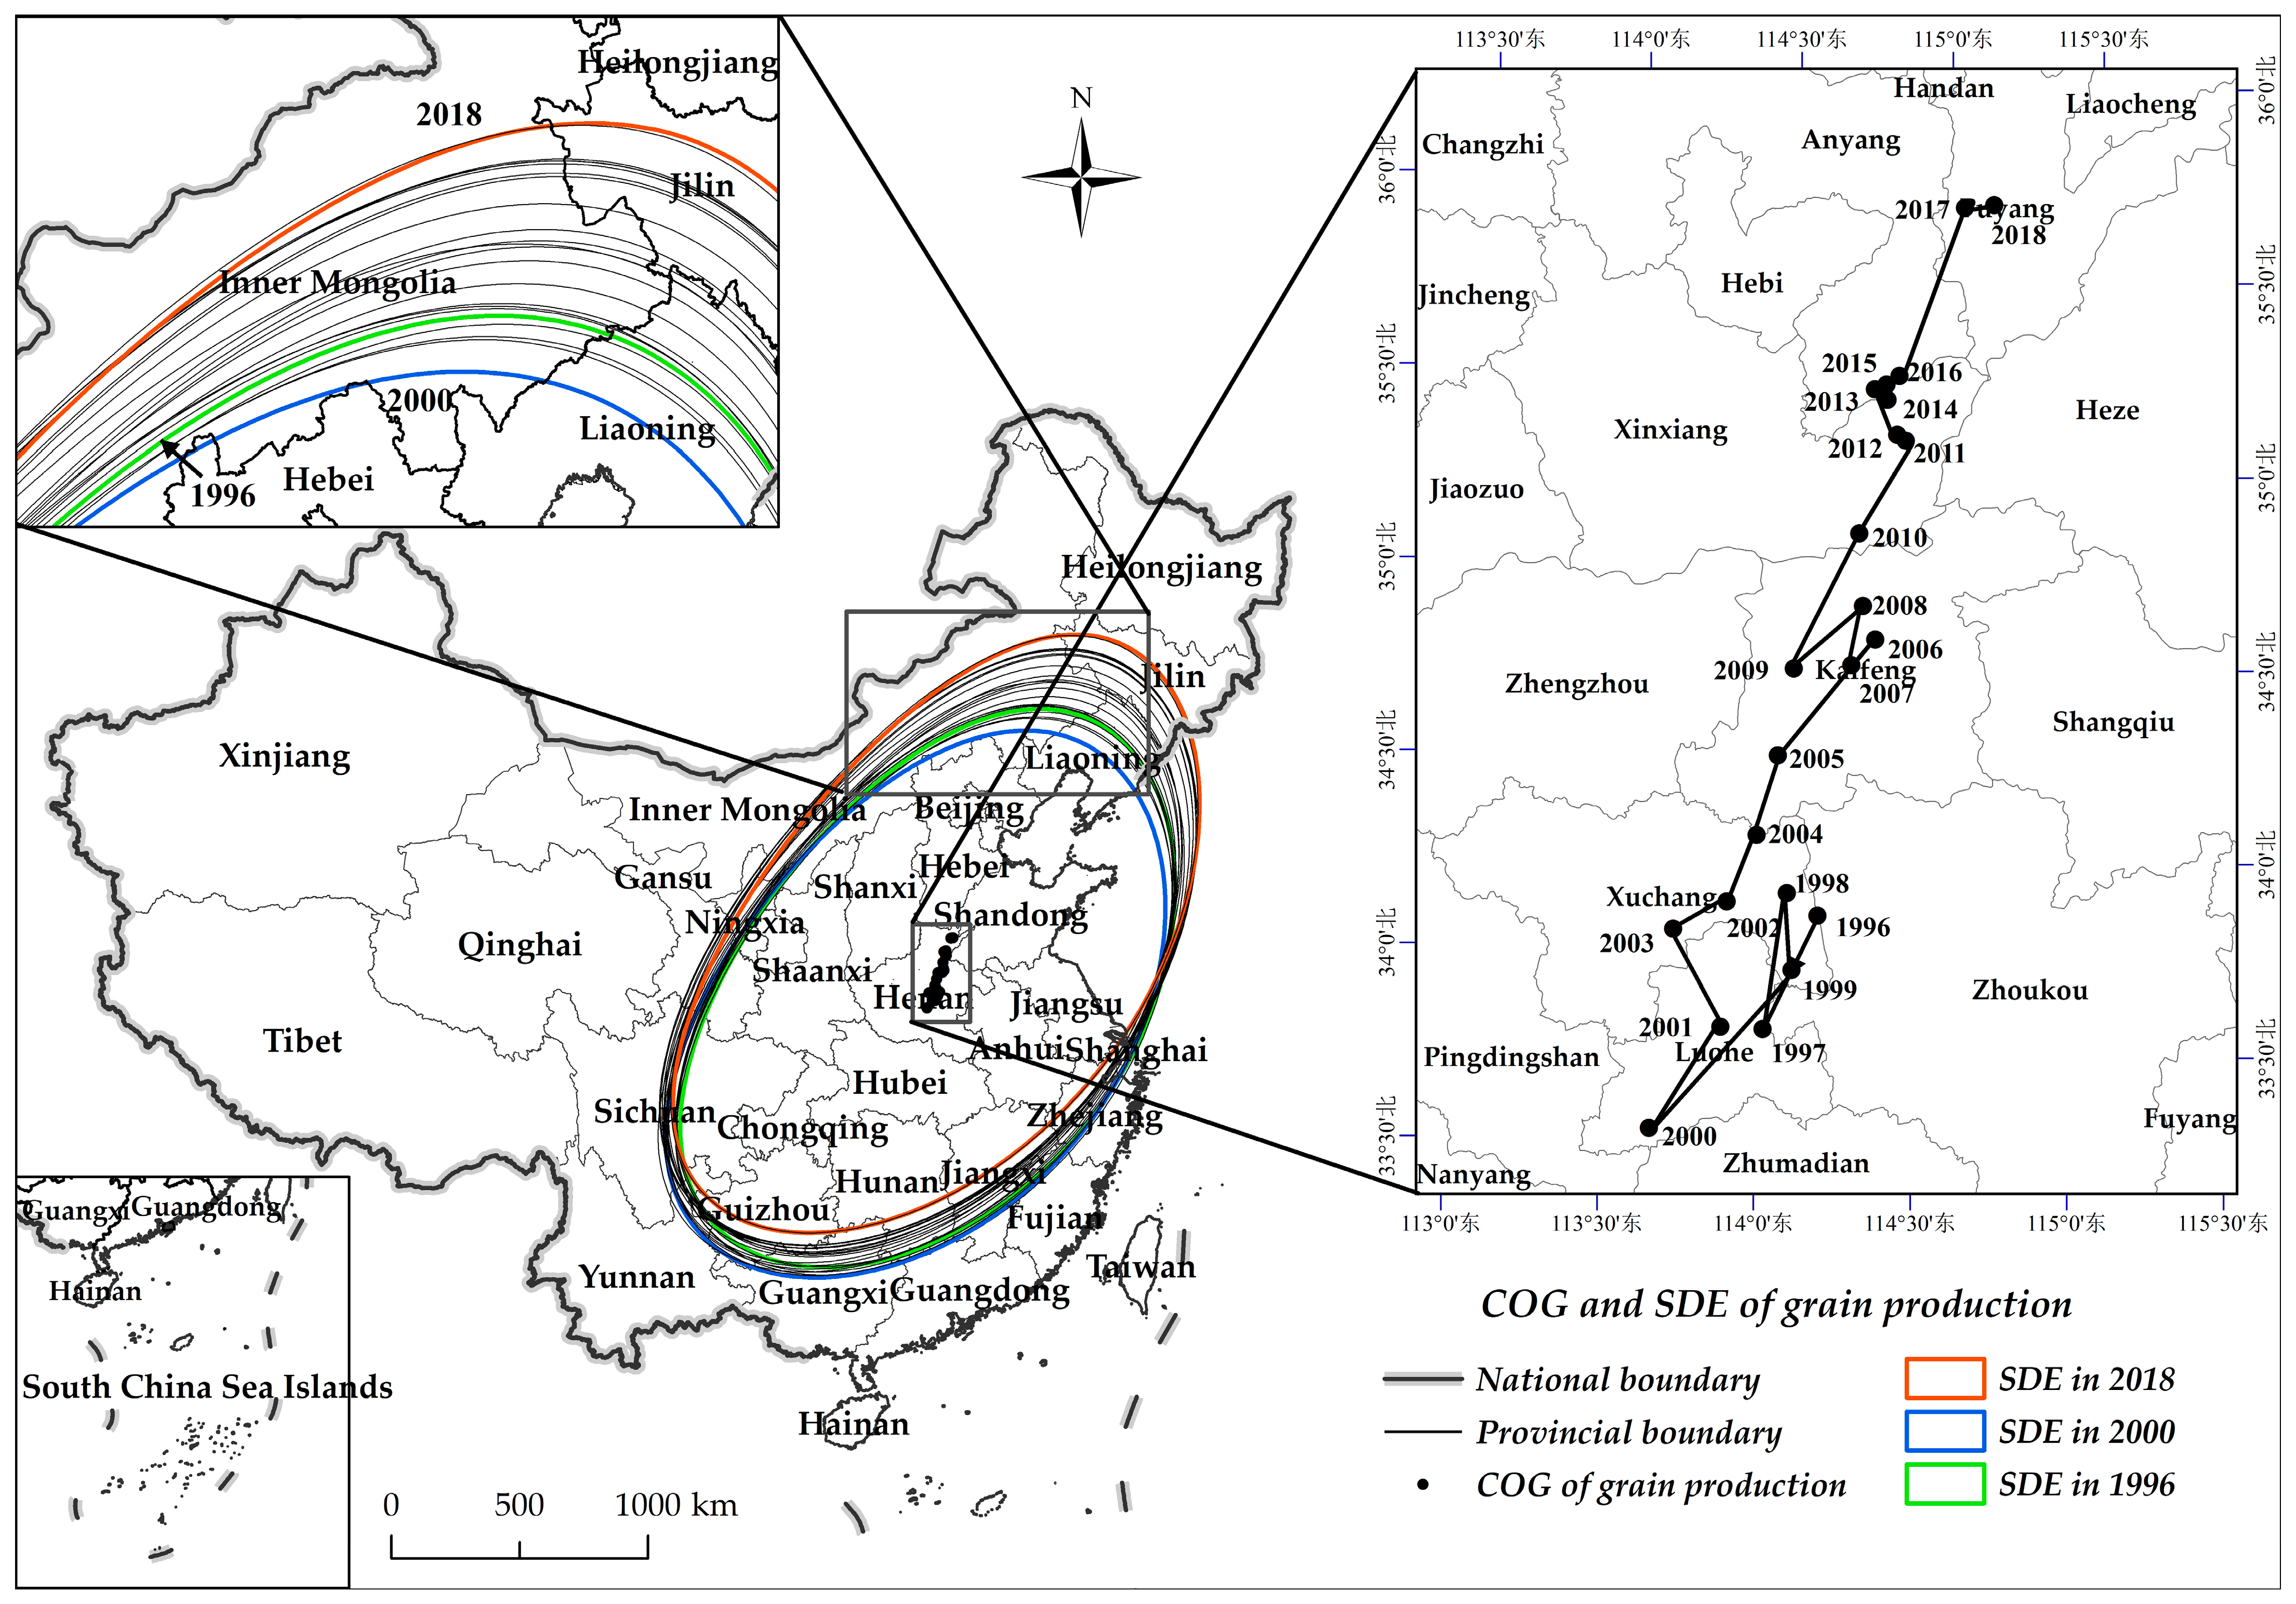
3.1.2. Standard Deviational Ellipse–Center of Gravity Model (SDE-COG)

The standard deviational ellipse (SDE) is an effective tool that is capable of accurately revealing the overall spatial distribution characteristics of geographical elements [36,37]. The SDE describes the spatial distribution characteristics of geographic elements and their spatiotemporal evolution from a global and spatial perspective through a spatial ellipse with the center, major axis, minor axis, and azimuth as the basic parameters [36]. An SDE is established with the center of gravity (COG) of the geographic element distribution as its center, the direction of the main distribution trend as the azimuth (the angle between the major axis and due north), and the standard deviation of the elements in the X and Y directions as the ellipse axes. By constructing ellipses of the spatial distribution of geographic elements, the characteristics of centrality, directionality, and spatial distribution patterns of geographic elements can be described and explained [37]. The center of the SDE marks the relative position of the spatial distribution of an economic phenomenon on the two-dimensional plane—i.e., the COG of its spatial distribution. The SDE can reflect the trajectory and spatial characteristics of the COG of grain production concentration index in a region and offer more intuitive information on the development direction of grain production COG. The main parameters of the SDE-COG model are calculated as follows:
X = i = 1 n ω i x i / i = 1 n ω i ,   Y = i = 1 n ω i y i / i = 1 n ω i
σ x = i = 1 n ( ω i x i cos θ ω i y i sin θ ) 2 / i = 1 n ω i 2 ,   σ y = i = 1 n ( ω i x i sin θ ω i y i cos θ ) 2 / i = 1 n ω i 2
tan θ = ( ( i = 1 n ω i 2 x i 2 i = 1 n ω i 2 y i 2 ) + ( i = 1 n ω i 2 x i 2 i = 1 n ω i 2 y i 2 ) 2 4 i = 1 n ω i 2 x i 2 y i 2 ) / 2 i = 1 n ω i 2 x i y i
where ( X , Y ) are the COG coordinates of GPCI, ( x i , y i ) are the spatial coordinates of the study area, ( x i , y i ) are the coordinates of each area relative to the regional COG, ω i is the weight, σ x , σ y are the standard deviation along the x and y axes, respectively, and θ is the ellipse azimuth—the angle between the major axis and due north. In addition, the distance of COG transfer can be measured as follows:
D α β = k × ( x i α x i β ) 2 + ( y i α y i β ) 2
where D α β is the grain production COG transfer distance (km) from year α to year β , ( x i α , y i α ) and ( x i β , y i β ) denote the geographic coordinates of COG transfer over time, and k is the coefficient of conversion from Earth surface coordinate units (degrees) to plane distance (km), generally equal to 111.111 km.

3.1.3. Dynamic Spatial Panel Econometric Model

The change of GPP is a dynamic and cumulative process, and there is also an obvious path dependence and inertia effect of regional grain production, which is not only related to the current period grain production but also influenced by the previous period’s grain production, so the econometric model setting needs to consider the previous period’s GPP. In addition, although the agglomeration of grain production between regions is constrained by geographical and natural conditions, in socioeconomic terms, the increasingly frequent spatial correlation of production factors such as labor force transfer and cross-area operation of mechanization services makes it possible for grain production in one region to influence grain production in neighboring regions through the demonstration and spillover effects of factor flows [38]. It is necessary to test the impact of urbanization on GPP under the perspective of spatial correlation. So, the dynamic spatial panel econometric model is used for empirical testing, which can not only effectively deal with the endogenous problem caused by other variables besides the dependent variable time lag term and spatial lag term but also can significantly reduce the bias of the spatial lag coefficient, which can effectively compensate for the defects of the basic spatial econometric model [39]. The basic models of spatial econometrics mainly include the Spatial Lag Model (SLM) and Spatial Error Model (SEM), where the SLM examines the spatial spillover effect arising from the spatial dependence of dependent variable, and the SEM examines the spillover effects caused by the shocks of the error terms in neighboring regions to the region [40]. Considering the above, the dynamic spatial econometric models set in this paper are as follows:
SLM :   ln G P P i t = α + θ ln G P P i t 1 + ρ W ln G P P j t + β U R B A N i t + σ c o n t r o l + μ i + ω t + ε i t
SEM :   { ln G P P i t = α + θ ln G P P i t 1 + β U R B A N i t + σ c o n t r o l + μ i + ω t + ε i t ε i t = λ W ε j t + φ i t
Equations (9) and (10) are the spatial lag form and spatial error form of the dynamic spatial panel model, respectively. i is province, t is year, lngrain is the explained variable, which represents the grain production pattern (GPP), expressed as the natural logarithm of the percentage of grain production concentration index (GPCI), lngrainit-1 is the time lag term, WlnGPPit is the spatial lag term, and W is the spatial weight matrix. URBAN is the comprehensive urbanization level measured based on the entropy method, which is the core explanatory variable of this paper; 𝛼 is a constant term; Σcontrol represents a collection of control variables; μi is the individual fixed effect; ωt is the time fixed effect; εit, φit are the random error term of white noise, and the others are the variable parameters to be estimated; and ρ and λ are the coefficients of the spatial lag term and spatial error term, respectively.
The parameter estimation methods of dynamic spatial models mainly include the generalized method of moments (GMM), unconditional maximum likelihood estimation (ML), and bias-corrected LSDV method, and the GMM also includes Diff-GMM and Sys-GMM [41]. It should be considered that the dynamic spatial panel model includes both the time-lagged term and the spatial-lagged term of the dependent variable, which may cause estimation bias and endogeneity. The system generalized method of moments (Sys-GMM) can select appropriate instrumental variables from the time trends of the variables, avoiding the inappropriate selection of external instrumental variables [42], thus increasing the efficiency of estimation, and has a smaller finite sample bias and a more prominent advantage of parameter estimation. Therefore, in this paper, Sys-GMM is used for parameter estimation.
Specifically, Sys-GMM requires the Arellano–Bond serial correlation test and Sargan overidentification test for the estimation results in order to ensure that the moment conditions are not over-constrained and the number of instrumental variables cannot exceed the number of endogenous variables [43]. The null hypothesis of the AR (2) test is that there is no second-order sequence correlation in the residual series of the difference equation, and if the p-value is greater than 0.1, it means that the null hypothesis is accepted at a 10% significance level; that is, there is no second-order serial correlation in the residual series of the difference equation. The null hypothesis of the Sargan test is that all instrumental variables are valid, and if the p-value is greater than 0.1, the null hypothesis is accepted at a 10% significance level.

3.1.4. Spatial Mediating Effect Model

Drawing on the study of Wen et al. [44], and considering the time inertia effect and spatial dependence effect of the change in GPP, the time lag term and spatial spillover term of the explained variable were introduced into each path established to construct a spatial mediating effect model to examine the transmission mechanism of urbanization affecting GPP [45]:
ln G P P i t = α 0 + θ 0 ln G P P i t 1 + ρ 0 W i j ln G P P j t + β U R B A N i t + σ 0 c o n t r o l + μ i + ω t + ε i t
M i t = α 1 + θ 1 M i t 1 + ρ 1 W i j M j t + β U R B A N i t + σ 1 c o n t r o l + μ i + ω t + ε i t
ln G P P i t = α 2 + θ 2 ln G P P i t 1 + ρ 2 W i j ln G P P j t + η M i t + β U R B A N i t + σ 2 c o n t r o l + μ i + ω t + ε i t
A common method for determining a mediating effect is the stepwise test proposed by Baron and Kenny [46], with the following test steps.
Firstly (Equation (11)), we test the direct effect of urbanization on the GPP, and if the coefficient of urbanization is significant, it indicates that urbanization affect the GPP and can be followed by the presence of a mediating effect.
Secondly (Equation (12)), we use the mediating variable (Mit) as the explanatory variable to test the effect of urbanization on each mediating variable, and if the coefficients of urbanization are all significant, then urbanization can have an impact on the mediating variables. The mediating variables (Mit) include cropland utilization (MCI, multiple-crop index), planting structure (PS), and agricultural technology progress (ATECH).
Thirdly (Equation (13)), we test the effects of urbanization and each mediating variable (Mit) on the GPP: if the coefficients of both urbanization and Mit are significant, it indicates that the existence of partial mediating effect—i.e., both direct and indirect effects—while if the coefficient of urbanization is not significant, it indicates the existence of only an indirect effect, at which point it is a full mediating effect.

3.2. Variable Selection and Data Sources

3.2.1. Variable Selection

(1)
Explained variable: grain production pattern (GPP). The macro-scale changes in the GPP are usually characterized by the grain production concentration index (GPCI), which represents the contribution of a region’s grain production to the national total—i.e., the percentage of a region’s grain production in the national total. The calculated concentration index also reflects the changing standing of a region’s grain production in the country through time-series changes [11,14].
(2)
Core explanatory variable: urbanization (URBAN). Urbanization is a comprehensive system that includes multidimensional features such as population size, land expansion, spatial carrying capacity, economic growth, and living standards. By referring to existing studies, relevant indicators were selected from five dimensions, including population, land, space, economy, and livelihood [47]. Specifically, population urbanization was characterized by the urbanization rate of the resident population. Land urbanization was characterized by the area of built-up urban regions. Spatial urbanization was characterized by urban population density. Economic urbanization was characterized by the proportion of non-agricultural industries in the GDP. Social urbanization was characterized by urban road area per capita. In this paper, the indicators are assigned weights and evaluated comprehensively for urbanization by the entropy method.
(3)
Mediator variables
a.
Cropland utilization. Characterized by the multiple crop index (MCI), cropland utilization was calculated as the ratio of grain crop planting area to the total cropland area [26].
b.
Planting structure (PS). As the indicator of agricultural production restructuring, the PS was represented as the ratio of grain crop planting area to the total crop planting area [48].
c.
Agricultural technology progress (ATECH). Mechanization services effectively substitute the labor factor and reflect technological progress and intensive cropland utilization [49]. In this paper, the comprehensive mechanization rate of tillage, sowing, and harvesting of grain crops was used as a substitution variable for ATECH. Comprehensive mechanization rate = mechanized tillage rate × 40% + mechanized sowing rate × 30% + mechanized harvesting rate × 30%. Here, the mechanized tillage rate is the ratio of mechanized tillage area to total cropland area. The mechanized sowing rate is the ratio of mechanized sowing area to total sowing area. The mechanized harvesting rate is the ratio of mechanized harvesting area to total sowing area. The comprehensive mechanization rate is expressed in the form of a percentage.
(4)
Control variables
A range of socioeconomic and natural condition factors affecting the GPP were set as control variables in the model. Specifically, the economic growth (PGDP) was expressed as the natural logarithm of GDP per capita. The upgrading of the industrial structure (STRUC) was expressed as the ratio of the value added of the tertiary industry to the value added of the secondary industry. The urban–rural income gap (GAP) was expressed as the ratio of the per capita disposable income of urban residents to the per capita net income of rural residents. The educational level of the population (EDU) was calculated as a weighted summary of the number of years of education at each level and its proportion of the total population: specifically, 0 years for illiteracy, 6 years for elementary school, 9 years for junior high school, 12 years for high school and technical secondary school, 15 years for junior college, 16 years for undergraduate, and 19 years for postgraduate. The openness of economy (OPEN) was represented as the ratio of total import and export trade volume in GDP. The fiscal support to agriculture (FISCAL) was represented as the proportion of expenditure on agriculture, forestry, and water affairs in the general budget expenditure of local finance. The rural household cropland endowment (LAND) was expressed as the ratio of rural household cropland area to village population. Temperature (TEM), precipitation (PRE), and sunshine duration (SUN) were selected as the climatic condition indicators.
(5)
Spatial weight matrix
The key to model estimation is the setting of the spatial weight matrix. In this study, three spatial weight matrices were constructed. The first matrix was the Rook contiguity-based weights matrix (W1) with a common border. When two provinces have a common border, the elements in the matrix were set to 1; otherwise, the elements were set to 0 (Hainan was set as adjacent to Guangdong). The second matrix was the inverse geographic distance-based weight matrix (W2), where the elements were set based on the inverse of the latitude and longitude distances of the geometric centers of the regions [50]. The third one was the grain distance matrix (W3), which was the product of the inverse geographic distance weight matrix (W2) and the diagonal matrix of grain production scale (A). The elements in A were the average values of the grain production proportion of each province in the national grain production during the study period. The above three weight matrices were row-normalized.

3.2.2. Data Sources

The research sample of this paper was 30 provinces in China (Tibet, Hong Kong, Macao and Taiwan were not involved in the empirical study due to lack of data), and the time span was 23 years from 1996 to 2018. Socio-economic data were obtained from the China Statistical Yearbook, China Rural Statistical Yearbook, China Agriculture Statistical Report, China Population and Employment Statistical Yearbook, China Agricultural Machinery Industry Yearbook, provincial statistical yearbooks, and by province from the National Bureau of Statistics (http://data.stats.gov.cn/easyquery.htm?cn=E0103, accessed on 5 May 2021). The meteorological data of temperature, precipitation, and sunshine duration were obtained from the “China Surface Climate Information Annual Value Dataset” of China Meteorological Administration (data.cma.cn accessed on 5 May 2021), which is the annual value of climate information from 613 basic and benchmark ground meteorological observation stations and automatic stations in China since 1951. Table 1 shows the specific explanation and descriptive statistics of each variable.

4. Results

4.1. Evolutionary Characteristics of the GPP

The COG of the GPP, its transfer distance and direction, and the SDE were plotted to analyze the evolutionary characteristics (Figure 2). From 2000 to 2018, the grain production COG in China was always within Henan Province and transferred northeastward. Specifically, the COG transferred from Zhoukou City in 1996 to Luohe City in 2000 and then to Puyang City in 2018, and the trend tended to continue northeastward. Firstly, the COG of grain production in China fluctuated and transferred 196.337 km northeastward. The fluctuations were mainly in two periods—i.e., 1996 to 2000 and 2006 to 2009. The COG of grain production fluctuated and transferred southward by 78.932 km from 1996 to 2000. From 2006 to 2009, the COG of grain production repeatedly transferred within Kaifeng, yet the transfer distance was relatively small. The relatively small change in the COG of grain production from 2011 to 2018 indicated that the national grain production was relatively stable without any major spatial pattern changes during that period.
The SDE of grain production covered most of the major grain-producing areas in eastern, central, and western China. Judging from the shape of the SDE, the spatial pattern of grain production also gradually shifted northeastward, showing a spatial pattern of “northeast–southwest”. Provinces distributed inside the SDE were basically the main body of grain production in China, and the number of northern provinces covered by the SDE was gradually increasing. The semi-major axis of the ellipse extended from 1244.192 km in 1996 to 1384.636 km in 2018, while the semi-minor axis shortened from 737.020 km to 736.314 km (Table 2), and the ratio of the semi-minor axis to semi-major axis increased and then decreased in general. The reason can be attributed to the small overall growth of the minor axis and the fluctuating growth of the major axis, manifested as a significant overall grain production growth in the south–north direction and a less pronounced growth in the east–west direction. In addition, the fluctuating increase in the azimuth also indicated the northeastward transfer in the spatial pattern of grain production.

4.2. The Dynamic Effect of Urbanization on the GPP

Since the time dimension is considered, to avoid pseudo-regression problems, unit root tests on the panel data are required to ensure the stationarity of variables. We used four test methods—LLC (Levine–Lin–Chu), IPS (Im–Pesaran–Skin), ADF–Fisher, Harris–Tzavalis—to conduct the tests of the variables (Table 3). The results show that most of the variables passed the significance test under different methods, and they were stationary. Although individual variables did not pass the significance test under a certain method, when considered together, it can be concluded that the null hypothesis of the existence of a unit root was rejected for that variable; i.e., this variable was also stationary. In addition, the variance inflation factors (VIF) of the independent variables were all significantly less than 10, with an average VIF of 3.57, indicating that there was no significant multicollinearity problem among the variables.
According to common practice, the spatial correlation of GPCI was tested with the global Moran’s I. The test results under the three different spatial weight matrices showed that the Moran’s I scores for GPCI under W1 and W3 were significantly greater than 0, at [0.145, 0.303] and [0.469, 0.532], respectively. Therefore, grain production in each region had relatively significant positive spatial autocorrelation and dependence, and the index and significance were higher under W3; that is, the demonstration effect in one region affected grain production in neighboring regions, thus exhibiting spatial agglomeration characteristics, which also showed certain discontinuity in time variation. With the distance between regions and the scale of production taken into consideration, the spatial agglomeration strengthened and became more pronounced. However, the Moran’s I under W2 was insignificantly negative, indicating difficulties in reflecting the agglomeration characteristics of grain production spatial correlation among regions by considering geographic distance alone.
Then, two Lagrange multipliers (LM-lag and LM-error) and their robust forms (Robust LM-lag and Robust LM-error) were used to discriminate the spatial lag form and the spatial error form of the dynamic spatial panel model. The principle was to first compare the significance of the Lagrange multipliers and select the significant one to build the empirical model. If both Lagrange multipliers were significant, the significance of their robust forms was further compared, and the significant one was selected to build the spatial econometric model. Since the Moran’s I under W2 was not significant, only the LM tests under W1 and W3 were performed (Table 4). Only LM-lag passed the significance test under W1, while LM-lag and LM-error passed the significance test under W3, yet Robust LM-error did not pass the significance test. Taken together, the spatial lag form under both matrices was significantly better than the spatial error form. For comparison, this paper also includes the test results of non-spatial ordinary dynamic panel regressions based on GMM (Table 4).
As shown in Table 5, the results of the AR (2) test support the hypothesis of no second-order serial correlation in the regression equation, regardless of whether the panel is spatially dynamic or non-spatially dynamic, and regardless of whether control variables are included. The Sargan overidentification test also showed that the null hypothesis of instrumental variable validity could not be rejected, and the Wald tests all rejected the original hypothesis at the 1% significance level. Overall, the established dynamic panel model was reasonable and effective.
According to the test results, the statistical characteristics of the dynamic spatial panel econometric were better than those of the dynamic panel model when not considering spatial correlation, and the differences in the significance of the estimated coefficients under different spatial weight matrices were also significant. Since the significance and sign of the coefficients under the grain distance weight matrix W3 were improved considerably, the focus was set on the estimation results of the dynamic spatial panel model based on the W3.
Under W3, the time lag coefficients and spatial lag coefficients were significantly greater than 0 regardless of whether the control variables were included, indicating a significant spatial spillover effect and path dependency of GPP between regions. The presence of path dependency implied that changes in grain production in the current period were positively affected by grain output in the previous period, and the inertia effect was evident unless in the case of a particularly large natural disaster. The presence of spatial spillover effects implied that the effects of urbanization on grain production in one region could exert a demonstration effect and transmission effect to neighboring regions, mainly due to the similar resource endowments and farming traditions among geographically adjacent regions, which strengthened the mutual influence and spatial linkage between regions.
The model had more significant statistical characteristics with other socioeconomic and natural variables under control (Model 4). The estimated coefficient of urbanization was significantly negative at the 1% level, and the increase in urbanization rate would decrease the GPCI. Each unit increase in urbanization resulted in a 0.30% decrease in the regional GPCI—i.e., urbanization negatively affected the GPP. Thus, H1 is valid.

4.3. Mediating Paths of Urbanization’s Effects on the GPP

A mediating effect model considering the spatial effect was established to identify the mechanism by which urbanization indirectly affected the GPP through cropland utilization, planting structure adjustment, and agricultural technology progress. The identification was performed using the sequential test of mediating effect model [44]. Given that urbanization had more significant effect on the GPCI under W3, the analysis of spatial mediation test results was performed under W3.
Table 6 presents the test results of the mediated transmission paths of urbanization’s effect on GPP under the grain distance matrix W3. Here, Model 7 shows the aggregate effect of urbanization on the GPCI, consistent with Model 4 (Table 4). Models 8 to 10 show the effect of urbanization on the mediating variables, including MCI, PS, and ATECH, respectively. Models 11 to 13 show the effect of urbanization and mediating variables on GPCI. The estimation results showed that the time lag effect and spatial spillover effect remained significant at different stages of the mediating paths. Cropland urbanization, planting structure, and technological progress are all significant transmission mechanisms through which urbanization affects regional GPP.
(1)
Urbanization significantly affects GPCI through changes in cropland utilization (MCI). The increased level of urbanization significantly reduced the MCI (Model 8), while the increased MCI significantly increased the regional GPCI (Model 11). The negative effect of urbanization considering the MCI (−0.0029) is lower than the total effect of urbanization (−0.003). Therefore, the mediating effect of MCI weakens the negative impact of urbanization on GPCI. The mediating effect of cropland utilization is −0.219 × 0.001 = −0.000219, accounting for 7.30% of the total effect, which makes it a partial mediating role. The mediating effect of MCI significantly weakens the negative impact of urbanization on the GPP, exhibiting a transmission path of “urbanization → cropland utilization → GPP”. Thus, H2 is verified.
(2)
Urbanization significantly affects GPCI through planting structure adjustments (PS). The increase in urbanization significantly reduced the proportion of grain crops planted (Model 9), while the increase in the proportion of grain crops planted significantly increased the regional GPCI (Model 12). The negative effect of urbanization considering the PS (−0.0027) is lower than the total effect of urbanization (−0.003). Therefore, the mediating effect of PS partially offsets the negative impact of urbanization on the GPCI. The mediating effect of PS is −0.001 × 0.417 = −0.000417, accounting for 13.90% of the total effect, which makes it a partial mediating role. The mediating effect of PS significantly alleviates the decrease in the GPCI due to urbanization, exhibiting a transmission path of “urbanization → planting structure → GPP”. Thus, H3 is verified.
(3)
Urbanization significantly affects GPCI through agricultural technology progress (ATECH) characterized by the level of the comprehensive mechanization rate. The increased level of urbanization significantly promoted ATECH (Model 10), while the promoted ATECH significantly decreased the regional GPCI (Model 13). The negative effect of urbanization considering the ATECH (−0.0028) is lower than the total effect of urbanization (−0.003). Therefore, the mediating effect of ATECH weakens the negative effect of urbanization on the GPCI. The mediating effect of ATECH is 0.009 × −0.018 = −0.000162, accounting for 5.40% in the total effect, which makes it a partial mediating role. The mediating effect of ATECH significantly alleviates the decrease in the GPCI due to urbanization, exhibiting a transmission path of “urbanization → ATECH → GPP”. H4 is verified.

4.4. Robustness Test

The above tests of dynamic effect and mediating mechanism basically confirm the research hypotheses proposed in this paper, and to further improve the accuracy of the estimation results, robustness tests are next conducted by replacing the dependent variable to re-estimating the model. The location quotient (LQ) is usually used to measure the spatial distribution of an industry in a specific region, and it is an indicator of the degree of concentration and specialization of the industry [51]. The agricultural LQ reflects the level of scale and dominance of grain production in a region, so we replace the GPP with the agricultural location quotient to re-estimate the model. The agricultural LQ is the ratio of the share of total agricultural output in the total economic output of a region to the share of total agricultural output in the total economic output of the country [52], which is calculated as follows:
L Q i = A i / E i A / E = A i / A E i / E
where LQi is the agricultural location quotient of province i, Ai is the total agricultural output value of this province, Ei is the total economic output value (GDP) of the province, A is the national total agricultural output value, and E is the national total economic output value (GDP). The larger the LQi is, the higher the concentration degree of agricultural production in this province.
The re-estimations were all done under W3 (Table 7 and Table 8). The result of dynamic spatial econometric estimation shows that the time lag effect and spatial spillover effect remain positive and significant, and the coefficient of urbanization is significantly negative, which is consistent with the results of the previous paper and verifies the existence of a significant negative impact of urbanization on the GPP. The results of the mediating effect test show that MCI, PS, and ATECH all play a positive mediating effect in the influence process of urbanization, with the difference that the mediating effect of ATECH (8.68%) is greater than that of MCI (3.91%) and PS (2.61%). Overall, the conclusions of this study have high robustness.

5. Discussion

The GPP in China has changed profoundly. Its COG has transferred gradually to the northeast, showing a spatial distribution pattern from the northeast to the southwest. The SDE of grain production covered most of the major grain-producing areas in eastern, central, and western China, and the coverage of the northern provinces is gradually expanding. A spatial clustering and distribution pattern of grain production transfer and expansion to the north, especially to the northeast, was formed. This is in general agreement with the findings of existing studies [11]. The northward transfer of the COG is mainly attributed to a relatively large increase in the distance shifted northward in the north–south direction and a smaller increase in the distance shifted in the east–west direction. From the perspective of production, the COG transfer is mainly manifested in the rising grain production in the northeast and northwest regions. In the northeast region, grain production plays an increasingly important role in ensuring national food security, while it is gradually declining in the economically developed southern region, especially the southeast coastal region.
Changes in China’s GPP are affected by a variety of natural and socioeconomic factors, which are accompanied by significant spatial and path dependencies. The presence of spatial spillover effects suggested that a region’s GPCI was also affected by the positive spillover from neighboring regions; that is, grain production in one region has a strong demonstration and transmission effect on the grain production in neighboring regions. The presence of path dependency implied that the GPP values in the current period were positively affected by the GPP of the previous period. The time lag coefficient is significantly larger than the spatial lag coefficient, indicating that the cumulative effect resulting from the path dependency of changes in the GPP is more prominent. However, the changes are still a relatively slow process. Since the focus of urbanization is still transitioning from scale expansion to quality improvement, population movement and land scale are still the main human–land conflicts facing grain production [53]. The progress of urbanization promoted population agglomeration, infrastructure improvement, and non-agricultural industry development, which have brought about the outward expansion demand of urban land space from urban outskirts. As a result, the regional grain supply was affected by the non-agriculturalization and encroachment of cropland, and the GPCI decreased. Despite China having implemented the requisition–compensation balance of cropland policy in the expansion of urbanization [54], the quality of cropland is often reduced due to insufficient or neglected compensation for occupied cropland, which affects regional grain production.
Changes in factor input intensity and the consumption–demand structure, the spread of new technologies, and other factors triggered by the reduction of cropland have overlapping effects on grain production. Among the three significant transmission paths by which urbanization affects the GPP, cropland utilization, planting structure, and agricultural technology progress all play a partial mediating role and effectively offset the negative effect of urbanization on GPCI. That is, urbanization affects the GPP directly and indirectly through the allocation effect of cropland utilization, the structural effect of planting structure adjustment, and the innovation effect of agricultural technology progress. Here, the mediating effect of planting structure is more profound, followed by that of cropland utilization, and the mediating effect of agricultural technology progress is the least profound. Planting structure is a more important transmission path affecting GPCI, mainly because fluctuations in the planting area of different crops are the visual representation of the changing GPP. Due to changes in food consumption preference and production factor price during urbanization, farmers are more willing to plant cash crops with higher comparative returns. Labor mobility due to urbanization also prompts farmers to adjust their planting structure accordingly [55]. The increase in income and the easing of labor mobility constraints due to the off-farm transfer of rural labor increases the proportion of high value-added cash crops and investment in capital-intensive crops [56]. For cropland utilization, cropland area fluctuations due to urbanization change the number and intensity of replanting actions [57] and induce farmers to reallocate the intensity and structure of production factor inputs per unit area. Farmers balance inputs and returns and adjust their willingness and behavior regarding grain production, changing the level of cropland utilization and causing fluctuations in regional grain production. However, differences in average household cropland endowment and topographic characteristics between regions cause differences in factor input intensities, which in turn affect the GPP. Planting structure adjustment is also the result of farmers’ balancing behaviors. The agricultural technology progress brought by urbanization through the transfer to non-agricultural production could improve labor productivity and grain production efficiency, thus alleviating the constraints on production factors due to reduced cropland.

6. Conclusions and Insights

In this study, panel data of 30 Chinese provinces from 1996 to 2018 were used as the sample, the entropy method was adopted to measure the urbanization, and the GPP was characterized by the grain production concentration index (GPCI). Based on the characteristics of changes in the GPP acquired using the SDE-COG model, a dynamic spatial panel econometric model was built, and Sys-GMM was adopted to analyze the direction and magnitude of urbanization’s effect on the GPP. Then, a spatial mediating effect model was adopted to identify the transmission paths by which urbanization affected the GPP through cropland utilization, planting structure adjustment, and agricultural technology progress. Firstly, China’s grain production COG showed a spatial distribution pattern transferring northeastward. Secondly, changes in the GPP had a significant time lag effect and spatial spillover effect. Thirdly, urbanization had a significant negative effect on the GPP—i.e., urbanization hindered the increase in GPCI. Fourthly, urbanization indirectly affected the GPP through the allocation effect of cropland utilization, the structural effect of planting structure, and the innovation effect of agricultural technology progress. Here, the mediating effect of the planting structure was more profound.
The findings in the study could provide a new perspective for furthering our understanding of the evolutionary patterns and action paths of China’s GPP and bring insights into the promotion of urbanization and food security in other developing countries. Since the reform and opening up, China’s GPP has undergone profound changes. Policymakers should correctly understand the historical law of grain production transfer according to the pattern of “northern grain to the south” and give full play to regional comparative advantages to scientifically plan grain production and reasonably allocate advantageous production areas. The negative effects of urbanization on the GPP and the presence of mediated transmission paths implied that the transformation of old and new dynamics as well as urbanization progress to high-quality development drives the spatial mobility of agricultural production factors and induces changes in cropland utilization and planting structure adjustment. Thus, the GPP is affected. The reallocation effect and technological progress also weakened the negative effect of urbanization on the GPCI. The presence of spatial effects requires policymakers to pay constant attention to the structural changes triggered by the spatial flow of factors, promote agricultural marketization reform, and give play to the decisive role of the market in factor resource allocation and the guiding role of policymaking.
The GPP is affected by regional differences in internal and external factors such as natural endowment conditions, socioeconomic development, and farmers’ production decisions. Therefore, policymakers should grasp the heterogeneity of urbanization and grain production in different regions and balance the intrinsic structural changes in the factor structure of agricultural production and the extrinsic dynamic changes of market-based incentives. Urbanization development strategies must be formulated in accordance with local conditions, and the coupling and coordination of urbanization and grain production must be planned on the whole to promote the agricultural marketization reform. Policymakers must give play to the decisive role of the market in factor resource allocation and the guiding role of policymaking. The level of intensive cropland utilization must be improved, and the production structure must be optimized according to local conditions. Good regional interaction and communication between structural adjustment and grain production must be maintained to alleviate the impact of urbanization. In the meantime, urbanization in different dimensions such as population agglomeration, land scale, and economic growth must be gradually coupled, coordinated, and unified.
In addition, other developing countries are also experiencing the dual problem of urbanization and food supply. The research ideas and framework of this paper can provide reference for other countries to study related issues according to their own national conditions, and the changing patterns and experiences of China in the relationship between urbanization and grain production pattern can also provide a reference for other countries, as well as a reference for the United Nations to achieve the SDEs of no poverty and zero hunger.
Nevertheless, this study has limitations in aspects such as the spatial distribution heterogeneity of geography and climate change. The resource endowment, topography, and meteorological conditions of the north and south are different, and the differences in urbanization levels are significant between the eastern, central, and western regions. Investigating the moderating effect of interregional heterogeneity in future studies could help to further clarify the standing and division of labor in grain production in each region. The influence of other socioeconomic factors such as institutional reform, benefit compensation, and comparative returns on changes in grain production pattern is also worth exploring for future research.

Author Contributions

Conceptualization, H.H. and S.Y.; methodology, H.H.; software, M.H.; validation, S.Y. and H.H.; formal analysis, H.H.; investigation, H.H.; resources, S.Y.; data curation, H.H. and M.H.; writing—original draft preparation, H.H.; writing—review and editing, M.H. and S.Y.; visualization, H.H. and M.H.; supervision, S.Y.; project administration, S.Y.; funding acquisition, S.Y. All authors have read and agreed to the published version of the manuscript.

Funding

This research was funded by the National Natural Science Foundation of China, grant number 71473195, 71773091; Special Fund for Scientific Research of Forestry Commonwealth Industry, grant number 201504424 and Graduate Student Science and Technology Innovation Program of College of Economics and Management, Northwest A&F University, grant number JGYJSCXXM2020002.

Institutional Review Board Statement

Not applicable.

Informed Consent Statement

Not applicable.

Data Availability Statement

The data presented in this study are available on request from the corresponding author. The data are not publicly available due to data management.

Conflicts of Interest

The authors declare no conflict of interest.

References

  1. Liu, Y. Is the natural resource production a blessing or curse for China’s urbanization? Evidence from a space–time panel data model. Econ. Model. 2014, 38, 404–416. [Google Scholar] [CrossRef]
  2. Lu, W.C.; Mei, Y. Empirical studies on the variation and contributing factors of regional grain production structure in China: Based on spatial econometrics models. China Agric. Univ. J. Soc. Sci. Ed. 2007, 3, 140–152. [Google Scholar] [CrossRef]
  3. Xu, Z.Y.; Song, Z.W.; Deng, A.X. Regional changes of production layout of main grain crops and their actuation factors during 1981–2008 in China. J. Nanjing Agric. Univ. 2013, 36, 79–86. [Google Scholar] [CrossRef]
  4. Huang, A.J. The change law of regional pattern of grain production in China. China Rural. Econ. 1995, 2, 31–33. [Google Scholar]
  5. Li, T.; Long, H.; Zhang, Y.; Tu, S.; Ge, D.; Li, Y.; Hu, B. Analysis of the spatial mismatch of grain production and farmland resources in China based on the potential crop rotation system. Land Use Policy 2017, 60, 26–36. [Google Scholar] [CrossRef]
  6. Tu, Y.; Chen, B.; Yu, L.; Xin, Q.; Xu, B. How does urban expansion interact with cropland loss? A comparison of 14 Chinese cities from 1980 to 2015. Landsc. Ecol. 2021, 36, 243–263. [Google Scholar] [CrossRef]
  7. Leng, Z.H.; Fu, C.J. The influence of the disequilibrium development of urbanization on foods security. Economist 2014, 11, 58–65. [Google Scholar] [CrossRef]
  8. Yue, W.; Liu, Y.; Fan, P. Measuring urban sprawl and its drivers in large Chinese cities: The case of Hangzhou. Land Use Policy 2013, 31, 358–370. [Google Scholar] [CrossRef]
  9. Zhuang, L.; Ye, C. Changing imbalance: Spatial production of national high-tech industrial development zones in China (1988–2018). Land Use Policy 2020, 94, 104512. [Google Scholar] [CrossRef]
  10. Gao, F. Regional changes of grain production in China: 1978–2003. Manag. World 2005, 9, 70–79. [Google Scholar] [CrossRef]
  11. Deng, Z.B.; Feng, Y.G.; Zhang, J.L.; Wang, J. Analysis on the characteristics and tendency of grain production’s spatial distribution in China. Econ. Geogr. 2013, 33, 117–123. [Google Scholar] [CrossRef]
  12. Hou, M.Y.; Deng, Y.J.; Yao, S. Spatial agglomeration pattern and driving factors of grain production in China since the Reform and Opening Up. Land 2021, 10, 10. [Google Scholar] [CrossRef]
  13. Lu, X.H.; Ke, N.; Kuang, B. Regional differences and influencing factors of China’s grain production capacity. China Land Sci. 2020, 34, 53–62. [Google Scholar] [CrossRef]
  14. Yang, C.; Lu, W.C. Study on regional pattern of county grain production based on spatial metering economic model. J. Agrotech. Econ. 2010, 5, 24–29. [Google Scholar] [CrossRef]
  15. Xia, S.Y.; Zhao, Y.; Xu, X.; Sun, Q.; Wang, L.W. Spatiotemporal pattern and driving factors of grain production in Jiangsu province. Economic Geography 2018, 38, 166–175. [Google Scholar] [CrossRef]
  16. Deng, Z.B.; Feng, Y.G.; Zhang, J.L.; Wang, J. Empirical studies on the regional pattern changes of grain production and its main contributing factors in China. Macroeconomics 2014, 3, 94–113. [Google Scholar] [CrossRef]
  17. Daniel, K.; Kilkenny, M. Decoupled Payments and the Localization of Activities. In Proceedings of the International Congress, European Association of Agricultural Economists, Zaragoza, Spain, 28–31 August 2002; pp. 28–31. [Google Scholar] [CrossRef]
  18. Zheng, Y.G.; Kuang, C.J.; Jiao, H.P. Discussion on the evolution causes of the South-to-North grain transfer to the North-to-South grain transport. Res. China Econ. Hist. 1999, 1, 99–106. [Google Scholar]
  19. Chen, J. Rapid urbanization in China: A real challenge to soil protection and food security. CATENA 2007, 69, 1–15. [Google Scholar] [CrossRef]
  20. Lu, W.C.; Chen, N.L.; Qian, W.Q. Modeling the effects of urbanization on grain production and consumption in China. J. Integr. Agric. 2017, 16, 1393–1405. [Google Scholar] [CrossRef] [Green Version]
  21. Song, W.; Pijanowski, B.C. The effects of China’s cultivated land balance program on potential land productivity at a national scale. Appl. Geogr. 2014, 46, 158–170. [Google Scholar] [CrossRef]
  22. Li, J.; Li, Y. Influence measurement of rapid urbanization on agricultural production factors based on provincial panel data. Socio-Econ. Plan. Sci. 2019, 67, 69–77. [Google Scholar] [CrossRef]
  23. Wang, Y.; Yao, X.; Zhou, M. Rural labor outflow, regional differences, and grain production. Manag. World 2013, 11, 67–76. [Google Scholar] [CrossRef]
  24. Deng, W.; Zhang, S.; Peng, Z.; Li, P.; Wan, J. Spatiotemporal characteristics of rural labor migration in China: Evidence from the migration stability under new-type urbanization. China Geogr. Sci. 2020, 30, 749–764. [Google Scholar] [CrossRef]
  25. Zhang, K.H.; Song, S.F. Rural–urban migration and urbanization in China: Evidence from time-series and cross-section analyses. China Econ. Rev. 2003, 14, 386–400. [Google Scholar] [CrossRef]
  26. Zheng, X.Y.; Xu, Z.G.; Ying, R.Y. Regional heterogeneity in the changes of grain production in the context of urbanization and structural adjustment in China. China Soft Sci. 2014, 11, 71–86. [Google Scholar] [CrossRef]
  27. Jiang, L.; Deng, X.Z.; Seto, K.C. The impact of urban expansion on agricultural land use intensity in China. Land Use Policy 2013, 35, 33–39. [Google Scholar] [CrossRef]
  28. Zhao, Y.B.; Wang, S.J.; Zhou, C.S. Understanding the relation between urbanization and the eco-environment in China’s Yangtze River Delta using an improved EKC model and coupling analysis. Sci. Total Environ. 2016, 571, 862–875. [Google Scholar] [CrossRef]
  29. Wu, Y.L.; Feng, Z.L.; Zhou, Y.; Hu, J. Co-integration analysis on driving factors of intensive cultivated land use based on perspective of farmers: A case study of Hubei Province. China Popul. Resour. Environ. 2011, 21, 67–72. [Google Scholar] [CrossRef]
  30. Liu, C.W.; Nan, N.; Huang, L.M. Difference comparison on land intensive use of different scale farmers in rice-growing areas in Southern China. Trans. China Soc. Agric. Eng. 2018, 34, 250–256. [Google Scholar] [CrossRef]
  31. Yan, H.M.; Liu, F.; Niu, Z.E.; Gu, F.; Yang, Y. Changes of multiple cropping in Huang-Huai-Hai agricultural region, China. J. Geogr. Sci 2018, 28, 1685–1699. [Google Scholar] [CrossRef] [Green Version]
  32. Chen, T.; Chen, C.B. Analysis on coupling between county level urbanization and rural population hollowing under the background of escaping migration. Issues Agric. Econ. 2017, 38, 58–66. [Google Scholar] [CrossRef]
  33. Zhen, X.Y.; Xu, Z.G. Endowment restriction, factor substitution and induced technological innovation: A case research on the grain producing mechanization in China. China Econ. Q. 2016, 16, 45–66. [Google Scholar] [CrossRef]
  34. Chen, J.; Zhang, Y.; Chen, Z.; Nie, Z. Improving assessment of groundwater sustainability with analytic hierarchy process and information entropy method: A case study of the Hohhot Plain, China. Environ. Earth Sci. 2015, 73, 2353–2363. [Google Scholar] [CrossRef]
  35. Liu, W.; Jiao, F.; Ren, L.; Xu, X.; Wang, J.; Wang, X. Coupling coordination relationship between urbanization and atmospheric environment security in Jinan City. J. Clean. Prod. 2018, 204, 1–11. [Google Scholar] [CrossRef]
  36. Zhao, L.; Zhao, Z.Q. Spatial agglomeration of the manufacturing industry in China. J. Quant. Tech. Econ. 2014, 31, 110–121. [Google Scholar] [CrossRef]
  37. Zhao, L.; Zhao, Z.Q. Projecting the spatial variation of economic based on the specific ellipses in China. Sci. Geogr. Sin. 2014, 34, 979–986. [Google Scholar] [CrossRef]
  38. Tang, Y.F.; Lu, X.H.; Yi, J.L.; Wang, H.Z.; Zheng, W.B. Evaluating the spatial spillover effect of farmland use transition on grain production–An empirical study in Hubei province, China. Ecol. Indic. 2021, 125, 107478. [Google Scholar] [CrossRef]
  39. Elhorst, J.P. Dynamic spatial panels: Models, methods, and inferences. J. Geogr. Syst. 2012, 14, 5–28. [Google Scholar] [CrossRef]
  40. Anselin, L. Spatial Econometrics: Methods and Models; Kluwer Academic Publishers: Boston, MA, USA, 1988. [Google Scholar] [CrossRef] [Green Version]
  41. Elhorst, J.P. MATLAB software for spatial panels. Int. Reg. Sci. Rev. 2012, 37, 389–405. [Google Scholar] [CrossRef] [Green Version]
  42. Huang, Z.L.; Yao, T.T. Market segmentation and regional productivity: Theoretical mechanism and empirical evidence. J. Financ. Econ. 2020, 46, 96–110. [Google Scholar] [CrossRef]
  43. Bai, J.H.; Liu, Y.Y. Can outward foreign direct investment improve the resource misallocation of China. China Ind. Econ. 2018, 1, 60–78. [Google Scholar] [CrossRef]
  44. Wen, Z.L.; Ye, B.J. Analyses of mediating effects: The development of methods and models. Adv. Psychol. Sci. 2014, 22, 731–745. [Google Scholar] [CrossRef]
  45. Shao, S.; Zhang, K.; Dou, J.M. Effects of economic agglomeration on energy saving and emission reduction: Theory and empirical evidence from China. Manag. World 2019, 35, 36–60. [Google Scholar] [CrossRef]
  46. Baron, R.M.; Kenny, D.A. The moderator-mediator variable distinction in social psychological research: Conceptual, strategic, and statistical considerations. J. Personal. Soc. Psychol. 1986, 51, 1173–1182. [Google Scholar] [CrossRef]
  47. Zhang, Y.; Pu, Y.J.; Chen, L.T. Urbanization and service industry agglomeration—A view based on system coupling interaction. China Ind. Econ. 2013, 6, 57–69. [Google Scholar] [CrossRef]
  48. Hou, M.Y.; Yao, S.B. Spatial spillover effects and threshold characteristics of rural labor transfer on agricultural eco-efficiency in China. Resour. Sci. 2018, 40, 2475–2486. [Google Scholar] [CrossRef]
  49. Zhang, K.; Deng, X.; Shen, Q.L.; Qi, Y.B. Agricultural technology progress, rural labor migration and farmers’ income. J. Agrotech. Econ. 2017, 6, 28–41. [Google Scholar] [CrossRef]
  50. Fan, Q.; Hudson, D. A new endogenous spatial temporal weight matrix based on ratios of Global Moran’s I. J. Quant. Tech. Econ. 2018, 35, 131–149. [Google Scholar] [CrossRef]
  51. Li, C.X.; Wu, K.N.; Gao, X.Y. Manufacturing industry agglomeration and spatial clustering: Evidence from Hebei province, China. Environ. Dev. Sustain. 2020, 22, 2941–2965. [Google Scholar] [CrossRef]
  52. Xiao, L.S.; Yu, Z.W.; Ye, H.; Zhang, G.H. The research of coupling rural development and economy cluster in Fujian province. Acta Geogr. Sin. 2015, 70, 615–624. [Google Scholar] [CrossRef]
  53. Gao, Y.L.; Zan, Q.D.; Wang, Z.G. Urbanization and food security: Main issues, logical relationships and research perspectives. Mod. Manag. Sci. 2018, 12, 3–5. [Google Scholar] [CrossRef]
  54. Chen, W.X.; Ye, X.Y.; Li, J.F.; Fan, X.; Liu, Q.S.; Dong, W.C. Analyzing requisition–Compensation balance of farmland policy in China through telecoupling: A case study in the middle reaches of Yangtze River urban agglomerations. Land Use Policy 2019, 83, 134–146. [Google Scholar] [CrossRef]
  55. Brauw, A.D. Seasonal migration and agricultural production in Vietnam. J. Dev. Stud. 2010, 46, 114–139. [Google Scholar] [CrossRef]
  56. Li, L.; Wang, C.; Segarra, E.; Nan, Z.B. Migration, remittances, and agricultural productivity in small farming systems in Northwest China. China Agric. Econ. Rev. 2013, 5, 5–23. [Google Scholar] [CrossRef]
  57. Qiu, B.; Lu, D.; Tang, Z.; Song, D.; Zeng, Y.; Wang, Z.; Chen, C.; Chen, N.; Huang, H.; Xu, W. Mapping cropping intensity trends in China during 1982–2013. Appl. Geogr. 2017, 79, 212–222. [Google Scholar] [CrossRef]
Figure 1. Pathways of urbanization affecting GPP.
Agriculture 12 00539 g001
Figure 2. COG transfer and SDE of grain production in China.
Agriculture 12 00539 g002
Table 1. Variable explanation and descriptive statistics.
VariablesVariable CalculationUnitSizeMean S.D.MinMax
Explained variable:
GPPLogarithm of the percentage of GPCI%6900.7551.134−2.7772.416
Explanatory variable:
URBANUrbanization is calculated based on entropy method-6900.3330.1650.0690.830
Mediator variables: 6900.3330.1990.0160.815
MCIGrain crop planting area/cropland area-6901.6220.5240.5662.859
PSGrain crop planting area/total crop planting area-6900.6660.1220.3280.958
ATECHLogarithm of the percentage of comprehensive mechanization rate%6903.6030.8050.3724.750
Control variables:
lnPGDPLogarithm of GDP per capita (constant 1996 prices)Yuan RMB/person6909.7780.9347.62511.768
STRUCValue-added of tertiary industry/value-added of secondary industry-6900.9910.4670.4974.237
GAPPer capita disposable income of urban residents/per capita net income of rural residents-6902.8550.6031.6235.498
lnEDULogarithm of educational level of the populationYear6902.0950.1431.5462.539
OPENImport and export trade volume/GDP-6900.3100.3820.0171.799
FISCALExpenditure on agriculture, forestry, and water affairs/general budget expenditure of local finance-6908.9453.4381.18418.966
lnLANDLogarithm of rural household cropland area to village populationhm2/person6900.6840.676−0.6362.738
lnTEMLogarithm of temperature6902.4780.5750.0303.233
lnPRELogarithm of precipitationMm6906.6520.6624.2547.761
lnSUNLogarithm of sunshine durationh6907.6050.2586.7978.022
Table 2. Parameters of COG and SDE of the GPP in China.
YearCOG CoordinatesDirectionDistance/kmSemi-Major Axis/kmSemi-Minor Axis/kmAzimuth/°
1996114.289° E, 33.978° N--1244.192737.02055.477
2000113.686° E, 33.469° Nsouthwestward78.9321229.486738.22756.712
2018115.091° E, 35.770° Nnortheastward196.3371384.636736.31455.936
Table 3. Unit root test results of variables.
Original VariablesLLCIPSADF–FisherHarris–TzavalisVIF
Value.pValue.pValue.pValue.p
GPP−1.8820.029−6.9800.000−5.7340.0000.5790.001
URBAN−1.6790.046−1.6310.0511.2990.0960.7680.0384.51
MCI−1.6090.0540.3870.0650.9150.018−4.5010.0003.80
PS−4.0150.000−0.6291.000−3.0880.0993.2750.0951.57
ATECH−2.0670.019−1.4090.079−2.5000.9930.8660.0883.13
lnPGDP−4.0110.0003.5360.000−2.8400.9970.9240.0706.10
STRUC−0.9270.023−0.1690.095−3.7700.0594.6170.0001.67
GAP−4.1620.000−6.1990.000−7.1790.000−4.3490.0002.19
lnEDU−4.8490.000−9.3470.0001.9310.072−10.0840.0005.04
OPEN−2.1650.0151.6550.951−2.2670.0834.5230.0003.87
FISCAL−2.4480.007−6.7470.0002.9560.002−5.5590.0003.04
lnLAND−2.4530.007−3.6870.0013.3060.001−0.8890.1864.14
lnTEM−8.3210.000−11.9030.000−17.3510.000−21.1530.0003.14
lnPRE−5.5060.000−12.6220.000−18.1400.000−18.4670.0004.25
lnSUN−7.3570.000−12.6190.000−18.5780.000−17.8940.0003.50
Note: The different unit root tests all include time trend and subtract the cross-sectional mean.
Table 4. LM test for the spatial panel econometric model.
LM TestW1W3
χ2p-Valueχ2p-Value
LM-lag11.4060.00113.6820.000
Robust LM-lag13.5190.0008.7890.003
LM-error0.4300.5125.5040.019
Robust LM-error2.5440.1110.6120.434
Table 5. Dynamic spatial panel econometric results of urbanization affecting GPP.
VariablesW1W3Non-Spatial Model
Model 1Model 2Model 3Model 4Model 5Model 6
L.lnGPP0.986 ***
(70.89)
0.954 ***
(54.85)
0.855 ***
(36.59)
0.820 ***
(32.17)
1.013 ***
(56.41)
1.293 ***
(12.02)
W*lnGPP0.145 ***
(4.74)
0.172 ***
(5.29)
0.282 ***
(8.10)
0.304 ***
(8.38)
--
URBAN0.0004
(0.54)
−0.001
(−1.55)
−0.001
(−1.48)
−0.003 ***
(−3.04)
−0.001 ***
(−4.32)
−0.0005
(−0.46)
cons−0.156 ***
(−4.20)
0.435
(0.80)
−0.051 *
(−1.84)
0.253
(0.49)
−0.049 ***
(−2.84)
0.527 **
(1.51)
ControlNOYESNOYESNOYES
AR (1) P0.000.000.000.000.000.00
AR (2) P0.350.130.460.510.480.52
Sargan P1.001.001.001.001.001.00
Wald P0.000.000.000.000.000.00
Note: *** p < 0.01, ** p < 0.05, * p < 0.1. Round brackets show t-values (z-values for non-spatial models).
Table 6. Mediating effect of urbanization on GPP.
VariablesTotal EffectImpact of Urbanization on MImpact of Urbanization, M on the GPCI
lnGPPMCIPSATECHlnGPPlnGPPlnGPP
Model 7Model 8Model 9Model 10Model 11Model 12Model 13
L.lnGPP0.820 ***(32.17) 0.794 ***(31.69)0.809 ***
(32.66)
0.810 ***
(30.89)
W*lnGPP0.304 ***
(8.38)
0.320 ***
(9.20)
0.269 ***
(7.49)
0.315 ***
(8.57)
M 0.001 ***
(4.37)
0.417 ***
(4.91)
−0.018 **
(−2.30)
L.M 0.677 ***
(22.16)
0.945 ***
(48.36)
0.841 ***
(48.37)
W*M 0.500 ***
(13.77)
0.276 ***
(8.96)
0.172 ***
(7.31)
urban−0.003 ***
(−3.04)
−0.219 **
(−1.98)
−0.001 ***
(−5.71)
0.009 ***
(7.41)
−0.0029 ***
(−3.57)
−0.0027 **(−2.10)−0.0028 **
(−3.11)
ControlYESYESYESYESYESYESYES
AR (1) P0.000.030.000.000.000.000.00
AR (2) P0.510.920.460.160.570.330.52
Sargan P1.001.000.001.001.001.001.00
Wald P0.000.000.000.000.000.000.00
Note: *** p < 0.01, ** p < 0.05. Round brackets show t-values. M is a collective term for mediating variables.
Table 7. Re-estimation results of dynamic spatial panel econometric.
VariablesL.lnLQW*lnLQURBANControlAR (1) PAR (2) PSargan PWald P
Model 140.924 ***
(40.20)
0.107 ***
(3.09)
−0.0028 ***
(−2.78)
YES00.3410
Note: *** p < 0.01. Round brackets show t-values.
Table 8. Re-estimation results of mediating effect test.
VariablesTotal EffectImpact of Urbanization on MImpact of Urbanization, M on the LQ
lnLQMCIPSATECHlnLQlnLQlnLQ
Model 15Model 16Model 17Model 18Model 19Model 20Model 21
L.lnLQ0.924 ***
(40.20)
0.924 ***
(40.21)
0.935 ***
(37.90)
0.921 ***
(40.18)
W*lnLQ0.107 ***
(3.09)
0.106 ***
(3.06)
0.098 ***
(2.71)
0.107 ***
(3.09)
M 0.0005 *
(1.84)
0.073 *
(1.92)
−0.027 *
(−1.96)
L.M 0.677 ***
(22.16)
0.945 ***
(48.36)
0.841 ***
(48.37)
W*M 0.500 ***
(13.77)
0.276 ***
(8.96)
0.172 ***
(7.31)
urban−0.0028 ***
(−2.78)
−0.219 **
(−1.98)
−0.001 ***
(−5.71)
0.009 ***
(7.41)
−0.0027 ***
(−2.60)
−0.0027 **
(−2.30)
−0.0026 **
(−3.01)
ControlYESYESYESYESYESYESYES
AR (1) P0.000.030.000.000.000.000.00
AR (2) P0.340.920.460.160.340.220.52
Sargan P1.001.000.001.001.00]1.001.00
Wald P0.000.000.000.000.000.000.00
Note: *** p < 0.01, ** p < 0.05, * p < 0.1. Round brackets show t-values. M is a collective term for mediating variables.
Publisher’s Note: MDPI stays neutral with regard to jurisdictional claims in published maps and institutional affiliations.

