Abstract
The agricultural sustainable development for human well-being considers food security and ecological health as well as people’s socio-economic conditions. Nowadays, most of the holistic assessments of agricultural sustainability, mainly focus on food production and ecological consequences, relatively lacking analysis from the socio-economic perspective. In this context, this study constructs an agricultural social life cycle assessment model based on the guidelines of UNEP to assess the social and economic impacts on the three major staple grain crops in China, including maize, rice and wheat. The assessment model aims to analyze effects of stakeholders containing farmer, agricultural value chain actors, consumer, rural areas, society, and impact categories including high-quality growth of agriculture, a comfortable life in rural areas, the prosperity of rural people. The data is mainly from national statistical databases and representative industry databases. The impact assessment adopts social risk and social impact as quantitative characterization methods, and Analytical Hierarchical Process to obtain weights. The results show that: among the three major grain crops, farmers are the most important factors for stakeholders, and agricultural industrial development has the greatest potential negative impacts on society; maize has the most positive impacts on agricultural sustainable development in China.
1. Introduction
The multi-functionality of agriculture, not only meeting the basic food demands of humans, but also playing a role in economy, culture, and other aspects, has gradually become the key link between agricultural modernization and sustainability. Therefore, the three-pillar approach of sustainable development, including People, Planet, and Profit/Prosperity, should be considered when assessing agricultural products and services [1]. Based on this consideration, some assessment methodologies have been developed from the social, economic, or environmental dimensions [2,3]. There are more assessments of agricultural sustainability, which mainly focus on environmental dimensions rather than social and economic dimensions. However, assessing agriculture from a socio-economic perspective is an important method for world sustainable development [4,5,6]. However, these studies are rare.
The top three grain crops in the world are maize, rice and wheat [7]. They are important foods for humans, main feed sources for agriculture, forestry, animal husbandry and fisheries, as well as indispensable raw materials for food, light industry, chemical and other industries [8,9,10], showing the multi-functionality of agriculture. China is the representative agricultural country, and thus, the socio-economic impact analysis of the three major grain crops in China could effectively reflect the potential risks existing in current agricultural development.
In recent years, the socio-economic assessments on agriculture have formed a certain foundation. Generally, the related methods include the principal component analysis method [11], data envelopment analysis [12], the entropy-weight-based TOPSIS method [13], energy evaluation [14], life cycle assessment (LCA) [15,16], multidisciplinary and innovative methodologies [17], etc. The relevant methods either mainly focus attention on economic models but are lacking consideration of agricultural characteristics to some extent; or mainly consider agricultural theoretical mechanisms and practical application, but lack socio-economic analysis of the whole agricultural process. Social Life Cycle Assessment (SLCA), proposed by UNEP/SETAC, is an efficient technique aiming to assess the social and the socio-economic impact of products and the potential positive and negative impact in the whole life cycle [18,19,20,21,22,23]. It puts forward the general framework for a social and socio-economic Life Cycle Impact Assessment following the general guidelines of ISO 14044 (2006), which means a unified consensus from this international expert group.
Summarized from a literature review, the application of SLCA in agriculture is mainly divided into two types. The first type is to compare the different products [24,25,26]. Du, CY et al. [27] presented a novel multi-criteria decision analysis model for performing robust indicator weighting in LCA and SLCA. The results showed that mechanical harvesting compared to manual harvesting had lower environmental life cycle impacts at the end-point level and better social impacts for all these convex combinations. Zira, S et al. [28] assessed the risk of negative social impacts, using the SLCA method, for the production and consumption of 1000-kg pork originating from organic and conventional pork production systems. The results showed that the conventional pork system had 42% of the inventory indicators with SR > 0.5 and the organic pork system had 32%. The second type is target tracking to grasp important factors [29,30,31,32,33,34,35]. Manik Y et al. [36] investigated the social implications of palm oil biodiesel via a case study using a SLCA framework. The results revealed the critical social hotspots were working conditions and cultural heritage. Prasara-A, J et al. [37] used LCA and SLCA to examine the environmental, socio-economic, and social performances of the various sugarcane-based products. Results showed that cane trash burning, and overuse of chemical fertilizers and agrochemicals were the main causes for both negative environmental performance and negative socioeconomic and social performances. Taken overall, even though unified consensus has been reached from the international expert group, SLCA research is still in the early stage of development and more studies should be conducted, especially for agriculture [38,39,40]. Besides, the indicators from stakeholder categories to subcategories of SLCA should be more specified when corresponding to agricultural characteristics.
Therefore, the objectives of the study are to: (1) construct an agricultural SLCA model to promote the integration of agriculture and SLCA by refining the SLCA process in detail [41,42], and expanding the theory and method for agricultural assessment in social and economic aspects; (2) apply the agricultural SLCA model to the three major grain crops in China as a case study to verify the feasibility of the model; and (3) provide improvement suggestions and optimization plans for related stakeholders based on the model results.
2. Materials and Methods
The agricultural SLCA model constructed in the paper is undertaken in four main steps [22]: (1) Definition of Goal and Scope: describes the intended use and the goal pursued. It defines the depth of the study and decisions about which unit processes require generic or specific data collection to be made as well; (2) Life Cycle Inventory analysis: is the phase where data are collected, the systems are modeled, and the LCI results are obtained; (3) Life Cycle Impact Assessment: consists of a set of actions to achieve the classification, aggregation and characterization of data according to performance reference points; (4) Life Cycle Interpretation: takes into account all relevant parts of the study for conclusions, recommendations and reporting.
2.1. Definition of Goal and Scope
2.1.1. Goal of the Study
The goal is to assess positive and negative socio-economic impacts of the three major grain crop systems in China, and to put forward suggestions and improvement measures to optimize agricultural development according to quantitative analysis of the life cycle. Results are presented using different levels of aggregation for each stakeholder and impact category. Meanwhile, the paper tests the applicability of the agricultural SLCA model in specific cases.
2.1.2. Functional Unit
Most of the social impacts in SLCA do not depend on, and are not necessarily proportional to, physical flows but reflect the influence of industry behavior with respect to stakeholders [43]. This leads to the problem of linking impacts to a functional unit, which has been overcome to some extent by combining quantitative and semi-quantitative social indicators for SLCA [36,44,45].
Multi-functionality of agriculture means that the life cycle of the agriculture industry is complexity and long periodicity. In order to compare the three major grain crops under the same standard, this paper regards agricultural socio-economic impact itself as a whole. It defines the quantitative inventory indicators as comprehensively as possible to link impacts to a functional unit, instead of the accumulation in each stage of the agricultural life cycle. Therefore, the functional units are defined as the complete life cycle of the maize, rice and wheat industries, respectively in the model.
2.1.3. System Boundary on the Regional Level
The system boundary of the study includes the whole life cycle of the three major grain crops from agricultural planting to product recycling, focusing on the 31 provinces of the Chinese mainland. Related stakeholders in each stage of the three major grain crops’ industrial chain are within the assessing scope.
2.1.4. Choice of Stakeholder Categories and Subcategories
In order to construct the agricultural SLCA system, a literature review and bibliometric analysis were conducted. Firstly, the study analyzed the selection relevant articles for a literature portfolio [44,46,47,48,49]. Secondly, the Chinese “No. 1 central documents” from 2010 to 2020 were extracted by Python to confirm the key points of agriculture in China. Finally, the assessment indicators system from categories to subcategories was determined based on the above results, combined with SLCA Guidelines and the methodological sheets for subcategories in SLCA proposed by UNEP/SETAC [50]. At the same time, subcategories lacking data or having little or even no impact on Chinese agriculture were excluded. The detailed SLCA indicators from categories to subcategories within the system boundary are specified in Figure 1.
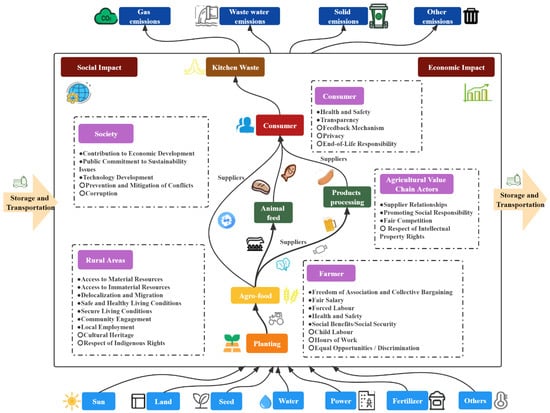
Figure 1.
The Agricultural SLCA system from categories to subcategories. ● adopted subcategories from SLCA Guidelines. ○ excluded subcategories from SLCA Guidelines.
Farmer corresponds to worker in SLCA Guidelines. It is a key component with a wide range of influences on agriculture. Relevant subcategories are as follows.
- Freedom of Association and Collective Bargaining
It aims to verify the compliance of the organization with freedom of association and collective bargaining standards. In particular, whether free to form and join associations and the right to organize unions, to engage in collective bargaining and to strike [51]. Village committees protect farmers and their related rights. Analyzing its coverage rate could reflect the management effectiveness to explain the rural governance ability.
- Fair Salary
It aims to assess whether practices concerning wages are in compliance with established standards and if the wage provided is meeting legal requirements, whether meeting or below industry average and whether it can be considered as a living wage [51]. Regional development differences lead to different income levels in China. And thus, the income gap between urban and rural residents could reflect the relative wealth of rural residents.
- Forced Labor
It aims to verify that there is no use of forced or compulsory labor in the organization [51]. Agricultural mechanization rate reflects the agricultural planting efficiency, showing the degree of reduction in labor intensity.
- Health and Safety
It aims to assess both the rate of incidents and the status of prevention measures and management practices [51]. Working in fields always means a safe working environment. But the rural medical system is relatively imperfect in China nowadays. Coverage rate of rural clinics shows the current rural medical construction, and then explains the soundness of the Chinese health security system and its mechanism.
- Social Benefits/Social Security
It aims to assess whether an organization provides for social benefits and social security of workers and to what extent [51]. Verifying the proportion of rural residents with minimum living security reflects the relative degree of poverty of rural residents, illustrating the mechanism construction of social welfare and security.
Agricultural Value Chain Actors corresponds to value chain actors in SLCA Guidelines. It is an important medium to ensure the industrial chain’s stable operation. Relevant subcategories are as follows.
- Supplier Relationships
It aims to assess the potential impacts or unintended consequences of its procurement and purchasing decisions on other organizations and takes due care to avoid or minimize any negative impacts [51]. Analyzing the proportion of animal husbandry structure, which is a representative industry directly related to agricultural supply, could measure the level of regional agricultural modernization, clarifying the stability of supplier relationships.
- Promoting Social Responsibility
It aims to assess whether it promotes social responsibility among its suppliers and through its own actions [51]. Measuring the amount of agricultural chemical fertilizer applied to the cultivated area could reflect protecting situations of locally cultivated land, to prove social responsibilities performance of all parties in the agriculture industry.
- Fair Competition
It aims to assess if the organization’s competitive activities are conducted in a fair way and in compliance with legislations preventing anti-competitive behavior, anti-trust, or monopoly practices [51]. Proportion of agricultural related legal entities in China could reflect enterprises’ participation in the agricultural market. It explores the potential of economic development in primary industry, along with explaining the current market environment of fair competition.
Consumer corresponds to consumer in SLCA Guidelines. It is the final embodiment of the socio-economic impact of the industrial chain. Relevant subcategories are as follows.
- Health and Safety
It helps to identify the existence and scope of systematic efforts to address consumer health and safety across the organizations involved in the life cycle of a product and/or service [51]. Qualified rate of food quality supervision and random inspection in China shows agricultural products’ quality, illustrating efforts of all industrial chain links for consumers’ health and safety.
- Transparency
It aims to assess if the organization communicates on all issues regarding its product and social responsibility in a transparent way [51]. The purchasing power of residents is measured by Consumer Price Index for food, which illustrates the influence of transparency.
Rural Areas corresponds to local community in SLCA Guidelines. It is the basic condition guarantee of agricultural operation. Relevant subcategories are as follows.
- Access to Material Resources
It aims to assess the extent to which organizations respect, and work to protect, to provide or to improve community access to local material resources (i.e., water, land, etc.) and infrastructure (i.e., roads, sanitation facilities, etc.) [51]. Water is one of the most representative material resources. Measuring agricultural water use efficiency reflects agricultural planting efficiency, explaining the utilization rate of material resources.
- Access to Immaterial Resources
It aims to assess the extent to which organizations respect, work to protect, to provide or to improve community access to immaterial resources [51]. Rural broadcasting could represent the immaterial resource, especially in rural areas without so much media or information. Analyzing the coverage rate of Rural radio reflects the information dissemination ability, explaining the utilization rate of immaterial resources.
- Delocalization and Migration
It aims to assess whether organizations contribute to delocalization, migration or “involuntary resettlement” within communities and whether populations are treated adequately [51]. The urbanization rate could show rural residents’ situations in migration and resettlement, reflecting the process of urban development and the relative wealth of rural residents.
- Safe and Healthy Living Conditions
It aims to assess how organizations impact community safety and health, including the general safety conditions of operations and their public health impacts [51]. The process of rural environmental protection is reflected by the carbon emissions in each stage of agriculture, which shows the degree of the agricultural activities’ impacts on safe and healthy living conditions.
- Secure Living Conditions
It aims to assess how organizations impact the security of local communities with respect to the conduct of private security personnel and how the organization interacts with state-led forces [51]. The Engel coefficient could be used to judge rural residents’ quality of life. It could reflect the secure living conditions in rural areas, explaining the relative poverty degree of rural residents.
- Community Engagement
It aims to assess whether an organization includes community stakeholders in relevant decision-making processes [51]. The analysis of agricultural budget expenditure’s efficiency, representing Chinese government support, reflects the government investment, which explains the influence of community engagement.
- Local Employment
It aims to assess the role of an organization in directly or indirectly affecting local employment [51]. Nowadays, China still promotes employment to the secondary and tertiary industries gradually. Measuring the proportion of employees in primary industry reflects the current situation of local rural employment.
Society corresponds to society in SLCA Guidelines. It is affected as well as the carrier by agriculture. Relevant subcategories are as follows.
- Contribution to Economic Development
It aims to assess to what extent the organization/product or service contributes to the economic development of the country [51]. Measuring the contribution rate of primary industry to reflect the quality of the agricultural output value could explain the role of the agriculture industry’s development for Chinese economic growth.
- Public Commitment to Sustainability Issues
It aims to assess to what extent an organization is engaged in reducing its sustainability impacts [51]. Food security is one of the most representative sustainable development goals in China. The analysis of grain production reflects the degree of high-quality agricultural growth, showing the process of Chinese public commitment to sustainable development.
- Technology Development
It aims to assess whether the organization participates in joint research and development for efficient and environmental sound technologies [51]. Measuring the fund investment of agricultural researchers reflects the quality and efficiency degree of agricultural technology development.
2.2. Life Cycle Inventory Analysis
As the three major grain crops are widely distributed in China, this study delimits the regional scope at the province level to restrict data sources. The main steps are (1) collecting the provincial production of the three major grain crops respectively in 2020; (2) selecting provinces whose production rank foremost, and who has an obvious production gap with others. What’s more, the sum of the selected provincial production exceeds more than 60% of Chinese total production respectively, as shown in Table 1; (3) taking the proportion of the additive provinces’ production as the provincial weights for the following calculation.

Table 1.
The regional scope of the three major grain crops (10000 tons).
According to the connotations of stakeholder categories and their subcategories in this study, the inventory data of the whole country and relevant provinces are collected. The data is mainly from national authoritative statistical databases, such as the China Statistical Yearbook, China Rural Statistical Yearbook [52,53], representative industry databases, such as the Wind database, Carbon emission accounts and datasets (CEADs) [54] and other relative information accumulated by literature and networks. The detailed calculation method and data source of each inventory indicator are shown in Appendix A.
2.3. Life Cycle Impact Assessment
2.3.1. Characterization Method and Model
Social Risk (SR) is a measure of the risk of negative social impacts for each inventory indicator related to the social sustainability issues [28]. SR corresponds to the risk weighting factor Ri representing the risk of negative social impacts in Benoit et al. [55]. In this study, SR is used to calculate the risk value of negative social impacts under the framework of agricultural SLCA. It is used to illustrate the characterization results.
SR, ranging between 0 and 1, is a normalization of the inventory indicator using reference points. A reference point denotes a baseline situation for a certain aspect, and the inventory indicator represents its current condition. SR is 0.5 when the inventory indicator is at the reference point. If for a certain inventory indicator, the situation is worse than the reference point, the value of SR will be between 0.5 and 1. Hence, a low value of SR is preferable, as it means a low risk of negative social impacts. The formulas used to calculate SR are as follows [28]:
where a higher value than the reference point reflects a more negative impact.
where a lower value than the reference point reflects a more negative impact.
Where SR is the social risk value; REF is the reference point value; IND is the inventory indicator value.
The study takes Chinese national average data as the reference point. The sum of related provincial data multiplied by their weights is the inventory indicator value. According to the characterization method, the measurement of SR is to assess the negative social impacts of the three major grain crops relative to the average level of China.
2.3.2. Weighting Method and Model
Analytic Hierarchy Process (AHP) is a multi-criteria decision-making method to help decision-makers facing a complex problem with multiple conflicting and subjective criteria [56]. Due to the different roles of stakeholder categories and subcategories in the agricultural life cycle, this study used AHP to determine factor weights, including four steps:
Problem modelling: divided the general objective into different levels for explaining the subordinate relationship between the factors and the hierarchical structure between the layers, as shown in Figure 2.
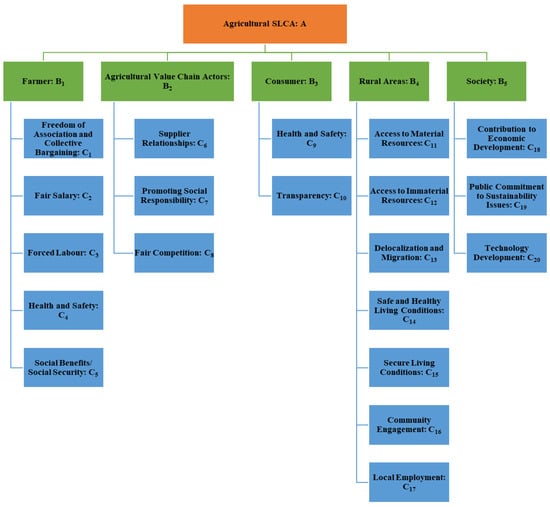
Figure 2.
Weighting model of the agricultural SLCA.
Weights valuation: rationalized the importance of each factor by inviting domain experts to score. In order to construct the pairwise comparison relationships of indicators, AHP was conducted through a questionnaire for each stakeholder category and subcategory. The questionnaire shown in Appendix B was collected by email. And the experts were selected by purposive sampling according to their public academic or professional background. Academia, authorities, enterprise staff, etc., in relevant fields were invited to the survey. In total, 35 valid questionnaires were selected in this study. The respondents had work experience in the subject area with an overall average of 12 years, of which the longest was 37 years.
Weights aggregation: carried out standardized processing layer by layer, to obtain the weight value of each factor to the upper layer, as shown in Table 2.
Table 2.
Priority calculation in AHP.
Sensitivity analysis: checked the consistency of the total ranking of layers. The overall results of the study met the consistency test.
2.3.3. Impact Assessment Method and Model
The impact category corresponds to a model of the social impact pathways to the endpoints of human well-being according to ISO 14044 (2006). To do so, one needs to model from subcategory results to impact categories by aggregating the information at the impact category level [22].
In 2017, there were approximately 0.6 billion people living in Chinese rural areas, accounting for 17.67% of the global rural population [7]. To improve rural development, the Chinese government proposed a new strategy of “Rural Vitalization” in 2017 that aimed to build rural areas with thriving businesses, pleasant living environments, social etiquette and civility, effective governance, and prosperity [57]. In sum, the core objective of the strategy is to systematically establish a coupling pattern of various rural development elements [58], which is corresponding to the three pillar approach of sustainable development, including People, Planet, and Profit/Prosperity.
This study aims to propose improvement plans based on identifying socio-economic impacts of China’s three major grain crops. It is consistent with the strategic goal of Rural Vitalization in China. Therefore, the impact categories are divided into three dimensions from the strategic proposal: high-quality growth of agriculture (corresponding to Profit/Prosperity), a comfortable life in rural areas (corresponding to Planet) and the prosperity of rural people (corresponding to People). According to the characteristics of inventory indicators, the impact assessment model is constructed by combining the impact categories with related inventory indicators, as shown in Figure 3.
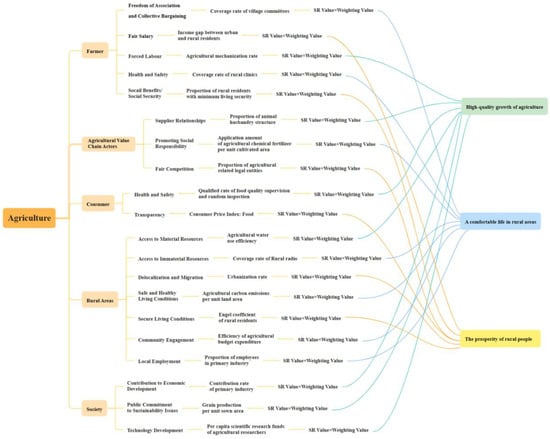
Figure 3.
Impact assessment model of the agricultural SLCA.
Social impact (SI) is a measuring method that calculates the accumulated risks of negative social impacts for a given impact category under the agricultural SLCA framework. It multiplies the SR value of each inventory indicator by its weight, and the calculation formula is as follows:
where j is the inventory indicator (e.g., j= 1...7 for impact category of high-quality growth of agriculture); is the social impact value of the impact category i; is the social risk for inventory indicator j of category i; is the weight of inventory indicator j of category i.
2.4. Life Cycle Interpretation
The interpretation step analyzes the calculation results of SR, weights and SI to draw out conclusions on the positive and negative social impacts of the three major grain crops in China. SR shows social risks for different inventory indicators in relation to the reference. Weights illustrate the important degree of each inventory indicator from the socio-economic assessment aspect. SI aggregates negative social impacts from each impact category to make an overall social risk assessment.
3. Results
3.1. Social Risk
SR is a value of an inventory indicator in relation to a reference point, measuring the risk of negative social impact, respectively, in all ways. A value higher than 0.5 indicates a worse situation than the reference, which is the average Chinese conditions. Based on the characterization model of the agricultural SLCA, the calculation results are shown in Table 3.
Table 3.
The characterization model and SR values of the three major grain crops in China.
The three major grain crops perform well, social risk coverages are all less than 40%. There are 11 of 20 inventory indicators in wheat, 10 of 20 in maize and 8 of 20 in rice with values of SR < 0.5., a better situation than the national average level, which means the positive socio-economic impacts on related assessing fields. In terms of the impact reach, wheat has the most inventory indicators with SR < 0.5, meaning the widest scope of positive socio-economic impacts. In terms of the impact degree, maize has the most SR values obviously lower than 0.5, of which seven inventory indicators with SR < 0.45, meaning the most outstanding positive socio-economic impacts.
In the field of inventory indicators, SR values of Proportion of agricultural related legal entities are the lowest in maize and rice with 0.31 and 0.37 respectively, and 0.46 in wheat, better than the national average level of 0.5. This result shows that there are enough agricultural related enterprises for the three major grain crops. These enterprises could provide sufficient expansion space for the extension of the industrial chain, thereby promoting economic development and local employment; SR values of Agricultural water use efficiency is the lowest in wheat at 0.37, and is 0.43 in maize which is obviously lower than 0.5. The industrial development of wheat and maize balances the water needs with savings. The agricultural water consumption serves the development of the primary industry reasonably and effectively. SR values of Efficiency of agricultural budget expenditure, Grain production per unit sown area, Engel coefficient of rural residents are all lower than 0.5 among the three major grain crops. Their performance is better than the national average level. The results illustrate the effective development of primary industry by government supporting, the achievement of food safety by stable grain production, and the improvement of residents’ quality of life by agricultural industrial advances respectively. Besides, four of five inventory indicators of stakeholder Farmer in maize and wheat have better positive impacts than the national average. Farmers of the maize and wheat industries have better work conditions and basic social guarantees.
On the opposite side of SR, there are6 of 20 inventory indicators in both maize and wheat, and 8 of 20 inventory indicators in rice with values of SR > 0.5. These relevant social risks are higher than the national average level, meaning negative socio-economic impacts on related fields. In terms of the impact reach, rice has the most inventory indicators with SR > 0.5, meaning the highest risks.
In the field of inventory indicators, SR values of Agricultural carbon emissions per unit land area, are the highest among all the three major grain crops, of which wheat value is as high as 0.89. The result shows that the carbon emissions of these crops are seriously higher than the national average. It is a prominent problem to be solved urgently. To achieve carbon neutrality by 2060, China needs pay more attention to reducing carbon emissions of the three major grain crops; SR values of Contribution rate of primary industry in maize and rice are 0.7 and 0.66 respectively, which are significantly higher than the national average level. Their limited contributions to economic development for China need to be explored further; The SR value of Proportion of employees in primary industry in maize is higher than the national average. There are more opportunities for strengthening the extension of the secondary and tertiary industries of maize; The SR value of Coverage rate of village committees in rice is slightly higher than the average. It may be caused by the planting area characteristics. But the improvement still needs to be done for a better protection of rural residents’ rights and interests.
3.2. Weights
The weights are used to rationalize the importance degree of each indicator. In the aggregation of individual weights, the paper uses the geometric mean of all respondents. Then, we build the judgment matrix at all layers to calculate weights. The consistency ratios at all layers are less than 0.1, which means the consistency tests are passed and the model requirement is met. Finally, the results are sorted to obtain the weighting value of each indicator, being applied to the subsequent system calculation. The weighting results of each stakeholder category and subcategory are shown in Table 4.
Table 4.
The AHP results of the weighting model.
In the layer of stakeholder categories, the importance order of socio-economic impacts on agriculture from high to low is: Farmer > Agricultural Value Chain Actors > Consumer > Rural Areas > Society; In the layer of subcategories, the top ten socio-economic impacts on agriculture are: Health and Safety of Consumer, Fair Salary, Supplier Relationships, Health and Safety of Farmer, Freedom of Association and Collective Bargaining, Promoting Social Responsibility, Social Benefits/Social Security, Fair Competition, Contribution to Economic Development and Forced Labor. A total of nine out of ten weighting values are higher than 0.05, of which the highest is 0.122 in Health and Safety of Consumer.
Through the statistical analysis of the degree of importance of each indicator, we can see that the importance of micro factors focused on people (e.g., Farmer) are significantly higher than that of macro factors concerned on regions (e.g., Rural Areas). Besides, the top three importance factors affecting agriculture from the socio-economic aspect, are food quality, residents’ income level and industry chain stability according to the weighting results. These reflect the hottest topics in the current agricultural field.
3.3. Social Impact
SI measures the accumulated risks of negative social impacts for relevant fields. The result shows that: In the matter of stakeholder categories, the highest SIvalue of all the three major grain crops is Farmer, which is significantly higher than the lowest value in Society. Agricultural value chain actors is the second. The other two stakeholder categories have a similar performance, as shown in Figure 4. From the socio-economic view, workers related agriculture industry, especially farmers have the most improvement requirements in the current three major grain crops, more supporting policies are necessary.
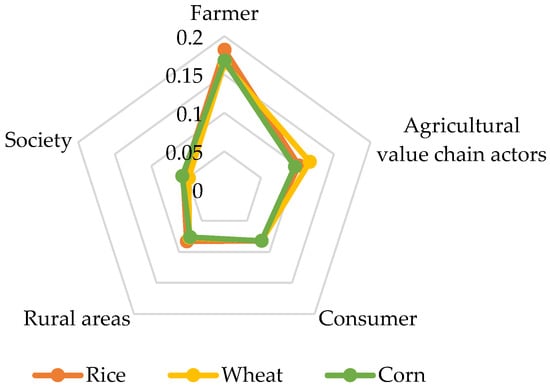
Figure 4.
values of the three major grain crops in stakeholder categories.
In the matter of impact categories, the highest SI value of all the three major grain crops is High-quality growth of agriculture. The development of the agriculture industry is an important reason for the negative socio-economic impacts currently. Balancing the relationship between agricultural development and sustainable development, by improving the quality and efficiency of the three major grain crops, needs to be paid continuous attention. In addition, SI values of A comfortable life in rural areas and The prosperity of rural people are very close, except A comfortable life in rural areas of maize is obviously lower than others. The better performance of maize may be caused by the low risk of carbon emissions and positive impacts of village committees and rural clinics, according to the social risk analysis. Therefore, maize has more positive impacts than wheat or rice on local rural construction. As shown in Figure 5.
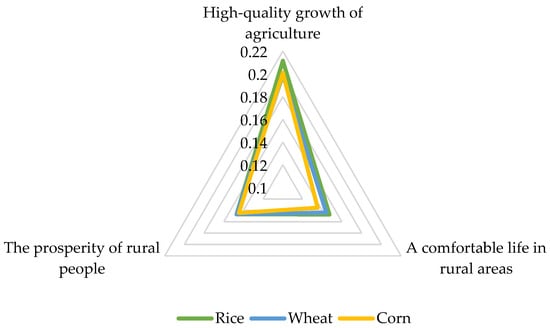
Figure 5.
values of the three major grain crops in impact categories.
The total SI is formed by the sum of each impact category’s SI, showing accumulated socio-economic risks of the three major grain crops. The SI of maize, rice and wheat is 0.481, 0.506 and 0.490, respectively. It clarifies that the order of negative socio-economic impacts from high to low is rice > wheat > maize. The result shows that: rice has the worst performance, whose SI is higher than the national average level to 0.5; wheat has more accumulated socio-economic risks than maize according to the SI values, although having the widest scope of positive socio-economic impacts based on the above social risk analysis; maize has the lowest SI values, the most outstanding positive socio-economic impacts and the least inventory indicators with social risks higher than the Chinese average level according to the above social risk analysis. Therefore, maize provides the most positive impacts on the agricultural sustainable development in China.
4. Discussion
4.1. Policy Implications and Recommendations
Based on the above results, this study proposes following suggestions for the sustainable development of the three major grain crops.
Firstly, agricultural enterprises could play a more important role in economy development and employment improvement. The analysis finds that: there are enough agricultural enterprises for the three major grain crops, which has established a good foundation for industrial chain extension in theory. However, according to social risks analysis, the contribution of maize and rice to economic development is limited, and employment in the primary industry of maize is excessive. It means that the three major grain crops in China have not formed a high-quality industrial chain. There is an obvious gap between production and industry. To further promote the main role of enterprises we suggest, enhancing the integration of enterprises into the back-end agricultural industrial construction, attracting employment to the back-end of the industrial chain, and improving the economic contribution of main grain crops.
Secondly, the implementation of ecological environment treatment policy needs to be carried out for a period of time. The analysis finds that: the industrial development of wheat and maize balances the water needs with savings. The agricultural water consumption serves the development of the primary industry reasonably and effectively. However, agricultural water consumption was a prominent social problem in the past several years. China’s government proposed many policies for strengthening the construction of farmland water conservancy. Therefore, continuous policy implementation is one of the key factors to consolidate the achievements of environmental protection. Nowadays, the carbon emissions of these crops are serious problems that need to be solved urgently. We suggest establishing a carbon emissions’ database of the whole agricultural industry chain, to find a point-to-point way of carbon reduction. Based on the situation, related policies could be proposed and applied for a long period. It would contribute to the realization of China’s carbon neutrality goal in 2060 and the world’s sustainable development.
Thirdly, more enhanced policies for farmers are needed to be proposed to reduce potential social risks. The analysis finds that: farmers of maize and wheat have better work conditions and basic social guarantee, and the Engel coefficient of rural residents of the three major grain crops are better than the national average, according to the social risk analysis. It shows that the agricultural industrial development provides improvement of residents’ lives. In the matter of stakeholder categories, however, the highest accumulated risks of all the three major grain crops are Farmers, followed by Agricultural Value Chain Actors. In addition, the importance of micro factors focused on people are significantly higher than that of macro factors concerned on regions, according to the weights analysis. The results illustrate that the current policy could not really reduce the relevant negative social impacts. We suggest strengthening the policy guarantee for farmers and workers related agriculture industry continuously, to reduce or even eliminate potential socio-economic risks. Improving farmers’ and workers’ rights and interests are always important policy fields for sustainable development of the three major grain crops.
4.2. Limitations and Further Research
The study has made some innovations in the theoretical research and practical application of agricultural SLCA. There are, however, limitations in theory, method and application, with proposing related suggestions for subsequent research as follows.
In theory, methodological proposal and application cases of SLCA have considerably increased over the years [59]. As the important contents, stakeholder categories, subcategories, inventory indicators and impact categories are guided by, but not the same as, SLCA Guidelines in diverse application cases [47,60,61,62,63]. In this context, the following research could explore more relevant assessment systems from stakeholder categories to impact categories on the basis of the standard SLCA framework, so as to build the impact pathway for targeted research fields [64,65,66,67].
In method, characterization and weighting methods are key links of the SLCA model construction. Regarding the characterization model, there are SHDB [44,48], PSILCA [68,69], SLCA in Web [70], Life Cycle Working Environment [45], etc., databases utilized in SLCA. Different databases need different data transformation methods with different inventory indicators. These should constantly promote a more stable characterization model construction to adapt various research data [71,72,73,74]. Regarding the weighting model, AHP has the characteristic of strong subjectivity based on expert judgments. It still suffers from some theoretical disputes. The rank reversal is surely the most debated problem [56]. Future study may explore more weighting methods for the instrumental SLCA model [75,76].
In application, case studies confirm that the application of SLCA is really important to prove its efficacy and to solidify the technique [49,77,78,79]. The application scope of the agricultural SLCA model could be expanded further. Based on the agricultural SLCA, analyzing the agricultural socio-economic impacts on dynamic changes by collecting annual data, on regional characteristics by refining regional scope, on industrial trends by specifying agricultural varieties, etc., is attainable. Multi-dimensional and multi-scenario applications are worth the wait [80,81,82].
5. Conclusions
It is more and more important to analyze agriculture from a socio-economic perspective for agricultural sustainable development. Therefore, applying SLCA in agriculture is of great significance for agricultural socio-economic assessment in theory and practice nowadays.
Based on the theoretical framework of LCA, this study refines the theory of SLCA methods in agriculture, defining the related stakeholder categories, subcategories, inventory indicators and impact categories. The characterization model of quantitative analysis for inventory indicators was built. Additionally, the weighting model for an impact pathway was constructed. This framework could be used for various stakeholders, such as farmers, workers, residents, communities, and society related to the agricultural chain, providing optimized schemes to reduce, or even to avoid, potential social risks.
Grounded on this framework, the socio-economic impacts of the three major grain crops in China are estimated. The results show that: the social impact values of “Farmer” at the stakeholder categories, and “High-quality growth of agriculture” at the impact categories are the highest respectively. It illustrates that farmers are the most important factors for stakeholders in the industry chains, and that high-quality agricultural industrial development has the greatest potential negative socio-economic impacts on society. Additionally, maize has the most outstanding positive socio-economic impacts, the lowest accumulated negative social impact values, and the least inventory indicators with social risks higher than the Chinese average level. Therefore, among the three major grain crops, maize provides the most positive impacts on the agricultural sustainable development in China. Considering the limitations of the study, more work should be done in the future.
Author Contributions
Conceptualization, J.W. and Y.C.; methodology, J.W., X.L. and Y.C.; software, J.W.; validation, J.W., W.G. and Y.C.; formal analysis, J.W. and J.C.; investigation, J.W., Y.X., J.L. and X.L.; resources, J.C., Y.X. and J.L.; data curation, J.W. and X.L.; writing—original draft preparation, J.W.; writing—review and editing, all authors; visualization, J.W.; supervision, Y.C. and W.G.; project administration, Y.C.; funding acquisition, W.G. and Y.C. All authors have read and agreed to the published version of the manuscript.
Funding
This research was funded by the National Key Technology R&D Program of the People’s Republic of China (Grant number: 2016YFD0300210).
Institutional Review Board Statement
Not applicable.
Informed Consent Statement
Not applicable.
Data Availability Statement
Not applicable.
Acknowledgments
The authors are most grateful to questionnaire respondents for their assistance with data collection of AHP.
Conflicts of Interest
The authors declare no conflict of interest.
Appendix A
The measurement method of Inventory Indicators is shown in Table A1.
Table A1.
Inventory Indicators frameworks of the agricultural SLCA.
Table A1.
Inventory Indicators frameworks of the agricultural SLCA.
| Stakeholder Categories | Subcategories | Inventory Indicators | Quantitative Analysis Methods | Unit | Nature |
|---|---|---|---|---|---|
| Farmer | Freedom of Association and Collective Bargaining | Coverage rate of village committees | Village committee’s quantity 1/Rural residents’ population 1 | Unit/10,000 persons | Positive |
| Fair Salary | Income gap between urban and rural residents | Per capita disposable income of urban residents 1/Per capita disposable income of rural residents 1 | - | Negative | |
| Forced Labor | Agricultural mechanization rate | Total power of agricultural machinery 2/Irrigated area of Cultivated land 1 | 10,000 KW/1000 hectares | Positive | |
| Health and Safety | Coverage rate of rural clinics | Rural clinics 1/Rural residents’ population 1 | Unit/10,000 persons | Positive | |
| Social Benefits/Social Security | Proportion of rural residents with minimum living security | Rural residents entitled to minimum Living allowance 1/Rural residents’ population 1 | - | Negative | |
| Agricultural Value Chain Actors | Supplier Relationships | Proportion of animal husbandry structure | Gross output value of Animal Husbandry 1/Gross output value of Agriculture, Forestry, Animal Husbandry and Fishery and Related indices 1 | - | Positive |
| Promoting Social Responsibility | Application amount of agricultural chemical fertilizer per unit cultivated area | Consumption of Chemical Fertilizers 2/Irrigated area of Cultivated land 1 | 10,000 tons/1000 hectares | Negative | |
| Fair Competition | Proportion of agricultural related legal entities | Numbers of corporate units in Agriculture, Forestry, Animal Husbandry and Fishery 1/Total number of corporate units by sector 1 | - | Positive | |
| Consumer | Health and Safety | Qualified rate of food quality supervision and random inspection | Qualification rate of products 1 (National average food-related qualification rate of examined products 1/National average qualification rate of products 1) | - | Positive |
| Transparency | Consumer Price Index: Food | Consumer Price Index of Food 1 | - | Negative | |
| Rural Areas | Access to Material Resources | Agricultural water use efficiency | Value-added by Primary industry 1/Agricultural water use 1 | 100 million yuan/100 million cu.m | Positive |
| Access to Immaterial Resources | Coverage rate of Rural radio | Rural population coverages rate of radio programs 1 | - | Positive | |
| Delocalization and Migration | Urbanization rate | Proportion of urban population1 | - | Positive | |
| Safe and Healthy Living Conditions | Agricultural carbon emissions per unit land area | Carbon emissions of Agriculture, Forestry, Animal Husbandry and Fishery and Related indices 3/Land areas related agriculture 2 | 1000 tons of CO2/ hectare | Negative | |
| Secure Living Conditions | Engel coefficient of rural residents | Per capital consumption expenditure of rural households in food, tobacco and liquor1/per capital consumption expenditure of rural households 1 | - | Negative | |
| Community Engagement | Efficiency of agricultural budget expenditure | Value-added by Primary industry 1/Expenditure for Agriculture, forestry and water conservancy 1 | - | Positive | |
| Local Employment | Proportion of employees in primary industry | Number of employed persons by Primary industry 1/Number of employed persons by three industries 1 | - | Negative | |
| Society | Contribution to Economic Development | Contribution rate of primary industry | Value-added by Primary industry 1/Gross regional product 1 | - | Negative |
| Public Commitment to Sustainability Issues | Grain production per unit sown area | Output of grain products 1/Swon areas of farm crops 1 | ton/1000 hectares | Positive | |
| Technology Development | Per capita scientific research funds of agricultural researchers | Scientific research funds in agricultural related universities and institutes 4/Number of researchers in related agricultural universities and institutes 4 | 10,000 yuan/person | Positive |
Sources: 1 is from China Statistical Yearbook-2021; 2 is from China Rural Statistical Yearbook-2021; 3 is from CEADs; and 4 is from public website of related universities and research institutions.
Appendix B
Questionnaire on the Agricultural Social Life Cycle Assessment
Dear expert:
Thank you for taking the time to fill out the questionnaire.
We are constructing an agricultural social life cycle assessment (SLCA) model based on the guidelines of UNEP/ SETAC to assess the social and economic impacts on the three major staple grain crops in China. To assess the relative importance from stakeholder categories to subcategories of the agricultural SLCA, this survey is carried out by analytic hierarchy process method. It includes two parts: Part 1 is the relative importance from stakeholder categories to subcategories of the agricultural SLCA, and Part 2 is basic personal information. All data collected in the questionnaire are only used for academic research. The personal information would be strictly confidential.
Please fill in the questionnaire based on your professional knowledge and experience. Your answer is of great significance to the development of the agricultural SLCA. Thanks again for your support and academic help!
| College of Agronomy and Biotechnology |
| China Agricultural University |
| January 2022 |
[Instruction]
According to the standard theoretical framework of LCA, and combined with China’s national conditions, the assessment system identified the key process and elements to define the agricultural industrial stakeholder categories including five items: Farmer, Agricultural Value Chain Actors, Consumer, Rural Areas and Society. And the system determined 20 subcategories of stakeholders. Among them, the subcategories of Farmer included 5 items: Freedom of Association and Collective Bargaining, Fair Salary, Forced Labor, Health and Safety, Social Benefits/Social Security. The subcategories of Agricultural Value Chain Actors included three items: Supplier Relationships, Promoting Social Responsibility and Fair Competition. The subcategories of Consumer included two items: Health and Safety, Transparency. The subcategories of Rural Areas included seven items: Access to Material Resources, Access to Immaterial Resources, Delocalization and Migration, Safe and Healthy Living Conditions, Secure Living Conditions, Community Engagement, Local Employment. The subcategories of Society included three items: Contribution to Economic Development, Public Commitment to Sustainability Issues, Technology Development, as shown in Table A2.
Table A2.
Agricultural social life cycle assessment indicators.
Table A2.
Agricultural social life cycle assessment indicators.
| Stakeholder Categories | Subcategories | Inventory Indicators |
|---|---|---|
| Farmer | Freedom of Association and Collective Bargaining | Coverage rate of village committees |
| Fair Salary | Income gap between urban and rural residents | |
| Forced Labor | Agricultural mechanization rate | |
| Health and Safety | Coverage rate of rural clinics | |
| Social Benefits/Social Security | Proportion of rural residents with minimum living security | |
| Agricultural Value Chain Actors | Supplier Relationships | Proportion of animal husbandry structure |
| Promoting Social Responsibility | Application amount of agricultural chemical fertilizer per unit cultivated area | |
| Fair Competition | Proportion of agricultural related legal entities | |
| Consumer | Health and Safety | Qualified rate of food quality supervision and random inspection |
| Transparency | Consumer Price Index: Food | |
| Rural Areas | Access to Material Resources | Agricultural water use efficiency |
| Access to Immaterial Resources | Coverage rate of Rural radio | |
| Delocalization and Migration | Urbanization rate | |
| Safe and Healthy Living Conditions | Agricultural carbon emissions per unit land area | |
| Secure Living Conditions | Engel coefficient of rural residents | |
| Community Engagement | Efficiency of agricultural budget expenditure | |
| Local Employment | Proportion of employees in primary industry | |
| Society | Contribution to Economic Development | Contribution rate of primary industry |
| Public Commitment to Sustainability Issues | Grain production per unit sown area | |
| Technology Development | Per capita scientific research funds of agricultural researchers |
This study uses an analytic hierarchy process to assess the relative importance from stakeholder categories to subcategories of the agricultural SLCA. Please compare the relative importance of A with B in the comparison table, by selecting the more important factor corresponding to the number, as shown in Table A3.
Table A3.
Assessment principle and assignment of relative importance between factors at the same layer.
Table A3.
Assessment principle and assignment of relative importance between factors at the same layer.
| Scale (aij Assignment) | Meaning (i Relative to j) |
|---|---|
| 9 | Extremely important |
| 7 | Strongly important |
| 5 | Obviously important |
| 3 | Slightly important |
| 1 | Equally important |
| 1/3 | Slightly unimportant |
| 1/5 | Obviously unimportant |
| 1/7 | Strongly unimportant |
| 1/9 | Extremely unimportant |
| 2, 4, 6, 8, 1/2, 1/4, 1/6, 1/8 | The intermediate value of the above two adjacent judgments |
[Part 1]
Research on the relative importance from stakeholder categories to subcategories of the agricultural SLCA.
1. Stakeholder category layer
Please assess the relative importance of stakeholders in Table A4.
Table A4.
The assessment of the relative importance of stakeholders.
Table A4.
The assessment of the relative importance of stakeholders.
| Comparative Stakeholder Category | Relative Importance Scale | ||||||||||
|---|---|---|---|---|---|---|---|---|---|---|---|
| A | B | 1/9 | 1/7 | 1/5 | 1/3 | 1 | 3 | 5 | 7 | 9 | Others |
| Farmer | Agricultural Value Chain Actors | ||||||||||
| Farmer | Consumer | ||||||||||
| Farmer | Rural Areas | ||||||||||
| Farmer | Society | ||||||||||
| Agricultural Value Chain Actors | Consumer | ||||||||||
| Agricultural Value Chain Actors | Rural Areas | ||||||||||
| Agricultural Value Chain Actors | Society | ||||||||||
| Consumer | Rural Areas | ||||||||||
| Consumer | Society | ||||||||||
| Rural Areas | Society | ||||||||||
Note: If selecting “others”, please fill in the relative importance value in the form.
2. Subcategories layer
2.1. Farmer
Please assess the relative importance of subcategories “Farmer” in Table A5.
Table A5.
The assessment of the relative importance of subcategories “Farmer”.
Table A5.
The assessment of the relative importance of subcategories “Farmer”.
| Comparative Subcategories | Relative Importance Scale | ||||||||||
|---|---|---|---|---|---|---|---|---|---|---|---|
| A | B | 1/9 | 1/7 | 1/5 | 1/3 | 1 | 3 | 5 | 7 | 9 | Others |
| Freedom of Association and Collective Bargaining | Fair Salary | ||||||||||
| Freedom of Association and Collective Bargaining | Forced Labor | ||||||||||
| Freedom of Association and Collective Bargaining | Health and Safety | ||||||||||
| Freedom of Association and Collective Bargaining | Social Benefits/Social Security | ||||||||||
| Fair Salary | Forced Labor | ||||||||||
| Fair Salary | Health and Safety | ||||||||||
| Fair Salary | Social Benefits/Social Security | ||||||||||
| Forced Labor | Health and Safety | ||||||||||
| Forced Labor | Social Benefits/Social Security | ||||||||||
| Health and Safety | Social Benefits/Social Security | ||||||||||
Note: If selecting “others”, please fill in the relative importance value in the form.
2.2. Agricultural Value Chain Actors
Please assess the relative importance of subcategories “Agricultural value chain actors” in Table A6.
Table A6.
The assessment of the relative importance of subcategories “Agricultural value chain actors”.
Table A6.
The assessment of the relative importance of subcategories “Agricultural value chain actors”.
| Comparative Subcategories | Relative Importance Scale | ||||||||||
|---|---|---|---|---|---|---|---|---|---|---|---|
| A | B | 1/9 | 1/7 | 1/5 | 1/3 | 1 | 3 | 5 | 7 | 9 | Others |
| Supplier Relationships | Promoting Social Responsibility | ||||||||||
| Supplier Relationships | Fair Competition | ||||||||||
| Promoting Social Responsibility | Fair Competition | ||||||||||
Note: If selecting “others”, please fill in the relative importance value in the form.
2.3. Consumer
Please assess the relative importance of subcategories “Consumer” in Table A7.
Table A7.
The assessment of the relative importance of subcategories “Consumer”.
Table A7.
The assessment of the relative importance of subcategories “Consumer”.
| Comparative Subcategories | Relative Importance Scale | ||||||||||
|---|---|---|---|---|---|---|---|---|---|---|---|
| A | B | 1/9 | 1/7 | 1/5 | 1/3 | 1 | 3 | 5 | 7 | 9 | Others |
| Health and Safety | Transparency | ||||||||||
Note: If selecting “others”, please fill in the relative importance value in the form.
2.4. Rural Areas
Please assess the relative importance of subcategories “Rural areas” in Table A8.
Table A8.
The assessment of the relative importance of subcategories “Rural areas”.
Table A8.
The assessment of the relative importance of subcategories “Rural areas”.
| Comparative Subcategories | Relative Importance Scale | ||||||||||
|---|---|---|---|---|---|---|---|---|---|---|---|
| A | B | 1/9 | 1/7 | 1/5 | 1/3 | 1 | 3 | 5 | 7 | 9 | Others |
| Access to Material Resources | Access to Immaterial Resources | ||||||||||
| Access to Material Resources | Delocalization and Migration | ||||||||||
| Access to Material Resources | Safe and Healthy Living Conditions | ||||||||||
| Access to Material Resources | Secure Living Conditions | ||||||||||
| Access to Material Resources | Community Engagement | ||||||||||
| Access to Material Resources | Local Employment | ||||||||||
| Access to Immaterial Resources | Delocalization and Migration | ||||||||||
| Access to Immaterial Resources | Safe and Healthy Living Conditions | ||||||||||
| Access to Immaterial Resources | Secure Living Conditions | ||||||||||
| Access to Immaterial Resources | Community Engagement | ||||||||||
| Access to Immaterial Resources | Local Employment | ||||||||||
| Delocalization and Migration | Safe and Healthy Living Conditions | ||||||||||
| Delocalization and Migration | Secure Living Conditions | ||||||||||
| Delocalization and Migration | Community Engagement | ||||||||||
| Delocalization and Migration | Local Employment | ||||||||||
| Safe and Healthy Living Conditions | Secure Living Conditions | ||||||||||
| Safe and Healthy Living Conditions | Community Engagement | ||||||||||
| Safe and Healthy Living Conditions | Local Employment | ||||||||||
| Secure Living Conditions | Community Engagement | ||||||||||
| Secure Living Conditions | Local Employment | ||||||||||
| Community Engagement | Local Employment | ||||||||||
Note: If selecting “others”, please fill in the relative importance value in the form.
2.5. Society
Please assess the relative importance of subcategories “Society” in Table A9.
Table A9.
The assessment of the relative importance of subcategories “Society”.
Table A9.
The assessment of the relative importance of subcategories “Society”.
| Comparative Subcategories | Relative Importance Scale | ||||||||||
|---|---|---|---|---|---|---|---|---|---|---|---|
| A | B | 1/9 | 1/7 | 1/5 | 1/3 | 1 | 3 | 5 | 7 | 9 | Others |
| Contribution to Economic Development | Public Commitment to Sustainability Issues | ||||||||||
| Contribution to Economic Development | Technology Development | ||||||||||
| Public Commitment to Sustainability Issues | Technology Development | ||||||||||
Note: If selecting “others”, please fill in the relative importance value in the form.
[Part 2]
Basic personal information
1. How long have you been worked or researched in agricultural related fields?
years
2. Professional title:
○ Professor ○ Associate Professor ○ Lecturer ○ Others ( )
References
- Delgado, L.E.; Negrete, I.A.R.; Torres-Gómez, M.; Alfonso, A.; Zorondo-Rodríguez, F. Social-Ecological Systems and Human Well-Being. In Social-Ecological Systems of Latin America: Complexities and Challenges; Springer: Berlin, Germany, 2019; pp. 53–69. [Google Scholar] [CrossRef]
- Lee, S. Role of Social and Solidarity Economy in Localizing the Sustainable Development Goals. Int. J. Sustain. Dev. World Ecol. 2020, 27, 65–71. [Google Scholar] [CrossRef]
- Streimikis, J.; Baležentis, T. Agricultural Sustainability Assessment Framework Integrating Sustainable Development Goals and Interlinked Priorities of Environmental, Climate and Agriculture Policies. Sustain. Dev. 2020, 28, 1702–1712. [Google Scholar] [CrossRef]
- Huarachi, D.R.; Gonçalves, G.; de Francisco, A.C.; Canteri, M.H.G.; Piekarski, C.M. Life Cycle Assessment of Traditional and Alternative Bricks: A Review. Environ. Impact Assess. Rev. 2020, 80, 106335. [Google Scholar] [CrossRef]
- Almanza, A.M.H.; Corona, B. Using Social Life Cycle Assessment to Analyze the Contribution of Products to the Sustainable Development Goals: A Case Study in the Textile Sector. Int. J. Life Cycle Assess. 2020, 25, 1833–1845. [Google Scholar] [CrossRef]
- United Nations. Transforming Our World: The 2030 Agenda for Sustainable Development. Available online: https://sustainabledevelopment.un.org/post2015/Transformingourworld (accessed on 15 April 2019).
- FAOSTAT. Available online: https://www.fao.org/faostat/Zh/#home (accessed on 16 February 2022).
- Fageria, N.K. Yield Physiology of Rice. J. Plant Nutr. 2007, 30, 843–879. [Google Scholar] [CrossRef]
- Ranum, P.; Peña-Rosas, J.P.; Garcia-Casal, M.N. Global Maize Production, Utilization, and Consumption. Ann. N. Y. Acad. Sci. 2014, 1312, 105–112. [Google Scholar] [CrossRef]
- Asseng, S.; Cammarano, D.; Basso, B.; Chung, U.; Alderman, P.D.; Sonder, K.; Reynolds, M.P.; Lobell, D. Hot Spots of Wheat Yield Decline with Rising Temperatures. Glob. Chang. Biol. 2016, 23, 2464–2472. [Google Scholar] [CrossRef]
- Olivares, B.O.; Lobo, D.; Cortez, A.; Rodriguez, M.F.; Rey, J.C. Socio-Economic Characteristics and Methods of Agricultural Production of Indigenous Community Kashaama, Anzoategui, Venezuela. Rev. Fac. Agron. Luz 2017, 34, 187–215. [Google Scholar]
- Beltrán-Esteve, M.; Reig-Martínez, E.; Estruch-Guitart, V. Assessing Eco-Efficiency: A Metafrontier Directional Distance Function Approach Using Life Cycle Analysis. Environ. Impact Assess. Rev. 2017, 63, 116–127. [Google Scholar] [CrossRef]
- Li, M.; Sun, H.; Singh, V.P.; Zhou, Y.; Ma, M. Agricultural Water Resources Management Using Maximum Entropy and Entropy-Weight-Based TOPSIS Methods. Entropy 2019, 21, 364. [Google Scholar] [CrossRef] [Green Version]
- Wang, X.; Li, Z.; Long, P.; Yan, L.; Gao, W.; Chen, Y.; Sui, P. Sustainability Evaluation of Recycling in Agricultural Systems by Emergy Accounting. Resour. Conserv. Recycl. 2017, 117, 114–124. [Google Scholar] [CrossRef]
- Tecco, N.; Baudino, C.; Girgenti, V.; Peano, C. Innovation Strategies in a Fruit Growers Association Impacts Assessment by Using Combined LCA and S-LCA Methodologies. Sci. Total Environ. 2016, 568, 253–262. [Google Scholar] [CrossRef] [PubMed]
- Andrews, E.; Lesage, P.; Benoît, C.; Parent, J.; Norris, G.; Reveret, J.-P. Life Cycle Attribute Assessment. J. Ind. Ecol. 2009, 13, 565–578. [Google Scholar] [CrossRef]
- De Luca, A.I.; Molari, G.; Seddaiu, G.; Toscano, A.; Bombino, G.; Ledda, L.; Milani, M.; Vittuari, M. Multidisciplinary and Innovative Methodologies for Sustainable Management in Agricultural Systems. Environ. Eng. Manag. J. 2015, 14, 1571–1581. [Google Scholar] [CrossRef]
- Balasbaneh, A.T.; Bin Marsono, A.K. Applying Multi-Criteria Decision-Making on Alternatives for Earth-Retaining Walls: LCA, LCC, and S-LCA. Int. J. Life Cycle Assess. 2020, 25, 2140–2153. [Google Scholar] [CrossRef]
- Iofrida, N.; De Luca, A.I.; Silveri, F.; Falcone, G.; Stillitano, T.; Gulisano, G.; Strano, A. Psychosocial Risk factors’ Impact Pathway for Social Life Cycle Assessment: An Application to Citrus Life Cycles in South Italy. Int. J. Life Cycle Assess. 2018, 24, 767–780. [Google Scholar] [CrossRef]
- Bouzid, A.; Padilla, M. Analysis of Social Performance of the Industrial Tomatoes Food Chain in Algeria. New Medit. 2014, 13, 60–65. [Google Scholar]
- Jarosch, L.; Zeug, W.; Bezama, A.; Finkbeiner, M.; Thrän, D. A Regional Socio-Economic Life Cycle Assessment of a Bioeconomy Value Chain. Sustainability 2020, 12, 1259. [Google Scholar] [CrossRef] [Green Version]
- UNEP/SETAC. UNEP Guidelines for Social Life Cycle Assessment of Products; UNEP: Nairobi, Kenya, 2009. [Google Scholar]
- UNEP. UNEP Guidelines for Social Life Cycle Assessment of Products and Organizations; UNEP: Paris, France, 2020. [Google Scholar]
- Franze, J.; Ciroth, A. A Comparison of Cut Roses from Ecuador and the Netherlands. Int. J. Life Cycle Assess. 2011, 16, 366–379. [Google Scholar] [CrossRef]
- Iofrıda, N.; Stıllıtano, T.; Falcone, G.; Gulısano, G.; Nıcolò, B.F.; De Luca, A.I. The Socio-Economic Impacts of Organic and Conventional Olive Growing in Italy. New Medit. 2020, 19, 117–131. [Google Scholar] [CrossRef] [Green Version]
- Varela-Ortega, C.; Blanco-Gutiérrez, I.; Manners, R.; Detzel, A. Life Cycle Assessment of animal-based Foods and plant-based protein-rich Alternatives: A Socio-Economic Perspective. J. Sci. Food Agric. 2021. [Google Scholar] [CrossRef]
- Du, C.; Dias, L.C.; Freire, F. Robust Multi-Criteria Weighting in Comparative LCA and S-LCA: A Case Study of Sugarcane Production in Brazil. J. Clean. Prod. 2019, 218, 708–717. [Google Scholar] [CrossRef]
- Zira, S.; Röös, E.; Ivarsson, E.; Hoffmann, R.; Rydhmer, L. Social Life Cycle Assessment of Swedish Organic and Conventional Pork Production. Int. J. Life Cycle Assess. 2020, 25, 1957–1975. [Google Scholar] [CrossRef]
- Muhammad, K.I.; Sharaai, A.H.; Ismail, M.M.; Harun, R.; Yien, W.S. Social Implications of Palm Oil Production through Social Life Cycle Perspectives in Johor, Malaysia. Int. J. Life Cycle Assess. 2018, 24, 935–944. [Google Scholar] [CrossRef]
- Prasara, -A.J.; Gheewala, S.H.; Silalertruksa, T.; Pongpat, P.; Sawaengsak, W. Environmental and Social Life Cycle Assessment to Enhance Sustainability of Sugarcane-Based Products in Thailand. Clean Technol. Environ. Policy 2019, 21, 1447–1458. [Google Scholar] [CrossRef]
- Rafiaani, P.; Kuppens, T.; Thomassen, G.; Van Dael, M.; Azadi, H.; LeBailly, P.; Van Passel, S. A Critical View on Social Performance Assessment at Company Level: Social Life Cycle Analysis of an Algae Case. Int. J. Life Cycle Assess. 2020, 25, 363–381. [Google Scholar] [CrossRef] [Green Version]
- Rivera-Huerta, A.; Lozano, M.D.L.S.R.; Padilla-Rivera, A.; Güereca, L.P. Social Sustainability Assessment in Livestock Production: A Social Life Cycle Assessment Approach. Sustainability 2019, 11, 4419. [Google Scholar] [CrossRef] [Green Version]
- Werker, J.; Wulf, C.; Zapp, P. Working Conditions in Hydrogen Production: A Social Life Cycle Assessment. J. Ind. Ecol. 2019, 23, 1052–1061. [Google Scholar] [CrossRef]
- Wang, Q.; Tang, H.; Ma, Q.; Mu, R.; Yuan, X.; Hong, J.; Zhang, J.; Zuo, J.; Mu, Z.; Cao, S.; et al. Life Cycle Assessment and the Willingness to Pay of Waste Polyester Recycling. J. Clean. Prod. 2019, 234, 275–284. [Google Scholar] [CrossRef]
- Zhang, Y.; Li, J.; Liu, H.; Zhao, G.; Tian, Y.; Xie, K. Environmental, Social, and Economic Assessment of Energy Utilization of Crop Residue in China. Front. Energy 2021, 15, 308–319. [Google Scholar] [CrossRef]
- Manik, Y.; Leahy, J.; Halog, A. Social Life Cycle Assessment of Palm Oil Biodiesel: A Case Study in Jambi Province of Indonesia. Int. J. Life Cycle Assess. 2013, 18, 1386–1392. [Google Scholar] [CrossRef]
- Prasara, -A.J.; Gheewala, S.H. Applying Social Life Cycle Assessment in the Thai Sugar Industry: Challenges from the Field. J. Clean. Prod. 2018, 172, 335–346. [Google Scholar] [CrossRef]
- Tokede, O.; Traverso, M. Implementing the Guidelines for Social Life Cycle Assessment: Past, Present, and Future. Int. J. Life Cycle Assess. 2020, 25, 1910–1929. [Google Scholar] [CrossRef]
- Siebert, A.; Bezama, A.; O’Keeffe, S.; Thrän, D. Social Life Cycle Assessment Indices and Indicators to Monitor the Social Implications of Wood-Based Products. J. Clean. Prod. 2018, 172, 4074–4084. [Google Scholar] [CrossRef]
- Smith, J.; Barling, D. Social Impacts and Life Cycle Assessment: Proposals for Methodological Development for SMEs in the European Food and Drink Sector. Int. J. Life Cycle Assess. 2014, 19, 944–949. [Google Scholar] [CrossRef] [Green Version]
- UNEP. Towards a Life Cycle Sustainability Assessment; UNEP: Nairobi, Kenya, 2011. [Google Scholar]
- UNEP. Guidance on Organizational Life Cycle Assessment; UNEP: Nairobi, Kenya, 2015. [Google Scholar]
- Jørgensen, A.; Le Bocq, A.; Nazarkina, L.; Hauschild, M. Methodologies for Social Life Cycle Assessment. Int. J. Life Cycle Assess. 2008, 13, 96–103. [Google Scholar] [CrossRef]
- Martínez-Blanco, J.; Lehmann, A.; Muñoz, P.; Antón, A.; Traverso, M.; Rieradevall, J.; Finkbeiner, M. Application Challenges for the Social Life Cycle Assessment of Fertilizers Within Life Cycle Sustainability Assessment. J. Clean. Prod. 2014, 69, 34–48. [Google Scholar] [CrossRef]
- Chen, W.; Holden, N.M. Social Life Cycle Assessment of Average Irish Dairy Farm. Int. J. Life Cycle Assess. 2017, 22, 1459–1472. [Google Scholar] [CrossRef]
- Ribeiro, I.; Sobral, P.; Peças, P.; Henriques, E. A Sustainable Business Model to Fight Food Waste. J. Clean. Prod. 2018, 177, 262–275. [Google Scholar] [CrossRef]
- Arcese, G.; Lucchetti, M.C.; Massa, I. Modeling Social Life Cycle Assessment Framework for the Italian Wine Sector. J. Clean. Prod. 2017, 140, 1027–1036. [Google Scholar] [CrossRef]
- Du, C.; Ugaya, C.; Freire, F.; Dias, L.; Clift, R. Enriching the Results of Screening Social Life Cycle Assessment Using Content Analysis: A Case Study of Sugarcane in Brazil. Int. J. Life Cycle Assess. 2018, 24, 781–793. [Google Scholar] [CrossRef]
- D’Eusanio, M.; Serreli, M.; Zamagni, A.; Petti, L. Assessment of Social Dimension of a Jar of Honey: A Methodological Outline. J. Clean. Prod. 2018, 199, 503–517. [Google Scholar] [CrossRef]
- Benoît, C.; Norris, G.A.; Valdivia, S.; Ciroth, A.; Moberg, Å.; Bos, U.; Prakash, S.; Ugaya, C.; Beck, T. The Guidelines for Social Life Cycle Assessment of Products: Just in Time! Int. J. Life Cycle Assess. 2010, 15, 156–163. [Google Scholar] [CrossRef]
- UNEP. The Methodological Sheets for Sub-Categories in Social Life Cycle Assessment (S-LCA); UNEP: Nairobi, Kenya, 2013. [Google Scholar]
- China National Bureau of Statistics. China Statistical Yearbook—2021; China Statistics Press: Beijing, China, 2021.
- China National Bureau of Statistics. China Rural Statistical Yearbook—2021; China Statistics Press: Beijing, China, 2021.
- CEADs. Available online: https://www.ceads.Net/ (accessed on 7 January 2022).
- Benoit-Norris, C.; Cavan, D.A.; Norris, G. Identifying Social Impacts in Product Supply Chains: Overview and Application of the Social Hotspot Database. Sustainability 2012, 4, 1946–1965. [Google Scholar] [CrossRef] [Green Version]
- Ishizaka, A.; Labib, A. Review of the Main Developments in the Analytic Hierarchy Process. Expert Syst. Appl. 2011, 38, 14336–14345. [Google Scholar] [CrossRef] [Green Version]
- Xie, Z.; Zhang, F.; Lun, F.; Gao, Y.; Ao, J.; Zhou, J. Research on a Diagnostic System of Rural Vitalization Based on Development Elements in China. Land Use Policy 2020, 92, 104421. [Google Scholar] [CrossRef]
- Long, H.; Zhang, Y.; Tu, S. Rural Vitalization in China: A Perspective of Land Consolidation. J. Geogr. Sci. 2019, 29, 517–530. [Google Scholar] [CrossRef] [Green Version]
- Huarachi, D.R.; Piekarski, C.M.; Puglieri, F.N.; de Francisco, A.C. Past and Future of Social Life Cycle Assessment: Historical Evolution and Research Trends. J. Clean. Prod. 2020, 264, 121506. [Google Scholar] [CrossRef]
- Azimi, A.N.; Dente, S.M.R.; Hashimoto, S. Social Life-Cycle Assessment of Household Waste Management System in Kabul City. Sustainability 2020, 12, 3217. [Google Scholar] [CrossRef] [Green Version]
- Cadena, E.; Rocca, F.; Gutierrez, J.A.; Carvalho, A. Social Life Cycle Assessment Methodology for Evaluating Production Process Design: Biorefinery Case Study. J. Clean. Prod. 2019, 238, 238. [Google Scholar] [CrossRef]
- De Luca, A.I.; Iofrida, N.; Strano, A.; Falcone, G.; Gulisano, G. Social Life Cycle Assessment and Participatory Approaches: A Methodological Proposal Applied to Citrus Farming in Southern Italy. Integr. Environ. Assess. Manag. 2015, 11, 383–396. [Google Scholar] [CrossRef]
- Osorio-Tejada, J.L.; Llera-Sastresa, E.; Scarpellini, S.; Hashim, A.H. An Integrated Social Life Cycle Assessment of Freight Transport Systems. Int. J. Life Cycle Assess. 2020, 25, 1088–1105. [Google Scholar] [CrossRef]
- Soltanpour, Y.; Peri, I.; Temri, L. Area of Protection in S-LCA: Human Well-Being or Societal Quality. Int. J. Life Cycle Assess. 2019, 24, 2073–2087. [Google Scholar] [CrossRef]
- Sureau, S.; Neugebauer, S.; Achten, W.M.J. Different Paths in Social Life Cycle Impact Assessment (S-LCIA)—A Classification of Type II Impact Pathway Approaches. Int. J. Life Cycle Assess. 2020, 25, 382–393. [Google Scholar] [CrossRef] [Green Version]
- Tallentire, C.W.; Edwards, S.A.; Van Limbergen, T.; Kyriazakis, I. The Challenge of Incorporating Animal Welfare in a Social Life Cycle Assessment Model of European Chicken Production. Int. J. Life Cycle Assess. 2018, 24, 1093–1104. [Google Scholar] [CrossRef] [Green Version]
- Wu, S.R.; Celik, I.; Apul, D.; Chen, J. A Social Impact Quantification Framework for the Resource Extraction Industry. Int. J. Life Cycle Assess. 2019, 24, 1898–1910. [Google Scholar] [CrossRef]
- Kono, J.; Ostermeyer, Y.; Wallbaum, H. Trade-Off Between the Social and Environmental Performance of Green Concrete: The Case of 6 Countries. Sustainability 2018, 10, 2309. [Google Scholar] [CrossRef] [Green Version]
- Martín-Gamboa, M.; Dias, A.C.; Arroja, L.; Iribarren, D. A Protocol for the Definition of Supply Chains in Product Social Life Cycle Assessment: Application to Bioelectricity. Sustain. Energy Fuels 2020, 4, 5533–5542. [Google Scholar] [CrossRef]
- Shang, Z.; Wang, M.; Su, D.; Liu, Q.; Zhu, S. Ontology Based Social Life Cycle Assessment for Product Development. Adv. Mech. Eng. 2018, 10, 11. [Google Scholar] [CrossRef]
- Delcour, A.; Van Stappen, F.; Burny, P.; Goffart, J.P.; Stilmant, D. Assessment and Contributions of Different Social Life Cycle Assessments Performed in the Agribusiness Sector. Biotechnol. Agron. Soc. 2015, 19, 402–414. [Google Scholar]
- Naghshineh, B.; Lourenço, F.; Godina, R.; Jacinto, C.; Carvalho, H. A Social Life Cycle Assessment Framework for Additive Manufacturing Products. Appl. Sci. 2020, 10, 4459. [Google Scholar] [CrossRef]
- Petti, L.; Ramirez, P.K.S.; Traverso, M.; Ugaya, C.M.L. An Italian Tomato “Cuore Di Bue” Case Study: Challenges and Benefits Using Subcategory Assessment Method for Social Life Cycle Assessment. Int. J. Life Cycle Assess. 2018, 23, 569–580. [Google Scholar] [CrossRef]
- Vinyes, E.; Oliver-Solà, J.; Ugaya, C.; Rieradevall, J.; Gasol, C.M. Application of LCSA to Used Cooking Oil Waste Management. Int. J. Life Cycle Assess. 2013, 18, 445–455. [Google Scholar] [CrossRef]
- D’eusanio, M.; Lehmann, A.; Finkbeiner, M.; Petti, L. Social Organizational Life Cycle Assessment: An Approach for Identification of Relevant Subcategories for Wine Production in Italy. Int. J. Life Cycle Assess. 2020, 25, 1119–1132. [Google Scholar] [CrossRef]
- Tavakoli, H.; Barkdoll, B.D. Blended Lifecycle Integrated Social System Method. Int. J. Environ. Res. 2020, 14, 727–749. [Google Scholar] [CrossRef]
- Petti, L.; Serreli, M.; Di Cesare, S. Systematic Literature Review in Social Life Cycle Assessment. Int. J. Life Cycle Assess. 2018, 23, 422–431. [Google Scholar] [CrossRef]
- Venkatesh, G. Critique of Selected Peer-Reviewed Publications on Applied Social Life Cycle Assessment: Focus on Cases from Developing Countries. Clean Technol. Environ. Policy 2018, 21, 413–430. [Google Scholar] [CrossRef] [Green Version]
- Khorassani, S.M.; Ferrari, A.M.; Pini, M.; Blundo, D.S.; Muiña, F.E.G.; García, J.F. Environmental and Social Impact Assessment of Cultural Heritage Restoration and Its Application to the Uncastillo Fortress. Int. J. Life Cycle Assess. 2019, 24, 1297–1318. [Google Scholar] [CrossRef]
- Cardoso, T.F.; Watanabe, M.D.; Souza, A.; Chagas, M.F.; Cavalett, O.; Morais, E.; Nogueira, L.H.; Leal, M.R.L.; Braunbeck, O.A.; Cortez, L.A.; et al. Economic, Environmental, and Social Impacts of Different Sugarcane Production Systems. Biofuels Bioprod. Biorefining 2018, 12, 68–82. [Google Scholar] [CrossRef]
- Nieder-Heitmann, M.; Haigh, K.F.; Görgens, J.F. Life Cycle Assessment and Multi-Criteria Analysis of Sugarcane Biorefinery Scenarios: Finding a Sustainable Solution for the South African Sugar Industry. J. Clean. Prod. 2019, 239, 118039. [Google Scholar] [CrossRef]
- Pillain, B.; Viana, L.; Lefeuvre, A.; Jacquemin, L.; Sonnemann, G. Social Life Cycle Assessment Framework for Evaluation of Potential Job Creation with an Application in the French Carbon Fiber Aeronautical Recycling Sector. Int. J. Life Cycle Assess. 2019, 24, 1729–1742. [Google Scholar] [CrossRef]
Publisher’s Note: MDPI stays neutral with regard to jurisdictional claims in published maps and institutional affiliations. |
© 2022 by the authors. Licensee MDPI, Basel, Switzerland. This article is an open access article distributed under the terms and conditions of the Creative Commons Attribution (CC BY) license (https://creativecommons.org/licenses/by/4.0/).