
Variable Rate Seeding in Precision Agriculture: Recent Advances and Future Perspectives

 , ,
, ,  ,
,  ,
, 
 and
and 
Abstract
:1. Introduction
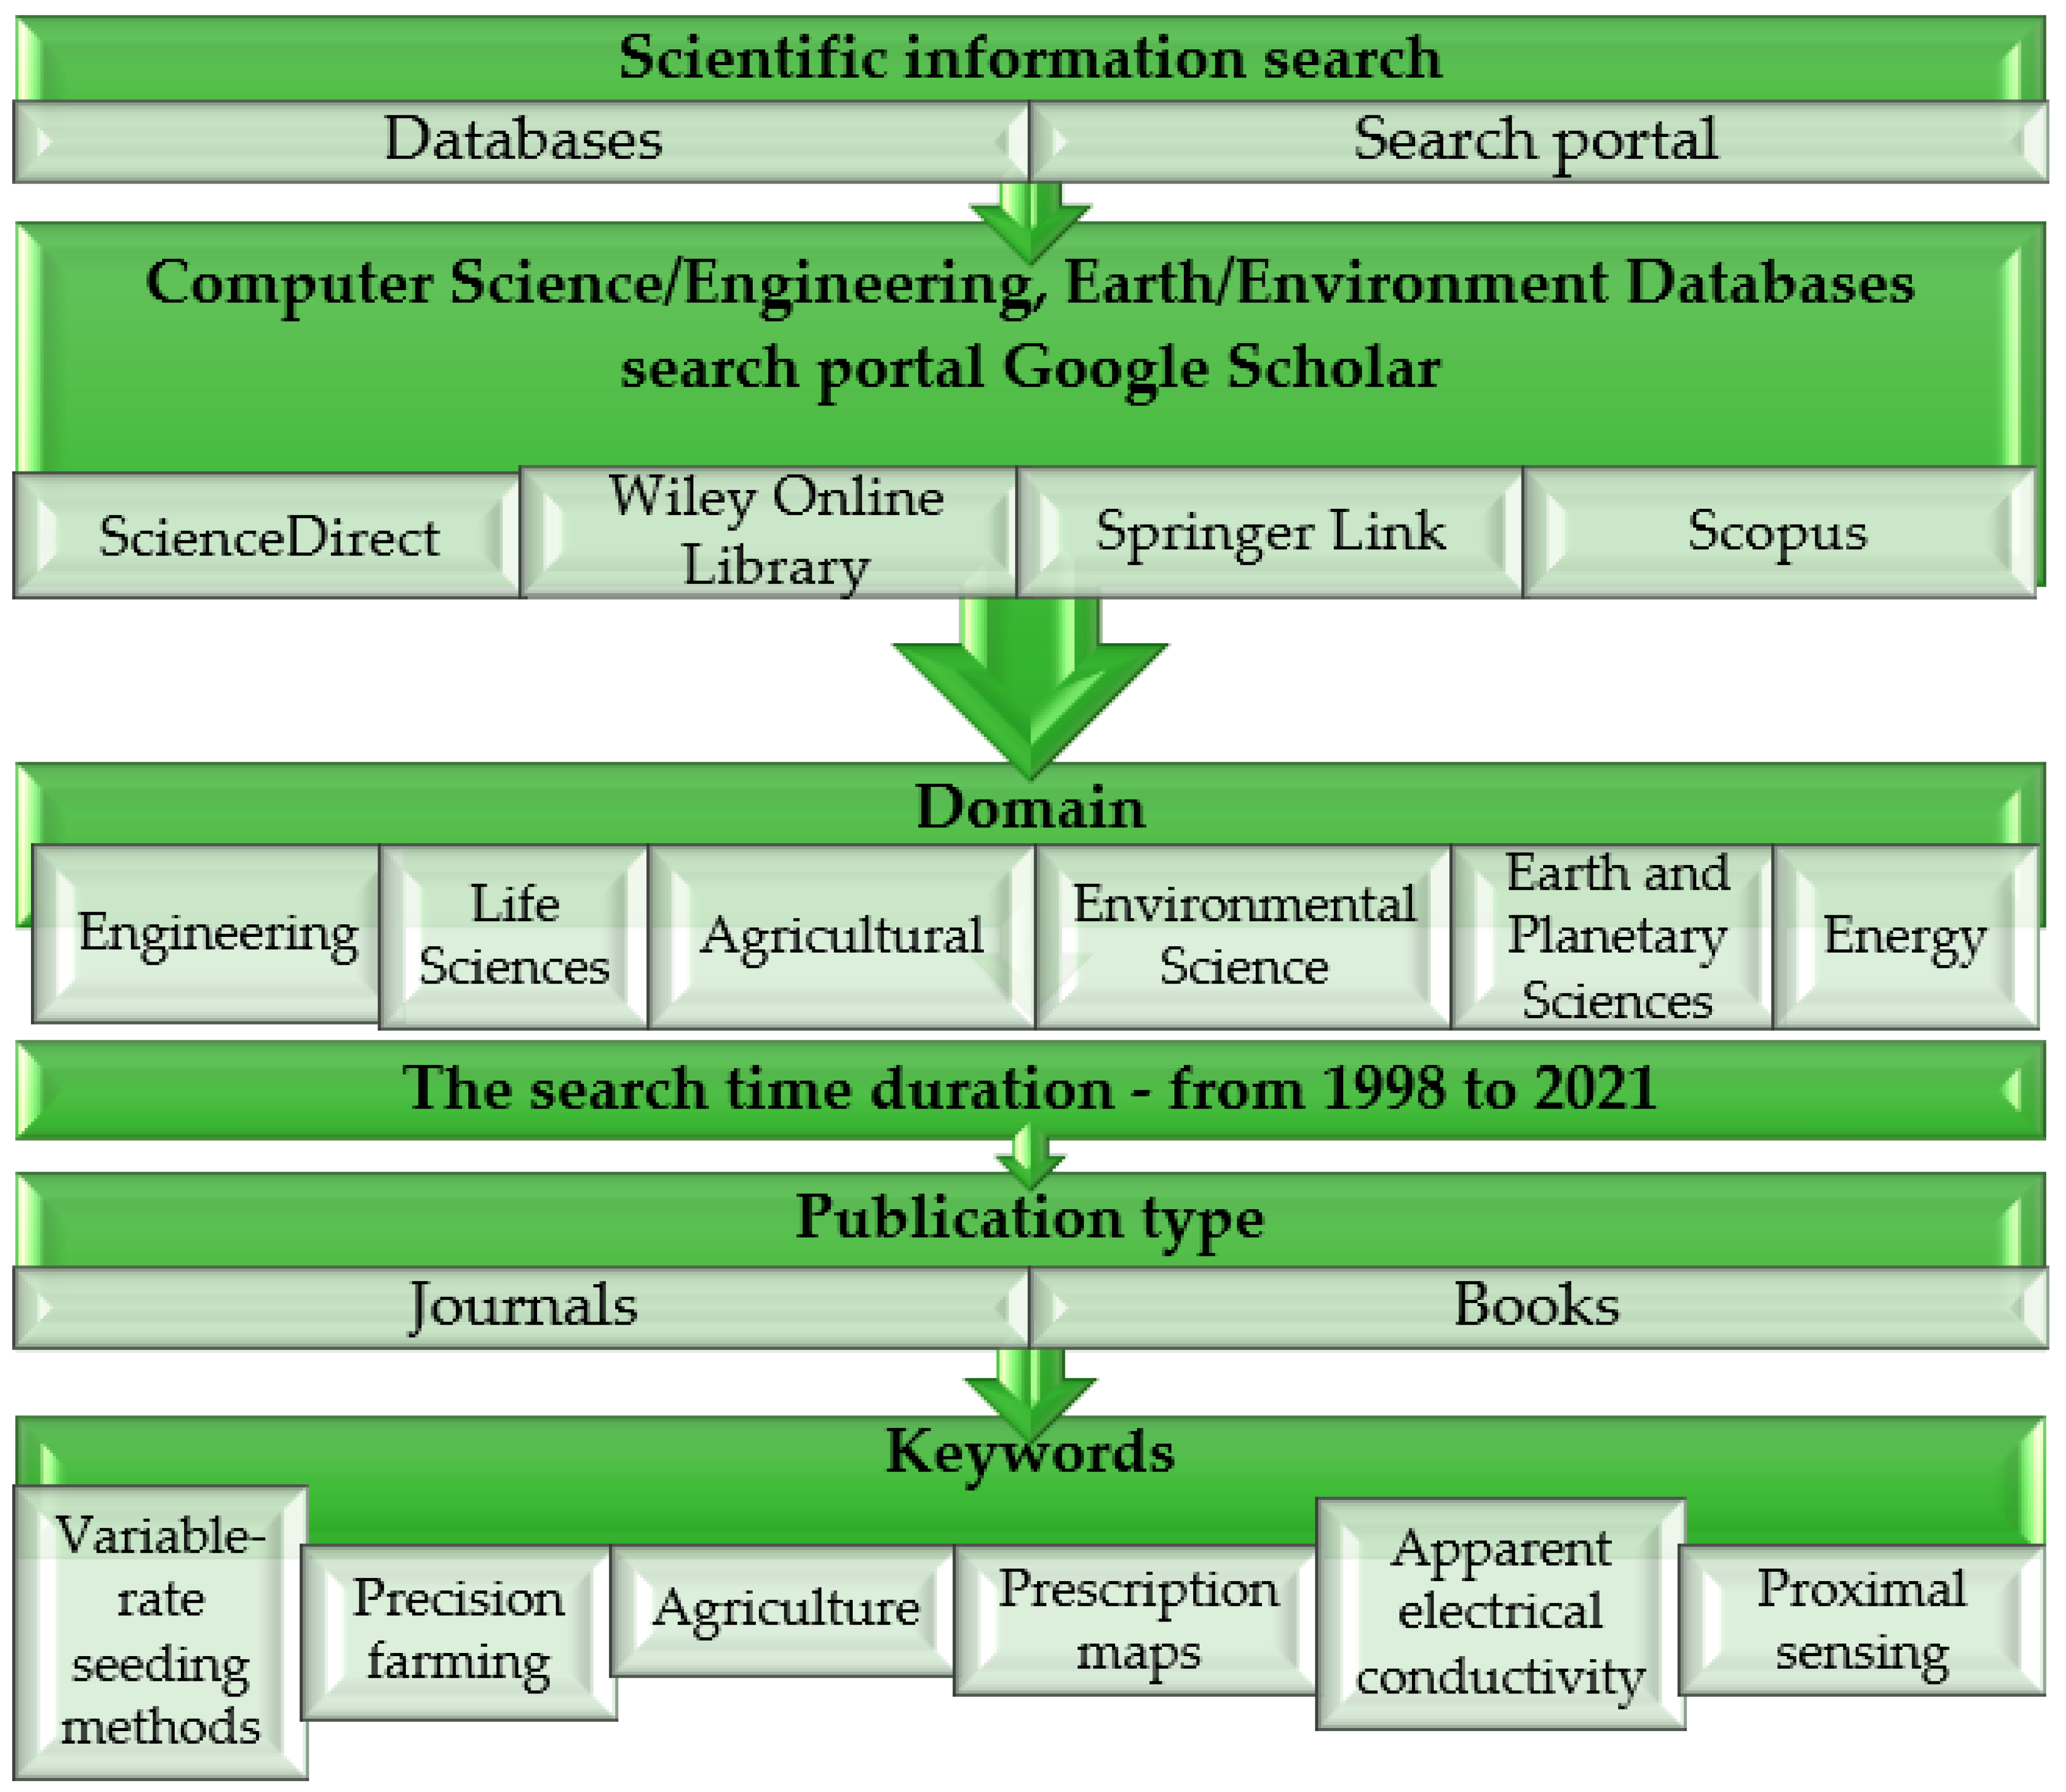
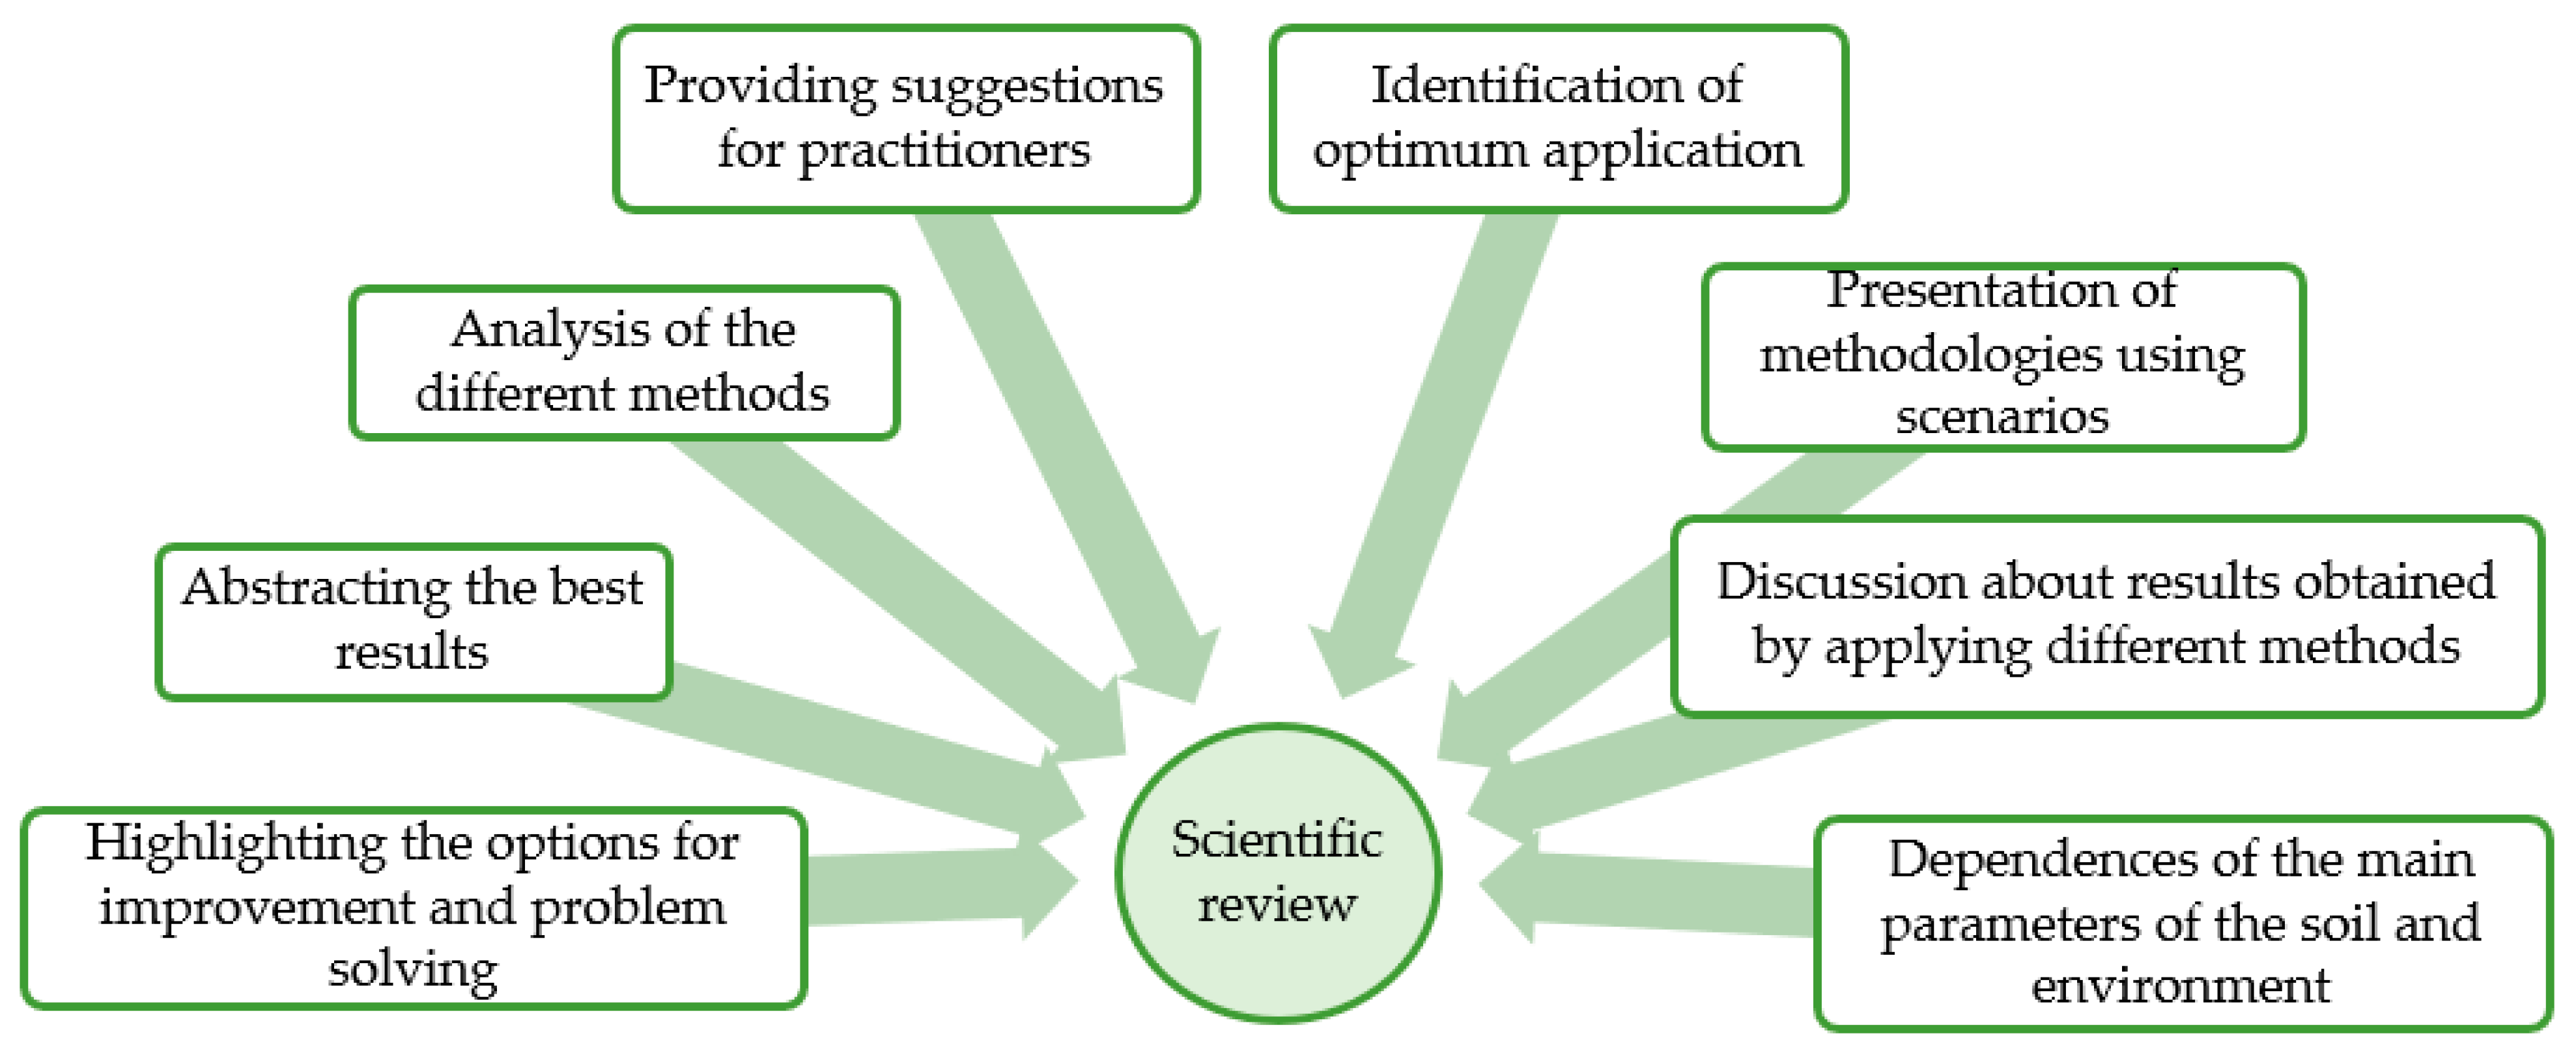
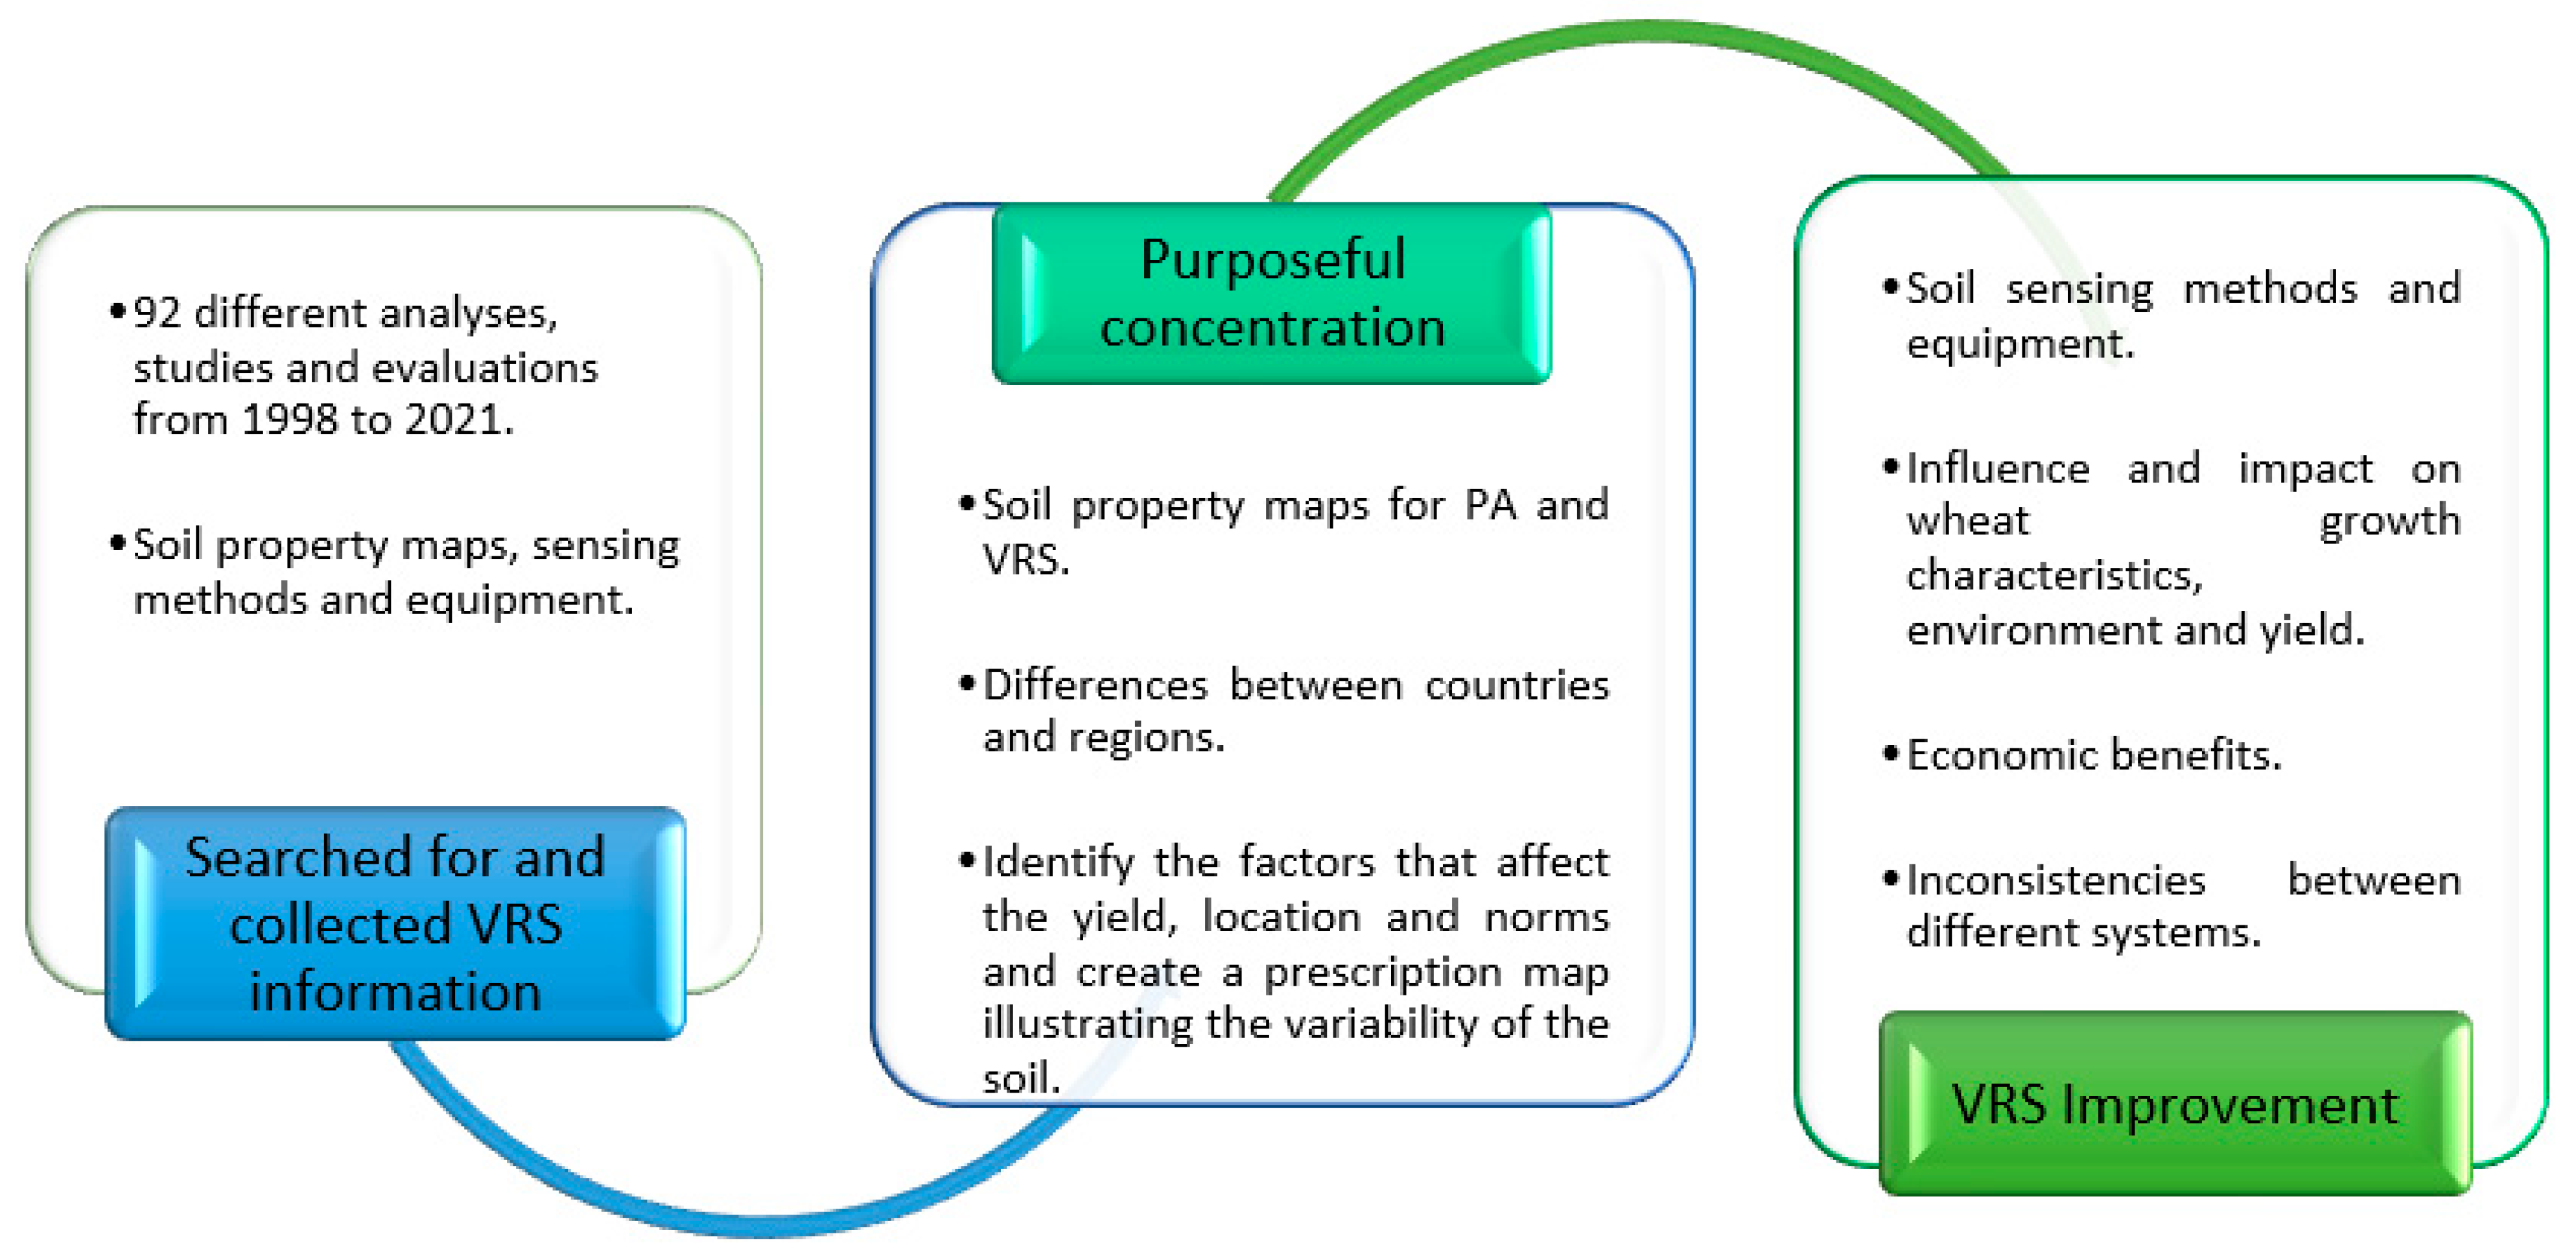
2. Search Methods
3. Findings
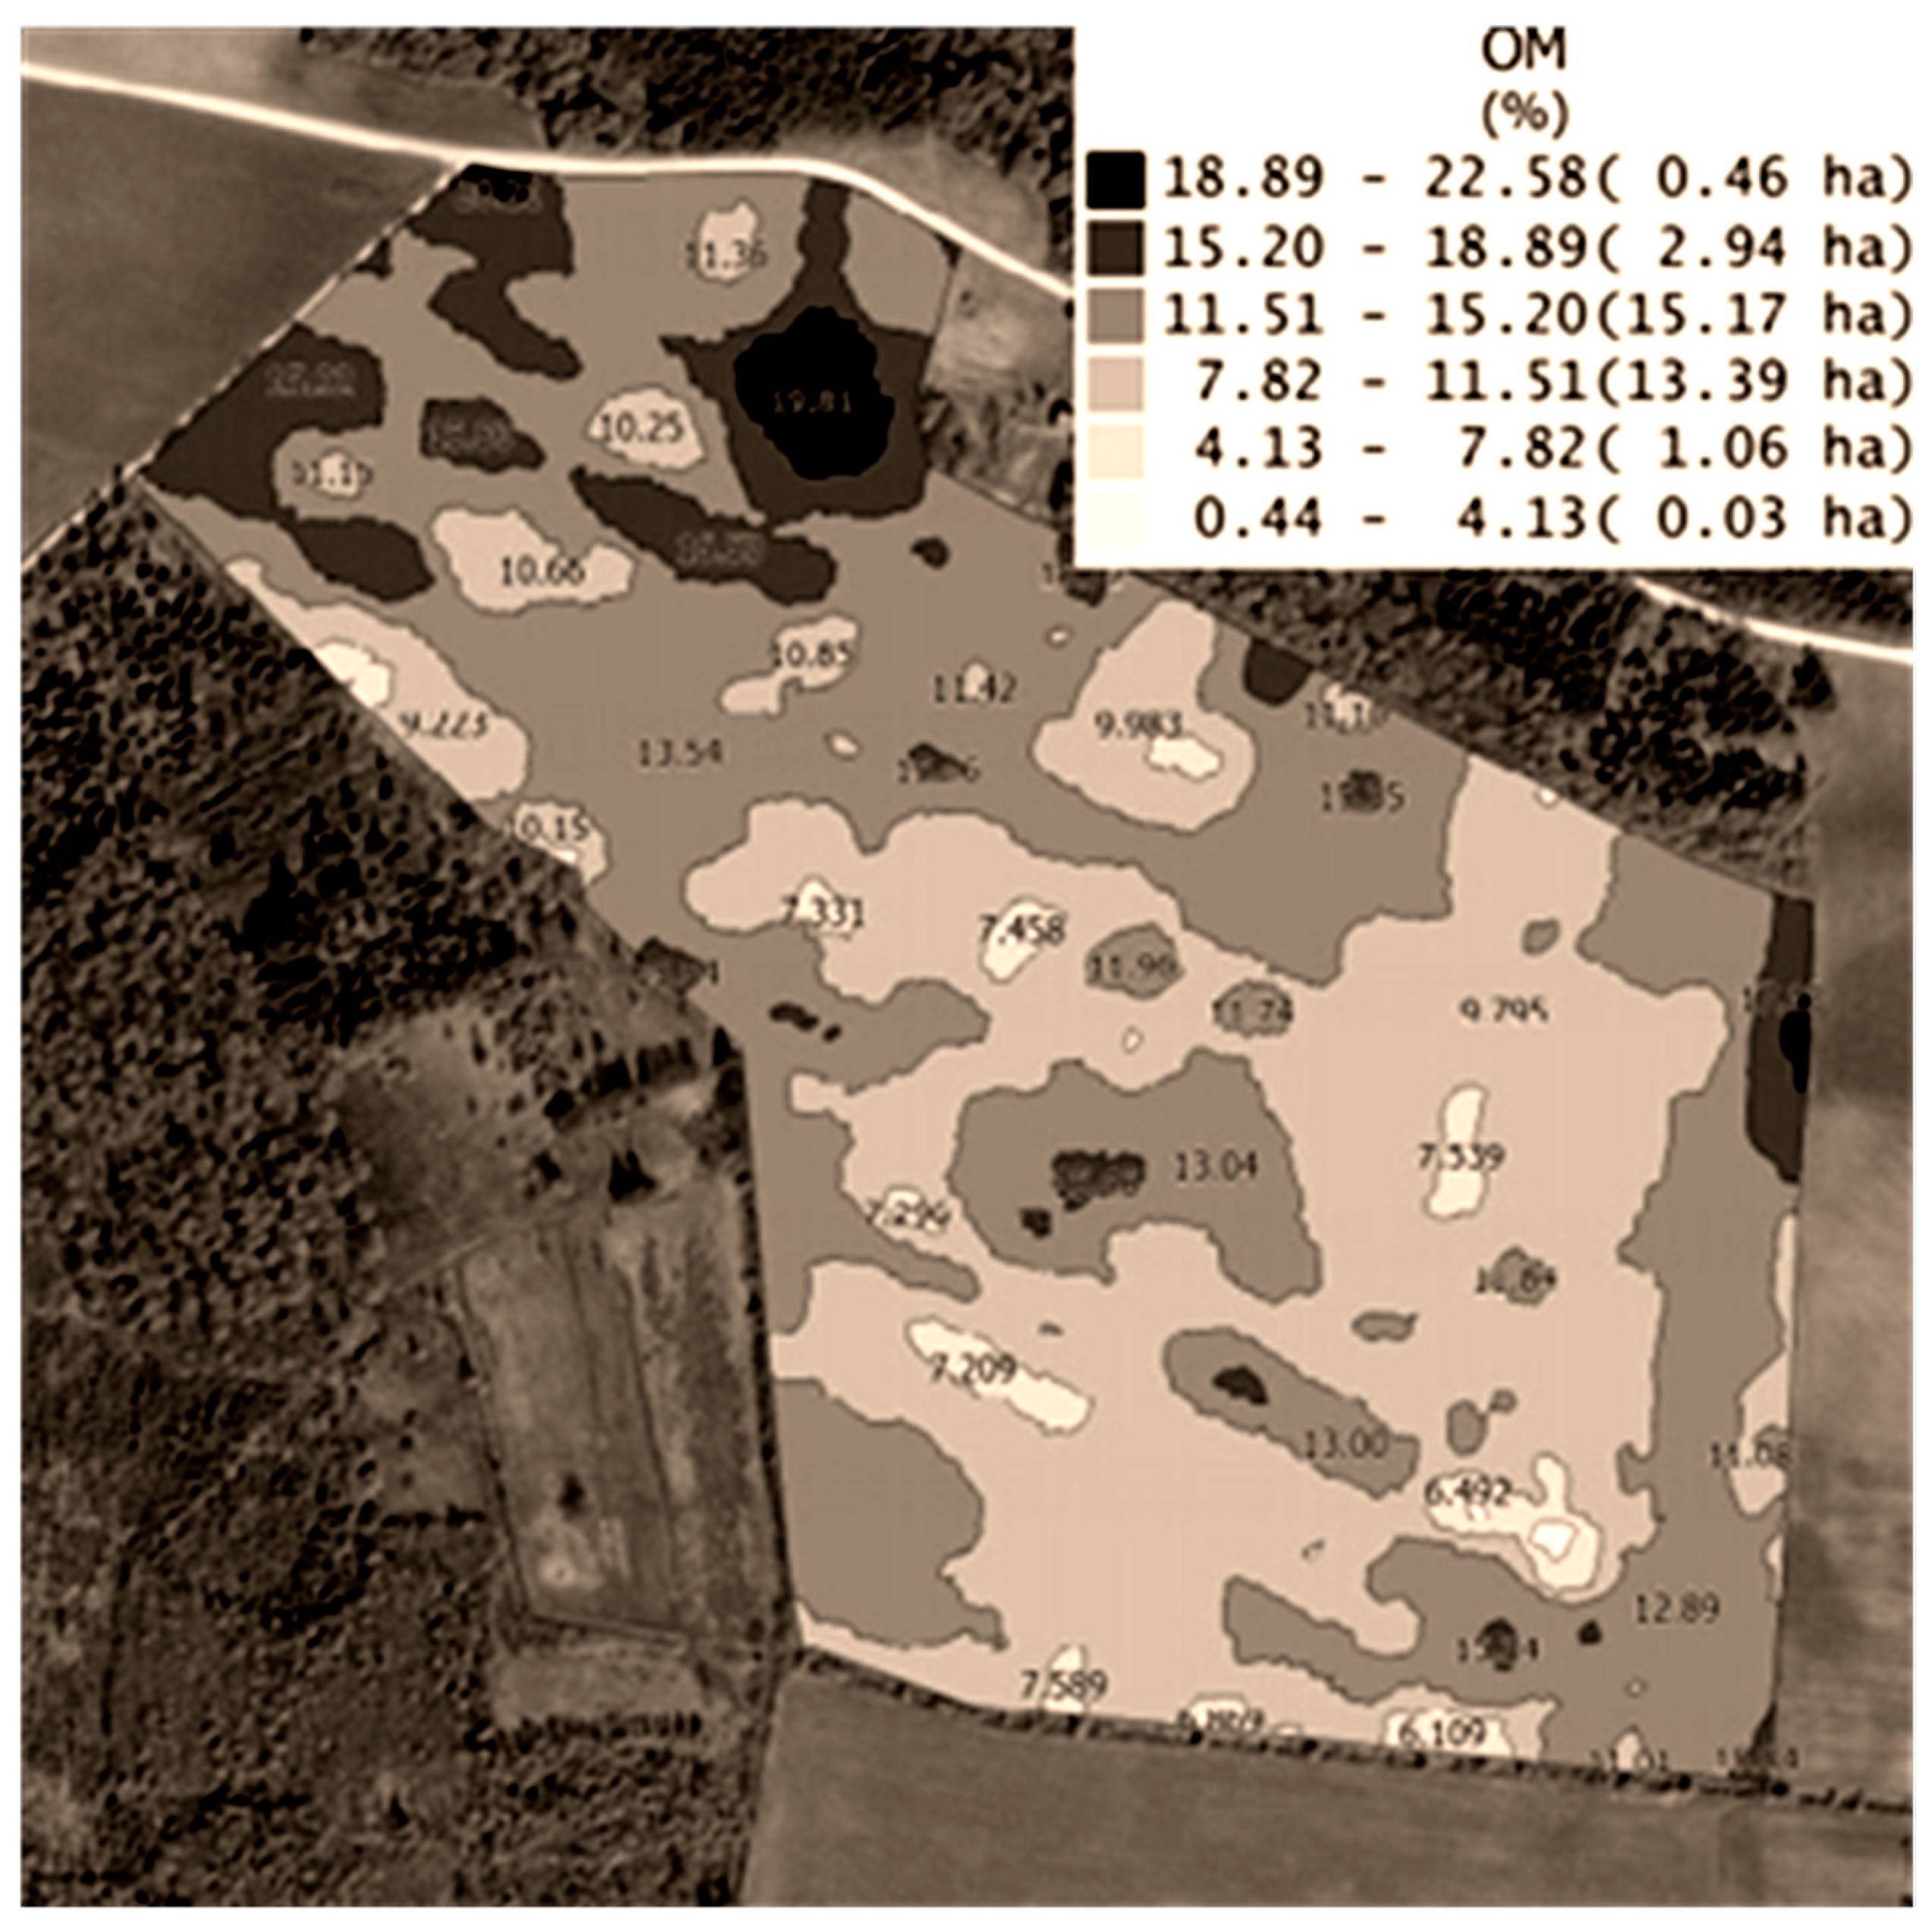
3.1. The Assessment of Soil Property Maps for PA and VRS
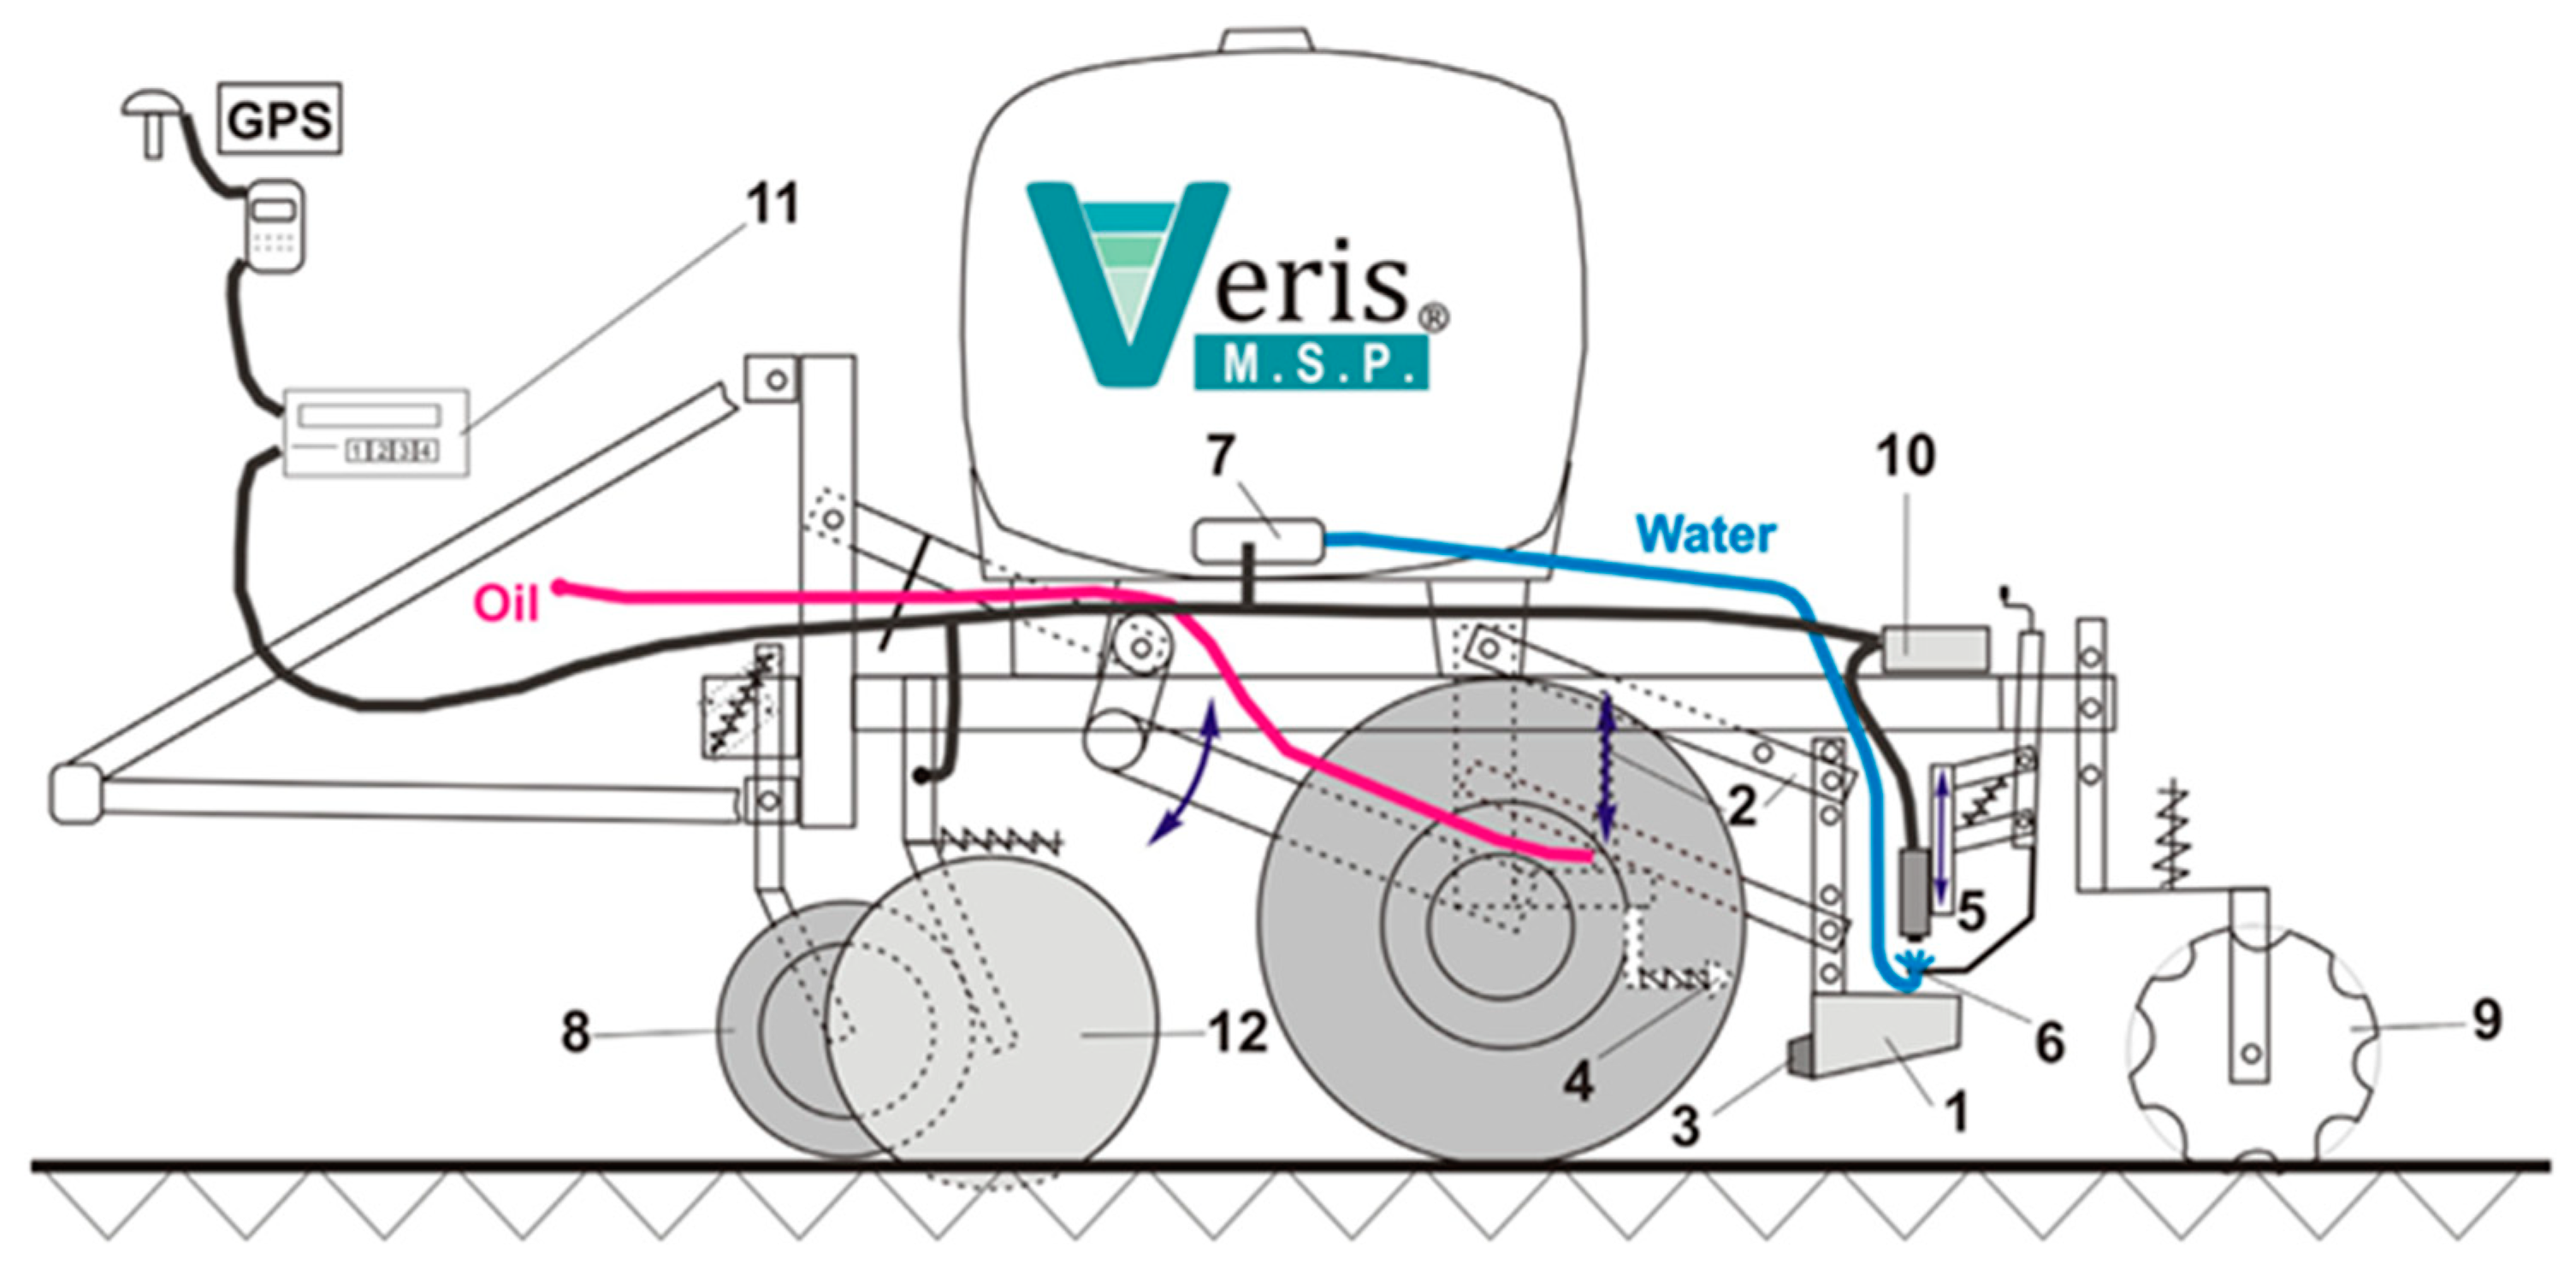
3.2. The Assessment of Soil Sensing Methods and Equipment Used for VRS
4. The Influence of VRS on Wheat Growth Characteristics
5. The Assessment of Economic Benefits of VRS
6. Conclusions and Future Prospects
Author Contributions
Funding
Institutional Review Board Statement
Informed Consent Statement
Data Availability Statement
Acknowledgments
Conflicts of Interest
References
- Erickson, B.; Widmar, D.A. Precision Agricultural Services Dealership Survey Results; Purdue University Department of Agriculture Economics/Department of Agronomy: West Lafayette, IN, USA, 2015; p. 37. Available online: http://agribusiness.purdue.edu/files/resources/2015-crop-lifepurdue-precision-dealer-survey.pdf (accessed on 7 February 2021).
- Fulton, J. Variable-rate seeding systems for precision agriculture. In Precision Agriculture for Sustainability; Stafford, J., Ed.; Burleigh Dodds Science Publishing Limited, Silsoe Solutions: Cambridge, UK, 2019; pp. 28–297. [Google Scholar]
- Hoeft, R.G.; Aldrich, S.R.; Nafziger, E.D.; Johnson, R.R. Modern Corn and Soybean Production, 1st ed.; MCSP Publications: Savoy, IL, USA, 2000. [Google Scholar]
- Spogis, L.; Steponavičius, D. Methodology for preparing variable seed rate maps. Agroinžinerija Ir Energ. 2019, 24, 194–200. (In Lithuanian) [Google Scholar]
- Virk, S.S.; Fulton, J.P.; Porter, W.M.; Pate, G.L. Row-crop planter performance to support variable rate seeding of maize. Precis. Agric. 2020, 21, 603–619. [Google Scholar] [CrossRef] [Green Version]
- Bullock, D.S.G.; Bullock, D.S.G.; Nafziger, E.D.; Stafford, J.V. Variable rate seeding of maize in the Midwestern USA. In Precision Agriculture’99, Part 1 and Part 2, Proceedings of the 2nd European Conference on Precision Agriculture, Odense, Denmark, 11–15 July 1999; Sheffield Academic Press: Sheffield, UK, 1999. [Google Scholar]
- Shanahan, J.F.; Doerge, T.A.; Johnson, J.J.; Vigil, M.F. Feasibility of site-specific management of corn hybrids and plant densities in the great plains. Precis. Agric. 2004, 5, 207–225. [Google Scholar] [CrossRef] [Green Version]
- Pedersen, S.M.; Lind, K.M. Precision Agriculture: Technology and Economic Perspectives; Springer International Publishing: Cham, Switzerland, 2017; p. 276. [Google Scholar]
- Jeschke, M.; Carter, P.; Bax, P.; Schon, R. Putting variable rate seeding to work on your farm. Crop Insights 2015, 25, 1–4. [Google Scholar]
- Grisso, R.B.; Mark, A.; Wade, T.; David, H.; Roverson, G.T. Precision Farming Tools: Variable-Rate Application. Va. Coop. Ext. 2011, 1–7. Available online: https://vtechworks.lib.vt.edu/bitstream/handle/10919/47448/442-505_PDF.pdf (accessed on 17 February 2022).
- Munnaf, M.A.; Haesaert, G.; Van Meirvenne, M.; Mouazen, A.M. Site-specific seeding using multi-sensor and data fusion techniques: A review. Adv. Agron. 2020, 161, 241–323. [Google Scholar]
- Licht, M.A.; Lenssen, A.W.; Elmore, R.W. Corn (Zea mays L.) seeding rate optimization in Iowa, USA. Precis. Agric. 2017, 18, 452–469. [Google Scholar] [CrossRef] [Green Version]
- Kaspar, T.C.; Colvin, T.S.; Jaynes, D.B.; Karlen, D.L.; James, D.E.; Meek, D.W. Relationship between six years of corn yields and terrain attributes. Precis. Agric. 2003, 4, 87–101. [Google Scholar] [CrossRef]
- Griffin, S.; Hollis, J. Using profile soil electrical conductivity survey data to predict wheat establishment rates in the United Kingdom. In Precision Agriculture’13; Wageningen Academic Publishers: Wageningen, The Netherlands, 2013; pp. 491–497. [Google Scholar]
- Butzen, S.; Gunzenhauser, B.; Shanahan, J. Putting Variable Rate Seeding to Work on Your Farm; DuPont Pioneer: Johnston, IA, USA, 2012. [Google Scholar]
- Schirrmann, M.; Gebbers, R.; Kramer, E.; Seidel, J. Soil pH mapping with an on-the-go sensor. Sensors 2011, 11, 573–598. [Google Scholar] [CrossRef]
- Hamzehpour, N.; Shafizadeh-Moghadam, H.; Valavi, R. Exploring the driving forces and digital mapping of soil organic carbon using remote sensing and soil texture. Catena 2019, 182, 104–141. [Google Scholar] [CrossRef]
- Kelley, J.; Higgins, C.W.; Pahlow, M.; Noller, J. Mapping soil texture by electromagnetic induction: A case for regional data coordination. Soil Sci. Soc. Am. J. 2017, 81, 923–931. [Google Scholar] [CrossRef]
- Bousbih, S.; Zribi, M.; Pelletier, C.; Gorrab, A.; Lili-Chabaane, Z.; Baghdadi, N.; Ben Aissa, N.; Mougenot, B. Soil texture estimation using radar and optical data from Sentinel-1 and Sentinel-2. Remote Sens. 2019, 11, 1520. [Google Scholar] [CrossRef] [Green Version]
- Lund, E.D.; Christy, C.D.; Drummond, P.E. Practical applications of soil electrical conductivity mapping. Precis. Agric. 1999, 99, 771–779. [Google Scholar]
- Corwin, D.L.; Lesch, S.M. Apparent soil electrical conductivity measurements in agriculture. Comput. Electron. Agric. 2005, 46, 11–43. [Google Scholar] [CrossRef]
- Kazlauskas, M.; Šarauskis, E.; Romaneckas, K.; Steponavičius, D.; Jasinskas, A.; Naujokienė, V.; Bručienė, I.; Žiogas, T.; Vaicekauskas, D.; Anušauskas, J.; et al. Effect of variable rate seeding on winter wheat seedbed and germination parameters using soil apparent electrical conductivity. In Proceedings of the Engineering for Rural Development: 20th International Scientific Conference, Engineering for Rural Development, Jelgava, Latvia, 26–28 May 2021; Volume 20, pp. 1108–1113. [Google Scholar]
- Al-Shammary, A.A.; Kouzani, A.Z.; Saeed, T.R.; Lahmod, N.R.; Mouazen, A.M. Evaluation of a novel electromechanical system for measuring soil bulk density. Biosyst. Eng. 2019, 179, 140–154. [Google Scholar] [CrossRef]
- Watson, C.A.; Atkinson, D.; Gosling, P.; Jackson, L.R.; Rayns, F.W. Managing soil fertility in organic farming systems. Soil Use Manag. 2006, 18, 239–247. [Google Scholar] [CrossRef] [Green Version]
- Doran, J.W.; Parkin, T.B. Defining and assessing soil quality. In Defining Soil Quality for a Sustainable Environment; Doran, J.W., Coleman, D.C., Bezdicek, D.F., Stewart, B.A., Eds.; Soil Science Society of America and American Society of Agronomy: Madison, WI, USA, 1994; Volume 35, pp. 1–21. [Google Scholar]
- Grisso, R.D.; Alley, M.M.; Holshouser, D.L.; Thomason, W.E. Precision farming tools. soil electrical conductivity. Va. Coop. Ext. 2009, 442–508, 1–6. [Google Scholar]
- Gaile, Z.; Ruza, A.; Kreita, D.; Paura, L. Yield components and quality parameters of winter wheat depending on tillering coefficient. Agron. Res. 2017, 15, 79–93. [Google Scholar]
- Wilson, J.P.; Gallant, J.C. Terrain Analysis: Principles and Applications; Wilson, J.P., Gallant, J.C., Eds.; John Wiley & Sons, Inc.: New York, NY, USA, 2000. [Google Scholar]
- Bunemann, E.K.; Bongiorno, G.; Bai, Z.; Creamer, R.E.; De Deyn, G.; de Goede, R.; Fleskens, L.; Geissen, V.; Kuyper, T.W.; Mader, P.; et al. Soil quality—A critical review. Soil Biol. Biochem. 2018, 120, 105–125. [Google Scholar] [CrossRef]
- Nolin, M.C.; Forand, G.; Simard, R.R.; Cambouris, A.N.; Karam, A. Soil specific relationships between corn/soybean yield, soil quality indicators and climatic data. [CDROM]. In Proceedings of the Fifth International Conference on Precision Agriculture, Bloomington, MN, USA, 16–19 July 2000; Robert, P.C., Rust, R.H., Larson, W.E., Eds.; ASA, CSSA, and SSSA: Madison, WI, USA, 2001. [Google Scholar]
- Vasiliniuc, I.; Patriche, C. Selecting parameters for a soil quality index. Gruntoznabstvo 2011, 12, 46–56. [Google Scholar]
- Whetton, R.; Zhao, Y.; Mouazen, A.M. Quantifying individual and collective influences of soil properties on crop yield. Soil Res. 2017, 56, 19–27. [Google Scholar] [CrossRef] [Green Version]
- Van Roekel, R.J.; Coulter, J.A. Agronomic responses of corn to planting date and plant density. Agron. J. 2011, 103, 1414. [Google Scholar] [CrossRef]
- Viscarra Rossel, R.A.; Rizzo, R.; Dematte, J.A.M.; Behrens, T. Spatial modeling of a soil fertility index using visible–near-infrared spectra and terrain attributes. Soil Sci. Soc. Am. J. 2010, 74, 1293. [Google Scholar] [CrossRef]
- Reining, E.; Roth, R.; Kühn, J. Site-specific land use as demonstrated by planning variable seeding rates. In Precision Agriculture; Stafford, J.V., Werner, A., Eds.; Wageningen Academic Publishers: Wageningen, The Netherlands, 2003; pp. 567–572. [Google Scholar]
- Soto, I.; Barnes, A.; Balafoutis, A.; Beck, B.; Sánchez, B.; Vangeyte, J.; Fountas, S.; Wal, T.V.D.; Eory, V.; Gómez-Barbero, M. The Contribution of Precision Agriculture Technologies to Farm Productivity and the Mitigation of Greenhouse Gas Emissions in the EU; EU Science Hub. Publications Office of the European Union: Brussels, Belgium, 2019. [Google Scholar]
- Plant, R.E. Site-specific management: The application of information technology to crop production. Comput. Electron. Agric. 2001, 30, 9–29. [Google Scholar] [CrossRef]
- Bunselmeyer, H.A.; Lauer, J.G. Using corn and soybean yield history to predict subfield yield response. Agron. J. 2015, 107, 558–562. [Google Scholar] [CrossRef]
- Smidt, E.R.; Conley, S.P.; Zhu, J.; Arriaga, F.J. Identifying field attributes that predict soybean yield using random forest analysis. Agron. J. 2016, 108, 637–646. [Google Scholar] [CrossRef] [Green Version]
- Lindsey, A.J.; Thomison, P.R.; Nafziger, E.D. Modeling the Effect of Varied and Fixed Seeding Rates at a Small-Plot Scale. Agron. J. 2018, 110, 2456–2461. [Google Scholar] [CrossRef] [Green Version]
- Taylor, R.K.; Staggenborg, S.; Schrock, M.D.; Zhang, N. Using a GIS to evaluate the potential of variable rate corn seeding. In Proceedings of the ASAE Meeting Presentation, Milwaukee, WI, USA, 9–12 July 2000; pp. 9–12. [Google Scholar]
- Sudduth, K.A.; Kitchen, N.R.; Drummond, S.T. Soil conductivity sensing on claypan soils: Comparison of electromagnetic induction and direct methods. In Proceedings of the 4th International Conference on Precision Agriculture, St. Paul, MN, USA, 19–22 July 1998; Robert, P.C., Rust, R.H., Larson, W.E., Eds.; ASA, CSSA, and SSSA: Madison, WI, USA, 1999; pp. 979–990. [Google Scholar]
- Munnaf, M.A.; Haesaert, G.; Mouazen, A.M. Map-based site-specific seeding of seed potato production by fusion of proximal and remote sensing data. Soil Tillage Res. 2021, 206, 104801. [Google Scholar] [CrossRef]
- Gunzenhauser, B.; Shanahan, J.; Lund, E. Utilizing on-the-go soil sensing devices to improve management zones definition. Crop Insights 2012, 19, 1–4. [Google Scholar]
- Moral, F.J.; Terrón, J.M.; Da Silva, J.M. Delineation of management zones using mobile measurements of soil apparent electrical conductivity and multivariate geostatistical techniques. Soil Tillage Res. 2010, 106, 335–343. [Google Scholar] [CrossRef]
- Heil, K.; Schmidhalter, U. The application of EM38: Determination of soil parameters, selection of soil sampling points and use in agriculture and archaeology. Sensors 2017, 17, 2540. [Google Scholar] [CrossRef] [PubMed] [Green Version]
- Wiesehoff, M.; Müller, J.; Köller, K. Decision support system for map based sowing. In Proceedings of the ASAE Meeting, Chicago, IL, USA, 28–31 July 2002; pp. 1202–1208. [Google Scholar]
- Verbeten, B. Varying Corn & Soybean Populations, Varieties, & Down Force; Cornell University Cooperative Extension: Ithaca, NY, USA, 2015. [Google Scholar]
- Basnyat, P.; McConkey, B.; Meinert, B.; Gatkze, C.; Noble, G. Agriculture field characterization using aerial photograph and satellite imagery. IEEE Geosci. Remote Sens. Lett. 2004, 1, 7–10. [Google Scholar] [CrossRef]
- Fleming, K.L.; Westfall, D.G.; Wiens, D.W.; Brodahl, M.C. Evaluating farmer defined management zone maps for variable rate fertilizer application. Precis. Agric. 2000, 2, 201–215. [Google Scholar] [CrossRef]
- Mzuku, M.; Khosla, R.; Reich, R.; Inman, D.; Smith, F.; MacDonald, L. Spatial variability of measured soil properties across site-specific management zones. Soil Sci. Soc. Am. J. 2005, 69, 1572–1579. [Google Scholar] [CrossRef] [Green Version]
- Schepers, A.R.; Shanahan, J.F.; Liebig, M.A.; Schepers, J.S.; Johnson, S.H.; Luchiari, A. Appropriateness of management zones for characterizing spatial variability of soil properties and irrigated corn yields across years. Agron. J. 2004, 96, 195–203. [Google Scholar] [CrossRef] [Green Version]
- Heege, H.J. Precision in Crop Farming: Site Specific Concepts and Sensing Methods: Applications and Results; Heege, H.J., Ed.; Springer Science+BusinessMedia: Dordrecht, The Netherlands, 2013. [Google Scholar]
- Ehsani, M.R.; Durairaj, C.D.; Woods, S.; Sullivan, M. Potential application of electrical conductivity (EC) map for variable rate seeding. CIGR E-J. 2005, 7, 1–17. [Google Scholar]
- Dwight, K.; Craig, K.; Grant, H.; Farrell, A. Variable Rate Seeding: Easier Than You Think. Available online: https://www.cropquest.com/variable-rate-seeding/ (accessed on 31 July 2021).
- Holmes, A. Transforming variability to profitability—Variable seed rates in New Zealand maize. In Proceedings of the 7th Asian-Australasian Conference on Precision Agriculture, Hamilton, New Zealand, 16–18 October 2017; pp. 1–7. [Google Scholar]
- Kuang, B.; Mouazen, A.M. Calibration of visible and near infrared spectroscopy for soil analysis at the field scale on three European farms. Eur. J. Soil Sci. 2011, 62, 629–636. [Google Scholar] [CrossRef]
- Bullock, D.S.; Kitchen, N.; Bullock, D.G. Multidisciplinary teams: A necessity for research in precision agriculture systems. Crop Sci. 2007, 47, 1765–1769. [Google Scholar] [CrossRef] [Green Version]
- Brouder, S.M.; Hofmann, B.S.; Morris, D.K. Mapping soil pH: Accuracy of common soil sampling strategies and estimation techniques. Soil Sci. Soc. Am. J. 2005, 69, 427–441. [Google Scholar] [CrossRef]
- Taylor, J.A.; Whelan, B.M.; Mcbratney, A.B. Determining optimum management zone-based seeding rates using on farm experimentation and variable rate seeding technologies. In Proceedings of the 8th International Conference on Precision Agriculture, Minneapolis, MN, USA, 23–26 July 2006. [Google Scholar]
- Steyer Soil Explorer Soil Sensor: An Innovative Way to “Deepen” Farmers’ Knowledge of Their Soil and Increase Their Tillage Efficiency. Available online: https://www.steyr-traktoren.com/en-distributor/agriculture/News-Site/Pages/2018-11-21-STEYR-SOILXPLORER.aspx (accessed on 29 July 2021).
- The Agronomic Design 2019 Meeting Passed with Many Farmers and Huge Interest. Available online: https://titanmachinery.bg/en/article/s-mnogo-zemedeltsi-i-pri-silen-interes-premina-agronomic-design-2019 (accessed on 29 July 2021).
- Silva, E.E.; Baio, F.H.R.; Kolling, D.F.; Júnior, R.S.; Zanin, A.R.A.; Neves, D.C.; Fontoura, J.V.P.F.; Teodoro, P.E. Variable-rate in corn sowing for maximizing grain yield. Sci. Rep. 2021, 11, 12711. [Google Scholar] [CrossRef] [PubMed]
- Jafari, M.; Hemmat, A.; Sadeghi, M. Development and performance assessment of a DC electric variable-rate controller for use on grain drills. Comput. Electron. Agric. 2010, 73, 56–65. [Google Scholar] [CrossRef]
- Spink, J.H.; Semere, T.; Spares, D.L.; Whaley, J.M.; Foulkes, J.M.; Clare, R.W.; Scott, R.K. Effect of sowing date on the optimum plant density of winter wheat. Ann. Appl. Biol. 2000, 137, 179–188. [Google Scholar] [CrossRef]
- Bhatta, M.; Eskridge, K.M.; Rose, D.J.; Santra, D.K.; Baenziger, P.S.; Regassa, T. Seeding rate, genotype, and top-dressed nitrogen effects on yield and agronomic characteristics of winter wheat. Crop Sci. 2017, 57, 951–963. [Google Scholar] [CrossRef] [Green Version]
- Lloveras, J.; Manent, J.; Viudas, J.; López, A.; Santiveri, P. Seeding rate influence on yield and yield components of irrigated winter wheat in a Mediterranean climate. Agron. J. 2004, 96, 1258–1265. [Google Scholar] [CrossRef]
- Chen, C.; Neill, K.; Wichman, D.; Westcott, M. Hard red spring wheat response to row spacing, seeding rate, and nitrogen. Agron. J. 2008, 100, 1296–1302. [Google Scholar] [CrossRef] [Green Version]
- Ayalew, T.; Abebe, B.; Yoseph, T. Response of wheat (Tritium aestivum L.) to variable seed rates: The case of Hawassa area, Southern Ethiopia. Afr. J. Agric. Res. 2017, 12, 1177–1181. [Google Scholar]
- Iqbal, J.; Hayat, K.; Hussain, S.; Ali, A.; Bakhsh, M.A.A.H.A. Effect of seeding rates and nitrogen levels on yield and yield components of wheat (Triticum aestivum L.). Pak. J. Nutr. 2012, 11, 531. [Google Scholar] [CrossRef] [Green Version]
- Kühling, I.; Redozubov, D.; Broll, G.; Trautz, D. Impact of tillage, seeding rate and seeding depth on soil moisture and dryland spring wheat yield in Western Siberia. Soil Tillage Res. 2017, 170, 43–52. [Google Scholar] [CrossRef]
- Jiang, P.; Thelen, K.D. Effect of soil and topographic properties on crop yield in a North-Central corn–soybean cropping system. Agron. J. 2004, 96, 252. [Google Scholar] [CrossRef]
- Hörbe, T.A.N.N.; Amado, T.J.C.C.; Ferreira, A.O.; Alba, P.J. Optimization of corn plant population according to management zones in Southern Brazil. Precis. Agric. 2013, 14, 450–465. [Google Scholar] [CrossRef]
- Lindsey, A.J.; Thomison, P.R.; Mullen, R.; Geyer, A.B. Corn response to planting date as affected by plant population and hybrid in continuous corn cropping systems. Crop Forage Turfgrass Manag. 2015, 1, 1–7. [Google Scholar] [CrossRef]
- Geleta, B.; Atak, M.; Baenziger, P.S.; Nelson, L.A.; Baltenesperger, D.D.; Eskridge, K.M.; Shipman, M.J.; Shelton, D.R. Seeding rate and genotype effect on agronomic performance and end-use quality of winter wheat. Crop Sci. 2002, 42, 827–832. [Google Scholar]
- Whaley, J.M.; Sparkes, D.L.; Foulkes, M.J.; Spink, J.H.; Semere, T.; Scott, R.K. The physiological response of winter wheat to reductions in plant density. Ann. Appl. Biol. 2000, 137, 165–177. [Google Scholar] [CrossRef]
- Otteson, B.N.; Mergoum, M.; Ransom, J.K. Seeding rate and nitrogen management effects on spring wheat yield and yield components. Agron. J. 2007, 99, 1615–1621. [Google Scholar] [CrossRef]
- Xue, Q.; Weiss, A.; Baenziger, P.S.; Shelton, D.R. Seeding rate and genotype affect yield and end-use quality in winter wheat. J. Agron. Crop Sci. 2011, 2, 18–25. [Google Scholar]
- Stapper, M.; Fischer, R. Genotype, sowing date, and plant spacing influence on high-yielding irrigated wheat in southern New South Wales. I. Phasic development, canopy growth and spike production. Aust. J. Agric. Res. 1990, 41, 997–1019. [Google Scholar] [CrossRef]
- Brown, T.T. Variable Rate Nitrogen and Seeding to Improve Nitrogen Use Efficiency. Ph.D. Thesis, Washington State University, Pullman, WA, USA, December 2015. [Google Scholar]
- Fang, Y.; Xu, B.C.; Turner, N.C.; Li, F.M. Grain yield, dry matter accumulation and remobilization, and root respiration in winter wheat as affected by seeding rate and root pruning. Eur. J. Agron. 2010, 33, 257–266. [Google Scholar] [CrossRef]
- Blue, E.N.; Mason, S.C.; Sander, D.H. Influence of planting date, seeding rate, and phosphorus rate on wheat yield. Agron. J. 1990, 82, 762–768. [Google Scholar] [CrossRef]
- Holliday, R. Plant population and crop yield: Part I. Field Crop Abstr. 1960, 13, 159–167. [Google Scholar]
- Mehring, G.H.; Wiersma, J.J.; Stanley, J.D.; Ransom, J.K. Genetic and environmental predictors for determining optimal seeding rates of diverse wheat cultivars. Agronomy 2020, 10, 332. [Google Scholar] [CrossRef] [Green Version]
- Roberts, J.R.; Peeper, T.F.; Solie, J.B. Wheat (Triticum aestivum) row spacing, seeding rate, and cultivar affect interference from rye (Secale cereale). Weed Technol. 2001, 15, 19–25. [Google Scholar] [CrossRef]
- Beavers, R.L.; Hammermeister, A.M.; Frick, B.; Astatkie, T.; Martin, R.C. Spring wheat yield response to variable seeding rates in organic farming systems at different fertility regimes. Can. J. Plant Sci. 2008, 88, 43–52. [Google Scholar] [CrossRef]
- Ozturk, A.; Caglar, O.; Bulut, S. Growth and yield response of facultative wheat to winter sowing, freezing sowing and spring sowing at different seeding rates. J. Agron. Crop Sci. 2006, 192, 10–16. [Google Scholar] [CrossRef]
- Dai, X.; Zhou, X.; Jia, D.; Xiao, L.; Kong, H.; He, M. Managing the seeding rate to improve nitrogen use efficiency of winter wheat. Field Crops Res. 2013, 154, 100–109. [Google Scholar] [CrossRef]
- Nielsen, R.L.B.; Lee, J.; Hetting, J.; Camberato, J. Yield response of corn to plant population in Indiana. In Applied Crop Production Research Update; Purdue University Department of Agronomy: West Lafayette, IN, USA, 2017; pp. 1–7. Available online: www.kingcorn.org/news/timeless/CornPopulations.pdf (accessed on 21 March 2021).
- Lowenberg-DeBoer, J. Economics of Variable Rate Planting for Corn; Agricultural Economics Department, Purdue University: West Lafayette, IN, USA, 1998; pp. 1–13. [Google Scholar]
- Shah, W.A.; Khan, H.U.; Anwar, S.; Nawab, K. Yield and yield components of wheat as affected by different seed rates and nitrogen levels. Sarhad J. Agric. 2011, 27, 17–25. [Google Scholar] [CrossRef]
- Lowenberg-DeBoer, J. Economics of variable rate planting for corn. In Proceedings of the Fourth International Conference on Precision Agriculture, St. Paul, MN, USA, 19–22 July 1998; Robert, P.C., Rust, R.H., Larson, W.E., Eds.; American Society of Agronomy, Crop Science Society of America, Soil Science Society of America: Madison, WI, USA, 1999; pp. 1643–1651. [Google Scholar]
- Elmore, R.; Abendroth, L.J. Variable Rate Seeding Does Not Pay. Available online: https://www.farmprogress.com/variable-rate-seeding-doesn-t-pay (accessed on 29 July 2021).
- Runge, M.; Fulton, J.P.; Griffin, T.; Virk, S.; Brooke, A. Automatic Section Control Technology for Row Crop Planters; Alabama Cooperative Extension System, Auburn University: Auburn, AL, USA, 2014; pp. 1–8. Available online: https://ssl.acesag.auburn.edu/pubs/docs/A/ANR-2217/ANR-2217-low-archive.pdf (accessed on 30 July 2021).


| Soil Properties | Application of PA Technologies | Reference |
|---|---|---|
| Organic matter, pH | Variable-rate seeding application on farms | [15] |
| pH | An on-the-go sensor used for mapping | [16] |
| SOC, soil texture | Exploring the driving forces and digital mapping using remote sensing | [17] |
| Soil texture | Electromagnetic induction for regional data coordination | [18] |
| Radar and optical data from Sentinel-1 and Sentinel-2 | [19] | |
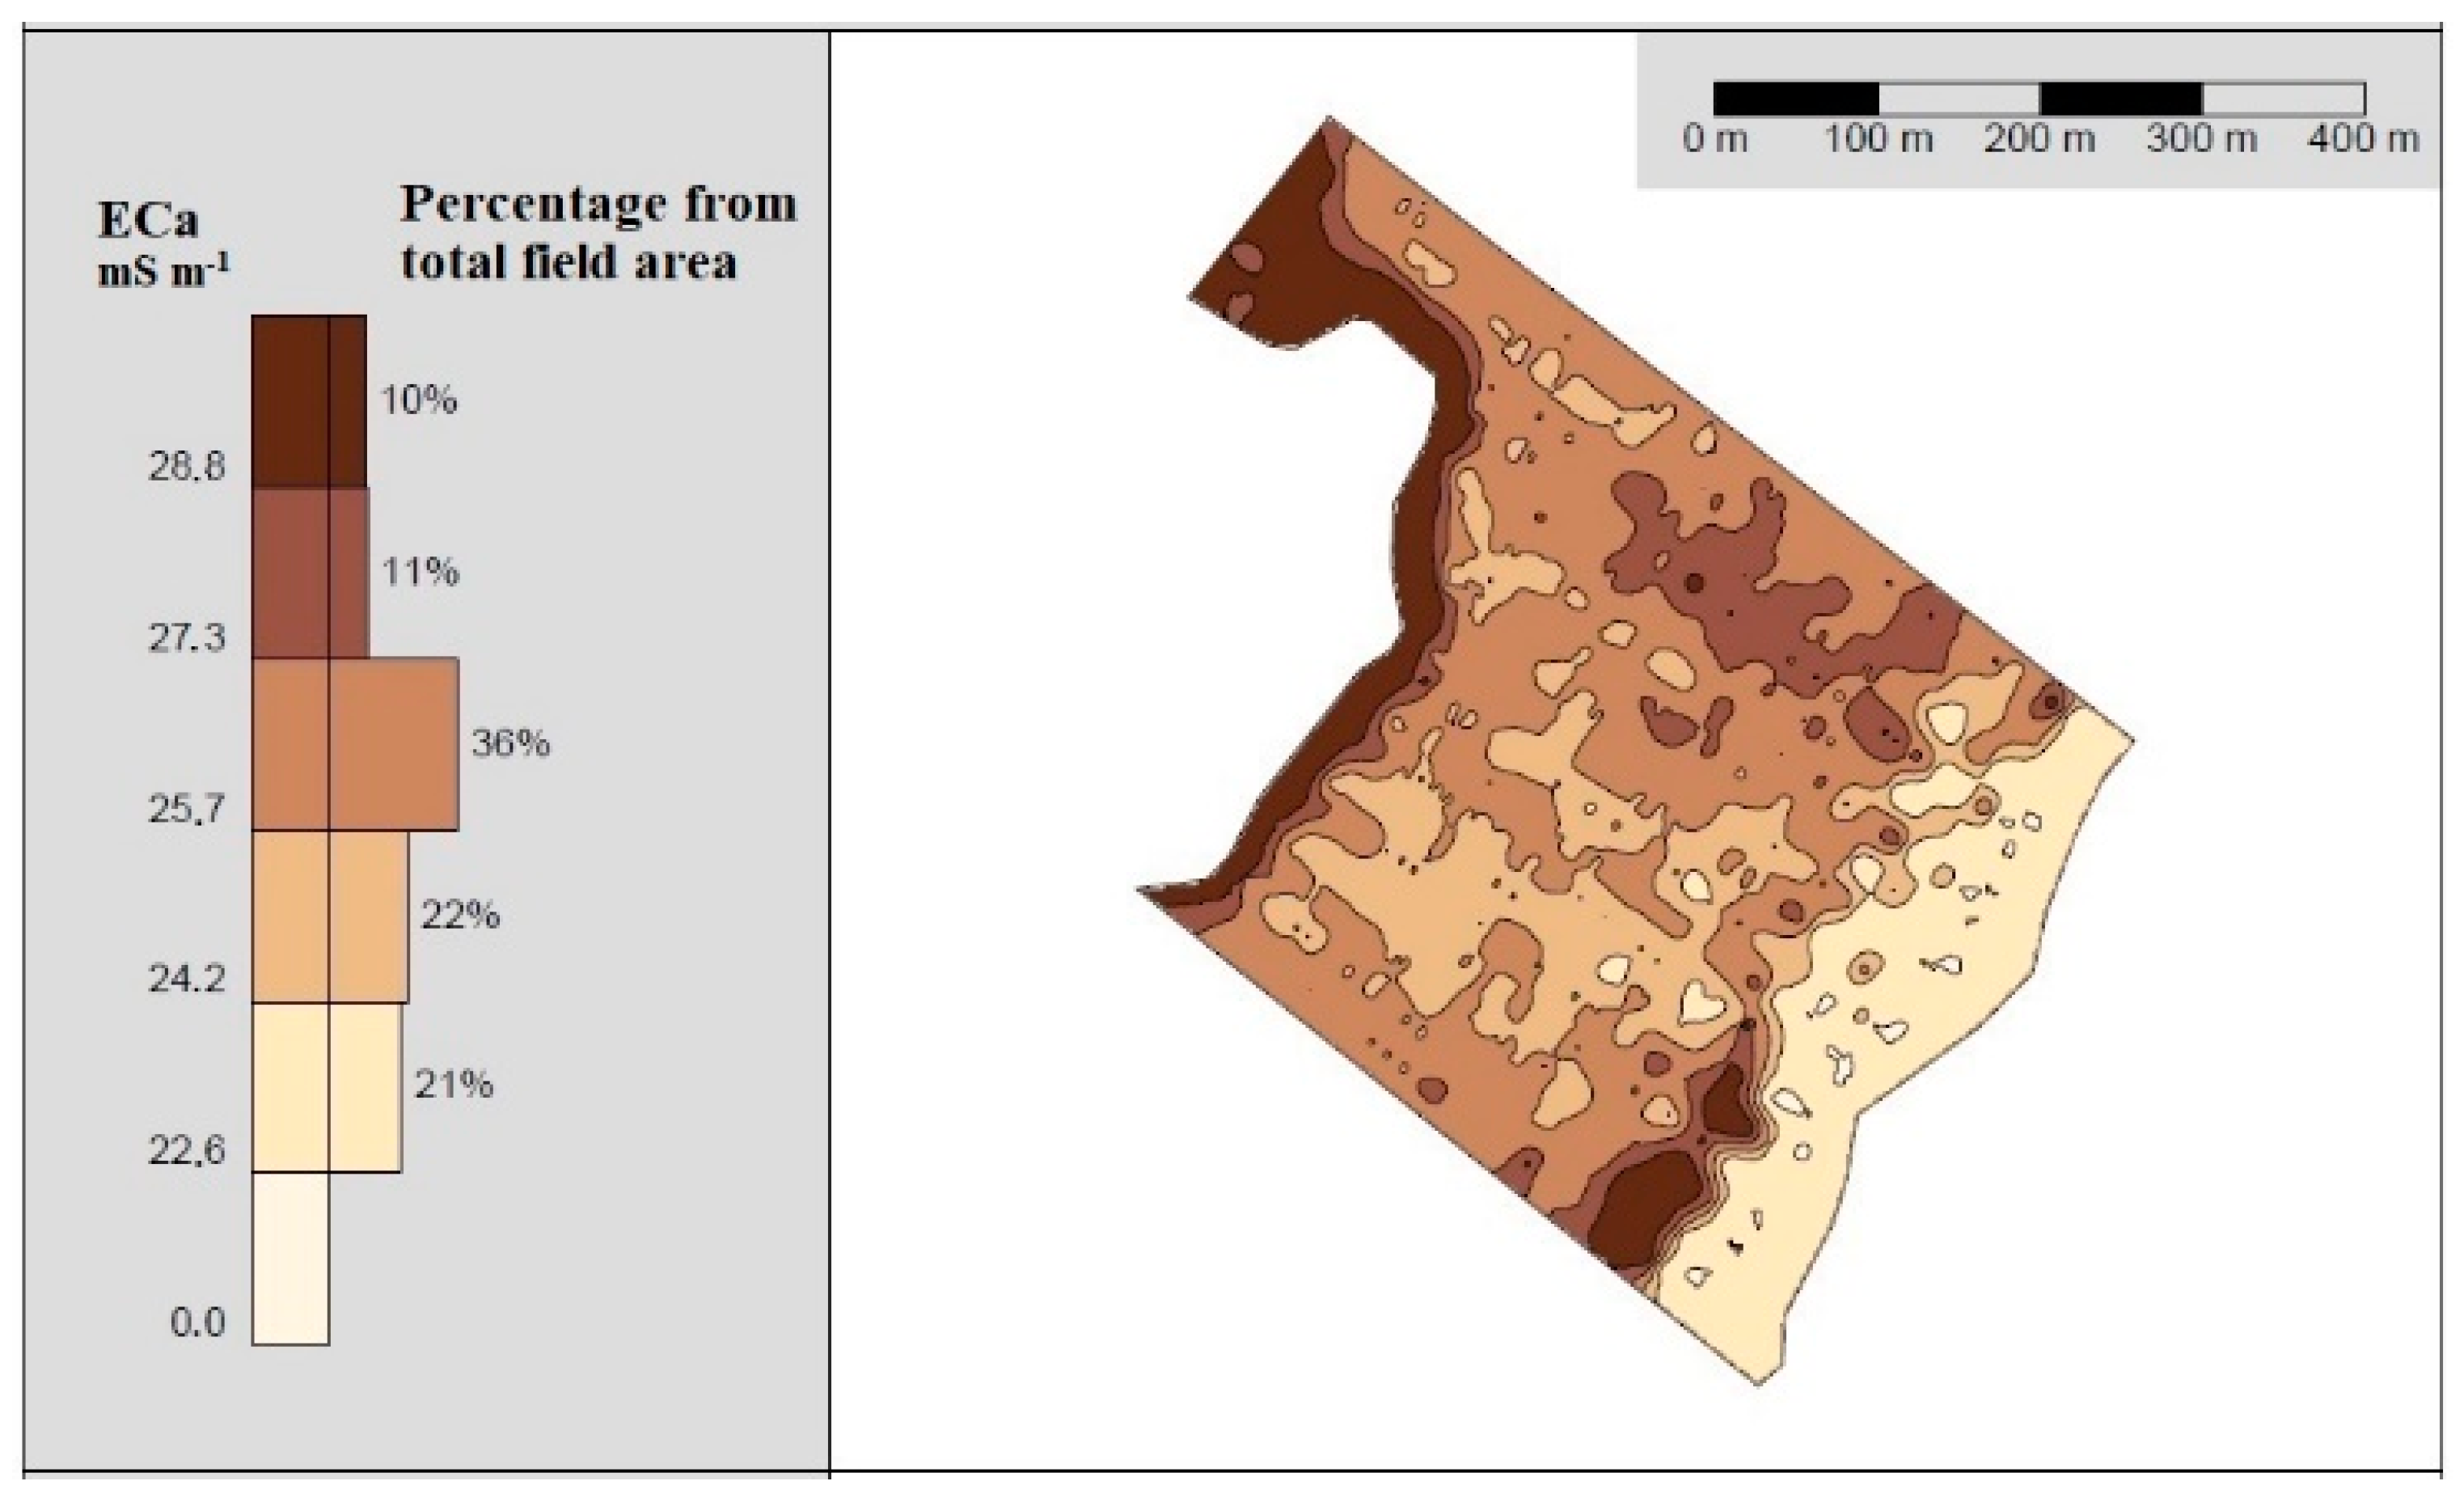
| Apparent electrical conductivity (ECa) | Applications of soil electrical conductivity mapping | [20] |
| Scientific equipment and measurements in agriculture | [21] | |
| Effect of variable rate seeding on seedbed and germination parameters | [22] | |
| Bulk density | Novel electromechanical system application | [23] |
Publisher’s Note: MDPI stays neutral with regard to jurisdictional claims in published maps and institutional affiliations. |
© 2022 by the authors. Licensee MDPI, Basel, Switzerland. This article is an open access article distributed under the terms and conditions of the Creative Commons Attribution (CC BY) license (https://creativecommons.org/licenses/by/4.0/).
Share and Cite
Šarauskis, E.; Kazlauskas, M.; Naujokienė, V.; Bručienė, I.; Steponavičius, D.; Romaneckas, K.; Jasinskas, A. Variable Rate Seeding in Precision Agriculture: Recent Advances and Future Perspectives. Agriculture 2022, 12, 305. https://doi.org/10.3390/agriculture12020305
Šarauskis E, Kazlauskas M, Naujokienė V, Bručienė I, Steponavičius D, Romaneckas K, Jasinskas A. Variable Rate Seeding in Precision Agriculture: Recent Advances and Future Perspectives. Agriculture. 2022; 12(2):305. https://doi.org/10.3390/agriculture12020305
Chicago/Turabian StyleŠarauskis, Egidijus, Marius Kazlauskas, Vilma Naujokienė, Indrė Bručienė, Dainius Steponavičius, Kęstutis Romaneckas, and Algirdas Jasinskas. 2022. "Variable Rate Seeding in Precision Agriculture: Recent Advances and Future Perspectives" Agriculture 12, no. 2: 305. https://doi.org/10.3390/agriculture12020305
APA StyleŠarauskis, E., Kazlauskas, M., Naujokienė, V., Bručienė, I., Steponavičius, D., Romaneckas, K., & Jasinskas, A. (2022). Variable Rate Seeding in Precision Agriculture: Recent Advances and Future Perspectives. Agriculture, 12(2), 305. https://doi.org/10.3390/agriculture12020305