Article

Grazing Management Targets for Tangolagrass Pastures

by
Nemora Guliane Mocelin
1,
Daniel Schmitt
1,*,
Guilherme Doneda Zanini
2,
Pedro Antonio Garzón Camacho
1 and
André Fischer Sbrissia
1
1
Animal Production and Food Science Department, Santa Catarina State University, Avenida Luiz de Camões, 2090, Lages 88520-000, Brazil
2
Agronomy Department, “Barriga Verde” University, Rua Pe João Leonir Dall’Alba, 601, Orleans 88870-000, Brazil
*
Author to whom correspondence should be addressed.
Agriculture 2022, 12(2), 279; https://doi.org/10.3390/agriculture12020279
Submission received: 11 January 2022 / Revised: 7 February 2022 / Accepted: 10 February 2022 / Published: 16 February 2022

Abstract

:
Tangolagrass (Brachiaria arrecta × Brachiaria mutica) is a stoloniferous warm-season grass considered as an alternative to forming permanent grasslands in waterlogged tropical regions. However, information about grazing management targets for such species is still scarce. This two-year study aimed to identify pre-grazing canopy heights that do not compromise both leaf lamina production and nutritive value of tangolagrass pastures, and to test whether lower canopy height could decrease stolon elongation process. To this end, three pre-grazing canopy heights (20, 30, or 40 cm, all lowered in 40% of their initial heights) were assigned to nine 390-m2 plots grazed by cattle. Herbage, leaf, and stem accumulation rates were not different among treatments (57, 23, and 27 kg DM ha−1 d−1, respectively; p > 0.05). Also, neutral detergent fiber (NDF) and acid detergent fiber (ADF) were similar among treatments (56 and 24% DM, respectively; p > 0.05), but crude protein (CP) was greater (p = 0.0180) in pastures managed with 30 cm (24.7% DM × 22.5% DM). Thus, pre-grazing canopy heights between 20–40 cm combined with low levels of defoliation (up to 40% of the initial height) provide the same primary productivity in tangolagrass pastures. However, stolon elongation could not be reduced within such canopy height targets.

1. Introduction

Tangolagrass is a perennial warm-season grass originated from a natural hybridization between tannergrass (Brachiaria arrecta [Dur & Schinz] Stent) and angolagrass (Brachiaria mutica [Forssk.] Stapf.), that presents stoloniferous growth habit, spreads vigorously, forms a strong root system from nodes, and is well-adapted to poorly drained soils. Like other brachiariagrasses, it also has a greater herbage production capacity, tolerates marginal soil fertility conditions, and is resistant to trampling. Accordingly, tangolagrass is considered an alternative to forming permanent tropical grasslands in marginal areas, especially those intermittently affected by flooding or waterlogging [1,2]. Despite its advantages, data about both primary productivity and management targets for this species are still scarce.
Overall, grasslands can be managed within a range of canopy-based targets (herbage mass, leaf area index [LAI], or grazing height) without compromising net herbage production [3,4,5,6,7]. This amplitude is due to “homeostatic” mechanisms that operate at the community level, whereby compensatory changes in tiller population density (TPD) and tissue flow buffer net herbage production [3,5,6]. Moreover, delaying grazing when the canopy reaches the critical LAI [8] in pastures under intermittent stocking, or by using taller grazing heights in pastures under continuous stocking, may increase leaf senescence and stem elongation rates [6,9,10,11]; thus, ultimately, decreasing net herbage production, nutritive value, and animal performance [12].
Despite the opportunities in terms of management targets, tangolagrass may present different accumulation patterns over grazing heights. This is because lower levels of defoliation or greater levels of light competition (both usually observed in taller canopies) can stimulate stolon elongation, whereas severe defoliations or greater light availability (both usually observed in lower canopies) can reduce stolon elongation [13,14]. Despite being important from an ecological perspective and contributing to herbage accumulation, stolon elongation can be undesirable for animal production since it involves the accumulation of stems, which reduces leaf:stem ratio and forage nutritive value [15,16], impairs bite formation [17,18], and compromises animal performance [19,20]. Thus, it seems more appropriate to conceive grazing management strategies that reduce stolon elongation but at the same time do not compromise leaf lamina production when using tangolagrass pastures.
Against this background, we performed a study to identify pre-grazing canopy heights that do not compromise both leaf lamina production and the nutritive value of tangolagrass pastures subjected to intermittent stocking. Also, we tested the hypothesis that grazing management strategies can modulate stolon elongation/stem accumulation in tangolagrass swards.

2. Materials and Methods

The experiment was conducted in Orleans, SC, Brazil (29°35′ S and 49°25′ W), during two experimental years (from January to June 2018 and 2019) on a well-established tangolagrass pasture. According to the Köppen climate classification, the region has a Cfa-type climate (humid subtropical under oceanic influences) with a hot summer and no dry season [21]. The average temperature and monthly precipitation during the experimental period are presented in Table 1. The soil at the site is a clay loam red-yellow Ultisols [22], and its chemical characteristics at the 0- to 20-cm profile were assessed before starting the experiment (Table 2). Based on the Fertilizing and Liming Manual for the States of Rio Grande do Sul and Santa Catarina [23], 1.6 ton ha−1 of dolomitic limestone (on 29 December 2017), 50 kg N ha−1 (on 16 January 2018; 28 February 2018; 22 January 2019; and 20 March 2019), 190 kg P ha−1 and 115 kg K ha−1 (both on 15 December 2018) were applied. Before starting the experiment (on 11 December 2017), the whole area was mowed to a 5-cm stubble height.
The treatments corresponded to three pre-grazing canopy heights (20, 30, and 40 cm) grazed in 40% of their initial heights (stubbles of 12, 18, and 24 cm, respectively). We chose the pre-grazing targets based on: (i) Andrade et al. [1], which recommended canopy heights around 40–45 cm for tangolagrass under intermittent stocking; and (ii) to test whether stolon elongation/stem accumulation could be reduced at lower heights. The intensity of defoliation was intended to not compromise herbage production [24] and intake by cattle [25]. We allocated the treatments across nine 390-m2 plots following a complete randomized block design. Canopy heights were monitored using a ruler at 40 random points per plot twice a week during the regrowth period and every day during grazing. The animals used in this experiment were Angus steers and heifers (Bos taurus taurus), and the stocking densities were adjusted to achieve the intended post-grazing height target into 24 h. The rest periods corresponded to the time necessary for the canopies to reach the intended plot’s pre-grazing height.
Pre- and post-grazing herbage samples were collected in four random points per plot using 0.5-m2 (1.0 m × 0.5 m) metallic frames, and cuttings were performed at the ground level. After being collected, all samples were fresh-weighted and processed as follows: (i) approximately ¼ of each sample was manually separated into plant parts (leaves, stems + pseudostems [named hereafter as stems], and dead material), stored in paper bags and dried in a forced-draft oven at 65 °C to constant weight; (ii) the remaining materials (approximately ¾ of each sample) were stored in paper bags and also dried in a forced-draft oven at 65 °C to constant weight. It is worth mentioning that: (i) we chose not to separate stems from pseudostems (i.e., leaf sheath) because this is difficult to perform with the naked eye and both structures promote the same effect on the ingestive behavior of grazing animals [17]; (ii) this approach describes the whole canopy structure (and not the grazing layer offered to the animals). After drying, all materials were weighted separately and used to calculate plant-part composition (leaves, stems, dead material; %) and herbage mass (plant-part components + remaining material; kg DM ha−1). Herbage accumulation was calculated as: HAc Cycle n = pre-grazing herbage mass Cycle n − post-grazing herbage mass Cycle n−1; (kg DM ha−1); herbage accumulation rate = HAcR Cycle n = HAc Cycle n/interval on days between Cycle n and Cycle n−1; kg DM ha−1 d−1); leaf accumulation rate = LAcR Cycle n = HAcR Cycle n × % leaves; kg DM ha−1 d−1 and stem accumulation rates = SAcR Cycle n = HAcR Cycle n × % stems; kg DM ha−1 d−1). It should be mentioned that herbage accumulation and herbage accumulation rates corresponding to the first grazing cycle were calculated considering the date of the spring mowing (on 11 December 2017) and the whole herbage accumulated above the 5-cm stubble.
Tiller population density (TPD) was estimated at pre-grazing by counting separately all aerial and basal tillers contained in four points per plot using a 0.5-m2 (1.0 m × 0.5 m) metallic frame. The average leaf area per tiller (LA) was assessed as follows: (i) at the beginning of the experimental period, 100 tillers per plot had their leaf lamina detached, measured according to their length (from the ligule to the tip of the leaf lamina; LL) and width (at the middle point of their length; LW), and individually scanned in a leaf area meter (LI-COR, Model LI-3100A); (ii) then, the calculated leaf area (LAc; product between LL and LW) was regressed against the scanned leaf area (LA; Figure 1), and the formula was used to calculate LAs throughout the experiment; (iii) thus, 50 leaf lamina per plot were collected at pre- and post-grazing to calculate LA. Finally, the leaf area index (LAI) was calculated by the product between TPD and LA.
Herbage chemical composition was assessed from hand-plucked samples (Wallis de Vries, 1995). For this purpose, approximately 500 g of fresh herbage were collected every pre-grazing to simulate animal harvesting (based on visual assessments) and dried in a forced-draft oven at 65 °C to constant weight. Later, they were ground in a Willey mill to pass through a 1-mm screen and stored. The neutral detergent fiber (NDF) and acid detergent fiber (ADF) concentrations were determined according to the A200 Filter Bag Technique, Method 6 and 5, respectively [26,27]. Nitrogen concentration was measured using a micro-Kjeldahl technique, and the CP concentration calculated as N × 6.25.
Statistical analyses were performed using the MIXED procedure of the SAS statistical package with a model including the fixed effect of grazing height. The years were considered as a random effect. Grazing cycles within years were considered as repeated measurements [28]. The choice for the covariance matrix was made using the Akaike information criterion, and the mean values were compared using PDIFF by the Tukey–Kramer test. The significance for all analyses was set at 5% (p < 0.05).

3. Results

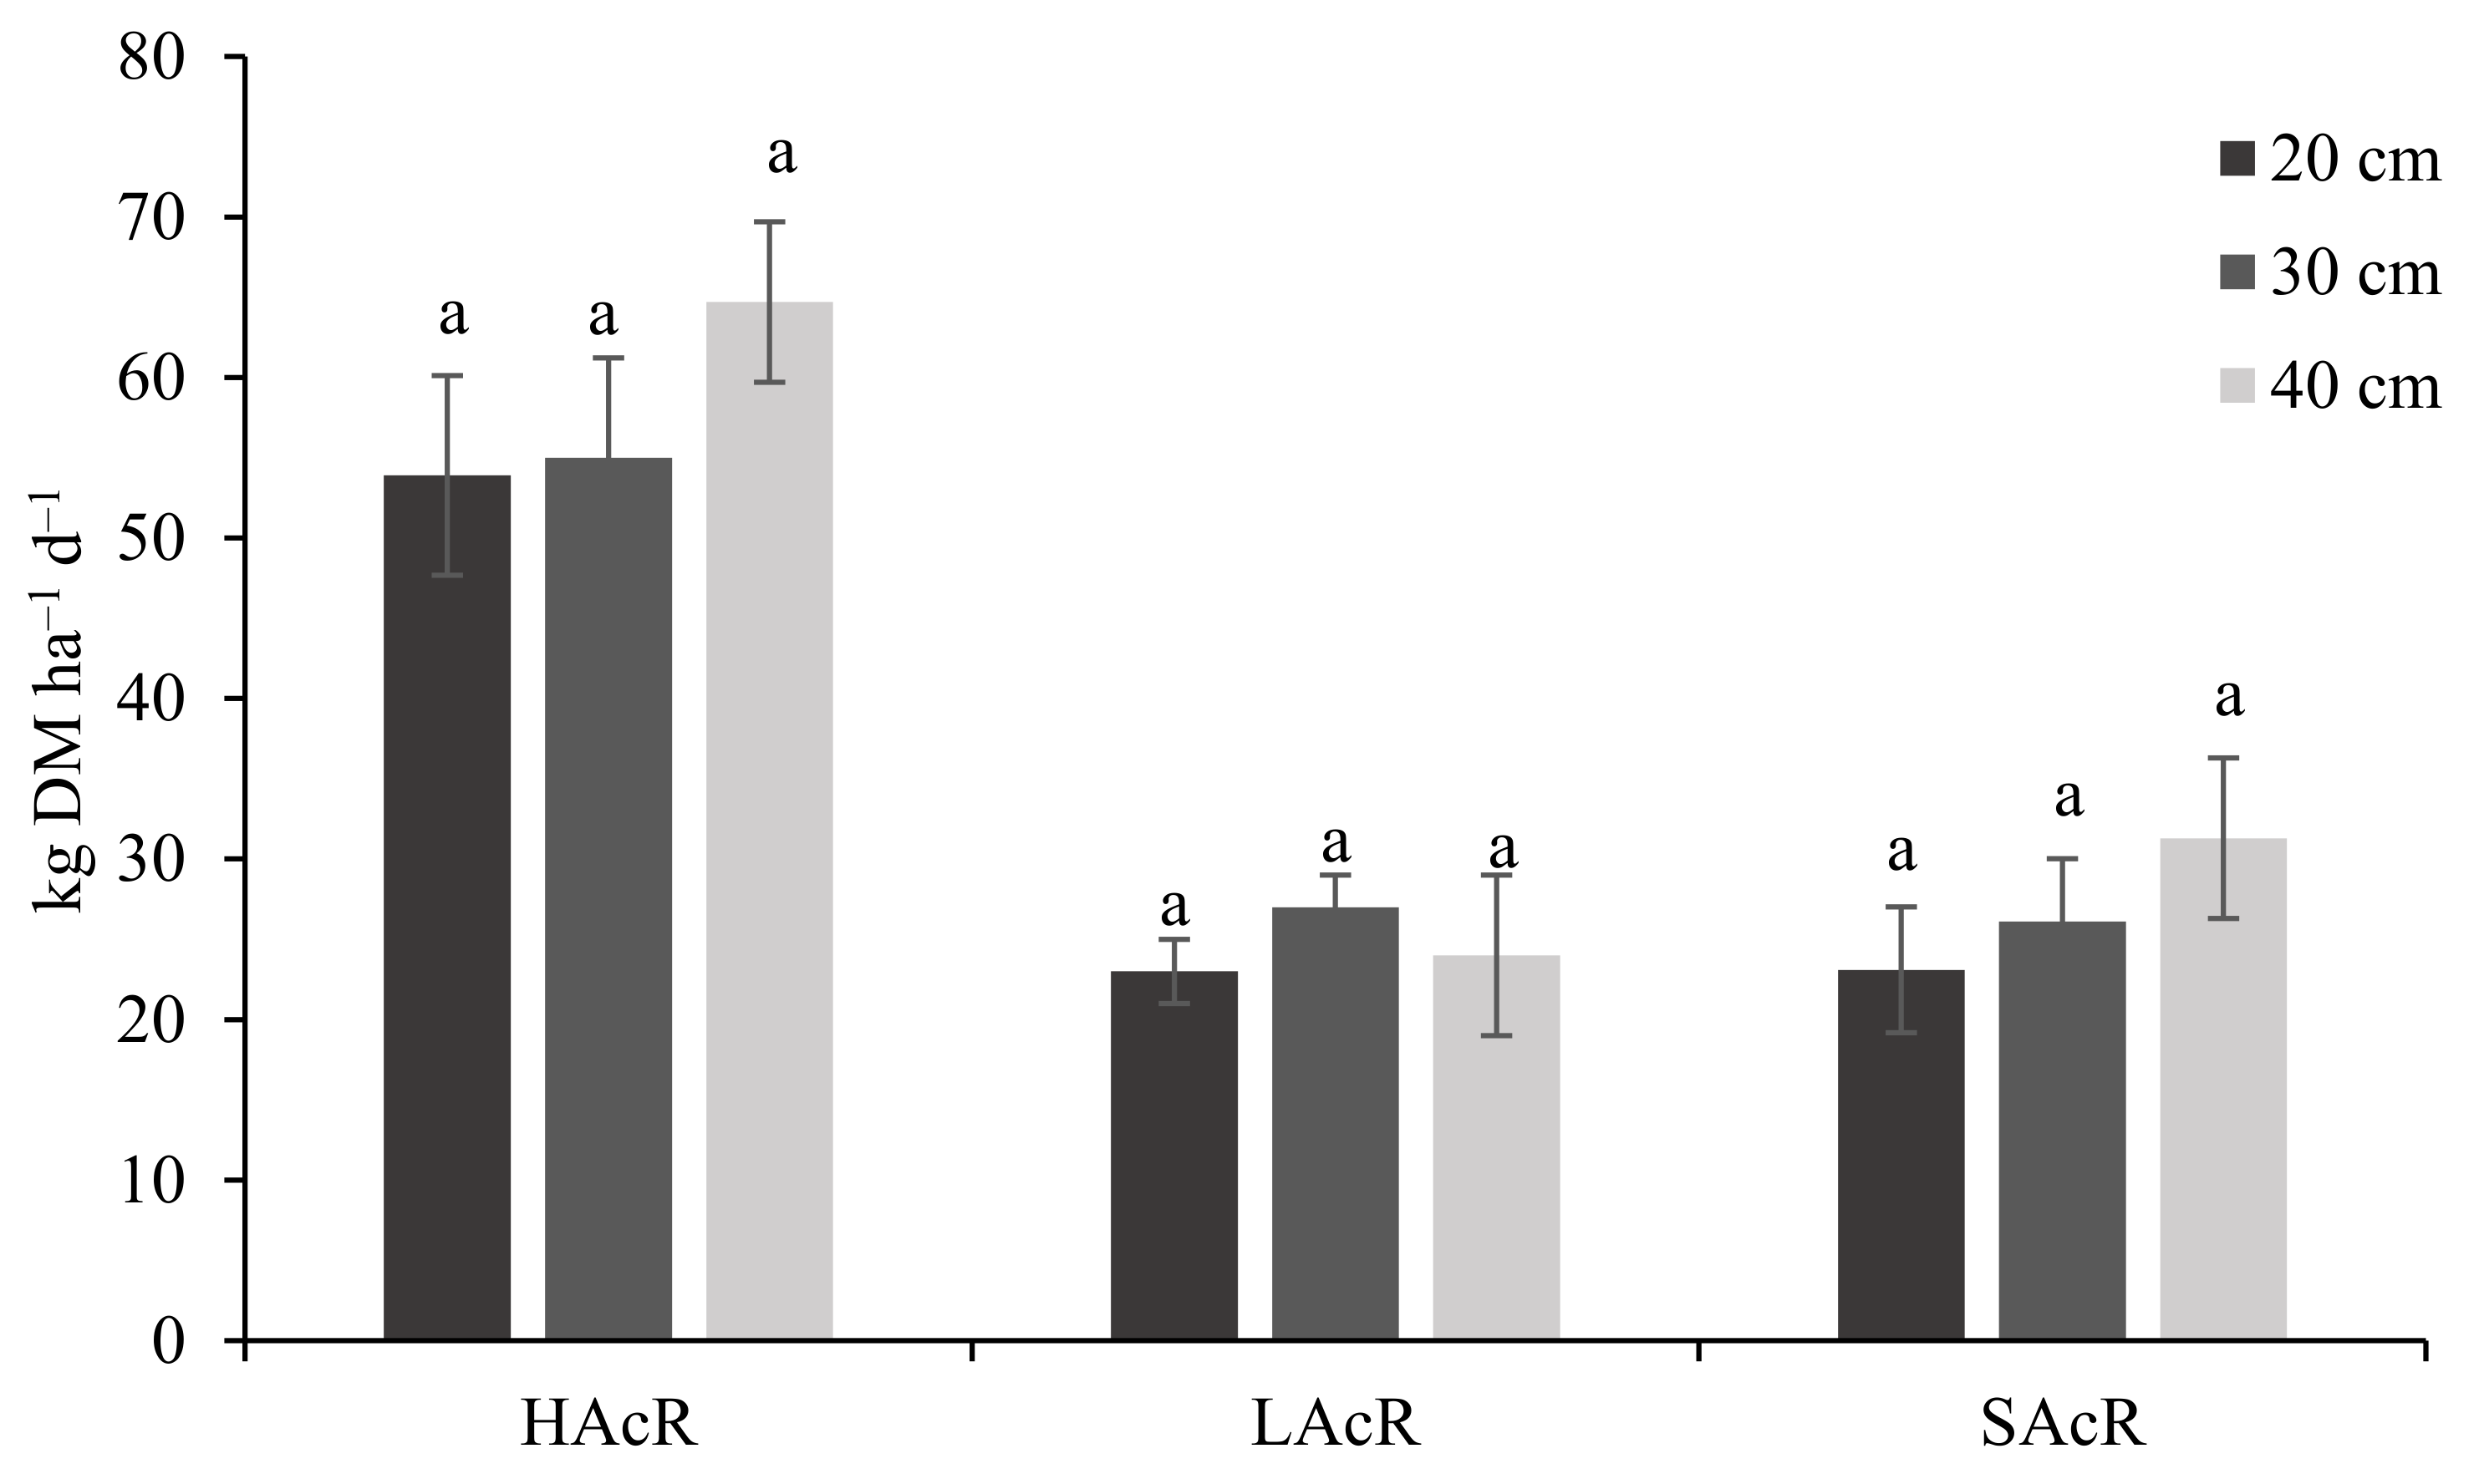
There were no differences in herbage (p = 0.7452), leaf (p = 0.7943), and stem (p = 0.6630) accumulation rate among treatments, with averages of 57, 23, and 27 kg DM ha−1 d−1 (Figure 2), respectively. Also, tiller population density (p = 0.2436) and pre- and post-grazing leaf area index (p = 0.1646 and p = 0.4528, respectively) did not vary among treatments (Table 3).
Pre-grazing herbage mass was affected by treatments (p = 0.0328; Table 4). In this way, plots managed with 40 cm presented greater herbage mass (4470 kg DM ha−1) than those managed with 20 or 30 cm (averaging 3560 kg DM ha−1). Plant-part composition at pre-grazing, however, was the same among treatments, and the mean values for leaves (p = 0.1866), stems (p = 0.7668), and senescent tissues (p = 0.8495) proportions were 23, 47, and 27, respectively (Table 4). Post-grazing herbage mass also differed among treatments (p = 0.0189; Table 4). In this way, plots managed with 30 and 40 cm presented greater herbage mass (averaging 2295 kg DM ha−1) than those managed with 20 (averaging 1820 kg DM ha−1).
Plant-part composition at post-grazing was the same among treatments, and the mean values for leaves (p = 0.3022), stems (p = 0.7668), and senescent tissues (p = 0.7639) proportions were 8.3, 48.7, and 39.0, respectively (Table 4). There were no differences for neutral (p = 0.1793) and acid detergent fiber (p = 0.2298), with averages of 56.7 and 25.0 % DM (Table 5), respectively. Crude protein, however, varied among treatments (p = 0.0180). In this way, plots managed with 30 cm presented crude protein contents higher than those managed with 20 or 40 cm (Table 5).

4. Discussion

Herbage, leaf, and stem accumulation rates remained constant within a relatively wide range of pre-grazing canopy height targets (Figure 2). We attribute such a pattern of response to both: (i) an equivalence in leaf growth/senescence rates; and (ii) an important (great) stem accumulation process. According to Sbrissia et al. [5], higher leaf elongation rates (usually observed in taller canopies or with greater LAI) can be accompanied by higher senescence rates, which could balance each other and lead to similar levels of leaf accumulation rate. Thus, because in our experiment pre-grazing LAI increased only slightly as grazing height increased (Table 3), the balance between leaf growth and senescence may have been similar among treatments. Regarding stem accumulation rate, it was not reduced by grazing height as expected; instead, it was rather high and constant among treatments. Thus, stem/stolon elongation in tangolagrass pastures seems to have a strong genetic programming that is only slightly modulated by managements based on canopy heights. Data with elephantgrass had already shown such genetic programming [29], but it is normally thought that grazing management can delay such processes [30,31]. Finally, because pastures presented similar leaf and stem accumulation rates, the total herbage production rate was also similar among treatments (Figure 2).
Generally, canopies present an inverse relationship between TPD and tiller size, a well-studied ecological process that has already been frequently reported in the scientific literature [32,33,34,35]. Ultimately, such a mechanism is comprehended as a response of plant communities to adjust LAI over a range of canopy targets (e.g., height, mass, or LAI). However, this classical mechanism was not observed in our study since, despite the apparent differences in tiller size (data not shown, but it can be easily assessed dividing herbage mass [Table 4] by TPD [Table 3]), the TPD remained constant among treatments (Table 3). In this context, we hypothesize that the similar LAI (note that it just increased slightly in our study; Table 3) across a range of canopy heights could be related to a specific and strong genetic programming (exactly like stem/stolon mentioned above) for leaf number and size. Nevertheless, because total herbage and leaf production were not affected over a range of pre-grazing canopy heights (20–40 cm; Figure 2), tangolagrass presents great flexibility in terms of canopy height targets, as already reported for other warm-season grasses such as kikuyugrass (Pennisetum clandestinum Hochst. Ex Chiov) [5] and marandu palisadegrass (Brachiaria brizantha [A. Rich.] Stapf.) [6].
Plant-part composition at pre- and post-grazing was constant among treatments; moreover, pastures presented a significant proportion of stems (averaging 47%; Table 4). Such a pattern of response, once again, demonstrates that stems compose a significant amount of the vegetative growth in tangolagrass swards. Thus, it reinforces the observed lower pre- and post-grazing LAI (Table 3). Therefore, the use of tangolagrass in intensive grazing management systems would require greater herbage allowances and lower intensities of defoliation. It would be necessary to allow animals the possibility of selecting leaves (improving diet quality; [36,37], and also leaving leafier stubbles (increasing regrowth potential; [4,24]).
In general, the chemical composition of hand-plucked herbage samples was little affected by the canopy heights considered in our study (Table 5). Schmitt et al. [25] reported that herbage morphological and chemical composition in the canopy upper half does not change within a range of pre-grazing heights, provided moderate levels of defoliations (up to 50%) are used. Finally, the unexpected higher CP content can be a consequence of: (i) an excessive accumulation of non-protein N, which could have overestimate CP or (ii) since tangolagrass presents short leaves it would require less thick-walled structures (e.g., midrib; [2].
Finally, it worth mentioning that the experiment was thought to have a fourth treatment (canopy height of 10 cm). However, after a few months, pastures subjected to a grazing height of 10 cm lost vigor and became completely infested by weeds (only ± 20% of the herbage mass was composed of tangolagrass in this treatment). Such a pattern of response demonstrates that, despite the wide range of pre-grazing canopy targets that can be used for this plant (20–40 cm), it should not be managed at grazing heights lower than 20 cm, or by using severe intensities of defoliation.

5. Conclusions

Tangolagrass pastures managed under pre-grazing canopy heights between 20–40 cm combined with low levels of defoliation (at least up to 40% of the initial height) present the same primary productivity. However, stem/stolon elongation in tangolagrass is a processe that cannot be reduced by management techniques based on canopy height targets.

Author Contributions

Conceptualization: N.G.M., G.D.Z. and A.F.S.; methodology: N.G.M., G.D.Z. and A.F.S.; formal analysis: N.G.M., D.S. and A.F.S.; investigation: N.G.M. and G.D.Z.; resources: G.D.Z. and A.F.S.; data curation, N.G.M. and A.F.S.; writing—original draft preparation, N.G.M., D.S. and A.F.S.; writing—review and editing, D.S., P.A.G.C. and A.F.S.; supervision, G.D.Z. and A.F.S. All authors have read and agreed to the published version of the manuscript.

Funding

This research was funded by FAPESC (2021 TR 543 and 2021 TR 813) and the APC was funded by CAPES 2020 DS 1478.

Data Availability Statement

The data presented in this study are openly available in ResearchGate at doi: 10.13140/RG.2.2.35103.64167.

Conflicts of Interest

The authors declare no conflict of interest.

References

  1. Andrade, C.M.S.; Assis, G.M.L.; Fazolin, M.; Gonçalves, R.C.; Sales, M.F.L.; Valentin, J.F.; Estrela, J.L.V. (Eds.) Capim-Tangola: Gramínea Forrageira Recomendada Para Solos de Baixa Permeabilidade do Acre; Embrapa Acre: Rio Branco, Brazil, 2009. [Google Scholar]
  2. Queiroz, D.S.; Casagrande, D.R.; Moura, G.S.; Silva, E.A.; Viana, M.C.M.; Ruas, J.R.M. Espécies forrageiras para produção de leite em solos de várzea. R. Bras. Zootec. 2012, 41, 271–280. [Google Scholar] [CrossRef] [Green Version]
  3. Bircham, J.S.; Hodgson, J. The influence of sward condition on rates of herbage growth and senescence in mixed swards under continuous stocking management. Grass Forage Sci. 1983, 38, 323–331. [Google Scholar] [CrossRef]
  4. Parsons, A.J.; Johnson, I.R.; Harvey, A. Use of a model to optimize the interaction between frequency and severity of intermittent defoliation and to provide a fundamental comparison of the continuous and intermittent defoliation of grass. Grass Forage Sci. 1988, 43, 49–59. [Google Scholar] [CrossRef]
  5. Sbrissia, A.F.; Duchini, P.G.; Zanini, G.D.; Santos, G.T.; Padilha, D.A.; Schmitt, D. Defoliation strategies in pastures submitted to intermittent stocking method: Underlying mechanisms buffering forage accumulation over a range of grazing heights. Crop Sci. 2018, 58, 945–954. [Google Scholar] [CrossRef]
  6. Sbrissia, A.F.; Schmitt, D.; Duchini, P.G.; Da Silva, S.C. Unravelling the relationship between a seasonal environment and the dynamics of forage growth in grazed swards. J. Agron. Crop Sci. 2020, 206, 630–639. [Google Scholar] [CrossRef]
  7. Zanella, P.G.; Junior, L.H.P.D.G.; Pinto, C.E.; Baldissera, T.C.; Werner, S.S.; Garagorry, F.C.; Jaurena, M.; Lattanzi, F.A.; Sbrissia, A.F. Grazing intensity drives plant diversity but does not affect forage production in a natural grassland dominated by the tussock-forming grass Andropogon lateralis Nees. Sci. Rep. 2021, 11, 16744. [Google Scholar] [CrossRef]
  8. Brougham, R.W. Interception of light by the foliage of pure and mixed stands of pasture plants. Aust. J. Agric. Res. 1958, 9, 39–52. [Google Scholar] [CrossRef]
  9. Carnevalli, R.A.; Da Silva, S.C.; Bueno, A.A.O.; Uebele, M.C.; Bueno, F.O.; Hodgson, J.; Silva, G.; Morais, J.P.G. Herbage production and grazing losses in Panicum maximum cv. Mombaça under four grazing managements. Trop. Grassl. 2006, 40, 165–176. [Google Scholar]
  10. Zanini, G.D.; Santos, G.T.; Sbrissia, A.F. Frequencies and intensities of defoliation in Aruana guineagrass swards: Morphogenetic and structural characteristics. R. Bras. Zootec. 2012, 41, 1848–1857. [Google Scholar] [CrossRef] [Green Version]
  11. Migliorini, F.; Soares, A.B.; Schmitt, D.; Pontes, L.S.; Assmann, T. Morphogenetic and structural characteristics of Alexandergrass pastures under continuous stocking. Ciênc. Anim. Bras. 2018, 19, e50830. [Google Scholar] [CrossRef]
  12. Da Silva, S.C.; Sbrissia, A.F.; Pereira, L.E.T. Ecophysiology of C4 forage grasses—Understanding plant growth for optimising their use and management. Agriculture 2015, 5, 598–625. [Google Scholar] [CrossRef] [Green Version]
  13. Dong, M.; Pierdominici, M.G. Morphology and growth of stolons and rhizomes in three clonal grasses, as affected by different light supply. Vegetatio 1995, 116, 25–32. [Google Scholar] [CrossRef]
  14. Wilen, C.A.; Holt, J.S. Spatial Growth of kikuyugrass (Pennisetum clandestinum). Weed Sci. 1996, 44, 323–330. [Google Scholar] [CrossRef]
  15. Silva, V.J.; Pedreira, C.G.; Sollenberger, L.E.; Carvalho, M.S.; Tonato, F.; Basto, D.C. Seasonal herbage accumulation and nutritive value of irrigated ‘Tifton 85′, Jiggs, and Vaquero bermudagrasses in response to harvest frequency. Crop Sci. 2015, 55, 2886–2894. [Google Scholar] [CrossRef]
  16. Wallau, M.O.; Sollenberger, L.E.; Vendramini, J.M.; Gomide, C.A.; Mullenix, M.K.; Quesenberry, K.H. Performance of limpograss breeding lines under various grazing management strategies. Crop Sci. 2016, 56, 3345–3353. [Google Scholar] [CrossRef]
  17. Benvenutti, M.A.; Gordon, I.J.; Poppi, D.P. The effect of the density and physical properties of grass stems on the foraging behaviour and instantaneous intake rate by cattle grazing an artificial reproductive tropical sward. Grass Forage Sci. 2006, 61, 272–281. [Google Scholar] [CrossRef]
  18. Mezzalira, J.C.; Carvalho, P.C.F.; Fonseca, L.; Bremm, C.; Cangiano, C.; Gonda, H.L.; Laca, E.A. Behavioural mechanisms of intake rate by heifers grazing swards of contrasting structures. Appl. Anim. Behav. Sci. 2014, 153, 1–9. [Google Scholar] [CrossRef]
  19. Euclides, V.P.B.; Carpejani, G.C.; Montagner, D.B.; Nascimento Júnior, D.; Barbosa, R.A.; Difante, G.S. Maintaining post-grazing sward height of Panicum maximum (cv. Mombaça) at 50 cm led to higher animal performance compared with post-grazing height of 30 cm. Grass Forage Sci. 2018, 73, 174–182. [Google Scholar] [CrossRef]
  20. Congio, G.F.S.; Batalha, C.D.A.; Chiavegato, M.B.; Berndt, A.; Oliveira, P.P.A.; Frighetto, R.T.S.; Maxwell, T.M.R.; Gregorini, P.; Da Silva, S.C. Strategic grazing management towards sustainable intensification at tropical pasture-based dairy systems. Sci. Total Environ. 2018, 636, 872–880. [Google Scholar] [CrossRef]
  21. Alvares, C.A.; Stape, J.L.; Sentelhas, P.C.; Gonçalves, J.L.M.; Sparovek, G. Köppen’s climate classification map for Brazil. Meteorol. Z. 2013, 22, 711–728. [Google Scholar] [CrossRef]
  22. Empresa Brasileira de Pesquisa Agropecuária (EMBRAPA). Sistema Brasileiro de Classificação de Solos; EMBRAPA Solos: Rio de Janeiro, Brazil, 2006. [Google Scholar]
  23. Comissão de Química e Fertilidade do SoloRS/SC—CQFS. Manual de Adubação e Calagem para os Estados do Rio Grande do Sul e Santa Catarina; Sociedade Brasileira de Fertilidade do Solo: Porto Alegre, Brazil, 2004. [Google Scholar]
  24. Martins, C.D.M.; Schmitt, D.; Duchini, P.G.; Miqueloto, T.; Sbrissia, A.F. Defoliation intensity and leaf area index recovery in defoliated swards: Implications for forage accumulation. Sci. Agric. 2021, 78, e20190095. [Google Scholar] [CrossRef]
  25. Schmitt, D.; Padilha, D.A.; Dias, K.M.; Gabriela, T.S.; Rodolfo, G.R.; Zanini, G.D.; Sbrissia, A.F. Chemical composition of two warm-season perennial grasses subjected to proportions of defoliation. Grassl. Sci. 2019, 65, 171–178. [Google Scholar] [CrossRef]
  26. Ankon Technology. Neutral Detergent Fiber in Feeds—Filter Bag Technique (for A200 and A200I). Method 6. ANKOM Technol. Macedon NY 2014. Available online: https://www.ankom.com/sites/default/files/document-files/Method_6_NDF_A200.pdf (accessed on 5 January 2022).
  27. Ankon Technology. Acid Detergent Fiber in Feeds—Filter Bag Technique (for A200 and A200I). Method 5. ANKOM Technol. Macedon NY 2014. Available online: https://www.ankom.com/sites/default/files/document-files/Method_5_ADF_A200.pdf (accessed on 5 January 2022).
  28. Littell, R.C.; Stroup, W.W.; Milliken, G.A.; Wolfinger, R.D.; Schabenberger, O. (Eds.) SAS for Mixed Models; SAS Institute Inc.: Cary, NC, USA, 2006. [Google Scholar]
  29. Portes Silva, G.; Da Silva, S.C.; Escobar-Guttiérrez, A.; Lemaire, G.; Louarn, G. Stem elongation in Pennisetum purpureum results from a fixed pattern of vegetative development potentially enhanced by the initiation of flowering. Grass Forage Sci. 2019, 74, 708–719. [Google Scholar] [CrossRef]
  30. Pereira, L.E.T.; Paiva, A.J.; Geremia, E.V.; Silva, S.C. Regrowth patterns of elephant grass (Pennisetum purpureum Schum) subjected to strategies of intermittent stocking management. Grass Forage Sci. 2015, 70, 195–204. [Google Scholar] [CrossRef]
  31. Rodolfo, G.R.; Schmitt, D.; Dias, K.M.; Sbrissia, A.F. Levels of defoliation and regrowth dynamics in elephant grass swards. Cienc. Rural 2015, 45, 1299–1304. [Google Scholar] [CrossRef] [Green Version]
  32. Matthew, C.; Lemaire, G.; Sackville-Hamilton, N.R.; Hernández Garay, A. A modified self- thinning equation to describe size/density relationships for defoliated swards. Ann. Bot. 1995, 76, 579–587. [Google Scholar] [CrossRef]
  33. Hernández Garay, A.; Matthew, C.; Hodgson, J. Tiller size/density compensation in perennial ryegrass miniature swards subject to differing defoliation heights and a proposed productivity index. Grass For. Sci. 1999, 54, 347–356. [Google Scholar] [CrossRef]
  34. Sbrissia, A.F.; Da Silva, S.C. Compensação tamanho/densidade populacional de perfilhos em pastos de capim-marandu. R. Bras. Zootec. 2008, 37, 35–47. [Google Scholar] [CrossRef] [Green Version]
  35. Martínez Calsina, L.; Agnusdei, M.G.; Assuero, S.G.; Pérez, H. Size⁄density compensation in Chloris gayana Kunth cv. Fine Cut subjected to different defoliation regimes. Grass For. Sci. 2012, 67, 255–262. [Google Scholar] [CrossRef]
  36. Da Trindade, J.K.; Da Silva, S.C.; Souza Júnior, S.J.; Giacomini, A.A.; Zeferino, C.V.; Guarda, V.D.A.; Carvalho, P.C.F. Composição morfológica da forragem consumida por bovinos de corte durante o rebaixamento do capim-marandu submetido a estratégias de pastejo rotativo. Pesqui. Agropecu. Bras. 2007, 42, 883–890. [Google Scholar] [CrossRef] [Green Version]
  37. Rouquette, F.M. Invited Review: The roles of forage management, forage quality, and forage allowance in grazing research. Prof. Anim. Sci. 2016, 32, 10–18. [Google Scholar] [CrossRef]
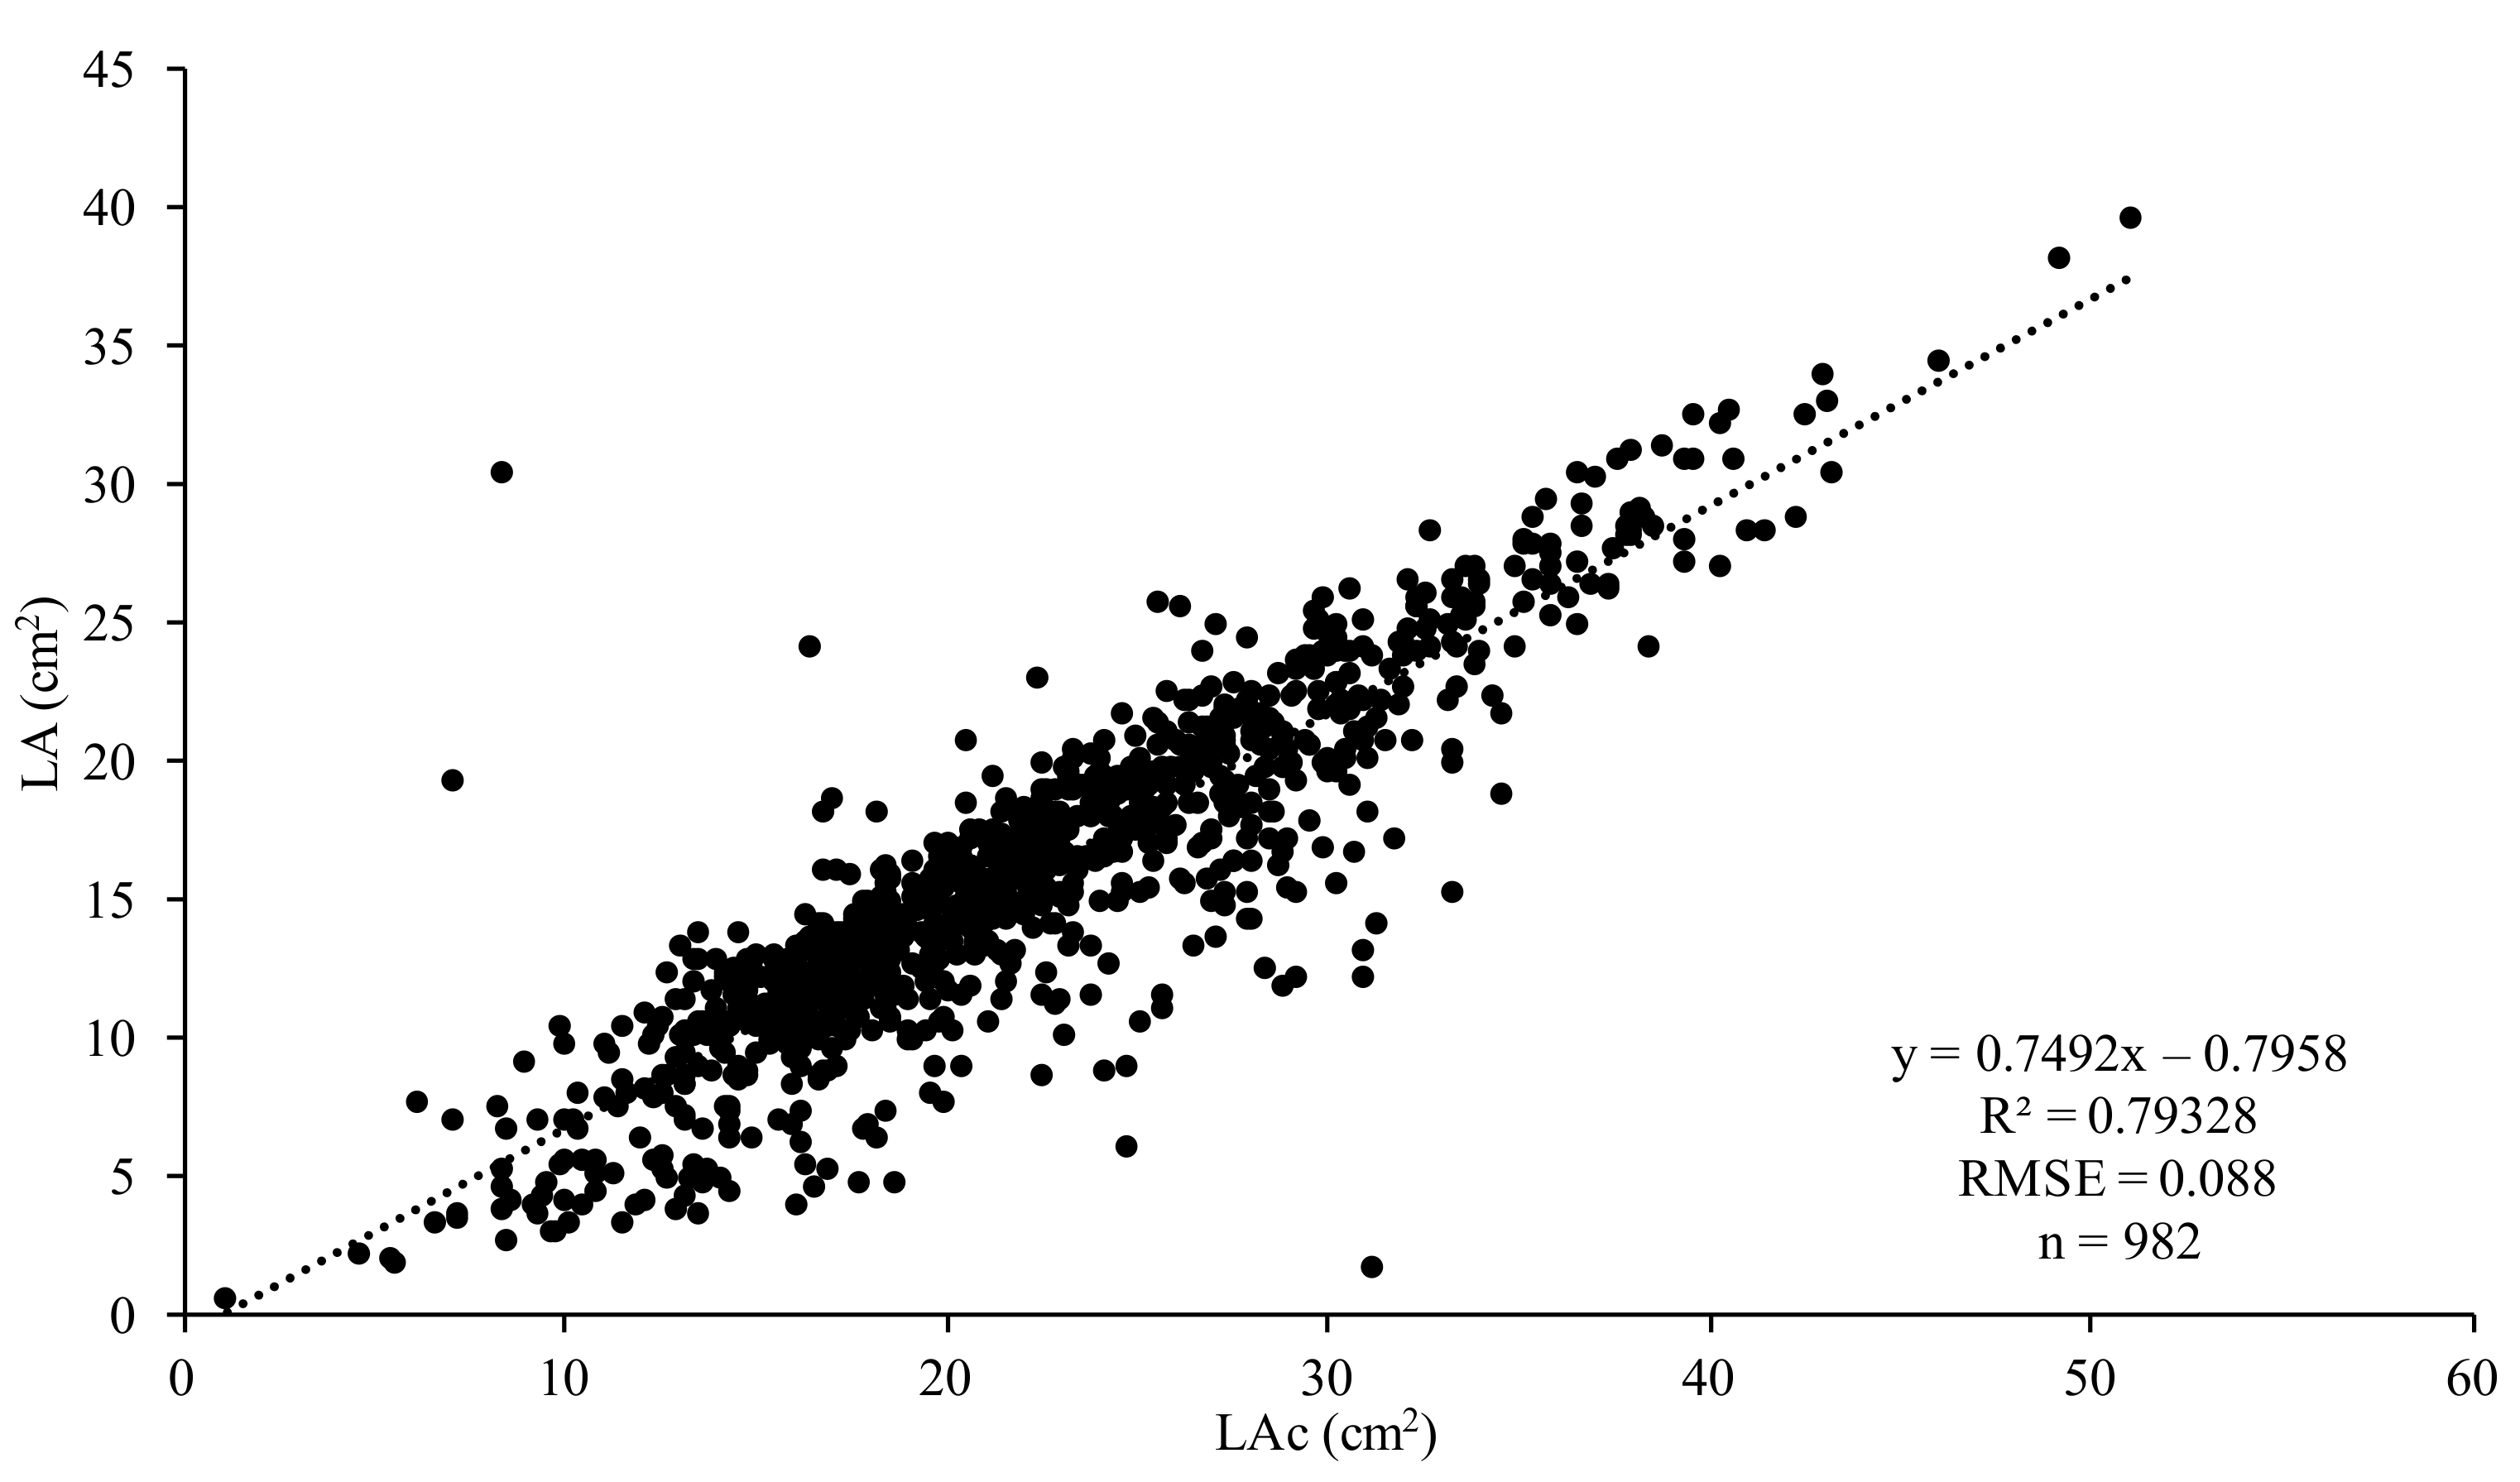
Figure 1. Regression between calculated leaf area (by assessing leaf length × leaf width; LAc) and scanned leaf area (by using the leaf area meter LI-COR, Model LI-3000A; LA) of tangolagrass.
Agriculture 12 00279 g001
Figure 2. Average herbage (HAcR), leaf (LAcR), and stem accumulation rate (SAcR; kg DM ha−1 d−1) of tangolagrass pastures subjected to different pre-grazing height targets (20, 30, or 40 cm) and the same intensity of defoliation (40% of the initial height). Vertical error bars correspond to the standard error of the mean (SEM). For each variable, means followed by the same letter do not differ by the Tukey–Kramer test (p < 0.05).
Agriculture 12 00279 g002
Table 1. Monthly weather data during the experiment in Orleans, SC, Brazil.
MonthAverage Temperature (°C)Monthly Precipitation (mm)
2018201920182019
January24.627.1120.6112.9
February24.524.830.5105.9
March24.722.899.976.9
April24.122.423.1426.1
May20.612.7111.4357.8
June17.112.6125.423.7
Table 2. Soil chemical characteristics (0–20 cm depth) of the experimental area before starting the experiment.
BlockpHOM 1PKH + AlCEC
%mg dm−3cmolc dm−3
I6.41.42.0886.55.54
II6.41.51.9558.15.62
III6.22.02.57411.46.37
1 pH in H2O; OM, organic matter; P, phosphorous (Melich-1); K, potassium (Melich-1); H + Al, potential acidity; CEC, cation exchange capacity.
Table 3. Average tiller population density (tillers m−2; TPD), and pre- and post-grazing leaf area index (LAI pre and LAI post, respectively) of tangolagrass pastures subjected to different pre-grazing height targets (20, 30, or 40 cm) and the same intensity of defoliation (40% of the initial height).
VariableHeight (cm)SEM
203040
TPD 11190 A1290 A1130 A97.4
LAI pre1.9 A2.1 A2.5 A0.22
LAI post0.8 A0.5 A0.6 A0.33
1 Means followed by the same letter in rows do not differ by the Tukey-Kramer test (p < 0.05). SEM, standard error of the mean.
Table 4. Pre- and post-grazing herbage mass (kg DM ha−1; HM) and plant-part composition (leaves, stems, and senescent tissues; %) of tangolagrass pastures subjected to different pre-grazing height targets (20, 30, or 40 cm) and the same intensity of defoliation (40% of the initial height).
VariableHeight (cm)SEM
203040
Pre-grazing
HM 13430 B3710 B4470 A201
Leaves25 A22 A22 A1.31
Stems45 A47 A49 A1.98
Senesc. tissues26 A28 A27 A2.49
Post-grazing
HM1820 B2310 A2280 A165
Leaves9 A8 A8 A1.74
Stems48 A48 A50 A1.82
Senesc. tissues38 A40 A39 A1.85
1 Means followed by the same letter in rows do not differ by the Tukey–Kramer test (p < 0.05).
Table 5. Chemical composition (neutral detergent fiber, NDF; acid detergent fiber, ADF; and crude protein, CP; on % DM basis) of hand-plucked herbage samples of tangolagrass pastures subjected to different pre-grazing height targets (20, 30, or 40 cm) and the same intensity of defoliation (40% of the initial height).
VariableHeight (cm)SEM
203040
NDF 155.0 A57.2 A57.9 A1.97
ADF23.7 A25.2 A26.0 A0.95
CP22.4 A24.7 A22.7 B0.83
1 Means followed by the same letter in rows do not differ by the Tukey–Kramer test (p < 0.05).
Publisher’s Note: MDPI stays neutral with regard to jurisdictional claims in published maps and institutional affiliations.