Article

Agro-Environmental Practices and Business Performance in the Wine Sector

1
Faculty of Economics and Engineering Management in Novi Sad, University Business Academy in Novi Sad, Cvećarska 2, 21000 Novi Sad, Serbia
2
Belgrade Business and Arts Academy of Applied Studies, Bulevar Zorana Đinđića 152а, 11070 Beograd, Serbia
3
Faculty of Technical Sciences, University of Novi Sad, Trg Dositeja Obradovića 6, 21000 Novi Sad, Serbia
4
Academy of Business Economics Čačak, Bulevar Vuka Karadžića, 32000 Čačak, Serbia
5
School of Engineering Management, Bulevar Vojvode Mišića 43, 11000 Belgrade, Serbia
6
Institute of Applied Sciences Belgrade, Lomina 2, 11000 Belgrade, Serbia
*
Author to whom correspondence should be addressed.
Agriculture 2022, 12(2), 239; https://doi.org/10.3390/agriculture12020239
Submission received: 25 January 2022 / Revised: 4 February 2022 / Accepted: 7 February 2022 / Published: 8 February 2022
(This article belongs to the Special Issue Agricultural Food Marketing, Economics and Policies)

Abstract

:
Wine production is directly related to the environmentally responsible production. In recent years, due to demands for an environmentally responsible wine production in the Republic of Serbia, wine producers have become aware of the environmental responsibilities and are taking measures to prevent environmental problems. The objective of this research was to investigate attitudes of winery owners/managers on business performance of the wineries concerning the environmental behavior and its disclosure. The research has been conducted in the period from July to the end of October 2021 on a sample of 330 small wineries in the Republic of Serbia. The data were processed in the Smart PLS software v.3.2.7. The findings show a positive connection between of both service and financial performance with an ethical environmental behavior and environmental disclosure. However, no positive connection between innovative performance and ethical environmental behavior or ethical environmental disclosure has been determined. The positive attitudes of managers on the environment influence the business performance of wineries and indirectly on environmental behavior and disclosure. The current study should contribute to the relevant literature, as it investigates not only firm behavior in the wine sector, but also the impact of firm performance on the environment.

1. Introduction

Due to its geographical position and favorable soil factors, the Republic of Serbia has a longstanding tradition of winegrowing. As the production in the wine industry in Serbia has been stabilized in last couple of years, the need for the analysis of the business performance of wineries has emerged. Data from SORS (Statistical Office of the Republic of Serbia), from 2018, show that the areas under grapes are increasing and are maintained at the level of approximately 20.5 thousand ha. According to the SORS, the production of grapes, in 2018 amounted to 149,595 t, which is about 10% lower in relation to 2017 as well as in relation to the 10-year average (2009–2018). In the period (2009–2018), the total average annual grape production was 167,363 t [1]. Prodanović et al. [2] pointed out, that the wine production in Serbia is still at a relatively low level, which annually amounts to about 37.6 million liters, but in recent years, an optimistic growth trend has been registered [3].
Globalization has led to increased competition and changes in wine production and consumption. For the purpose of market positioning and in the context of emphasized environmental responsibilities, wineries must adapt their strategies and performance to these market challenges [4]. Disclosure of information on the activities of wineries concerning the environment is an issue that can be analyzed from the economic, legal, or consumer side. The question arises as to how important this information is and how much it affects their wine competitors, wine consumers, wine associates, and partners. In this context, the management of wineries is very important, although there is a fear that the implementation of environmental strategies is expensive and mainly at the expense of profit. Business management of wineries implies supply chain management, brand, finance, and innovative performance of wineries, and in that process, the communication planning [5], the brand monitoring development, and the loyalty development [6] are of great importance. The activities of wineries should contribute to the improvement of communication with stakeholders, as well as provide information and education as to direct consumers towards “green” products. Visits to wineries may not necessarily lead to sales, but there are indirect benefits in terms of increased communication with staff, increased loyalty, and emotional connection to the product. In this context, wine tourism plays a significant role, as there are 17 registered wine routes in Serbia. The quality of wine can be judged only after consumption (good experience), so consumers will ask for more information on the price [7], although price information differentially influences the consumer’s subjective experience of wine.
The Republic of Serbia is a developing country, burdened with numerous problems from the past and the fact is that most companies neglect to care for the environment. There is a reasonable suspicion that producers are not aware and/or educated about the effects that behavior and decisions can have on the development of local society, as well as the development of society as a whole. The role of state institutions and media [8] in the development of environmental awareness and behavior in the environment has been recognized. Vićentijević [9] stated that environmental disclosure contributes to understanding and recognizing the business opportunities of companies, providing the risks and opportunities faced by companies, adds value to companies in a transparent way, thus contributing to more efficient management [9] for the company, as well as for the economy as a whole [10,11]. Although various interest groups are interested in environmental disclosure [12], in Serbia, regardless of the business performance of companies, there is no developed awareness of the importance of environmental disclosures. In fact, this relationship has been insufficiently researched and empirical evidence is lacking. Due to the fact that individuals’ attitudes towards the environment greatly influence their future behavior [13], the analysis of this impact is scientifically useful in understanding the indirect impact of attitudes on environmental behavior and environmental disclosure.
Therefore, the specific objective of this research was to investigate the role of business performance of the wineries concerning the environmental behavior and its disclosure. The paper shall also investigate the attitudes of winery owners-managers on business performance (brand performance, service performance, financial performance, and innovative performance) and indirectly on environmental behavior and disclosure. The current study should contribute to the relevant literature, as it investigates not only wine production and firm behavior but also the impact of firm performance on the environment. The authors opted for this topic due to concerns about the state of the environment and demands for environmentally responsible wine production in the Republic of Serbia. The paper aims to determine which segment of business performance has the most intense impact, and how the impact of identified performance changes under the influence of winery managers’ attitudes. After the introductory part, the authors present a theoretical basis on the business performance of wineries and the attitudes of winery managers in the context of the environment. The methodological framework focuses on the goal of the research and the research methods used, followed by the research findings and their discussion. In the conclusion section, the authors summarize the findings, present the limitations of the research, and make policy recommendations.

2. Theoretical Background and Hypothesis Development

2.1. Business Performance of the Winery

In the modern literature, “successful organizations” have positive financial results, successfully adapt to changes in the environment, possess a managerial focus on social opportunities and innovation, having positive business performance. Market-oriented behavior implies different activities/strategies and results in improved business performance of the company, whether we are talking about company resources or additional variables (innovation or marketing capabilities, and brand management capabilities). The diversity and mobility of resources is significant and it is difficult to determine which resources or activities are more valuable. Managing the business performance of wineries firstly implies the identification of critical factors, adequate measurement and final improvement, i.e., successful management of risk parameters. As far as the brand performance of wineries is concerned, the key questions are: how the value is built, how it is improved and maintained.
Reid et al. [14], Albert and Merunka [15], Gumparthi and Patra [16] pointed out that building a wine brand requires modern precise marketing tools, the marketing communication and the communication through social networks [17,18,19,20,21], the internet advertising, and the web design [22]. Szolnoki et al. [17] pointed out that membership in the groups on the social networks [23] or the wine groups [24] has a positive effect on the wine purchase, and contribute to the strengthening and to the brand recognition [25,26]. Efficient marketing communication [27] leads to company profiles with a desired image and creates an appropriate position in the consciousness of consumers and the general public [28] contributing to an increased awareness on sustainability. Muñoz et al. [29] pointed to the importance of the brand in the prevention of wine counterfeiting. They concluded that proactivity and differentiation of wine, the development of loyalty of wine consumers [30], the improvement and the guarantee of the wine quality, the geographical indication [31,32,33,34] contribute to the purchase and the brand recognition [35] and the overall performance of the wineries. Peattie [36] and Barber and Taylor [37] pointed to the existence of a link between the purchase and willingness to pay a premium for environmentally friendly products or wines with guaranteed quality/origin [38,39,40,41,42]. The business performance of wineries largely depends on supply chain management, although managers are not yet aware of this [43]. There is a lack of marketing studies on the impact of distribution systems and logistics [44].
Buying wine when visiting a winery is a form of distribution and affects customer satisfaction and brand and image development [45]. Mitchell and Hall [46] pointed out that visits to wineries contribute to strengthening loyalty and influence subsequent consumer behavior, as well as that a loyalty, buying wine after a visit and repeating visits, is more pronounced among domestic visitors. Wineries attract visitors with their ambience [47]. Consumer activities in a winery or wine club [48] are crucial for developing and strengthening loyalty to certain brands. Wine tourists plan their visits based on certain information (size of winery, length of stay in the wine region), including various motivating factors [46,49,50,51,52,53,54]. Educating visitors and other potential consumers is important in building brand loyalty and improving the winery’s business performance [55,56]. Tours, product tastings and production presentations are activities for the education of visitors and consumers, wine tourism is connected with the past and tradition, in the global context of tourism (landscape, cultural activities, and catering systems). As Bruwer and Rueger-Muck [57] stated, visits to wineries present a multitude of different sensations: ambiance, atmosphere, environment, regional culture and cuisine, local wine styles and varieties. Revenues from winery visits contribute to rural development, along with the sustainability of rural life and agricultural landscapes [5,58]. In this way, tourists get acquainted with wine culture, creating synergy between localities, gastronomy and visitor experiences [59]. Wine becomes a traditional resource that forms the authenticity of the destination to the stage of forming and branding the tourist region [60].
A study by Santos et al. [61] showed that wine entrepreneurs need a long-term investment horizon because the recovery of initial investments in winery start-up projects takes many years. The authors pointed out that the startup projects of wineries are greatly influenced by prices and costs. High land prices are economically justified for investors and entrepreneurs with the possibility of risk diversification, but can be a critical obstacle for individual entrepreneurs who lack capital. Some authors have dealt with the relationship between climate change, i.e., temperature rise, and the quality and price of wine [62,63]. Ashenfelter and Storchmann [64] and Ashenfelter [65] presented the economic implications between climate change and wine. Gergaud and Ginsburgh [66] showed that the technology applied in vineyards and wineries explains the price differences between wines, while Cross et al. [67] revealed that vineyard sales prices are strongly determined by names but not by specific location attributes, such as slope, aspect, altitude, and soil types. Price is a variable category and manufacturers usually use it to influence consumers’ choices, along with other parameters: bottle style, label design, advertising campaigns (for example, champagne). In addition, the importance of expert assessments and the role of experts is very controversial. Several papers emphasize the assessments of experts as important. Cardebat et al. [68] confirmed that the price variations can be better explained by weather conditions than by differences in expert estimates. Many studies reveal that the size of the manufacturer, or the size of the production, can be a significant price factor. However, there is a surprising lack of marketing studies on the impact of distribution systems and logistics [69]. Outreville [69] summarized the determinant factors: geography/viticulture; time horizon; public information; production costs and quantity supplied. Wine prices are not only affected by the quantity demanded, but also by the set of attributes that the consumers consider. Wine prices are usually studied using a hedonistic pricing model based on the Lancaster approach, which links the price of goods with different objective attributes (color, vintage, alcohol content, and grape variety) [70,71], sensory attributes (aroma, finish or harmony), information that usually comes from expert opinions (ratings) or medals awarded [62,72,73,74]; the influence of reputation, both individual and collective, of wines and producers amongst consumers. Ecologically oriented consumers show a greater willingness to buy organic wine [37,75]; and pay a higher price [76,77,78]. The consumers who had the largest share of organic wine expenditure showed strong environmental attitudes, propensity for sustainable products, and ethical concern [79]. Pomarici et al. [80] indicated that some wine consumers are interested in environmentally-friendly wine, environmental protection, and water footprint [81]. However, some research has shown [42,82] that environmental concerns are not a decisive factor in buying organic wine, linking it to a lack of trust in organic labeling or a lack of information regarding organic certification [83]. On the other hand, some authors consider the price to be the only important attribute when making a purchase decision, i.e., they believe that the eco-label is not a strong element of wine differentiation [84,85].
Innovative winery models pay attention to new technologies, and it often represents a platform for developing completely new business models in the long term [86,87]. Small and medium-sized enterprises (SMEs) usually lack the resources to implement new technologies and digital transformation. Dressler and Paunović [86] pointed out that the wineries often expand their range to include grape juice, vermouth, gin, and similar drinks. Social media are an essential element of the online platform and facilitate the communication process [88]. The wineries are often focused on making a profit, while social and environmental benefits are often marginalized [89]. Annunziata et al. [90] pointed out that the sustainability-oriented capabilities of wineries are rooted in strategic orientation and proactive socio-environmental practices, and the sustainability orientation is expected to have a positive impact on business growth and transformation.

2.2. Environmental Behaviour and Business Performance

Barba-Sánchez and Atienza-Sahuquillo [91] addressed the question of the relationship between the degree of proactivity of a firm’s environmental strategies and its business performance. They concluded that environmental proactivity [92] improves business performance, and has a greater impact on reducing environmental impact and improving environmental efficiency. Banerjee et al. [93] concluded that there is an internal and external environmental orientation and an environmental corporate and marketing strategy. Connection with various environmental issues is important for the integration of environmental proactivity into corporate strategy [94,95]. Environmental proactivity is a segment of sustainable competitive advantage, and should ultimately contribute to improving economic performance and reducing companies’ environmental impact by improving their environmental performance.
Some studies point out to the economic viability, i.e., the impact of environmental behavior and business results [96], while other authors show that a large number of factors influence positive business results. Knight et al. [97] analyzed the impact of the wine industry on the society and the environment and point out that sustainable business has become an integral part of modern corporate governance [98]. Therefore, wine production should be sustainable, and management of resources and production process is one of the most important activities. The authors pointed out the ecological dimension of land and water resources, chemical fertilizers, and the ecological behavior in the wine industry has been and will continue to be the subject of research. Thus, the responsible behavior towards the environment can be a result, but also a precondition of financial effects, it can be related to the wealth and/or specificity of resources. Some authors pointed out a negative relationship between financial performance and environmental activities [99], while Ko and Liu [100] showed that the development of this relationship is influenced by the level of development of marketing and R&D performance of the company. Research by Barber et al. [101] showed that the high prices that consumers are willing to pay are related to the qualitative and quantitative characteristics of the wine, and not to the ecological dimension of the winery’s business. Ginon et al. [102] investigated consumers’ perception of environmentally friendly logos in wine production and concluded that there is a need for improving communication on environmentally sustainable wines. Barber [101] pointed to the importance of eco-friendly packaging for wine [21].
In the wine industry, resources can be scarce, interconnected, i.e., in correlation. So, the question arises: is any of these individual resources related to behavior and environmental discovery, and what is the nature and intensity of the relationship? The assumption is that wineries that own and exploit rare resources behave responsibly, i.e., have pro-environmental management and business strategies. Previous research on the ecological perspective of the agri-food sector in Serbia, especially winemaking, has been dedicated to very specific issues, e.g., technological production processes, pollution, emissions of air pollutants, legislation [103,104], organic agriculture [105,106] etc. However, there is a lack of a study dealing with corporate environmental responsibility [107]. The relationship between environmental behavior and company performance, as well as impact of certain business factors on environmental behavior in the Serbian agri-food industry, especially wine sector, has been insufficiently investigated. Winemakers are aware of the existence of the impact of production on the environment [
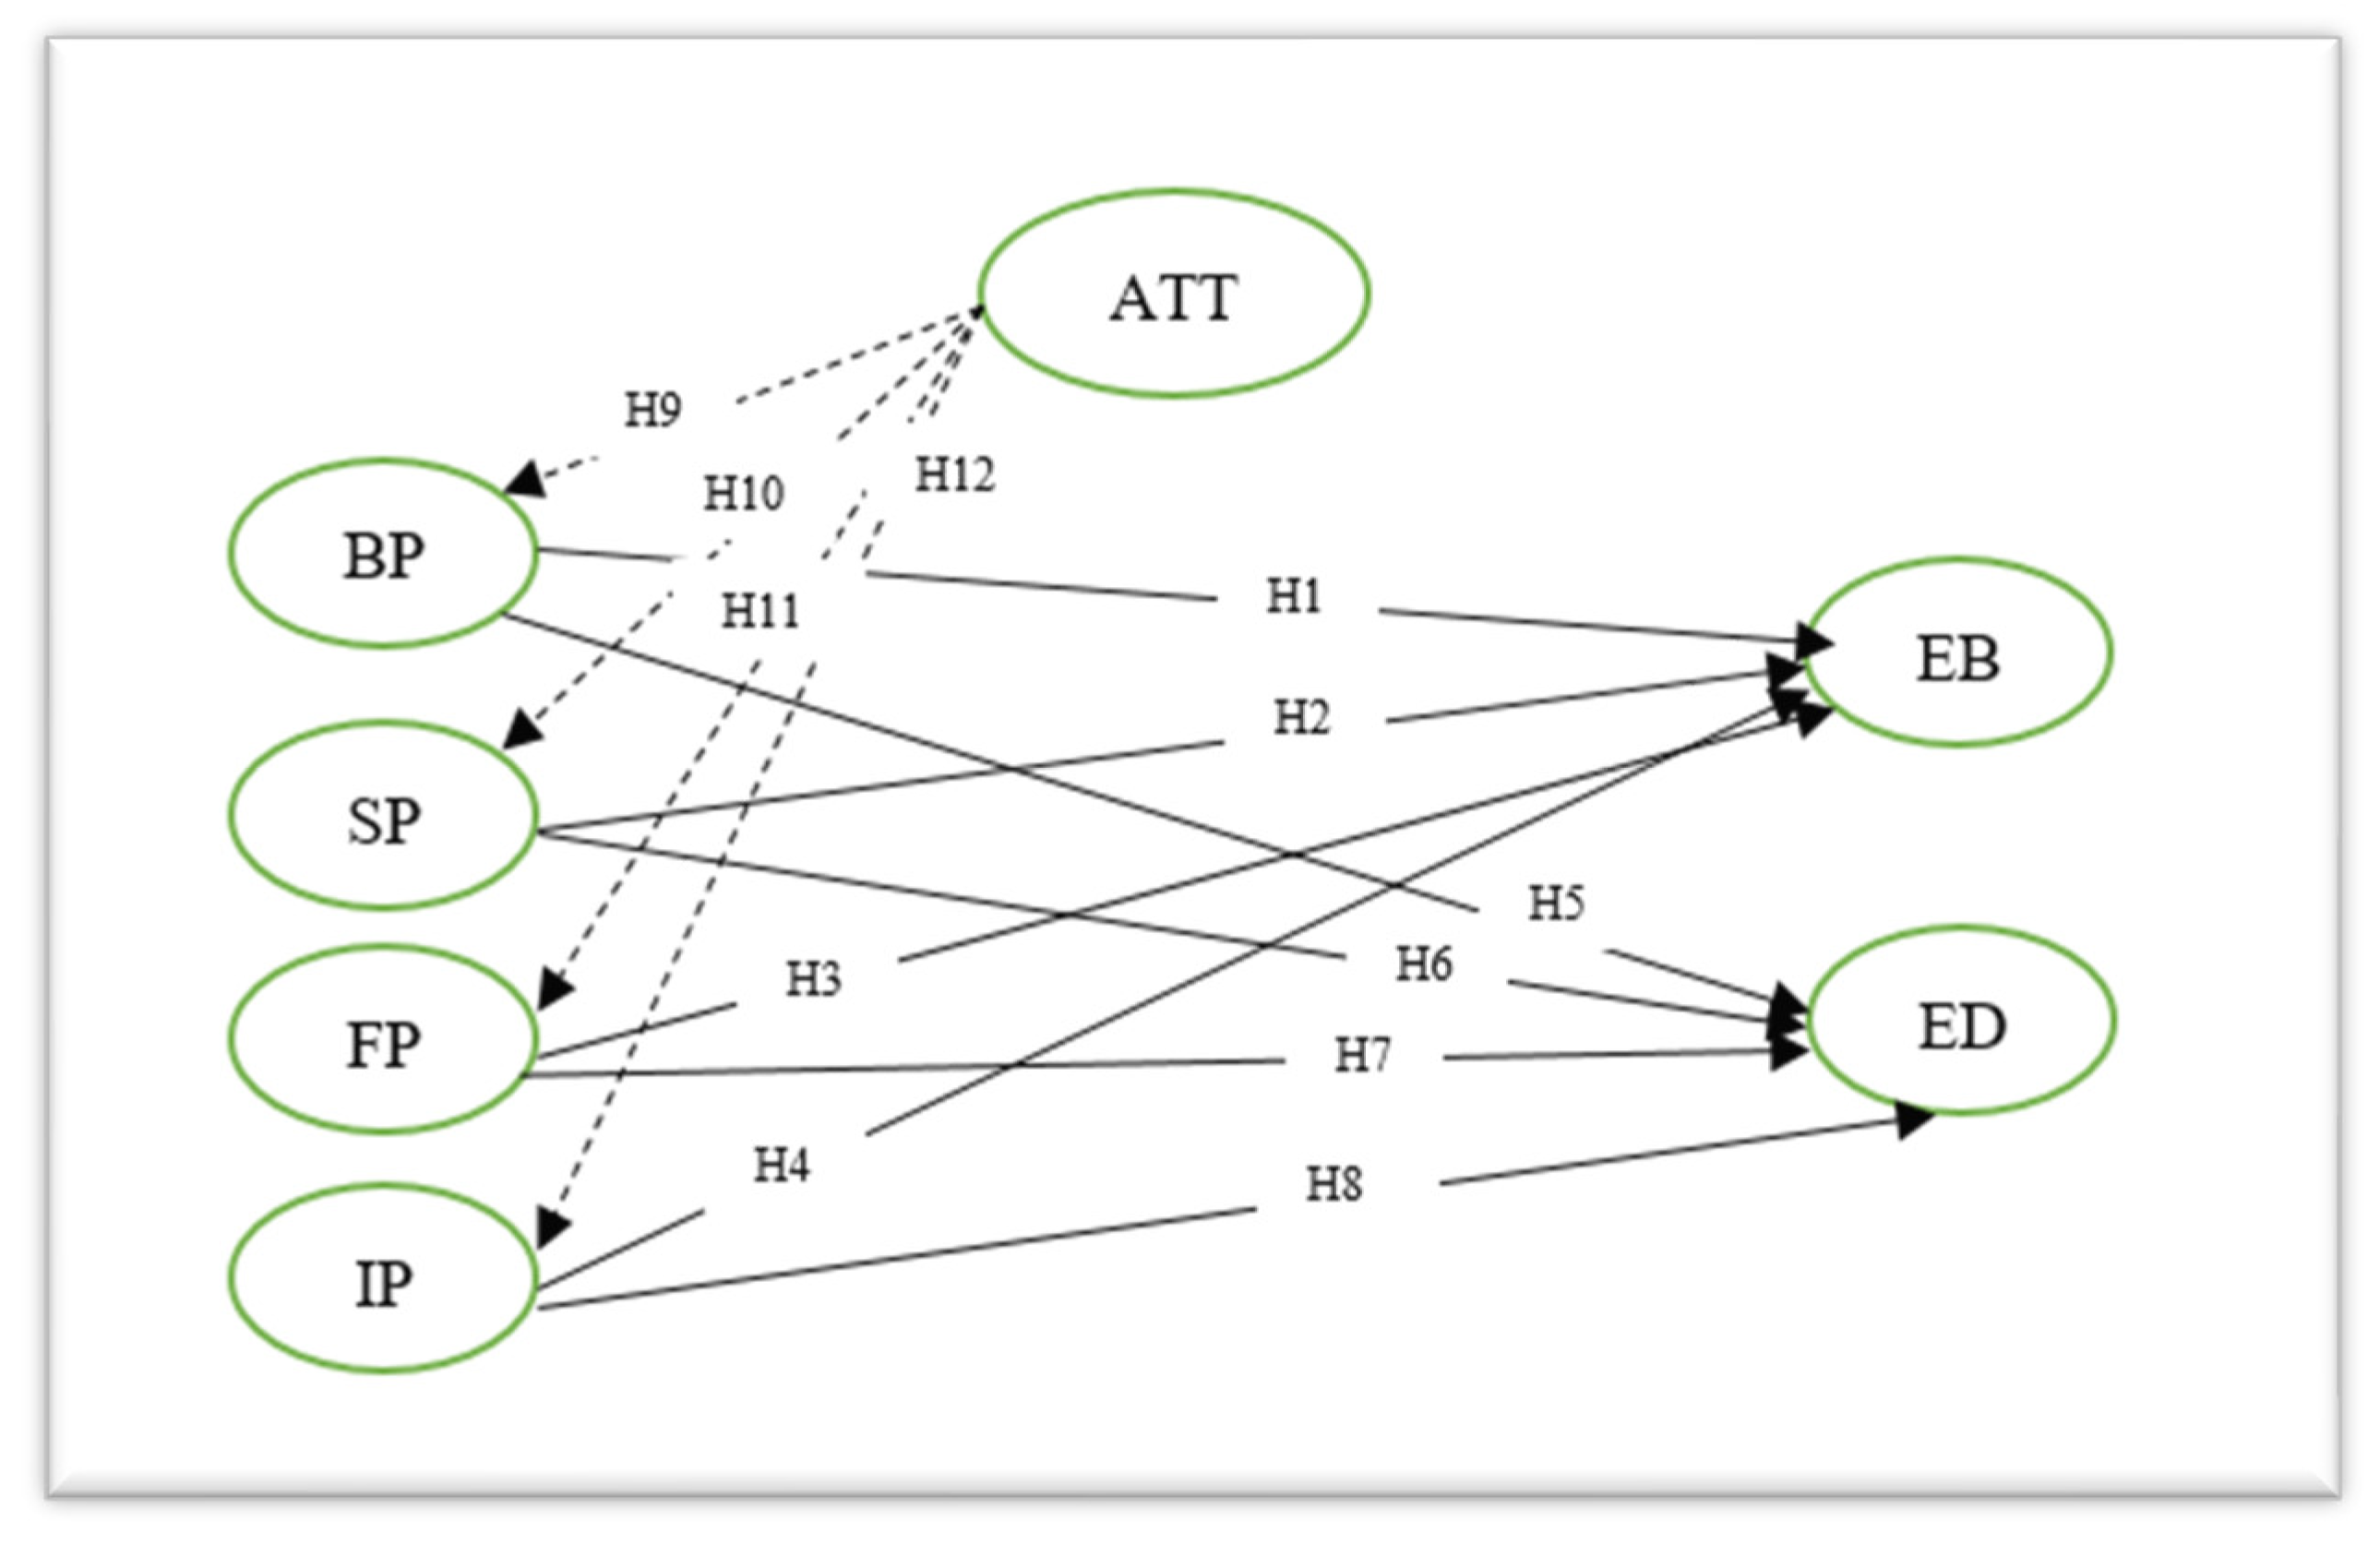
2], and their environmental activities, but they do not sufficiently articulate their own responsibility in relation to sustainable development. Such an attitude can be related to the volume of production, i.e., share in the total wine industry. This research should fill this gap, i.e., explain the importance of knowing the performance of wineries and their impact on environmental behavior for agro-managers and other actors. The purpose of the research is to examine the performance of small wineries in Serbia in relation to environmental behavior. Since the business performance of wineries includes several segments, the following research is aimed at examining the conditionality and the degree of impact and significance of these performances on environmental behavior. The following are hypotheses that show the connection (Figure 1) between the business performance of wineries and environmental behavior (EB):
Hypothesis 1 (H1):
There is a positive connection between brand performance (BP) and environmental behavior (EB).
Hypothesis 2 (H2):
There is a positive connection between service performance (SP) and environmental behavior (EB).
Hypothesis 3 (H3):
There is a positive connection between innovative performance (IP) and environmental behavior (EB).
Hypothesis 4 (H4):
There is a positive connection between financial performance (FP) and environmental behavior (EB).

2.3. Environmental Disclosure and Business Peformance

As Malarvizhi and Matta [108] stated, sustainability reporting is the reporting of credible and relevant corporate environmental, social and economic performance [109]. Campbell [110] defined environmental disclosure as the presentation of data on activities affected by organizational processes or operations to the natural environment. Environmental disclosure provides a comprehensive picture of the company’s capabilities in the long run. It portrays the company’s social responsibility, its sustainable development, corporate governance and the company’s impact on the environment and society. The economic effects of companies’ operations on society and the environment are the subject of sustainability reports, whether they are an integral part of annual reports or as separate sustainability reports [111]. In the process of managing companies, managers make decisions about the environment. Such sustainable business and commitment to the environment is a segment of strategic management [112,113]. It is logical that companies do not want to publish reports of violations of environmental laws and want to avoid the risk of paying fines [108]. In order for companies to present positive information about the environment, they must work on improving their environmental impact, i.e., business performance. Stevanović and Petrović-Randjelović [114] pointed out that environmental issues are critical success factors in creating a positive image of the company [108] in modern business conditions.
The size of the company is most often directly related to the publication of environmental data and, as Gray et al. [115] stated, the level of environmental disclosures differs between firms, the whole industry, and states [116]. As Knight et al. [97] stated, large companies are focused on reporting on long-term environmental policies and use publicly available documents (annual reports, environmental reports). Small companies dealing with environmental issues often do not publish such information when needed. Even, small wineries choose not to publish data on environmental activities. The reasons and justification for that are found in the reservations of consumers, the fear that activities may be misinterpreted, or that they may harm the brand.
On the other hand, environmental disclosure can be related to the so-called reputational risk, so it is important to pay attention and act preventively. Research by Singh and Joshi [117] indicated a positive relationship between profitability [115,117,118], company size and environmental disclosures, while Molina-Azorín et al. [112] pointed to a positive relationship between environmental disclosures and firm financial performance [119]. Malarvizhi and Matta [108] linked environmental disclosure to greater business opportunities, extra sales, due to the demand for cleaner products. They pointed out that environmentally responsible companies will have a better relationship with customers, investors and employees. On the other hand, the findings of Abdul-Rahman et al. [120] showed no significant association between firm performance and environmental disclosure.
Most of the previous studies refer to developed countries, developed companies or sectors. They do not raise the question of the need and importance of environmental disclosure, but analyze its impacts and effects. This topic has been researched in Serbia on the example of the textile industry [9], banking sector [121], multinational companies and service company [122]. This study should fill the research gap and explain the relationship between business performance and the disclosure of environmental information on the example of wineries. Finally, in this research, we start from the existence of a positive relationship between (Figure 1) winery performance and environmental disclosure.
Hypothesis 5 (H5):
There is a positive connection between brand performance (BP) and environmental disclosure (ED).
Hypothesis 6 (H6):
There is a positive connection between service performance (SP) and environmental disclosure (ED).
Hypothesis 7 (H7):
There is a positive connection between innovative performance (IP) and environmental disclosure (ED).
Hypothesis 8 (H8):
There is a positive connection between financial performance (FP) and environmental disclosure (ED).

2.4. Attitudes and Business Performance

The environmental attitudes determine the behavior of individuals in the environment. They are often associated with moral norms, customs and lead to the improvement of human behavior, i.e., the establishment of positive interaction with the environment [123]. Environmental attitudes of managers and their intentions towards the environment [124] depend on personal values [125] and influence environmental decisions and define specific practices [126]. Managers’ personal values influence environmental behavior, enable managers to distinguish between important and unimportant issues, influence other members of organizations, and can change the way they do business [127,128]. As Sharma [129] pointed out, environmental strategies range from compliance with regulations and standard industry practices to voluntary actions to protect the environment. Managerial interpretation of environmental issues differs, problems are perceived as threats or opportunities depending on personal attitudes, personality traits [130], but also organizational factors, company performance. Managers are ready to change the way the company operates depending on the beliefs on the human–environment relationship, through the selection of information. Papagiannakis and Lioukas [131] went a step further and identified two types of personal values that are expected to shape managers’ environmental attitudes and impact on business and environmental behavior.
The implementation of the environmental behavior in wineries is strongly influenced by the managers and their attitudes [132,133], especially in small wineries where they are the owners and the managers and where they make all decisions, and logically, on the sustainable production [134]. The managers’ environmental actions are a response to individual attitudes on the environment, as well as on the environmental disclosure. Gabadylova et al. [135] concluded that the satisfaction of individuals and personal attitude towards the environment were decisive in the decision-making and sustainable wine production. The study of Singh et al. [136] introduced the notion of green governance and green innovation and the impact on enterprise environmental performance. The authors concluded that a firm’s business performance depends on the quality of environmentally friendly products, green processes and product innovation, and the involvement of sustainable policies [137,138]. Moreover, not only can employee attitudes influence green product innovation and reduce the negative impact of business on the environment, but they can also increase the company’s financial and social performance. Šarković et al. [139] identified the attitudes, behavior and willingness of farmers in Serbia to participate in solving environmental problems. Authors such as Aminrad [140] concluded that formal education influences farmers’ decisions on key environmental and agricultural production issues. Thus, the attitudes of employees should not be perceived as pressure, but as organizational intentions and practices for increasing the performance and competitiveness of companies. Our study contributes to spreading knowledge on wineries managers/owners’ environmental attitudes and business performance. Second, our research should fill a gap on the key role of employees in a firm’s environmental ethics, its environmental performance, and its competitive advantage. Last but not least, our study should offer managers and practitioners the knowledge and information they need to use and manage business performance to increase environmental performance and sustainable economic success. The following are hypotheses that show the connection (Figure 1) between ethical environmental attitudes and attitudes of wineries with the business performance of wineries:
Hypothesis 9 (H9):
There is a positive connection between environmental attitudes (ATT) and brand performance (BP).
Hypothesis 10 (H10):
There is a positive connection between environmental attitudes (ATT) and financial performance (FP).
Hypothesis 11 (H11):
There is a positive connection between environmental attitudes (ATT) and service performance (SP).
Hypothesis 12 (H12):
There is a positive connection between environmental attitudes (ATT) and innovative performance (IP).

3. Materials and Methods

The conducted research is focused on small wineries in Serbia, which sell their wine in their wineries and at all points of sale. The total number of registered wineries in the Republic of Serbia in 2020 was 430 [141]. According to Pivac et al. [142] small wineries have less than 10 employees and less than 30 ha of vineyard. Jakšić [1] stated the capacity of wine production as a criterion for determining the size of the winery. According to him, this group consists of wineries that have limited capacities for wine production, below 20,000 L, wineries that have slightly higher capacities (from 20,000 L to less than 40,000 L) for wine production, but there are still insufficiently large capacities for competitive wine production and wineries with a capacity of 40,000–100,000 L. The questionnaire was modeled on the research of Knight et al. [97] and sent to the addresses of 350 owners of wineries from the Republic Winery Register from July to the end of October 2021. The responses that were obtained in full and that could be further elaborated on were 330 respondents (response rate 94.3%).
The survey is divided into four parts: (1) the measurement of environmental behavior (EB); (2) environmental disclosure (ED); (3) business performance: brand performance (BP), service performance (SP), financial performance (FP), innovative performance (IP); (4) environmental attitudes. In assessing all parameters of environmental behavior, disclosure, business performance, and attitudes of the winery, a five-point Likert scale will be used (1—strongly disagree, 2—disagree, 3—indecisive, 4—agree and 5—strongly agree).
Firstly, the sample has been evaluated, as the sample must be at least ten times larger than the number of formative manifest variables or ten times larger than the number of paths of the structural model that are directed towards the endogenous latent construct. The size of the investigated sample is 330 owners/managers of small wineries, and thus we consider the sample acceptable [143,144,145,146]. The external PlS-SEM model has initially the following structure: BP—3 reflective variables; SP—6 reflective variables; FP—6 reflective variables; IP—3 reflective variables and the fifth latent construct is environmental attitudes and norms (ATT) consisting of seven reflective variables. The formative variables in the external PlS-SEM model are: ED—4 variables and EB—16 variables. The internal model consists of five latent exogenous constructs (BP, SP, FP, IP, and ATT) and two endogenous latent constructs (EB and ED).
In the research, the systematization of the sample has been performed using descriptive statistics, and the normality of data distribution was tested using the Kolmogorov–Smirnov test and the Shapiro–Wilk test. According to Barclay et al. [147], normality of data distribution is not a mandatory criterion, since we have a large sample and PLS-SEM does not require normality of data distribution. To analyze and interpret the obtained results, as well as to test the set hypotheses, the modeling of structural equations by the method of partial least squares (partial least squares-structural equation modeling) has been used. PLS-SEM is a linear regression method that serves to model complex datasets, when it is not possible to apply regression analysis. The data were processed in the Smart PLS software v.3.2.7.

4. Results

4.1. Testing of External Measured Model (Manifest Variables of Formative and Reflective Character)

Reflective model assessment: In the first step, the listed variables have been entered, and have been analyzed using SPSS. Further analysis of path coefficients, Cronbach α, composite reliability (CR), and average variance extracted (AVE) are shown in Table 1. The research findings show that in the reflective measurement model, out of a total of 25 variables, 22 variables were retained, with a factor load > 0.6. Factor loads are in the range of 0.723–0.914. Manifest variables that had a value less than 0.60 were excluded from the model. The values of Cronbach’s alpha coefficients of variables of latent constructs indicate a high level of reliability [53,145] and the values range from 0.789–0.901 (BP has a value of 0.816, SP has a value of 0.901, for FP is 0.855, IP is 0.789 and for ATT is 0.860). The obtained values of composite reliability are in the range of 0.875–0.925, which means that the selected variables represent latent constructs. Convergent validity is satisfied for all latent constructs (AVE values are in the range 0.632–0.720, i.e., >0.5).
The criteria for discriminant validity (Fornell–Larcker criterion) shows the extent to which constructs differ empirically from constructs in the structural model. The analysis was performed using Fornell–Larcker criteria (Table 2) and HTMT values (Table 3). Standardized factor loads of latent constructs are higher than cross-standardized factor loads of other constructs, which satisfies the criterion and confirms the discriminant validity of individual latent constructs.
The values of cross-standardized factor loads of the reflective measuring model are presented further in the text.
Standardized factor loads of latent constructs are higher than cross-standardized factor loads of other constructs, which satisfies the criterion and confirms the discriminant validity of individual latent constructs.
Formative model assessment: The formative measurement model consists of formative variables that affect the latent construct environmental behavior and environmental disclosure. Of the 20 formative variables, 6 were retained with a factor load greater than 0.6. The assessment of the formative measurement model has been performed using the assessment of collinearity indicators (VIF) and statistical significance and relevance. Table 4 presents the results of the reliability analysis of the formative latent construct examined by testing the collinearity between the manifest variables of the latent construct using the variance inflation coefficient.
The findings on the collinearity of the formative measurement variables have shown that the values are in the range of 1.510–2.856, which satisfies the criterion that VIF should be less than 3 [143,146]. The obtained values confirm the fact that the formative measurement variables do not have the problem of collinearity.
The findings on the statistical significance of outer weights of the formative measurement variables in Table 5 have been conducted using the bootstrapping procedure at the level of significance of 5%. The results indicate that all formative variables are statistically significant.

4.2. Testing the Internal Structural Model

In the process of testing the structural model, the collinearity between sets of predictor variables was first examined in Table 6. Results of collinearity research (VIF) between latent constructs (BP, SP, IP and FP) and ED and EB, i.e., inner VIF values range from 1552 to 1026, and the obtained values are less than 3, which confirms the fact that there is no problem of collinearity in the model.
The findings in Table 7 indicate that the existence of the direct and indirect effect of the latent constructs. The strongest direct connection exists between SP and EB (0.803) and between BP and ED (0.489). The direct connections between the latent variables and EB are weaker (except for SP and EB) compared to the connections of the variables with ED. The total indirect effect of ATT on EB is 0.375 and is weaker compared to the indirect effect of ATT on ED (0.437).
In the model, the values of the corrected coefficient of determination (R2 adjusted) for EB R2 = 0.766, indicating that 76.6% EB is explained by the predictor variables BP, FP, IP, and SP; R2 = 0.906 for ED, which indicates a high influence and that 90.6% of ED has been explained by the predictor variables. In the model, the values of the corrected determinant coefficient are 0.133; 0.057; 0.002 and, 0.181 for BP, FP, IP, and SP (respectively), which indicates that the mentioned variables have been explained, with a small percentage, by the influence of ATT.
The value of cross-validated redundancy was calculated using Stone–Geisser Q2 indicators, which have shown that the obtained value is greater than zero which proves a satisfactory level of predictive significance of the model. After the obtained corrected coefficient of determination was obtained, the coefficient of effect size (f2 effect size) has been calculated and the result has shown that the obtained values indicate a small influence of exogenous latent constructs on endogenous variables. Finally, testing of the significance of the structural model and confirmation of hypotheses has been performed (Table 8).
There is a positive connection between brand performance and environmental behavior, but the hypothesis H1 has not been confirmed, because the result is not statistically significant. The hypothesis H3 has not been confirmed, the result is statistically significant, but a negative value of the influence has been obtained. The hypothesis H7 has not been confirmed, the result is statistically significant, but a negative value of the influence has been obtained. The hypothesis H12 has not been confirmed, the result is not statistically significant. Testing of hypotheses H2, H4, H5, H6, H8, H9, H10 and H11 indicates a positive and statistically significant association between the variables, and the hypothesis has been confirmed (Figure 2).

5. Discussion

The findings provide empirical evidence and theoretically complement previous research. The findings of this study show that of the analyzed variables the brand performance (BP) has the strongest impact on the brand equity (brand value coefficients BP3 = 0.914), which is consistent with the conclusions [29,31,32,34,90] on the importance of the brand for increasing turnover and improving the overall business performance of wineries. The answer to market challenges is certainly communication [17,18,19,20], marketing tools [15,16], informing [27] and educating producers and consumers [21,78,148,149], as well as clear differentiation and development of loyalty [30], and image [38]. For the creation of successful wine brands—BP1, the quality, the possession of a certificate of geographical origin [31,32,90], as well as the development of the perception on environmentally sustainable wines is highly important [21,27,101].
When analyzing the service performance (SP) the most significant variable is the growth of number of domestic visitors to the winery (SP 1 = 0.903), which is in line with other research [46]. Domestic tourists in Serbia are ready to visit wineries, each time a different one, to gain as much information as possible, but without expressing a wish for the winery revisit. In this context, it is important to establish a strong relationship of loyalty [46], communication, and education [49,55,69]. The findings confirm the impact of repeated visits on the business results of wineries, but also on the business results of the entire region [59,60]. To improve business results, it is necessary to monitor changes in consumption [49], actually trends in customer perception [4].
As the authors point out, the wine production in Serbia has potential [2,56], but additional financial resources are needed [4,61]. Stable production [1,3], i.e., volume growth (liters) is the most important component of the financial performance (FP) of the wineries (FP3 = 0.877), along with the overall profitability of this winery (path coefficient FP4 = 0.811). The wineries must use the potentials they have, to diversify the product and prevent risks [4,61]. The policy of different wine prices allows sales to customers who have different amounts of available budget for wine, and thus, willingness to pay (WTP) for certain categories of wine [40,67,76,77], especially if consumers have strong pro-ecological attitudes and purchase organic wine [42,79,80,82]. The findings have shown that the responsiveness of this winery to consumer trends and successful new product introductions have a strong impact on the innovative performance (IP) of wineries. The wineries are ready to offer new products [97] or to find a more innovative approach in wine sales. Therefore, the wineries are ready to improve business performance by offering wine that meets current consumer requirements and/or to offer innovative products.
The findings indicate a negative effect of the brand performance with the environmental behavior, i.e., therefore, we agree with the conclusions [21,101] that the relationship is difficult to measure and that it is crucial to analyze also other factors. The first hypothesis has not been confirmed, which is not consistent with the findings of Knight et al. [97], while Buysse and Verbeke [92] pointed to the importance of environmentally proactive action on business performance [91]. Customers do not perceive the connection with the brand, or are not familiar with the issues of sustainable business and resource management of the winery [2,107]. The values obtained indicate the need for management to integrate environmental proactivity into marketing [100] and corporate strategy [94,95,150]. In this way, the customers will improve the perception of qualitative and quantitative characteristics of wine [21,102]. It is necessary to combine innovative and brand performance in order to diversify wine, and thus improve environmental behavior. Although the winery has a good and recognizable brand, it seems that this is not a reason to visit wineries. For this reason, the development of wineries’ tourism capacity in conjunction with brand development can contribute to the environmental behavior of wineries, which is consistent with [45,97,151]. An attractive environment can contribute to understanding the perceptions of customers on the knowledge of the environmental activities of wineries and promote the environmental dimension of the wineries business through direct marketing actions [100]. The findings indicate a negative link between the innovation and the environmental behavior, which is not consistent with the results reported in [86,97,152]. In the light of other factors, we should mention the internal organizational factors that can affect the willingness to innovate, which would require more financial resources, human resources and growth of wineries to a higher level, for which wineries may not be ready. Small wineries have limited financial resources, rely on traditional business, but still finance is an important factor in environmental behavior [25,97,99], but in contrast to [77,97,101,112,153]. For owners/managers of wineries, monitoring of market opportunities is very important, as well as monitoring of the risk exposure.
Although environmental issues are a critical factor in creating the image of a product or company [108,114], the value obtained indicates that improving brand performance will contribute to positive environmental reporting [111,112,113]. Although the study is dedicated to small wineries, which often present environmental reports on an ad hoc basis [97], reputational indicators need to be monitored in order to build customer relationships and promote green products [108]. There is a strong association between brand performance and environmental disclosure, which is consistent with Amran et al. [25]. The total impact of financial performance on environmental disclosure is positive and strong, which is inconsistent with other research [77,97,115,117,118,119,153]. Increasing sales, and the willingness of customers to pay more for green products are linked and are the result of environmentally responsible business, and thus environmental disclosure [108]. The findings show a positive impact of service performance on environmental disclosure, which is inconsistent with the research of Knight et al. [97] and the negative impact of innovative performance on environmental disclosure, which is inconsistent with [86,97].
Managers’ attitudes about the environment are formed under the influence of personal values [124,125,130,131] and determine managerial activities. Thanks to green management, green products are created [136] and thus improve the overall performance of wineries [137,138]. The findings confirm the stated views and we conclude the existence of a strong positive impact of attitudes on environmental behavior and environmental disclosure through brand, service and finance performance, which is in line with [97,154]. Thus, the positive attitudes of managers on the environment influence the business performance of wineries and indirectly on environmental behavior and disclosure. However, influence of attitudes on innovative performance is not positive and significant, and as such provides the weakest impact on environmental behavior and environmental disclosure. Instead of making innovation the most important resource, it does not contribute to behavior and environmental reporting.
The findings indicate that environmental behavior and disclosure are related to financial performance, as well as service delivery and the development of modern chains and sales methods. As innovation requires significant financial resources, R&D, it is difficult to be accepted by the small wineries, and they are the backbone of the wine sector of most countries [155]. The findings are contrary to those of Knight et al. [97] that showed that financial resources are not important for environmental behavior and reporting. Finally, we can conclude that the performance of wineries, both financial and service performance, affects environmental behavior [97,156]. We can also conclude that the brand, financial, and service performance influence environmental reporting. Owning financial resources, as well as owning a certificate, a wine brand makes it possible to attract new customers. In addition to these external factors, which are important for behavior in the environment, we must emphasize the internal managerial attitudes as an important resource in defining attitudes towards the environment [132,135]. This is especially important because in small wineries, all decisions, even environmental decisions, are strongly influenced by the attitudes of owners/managers.

6. Conclusions

The findings have shown that wineries are aware of the importance of the environmentally responsible production and of the effects that can be achieved in this way. The wine producers are ready to adopt the new technological environmental solution to increase quantitative and qualitative business results. Up to date, no research in Serbia has investigated the interplay of factors of environmental disclosure, business performance, brand performance, service performance, financial performance, innovative performance, and environmental attitudes and norms in the wine sector. The wine producers in Serbia have in the last decades been slow to invest funds in innovation, technical equipment, and marketing activities, and thus, it has had a limiting effect on the improvement of the business performance. On the other hand, further education and promotion of local wine producers shall spur the transformation to modern trends, also relating to environmental disclosure. The successful management of wineries concerning environmental behavior and environmental reporting indicates that the relationship between business performance and the environment is strongly influenced by the attitudes of winery managers. We can conclude that the education of winery managers towards environmental attitudes and norms should be supported by national winery education programs, following the best practices of EU agricultural programs. The initiatives aimed at encouraging cooperation with wine associations that nurture and promote environmental attitudes and environmental disclosure are strongly recommended. Based on strategic goals, managers should focus on key performance indicators and monitor the quality of products, process efficiency and customer satisfaction. By nurturing pro-environmental decision-making in wineries, the owners/managers can attract new customers and help retain existing ones in the future. The limitations of the study adhere only to small wineries from Serbia; therefore, they can be generalized. The subjectivity of the respondents cannot be neglected. In order to compare the results, further work of similar study nature needs to be performed in other agriculture sectors. Since this study is a pilot study, further work shall be done to get an insight into interrelationships of identified critical factors of environmentally responsible production and environmental disclosure.

Author Contributions

Conceptualization, S.I. and J.V.T.; methodology, N.P.; software, S.B.; validation, R.P.; formal analysis, B.V.; investigation, S.I. and I.M.; resources, V.T.; data curation, D.P.; writing—original draft preparation, S.I.; writing—review and editing, J.V.T.; visualization, N.P.; supervision, S.I. and J.V.T.; project administration, N.L.; funding acquisition, S.I. All authors have read and agreed to the published version of the manuscript.

Funding

This research received external funding from the Provincial Secretariat for Higher Education and Scientific Research of Autonomous Province Vojvodina, the Republic of Serbia.

Institutional Review Board Statement

Not applicable.

Informed Consent Statement

Not applicable.

Data Availability Statement

Data are contained within the article.

Acknowledgments

This research was supported by grant No. 142-451—2570/2021 “Improving the competitiveness of organic food products in functions of sustainable development of AP Vojvodina” (Унапређење кoнкурентнoсти oрганских прехрамбених прoизвoда у функцији oдрживoг развoја АП Вoјвoдине).

Conflicts of Interest

The authors declare no conflict of interest.

References

  1. Jakšić, D. Study Analysis of the Regulatory Framework and Economics of the Wine Sector; Cardno Emerging Markets: Arlington, VA, USA, 2019. [Google Scholar]
  2. Prodanović, R.; Ignjatijević, S.; Vapa-Tankosić, J.; Brkić, I.; Škrbić, S.; Gardašević, J.; Čavlin, M. Influence of Relevant Factors on Competitiveness of Wine Sector of the Republic of Serbia. Ekon. Poljopr. 2021, 68, 911–928. [Google Scholar] [CrossRef]
  3. Vlahović, B.; Puškarić, A.; Užar, D. Contemporary Trends in the Wine Market; University of Novi Sad: Novi Sad, Serbia, 2017. [Google Scholar]
  4. Faria, S.; Gouveia, S.; Guedes, A.; Rebelo, J. Transient and Persistent Efficiency and Spatial Spillovers: Evidence from the Portuguese Wine Industry. Economies 2021, 9, 116. [Google Scholar] [CrossRef]
  5. Prodanović, R.; Brkić, I.; Škrbić, S.; Đurić, K.; Bošković, J. Strengthening the Capacity of the Wine Sector in the Service of Sustainable Rural Development of the Republic of Serbia. J. Agron. Technol. Eng. Manag. 2020, 3, 489–498. [Google Scholar]
  6. Goldgehn, L.A. Generation Who, What, Y? What You Need to Know About Generation Y. Int. J. Educ. Adv. 2004, 5, 24–34. [Google Scholar] [CrossRef]
  7. Werner, C.P.; Birkhaeuer, J.; Locher, C.; Gerger, H.; Heimgartner, N.; Colagiuri, B.; Gaab, J. Price Information Influences the Subjective Experience of Wine: A Framed Field Experiment. Food Qual. Prefer. 2021, 92, 104223. [Google Scholar] [CrossRef]
  8. Nikolic, V.; Vukic, T.; Maletaski, T.; Andevski, M. Students’ Attitudes towards Sustainable Development in Serbia. Int. J. Sustain. High. Educ. 2020, 21, 733–755. [Google Scholar] [CrossRef]
  9. Vićentijević, K. Non-Financial Reporting in the Textile Industry. Tekst. Ind. 2019, 67, 50–53. [Google Scholar] [CrossRef] [Green Version]
  10. Trenceva, N.; Krstevska, M. How to Make the Macedonian Economy More “Green”. Skola Bizn. 2017, 93–106. [Google Scholar] [CrossRef] [Green Version]
  11. Tasic, V.; Milosevic, I. The Impact of Macroeconomic Changes on the Business Decisions of Managers in Agriculture. Skola Bizn. 2017, 117–133. [Google Scholar] [CrossRef] [Green Version]
  12. Knezevic, G.; Pavlovic, V.; Stevanovic, S. Reporting on Sustainable Development: Characteristics, Disadvantages and Perspectives in the Republic of Serbia. Posl. Ekon. 2017, 11, 83–102. [Google Scholar] [CrossRef] [Green Version]
  13. Singh, S.K.; Chen, J.; Del Giudice, M.; El-Kassar, A.-N. Environmental Ethics, Environmental Performance, and Competitive Advantage: Role of Environmental Training. Technol. Forecast. Soc. Change 2019, 146, 203–211. [Google Scholar] [CrossRef]
  14. Reid, M.; Johnson, T.; Ratcliffe, M.; Skrip, K.; Wilson, J. Integrated Marketing Communications in the Australian and New Zealand Wine Industry. Int. J. Advert. 2001, 20, 239–262. [Google Scholar] [CrossRef]
  15. Albert, N.; Merunka, D. The Role of Brand Love in Consumer-brand Relationships. J. Consum. Mark. 2013, 30, 258–266. [Google Scholar] [CrossRef]
  16. Gumparthi, V.P.; Patra, S. The Phenomenon of Brand Love: A Systematic Literature Review. J. Relatsh. Mark. 2020, 19, 93–132. [Google Scholar] [CrossRef]
  17. Szolnoki, G.; Taits, D.; Nagel, M.; Fortunato, A. Using Social Media in the Wine Business: An Exploratory Study from Germany. Int. J. Wine Bus. Res. 2014, 26, 80–96. [Google Scholar] [CrossRef]
  18. Rapp, A.; Beitelspacher, L.S.; Grewal, D.; Hughes, D.E. Understanding Social Media Effects across Seller, Retailer, and Consumer Interactions. J. Acad. Mark. Sci. 2013, 41, 547–566. [Google Scholar] [CrossRef]
  19. Golder, S.A.; Wilkinson, D.M.; Huberman, B.A. Rhythms of Social Interaction: Messaging Within a Massive Online Network. In Communities and Technologies 2007; Steinfield, C., Pentland, B.T., Ackerman, M., Contractor, N., Eds.; Springer: London, UK, 2007; pp. 41–66. [Google Scholar]
  20. Hsu, C.-L.; Lin, J.C.-C. Acceptance of Blog Usage: The Roles of Technology Acceptance, Social Influence and Knowledge Sharing Motivation. Inf. Manag. 2008, 45, 65–74. [Google Scholar] [CrossRef]
  21. Sogari, G.; Pucci, T.; Aquilani, B.; Zanni, L. Millennial Generation and Environmental Sustainability: The Role of Social Media in the Consumer Purchasing Behavior for Wine. Sustainability 2017, 9, 1911. [Google Scholar] [CrossRef] [Green Version]
  22. Galati, A.; Crescimanno, M.; Tinervia, S.; Siggia, D. Website Quality and Internal Business Factors: An Empirical Investigation in the Italian Wine Industry. Int. J. Wine Bus. Res. 2016, 28, 308–326. [Google Scholar] [CrossRef]
  23. Gardašević, J.; Brkić, I.; Krstić, T. Innovations in Agricultural and Wine Production Sector. J. Agron. Technol. Eng. Manag. 2020, 3, 448–454. [Google Scholar]
  24. Thach, L. Wine 2. 0—The Next Phase of Wine Marketing? Exploring US Winery Adoption of Wine 2.0 Components. J. Wine Res. 2009, 20, 143–157. [Google Scholar] [CrossRef]
  25. Amran, A.; Ooi, S.K.; Mydin, R.T.; Devi, S.S. The Impact of Business Strategies on Online Sustainability Disclosures: The Impact of Business Strategies and Online Sustainability Disclosure. Bus. Strat. Env. 2015, 24, 551–564. [Google Scholar] [CrossRef]
  26. Mihajlović, M.; Nikolić, S.; Tasić, S. Sustainability of the Economic Model of Contemporary Economy. Održivi Razvoj 2020, 2, 7–13. [Google Scholar] [CrossRef]
  27. Barber, N.; Taylor, C.; Strick, S. Wine Consumers’ Environmental Knowledge and Attitudes: Influence on Willingness to Purchase. Int. J. Wine Res. 2009, 2009, 59–72. [Google Scholar] [CrossRef] [Green Version]
  28. Radić, S. Management of Online Marketing Communications in the Company “Milšped.” In Proceedings book of Faculty of Tehnical Sciences in Novi Sad; University of Novi Sad: Novi Sad, Serbia, 2021; Volume 36, pp. 2185–2188. [Google Scholar]
  29. Muñoz, R.M.; Fernández, M.V.; Salinero, M.Y. Assessing Consumer Behavior in the Wine Industry and Its Consequences for Wineries: A Case Study of a Spanish Company. Front. Psychol. 2019, 10, 2491. [Google Scholar] [CrossRef] [Green Version]
  30. Rossetto, L.; Gastaldello, G. The Loyalty Structure of Sparkling Wine Brands in Italy. J. Wine Econ. 2018, 13, 409–418. [Google Scholar] [CrossRef]
  31. Stranieri, S.; Cavaliere, A.; Banterle, A. The Determinants of Voluntary Traceability Standards. The Case of the Wine Sector. Wine Econ. Policy 2018, 7, 45–53. [Google Scholar] [CrossRef]
  32. Rendleman, C.M.; Hoemmen, G.A.; Altman, I.; Taylor, B.; Moon, W.; Smith, S. Wine Industry Competitiveness: A Survey of the Shawnee Hills American Viticultural Area. Wine Econ. Policy 2016, 5, 4–13. [Google Scholar] [CrossRef] [Green Version]
  33. Annunziata, A.; Pomarici, E.; Vecchio, R.; Mariani, A. Health Warnings on Wine: A Consumer Perspective. Br. Food J. 2016, 118, 647–659. [Google Scholar] [CrossRef]
  34. D’Alessandro, S.; Pecotich, A. Evaluation of Wine by Expert and Novice Consumers in the Presence of Variations in Quality, Brand and Country of Origin Cues. Food Qual. Prefer. 2013, 28, 287–303. [Google Scholar] [CrossRef]
  35. Wang, X.; Pacho, F.; Liu, J.; Kajungiro, R. Factors Influencing Organic Food Purchase Intention in Developing Countries and the Moderating Role of Knowledge. Sustainability 2019, 11, 209. [Google Scholar] [CrossRef] [Green Version]
  36. Peattie, K. Environmental Marketing Management: Meeting the Green Challenge; Pitman: London, UK, 1995. [Google Scholar]
  37. Barber, N.A.; Taylor, D.C. Experimental Approach to Assessing Actual Wine Purchase Behavior. Int. J. Wine Bus. Res. 2013, 25, 203–226. [Google Scholar] [CrossRef]
  38. van Zanten, R. Drink Choice: Factors Influencing the Intention to Drink Wine. Int. J. Wine Mark. 2005, 17, 49–61. [Google Scholar] [CrossRef] [Green Version]
  39. Samoggia, A. Wine and Health: Faraway Concepts? Br. Food J. 2016, 118, 946–960. [Google Scholar] [CrossRef]
  40. Cho, M.; Bonn, M.A.; Kang, S. Wine Attributes, Perceived Risk and Online Wine Repurchase Intention: The Cross-Level Interaction Effects of Website Quality. Int. J. Hosp. Manag. 2014, 43, 108–120. [Google Scholar] [CrossRef]
  41. Quadri-Felitti, D.L.; Fiore, A.M. Destination Loyalty: Effects of Wine Tourists’ Experiences, Memories, and Satisfaction on Intentions. Tour. Hosp. Res. 2013, 13, 47–62. [Google Scholar] [CrossRef]
  42. Kim, H.; Bonn, M.A. Authenticity: Do Tourist Perceptions of Winery Experiences Affect Behavioral Intentions? Int. J. Contemp. Hosp. Manag. 2016, 28, 839–859. [Google Scholar] [CrossRef]
  43. Chandes, J.; Estampe, D.; Berthomier, R.; Courrie, L.-A.; Han, L.; Marquevielle, S. Logistics Performance of Actors in the Wine Supply Chain. Supply Chain. Forum: Int. J. 2003, 4, 12–27. [Google Scholar] [CrossRef] [Green Version]
  44. Outreville, J.-F.; Le Fur, E. Hedonic Price Functions and Wine Price Determinants: A Review of Empirical Research. J. Agric. Food Ind. Organ. 2020, 18, 1–27. [Google Scholar] [CrossRef]
  45. Charters, S.; Ali-Knight, J. Who Is the Wine Tourist? Tour. Manag. 2002, 23, 311–319. [Google Scholar] [CrossRef]
  46. Mitchell, R.; Hall, C.M. The Post-visit Consumer Behaviour of New Zealand Winery Visitors. J. Wine Res. 2004, 15, 39–49. [Google Scholar] [CrossRef]
  47. Alonso, A.; Fraser, R.A.; Cohen, D.A. Investigating Differences between Domestic and International Winery Visitors in New Zealand. Int. J. Wine Bus. Res. 2007, 19, 114–126. [Google Scholar] [CrossRef]
  48. Hall, C.M.; Sharples, L.; Cambourne, B.; Macionis, N. Wine Tourism Around the World.; Taylor & Francis: Florence, France, 2002. [Google Scholar]
  49. Santos, V.; Ramos, P.; Almeida, N.; Santos-Pavón, E. Developing a Wine Experience Scale: A New Strategy to Measure Holistic Behaviour of Wine Tourists. Sustainability 2020, 12, 8055. [Google Scholar] [CrossRef]
  50. Đurić, K.; Prodanović, R.; Čavlin, M.; Lukač-Bulatović, M. Economic Performance of Agroindustry in AP Vojvodina. Oditor 2020, 6, 7–19. [Google Scholar] [CrossRef]
  51. Jokanović, M.; Golubović, D.; Šupić, B.; Koprivica, A. Application of Renewable Energy Sources in Terms of Economic, Environmental and Social Sustainability. Appl. Eng. Lett. 2018, 3, 34–39. [Google Scholar] [CrossRef] [Green Version]
  52. Dihovični, D.; Škrbić, S. Fuzzy Approach to Supply Chain Management for E-Commerce Store. Appl. Eng. Lett. 2020, 5, 62–67. [Google Scholar] [CrossRef]
  53. Ignjatijević, S.; Aničić, A.; Vapa-Tankosić, J.; Belokapić-Čavkunović, J. Determining Relationship between Economic Growth and Environmental Protection. Oditor 2020, 6, 38–48. [Google Scholar] [CrossRef]
  54. Nella, A.; Christou, E. Market Segmentation for Wine Tourism: Identifying Sub-Groups of Winery Visitors. Eur. J. Tour. Res. 2021, 29, 2903. [Google Scholar]
  55. Duarte Alonso, A.; Bressan, A.; O’Shea, M.; Krajsic, V. Educating Winery Visitors and Consumers: An International Perspective. Curr. Issues Tour. 2014, 17, 539–556. [Google Scholar] [CrossRef]
  56. Balenović, I.; Ignjatijević, S.; Stojanović, G.; Vapa Tankosić, J.; Lekić, N.; Milutinović, O.; Gajić, A.; Ivaniš, M.; Bošković, J.; Prodanović, R.; et al. Factors Influencing Wine Purchasing by Generation Y and Older Cohorts on the Serbian Wine Market. Agriculture 2021, 11, 1054. [Google Scholar] [CrossRef]
  57. Bruwer, J.; Rueger-Muck, E. Wine Tourism and Hedonic Experience: A Motivation-Based Experiential View. Tour. Hosp. Res. 2019, 19, 488–502. [Google Scholar] [CrossRef]
  58. Radović, N.; Milićević, S. The Examination and Assessment of Winery Business and Contribution to the Development of Wine Tourism of Serbia. Ekon. Poljopr. 2020, 67, 1103–1123. [Google Scholar] [CrossRef]
  59. Štetić, S.; Cvijanović, D.; Šimičević, D. Posebni Oblici Turizma Dunavskog Regiona Srbije: Monografija; Institut za ekonomiku poljoprivrede Beograd: Beograd, Serbia, 2014. [Google Scholar]
  60. Grubor, A.; Leković, K.; Tomić, S. Rural Tourism Marketing of the Danube Region. Ekonomika 2019, 65, 1–9. [Google Scholar] [CrossRef] [Green Version]
  61. Santos, M.; Richman, V.; Hu, A. Financial Impact of High Land Prices on the Viability of Winery Startup Projects. Int. J. Wine Bus. Res. 2021. [Google Scholar] [CrossRef]
  62. Oczkowski, E. Identifying the Effects of Objective and Subjective Quality on Wine Prices. J. Wine Econ. 2016, 11, 249–260. [Google Scholar] [CrossRef]
  63. Chevet, J.-M.; Lecocq, S.; Visser, M. Climate, Grapevine Phenology, Wine Production, and Prices: Pauillac (1800–2009). Am. Econ. Rev. 2011, 101, 142–146. [Google Scholar] [CrossRef] [Green Version]
  64. Ashenfelter, O.; Storchmann, K. Climate Change and Wine: A Review of the Economic Implications. J. Wine Econ. 2016, 11, 105–138. [Google Scholar] [CrossRef]
  65. Ashenfelter, O. The Hedonic Approach to Vineyard Site Selection: Adaptation to Climate Change and Grape Growing in Emerging Markets. J. Wine Econ. 2017, 12, 3–15. [Google Scholar] [CrossRef] [Green Version]
  66. Gergaud, O.; Ginsburgh, V. Natural Endowments, Production Technologies and the Quality of Wines in Bordeaux. Does Terroir Matter? Econ. J. 2008, 118, F142–F157. [Google Scholar] [CrossRef]
  67. Cross, R.; Plantinga, A.J.; Stavins, R.N. The Value of Terroir: Hedonic Estimation of Vineyard Sale Prices. J. Wine Econ. 2011, 6, 1–14. [Google Scholar] [CrossRef] [Green Version]
  68. Cardebat, J.-M.; Figuet, J.-M.; Paroissien, E. Expert Opinion and Bordeaux Wine Prices: An Attempt to Correct Biases in Subjective Judgments. J. Wine Econ. 2014, 9, 282–303. [Google Scholar] [CrossRef]
  69. Outreville, J.F. Les facteurs déterminant le prix du vin. Les Facteurs Déterminant Le Prix Du Vin 2010, 25–33. [Google Scholar] [CrossRef]
  70. Combris, P.; Lecocq, S.; Visser, M. Estimation of a Hedonic Price Equation for Bordeaux Wine: Does Quality Matter. In World Scientific Handbook in Financial Economics Series; World Scientific: Singapore, 2018; Volume 1, pp. 167–183. [Google Scholar]
  71. Gonçalves, T.; Rebelo, J.; Lourenço-Gomes, L.; Caldas, J. Wine Price Determinants. Is There a Homogeneous International Standard? Wine Econ. Policy 2021, 10, 33–55. [Google Scholar] [CrossRef]
  72. Ashton, R.H. Is There Consensus Among Wine Quality Ratings of Prominent Critics? An Empirical Analysis of Red Bordeaux, 2004–2010. J. Wine Econ. 2013, 8, 225–234. [Google Scholar] [CrossRef]
  73. Caldas, J.; Rebelo, J. Portuguese Wine Ratings: An Old Product a New Assessment. Wine Econ. Policy 2013, 2, 102–110. [Google Scholar] [CrossRef] [Green Version]
  74. Ali, H.H.; Lecocq, S.; Visser, M. The Impact of Gurus: Parker Grades and En Primeur Wine Prices. J. Wine Econ. 2010, 5, 22–39. [Google Scholar] [CrossRef] [Green Version]
  75. Poveda, A.M.; Pérez, M.R.; Mollá-Bauza, M.M.B.; Martínez, L.M.-C. Determination of the Surplus That Consumers Are Willing to Pay for an Organic Wine. Span. J. Agric. Res. 2005, 3, 43–51. [Google Scholar]
  76. Sogari, G.; Mora, C.; Menozzi, D. Sustainable Wine Labeling: A Framework for Definition and Consumers’ Perception. Agric. Agric. Sci. Procedia 2016, 8, 58–64. [Google Scholar] [CrossRef] [Green Version]
  77. D’Amico, M.; Di Vita, G.; Monaco, L. Exploring Environmental Consciousness and Consumer Preferences for Organic Wines without Sulfites. J. Clean. Prod. 2016, 120, 64–71. [Google Scholar] [CrossRef]
  78. Vapa-Tankosić, J.; Ignjatijević, S.; Kranjac, M.; Lekić, S.; Prodanović, R. Willingness to Pay for Organic Products on the Serbian Market. Int. Food Agribus. Manag. Rev. 2018, 21, 791–801. [Google Scholar] [CrossRef]
  79. Schäufele, I.; Hamm, U. Consumers’ Perceptions, Preferences and Willingness-to-Pay for Wine with Sustainability Characteristics: A Review. J. Clean. Prod. 2017, 147, 379–394. [Google Scholar] [CrossRef]
  80. Pomarici, E.; Amato, M.; Vecchio, R. Environmental Friendly Wines: A Consumer Segmentation Study. Agric. Agric. Sci. Procedia 2016, 8, 534–541. [Google Scholar] [CrossRef] [Green Version]
  81. Puvača, N.; Bursić, V.; Petrović, A.; Vuković, G.; Cara, M.; Peulić, T.; Avantaggiato, G. Mycotoxin Incidence of Ochratoxin A in Wine and Methods for Its Control. J. Agron. Technol. Eng. Manag. 2020, 3, 475–482. [Google Scholar]
  82. Rojas-Méndez, J.I.; Le Nestour, M.; Rod, M. Understanding Attitude and Behavior of Canadian Consumers Toward Organic Wine. J. Food Prod. Mark. 2015, 21, 375–396. [Google Scholar] [CrossRef]
  83. Maesano, G.; Di Vita, G.; Chinnici, G.; Gioacchino, P.; D’Amico, M. What’s in Organic Wine Consumer Mind? A Review on Purchasing Drivers of Organic Wines. Wine Econ. Policy 2021, 10, 3–21. [Google Scholar] [CrossRef]
  84. Bernabéu, R.; Brugarolas, M.; Martínez-Carrasco, L.; Díaz, M. Wine Origin and Organic Elaboration, Differentiating Strategies in Traditional Producing Countries. Br. Food J. 2008, 110, 174–188. [Google Scholar] [CrossRef]
  85. Loureiro, M.L. Rethinking New Wines: Implications of Local and Environmentally Friendly Labels. Food Policy 2003, 28, 547–560. [Google Scholar] [CrossRef]
  86. Dressler, M.; Paunovic, I. A Typology of Winery SME Brand Strategies with Implications for Sustainability Communication and Co-Creation. Sustainability 2021, 13, 805. [Google Scholar] [CrossRef]
  87. Silva, A.C.O.; Santana, E.F.; Saraiva, A.M.; Coutinho, F.N.; Castro, R.H.A.; Pisciottano, M.N.C.; Amorim, E.L.C.; Albuquerque, U.P. Which Approach Is More Effective in the Selection of Plants with Antimicrobial Activity? Evid.-Based Complementary Altern. Med. 2013, 2013, 1–10. [Google Scholar] [CrossRef]
  88. Lalicic, L. Open Innovation Platforms in Tourism: How Do Stakeholders Engage and Reach Consensus? Int. J. Contemp. Hosp. Manag. 2018, 30, 2517–2536. [Google Scholar] [CrossRef]
  89. Broccardo, L.; Zicari, A. Sustainability as a Driver for Value Creation: A Business Model Analysis of Small and Medium Entreprises in the Italian Wine Sector. J. Clean. Prod. 2020, 259, 120852. [Google Scholar] [CrossRef]
  90. Annunziata, E.; Pucci, T.; Frey, M.; Zanni, L. The Role of Organizational Capabilities in Attaining Corporate Sustainability Practices and Economic Performance: Evidence from Italian Wine Industry. J. Clean. Prod. 2018, 171, 1300–1311. [Google Scholar] [CrossRef]
  91. Barba-Sánchez, V.; Atienza-Sahuquillo, C. Environmental Proactivity and Environmental and Economic Performance: Evidence from the Winery Sector. Sustainability 2016, 8, 1014. [Google Scholar] [CrossRef] [Green Version]
  92. Buysse, K.; Verbeke, A. Proactive Environmental Strategies: A Stakeholder Management Perspective. Strateg. Manag. J. 2003, 24, 453–470. [Google Scholar] [CrossRef]
  93. Banerjee, S.B.; Iyer, E.S.; Kashyap, R.K. Corporate Environmentalism: Antecedents and Influence of Industry Type. J. Mark. 2003, 67, 106–122. [Google Scholar] [CrossRef]
  94. Zeng, S.; Qin, Y.; Zeng, G. Impact of Corporate Environmental Responsibility on Investment Efficiency: The Moderating Roles of the Institutional Environment and Consumer Environmental Awareness. Sustainability 2019, 11, 4512. [Google Scholar] [CrossRef] [Green Version]
  95. Li, D.; Cao, C.; Zhang, L.; Chen, X.; Ren, S.; Zhao, Y. Effects of Corporate Environmental Responsibility on Financial Performance: The Moderating Role of Government Regulation and Organizational Slack. J. Clean. Prod. 2017, 166, 1323–1334. [Google Scholar] [CrossRef]
  96. Lee, K.-H. Does Size Matter? Evaluating Corporate Environmental Disclosure in the Australian Mining and Metal Industry: A Combined Approach of Quantity and Quality Measurement: Australian Corporate Environmental Disclosure in Mining Sector. Bus. Strat. Environ. 2017, 26, 209–223. [Google Scholar] [CrossRef]
  97. Knight, H.; Megicks, P.; Agarwal, S.; Leenders, M.A.A.M. Firm Resources and the Development of Environmental Sustainability among Small and Medium-Sized Enterprises: Evidence from the Australian Wine Industry. Bus. Strat. Environ. 2019, 28, 25–39. [Google Scholar] [CrossRef]
  98. Nazzaro, C.; Stanco, M.; Marotta, G. The Life Cycle of Corporate Social Responsibility in Agri-Food: Value Creation Models. Sustainability 2020, 12, 1287. [Google Scholar] [CrossRef] [Green Version]
  99. Richardson, A.J.; Welker, M. Social Disclosure, Financial Disclosure and the Cost of Equity Capital. Account. Organ. Soc. 2001, 26, 597–616. [Google Scholar] [CrossRef]
  100. Ko, W.W.; Liu, G. Environmental Strategy and Competitive Advantage: The Role of Small- and Medium-Sized Enterprises’ Dynamic Capabilities. Bus. Strat. Environ. 2017, 26, 584–596. [Google Scholar] [CrossRef] [Green Version]
  101. Barber, N. “Green” Wine Packaging: Targeting Environmental Consumers. Int. J. Wine Bus. Res. 2010, 22, 423–444. [Google Scholar] [CrossRef]
  102. Ginon, E.; Ares, G.; dos Santos Laboissière, L.H.E.; Brouard, J.; Issanchou, S.; Deliza, R. Corrigendum to Logos Indicating Environmental Sustainability in Wine Production: An Exploratory Study on How Do Burgundy Wine Consumers Perceive Them. Food Res. Int. 2014, 66, 515. [Google Scholar] [CrossRef]
  103. Mladenović, M.; Nemoda, S.; Paprika, M.; Marinković, A.; Repić, B. Analysis of Prescriped Limits of NOx Emissions from Biomass Combustion in Selected European Countries and in Serbia. Contemporary Agricultural Engineering. Contemp. Agric. Eng. 2016, 24, 187–244. [Google Scholar] [CrossRef]
  104. Nikolić, K.; Savić, N.; Nikolić, Z. The Importance of Integral Protection of Plants in Preservation of Soil. Soil Plant 2005, 54, 125–131. [Google Scholar]
  105. Marković, M. Organic Agriculture as a Form of Sustainable Agricultural Development of Serbia. Econ. Sustain. Dev. 2018, 2, 29–36. [Google Scholar]
  106. Zimonja-Kaljević, I.; Petrović, N.; Vukadinović, J. Organic Production in the European Union and Serbia. Foreign Leg. Life 2012, 1, 228–238. [Google Scholar]
  107. Milić, T. The Rise of Corporate Environmental Responsibility in Serbian Economy: The Case of Agri-Food Industry. Ekon. Poljopr. 2021, 68, 945–959. [Google Scholar] [CrossRef]
  108. Malarvizhi, P.; Matta, R. Link between Corporate Environmental Disclosure and Firm Performance—Perception or Reality? Rev. Integr. Bus. Econ. Res. 2016, 5, 107–117. [Google Scholar]
  109. Palenberg, M.; Reinicke, W.; Witte, M. Trends in Non-Financial Reporting Programme, Division of Technology, Industry and Economics (DTIE); Global Public Policy Institute: Berlin, Germany, 2006; pp. 1–50. [Google Scholar]
  110. Campbell, D. A Longitudinal and Cross-Sectional Analysis of Environmental Disclosure in UK Companies—A Research Note. Br. Account. Rev. 2004, 36, 107–117. [Google Scholar] [CrossRef]
  111. Chaklader, B.; Gulati, P.A. A Study of Corporate Environmental Disclosure Practices of Companies Doing Business in India. Glob. Bus. Rev. 2015, 16, 321–335. [Google Scholar] [CrossRef]
  112. Molina-Azorín, J.F.; Claver-Cortés, E.; López-Gamero, M.D.; Tarí, J.J. Green Management and Financial Performance: A Literature Review. Manag. Decis. 2009, 47, 1080–1100. [Google Scholar] [CrossRef]
  113. Higgins, C.; Coffey, B. Improving How Sustainability Reports Drive Change: A Critical Discourse Analysis. J. Clean. Prod. 2016, 136, 18–29. [Google Scholar] [CrossRef]
  114. Stevanović, T.; Petrović-Ranđelović, M. Balanced Scorecard Održivosti i Analiza Eko-Efikasnosti. Facta Univ. Ser. Econ. Organ. 2012, 9, 257–270. [Google Scholar]
  115. Gray, R.; Javad, M.; Power, D.M.; Sinclair, C.D. Social and Environmental Disclosure and Corporate Characteristics: A Research Note and Extension. J. Bus. Financ. Account. 2001, 28, 327–356. [Google Scholar] [CrossRef]
  116. Stevanović, S.; Jovanović, O.; Hanić, A. Environmental and Financial Performance: Review of Selected Studies. Econ. Anal. 2019, 52, 113–127. [Google Scholar]
  117. Singh, G.; Joshi, M. Environment Management and Disclosure Practices of Indian Companies. Int. J. Bus. Res. 2009, 9, 116–128. [Google Scholar]
  118. Pahuja, S. Relationship between Environmental Disclosures and Corporate Characteristics: A Study of Large Manufacturing Companies in India. Soc. Responsib. J. 2009, 5, 227–244. [Google Scholar] [CrossRef]
  119. Stanwick, S.D.; Stanwick, P.A. The Relationship between Environmental Disclosures and Financial Performance: An Empirical Study of US Firms. Eco-Manag. Audit. 2000, 7, 155–164. [Google Scholar] [CrossRef]
  120. Abdul Rahman, S.A.; Yusoff, R.; Wan Mohamed, W.N. Environmental Disclosure and Financial Performance: An Empirical Study of Malaysia, Thailand and Singapore; Social Science Research Network: Rochester, NY, USA, 2010. [Google Scholar]
  121. Hanić, A.; Jovanović, O.; Stevanović, S. Environmental Disclosure Practice in the Serbian Banking Sector. Management 2021, 26, 115–144. [Google Scholar] [CrossRef]
  122. Mijatovic, I.; Maricic, M.; Horvat, A. The Factors Affecting the Environmental Practices of Companies: The Case of Serbia. Sustainability 2019, 11, 5960. [Google Scholar] [CrossRef] [Green Version]
  123. Stern, P. Toward a Coherent Theory of Environmentally Significant Behavior. J. Soc. Issues 2000, 56, 407–424. [Google Scholar] [CrossRef]
  124. Flannery, B.L.; May, D.R. Environmental Ethical Decision Making in the U.S. Metal-Finishing Industry. Acad. Manag. J. 2000, 43, 642–662. [Google Scholar] [CrossRef] [Green Version]
  125. Bansal, P.; Roth, K. Why Companies Go Green: A Model of Ecological Responsiveness. Acad. Manag. J. 2000, 43, 717–736. [Google Scholar] [CrossRef]
  126. González-Benito, J.; González-Benito, Ó. A Study of the Motivations for the Environmental Transformation of Companies. Ind. Mark. Manag. 2005, 34, 462–475. [Google Scholar] [CrossRef]
  127. Anderson, L.M.; Bateman, T.S. Individual Environmental Initiative: Championing Natural Environmental Issues in U.S. Business Organizations. Acad. Manag. J. 2000, 43, 548–570. [Google Scholar] [CrossRef]
  128. Egri, C.P.; Herman, S. Leadership in the North American Environmental Sector: Values, Leadership Styles, and Contexts of Environmental Leaders and Their Organizations. Acad. Manag. J. 2000, 43, 571–604. [Google Scholar] [CrossRef]
  129. Sharma, S. Managerial Interpretations and Organizational Context as Predictors of Corporate Choice of Environmental Strategy. Acad. Manag. J. 2000, 43, 681–697. [Google Scholar] [CrossRef]
  130. Gifford, R.; Sussman, R. Environmental Attitudes; Oxford University Press: Oxford, UK, 2012. [Google Scholar]
  131. Papagiannakis, G.; Lioukas, S. Values, Attitudes and Perceptions of Managers as Predictors of Corporate Environmental Responsiveness. J. Environ. Manag. 2012, 100, 41–51. [Google Scholar] [CrossRef]
  132. Ferrell, O.C.; Johnston, M.W.; Ferrell, L. A Framework for Personal Selling and Sales Management Ethical Decision Making. J. Pers. Sell. Sales Manag. 2007, 27, 291–299. [Google Scholar] [CrossRef]
  133. Sparks, J.R.; Pan, Y. Ethical Judgments in Business Ethics Research: Definition, and Research Agenda. J. Bus. Ethics 2010, 91, 405–418. [Google Scholar] [CrossRef]
  134. Marshall, R.S.; Cordano, M.; Silverman, M. Exploring Individual and Institutional Drivers of Proactive Environmentalism in the US Wine Industry. Bus. Strat. Environ. 2005, 14, 92–109. [Google Scholar] [CrossRef]
  135. Gabzdylova, B.; Raffensperger, J.F.; Castka, P. Sustainability in the New Zealand Wine Industry: Drivers, Stakeholders and Practices. J. Clean. Prod. 2009, 17, 992–998. [Google Scholar] [CrossRef]
  136. Singh, N.; NaveenKumar, S.K.; Geethika, M.; Mugesh, G. A Cerium Vanadate Nanozyme with Specific Superoxide Dismutase Activity Regulates Mitochondrial Function and ATP Synthesis in Neuronal Cells. Angew. Chem. Int. Ed. 2020, anie.202011711. [Google Scholar] [CrossRef]
  137. Oliva, F.L.; Semensato, B.I.; Prioste, D.B.; Winandy, E.J.L.; Bution, J.L.; Couto, M.H.G.; Bottacin, M.A.; Mac Lennan, M.L.F.; Teberga, P.M.F.; Santos, R.F.; et al. Innovation in the Main Brazilian Business Sectors: Characteristics, Types and Comparison of Innovation. J. Knowl. Manag. 2019, 23, 135–175. [Google Scholar] [CrossRef]
  138. Dubey, R.; Gunasekaran, A.; Ali, S.S. Exploring the Relationship between Leadership, Operational Practices, Institutional Pressures and Environmental Performance: A Framework for Green Supply Chain. Int. J. Prod. Econ. 2015, 160, 120–132. [Google Scholar] [CrossRef]
  139. Šarković, A.; Cvejić, S.; Bogdanov, N. The Environmental Awareness of Agricultural Producers in Serbia: Attitudes And Practices. Teme Časopis Za Društvene Nauk. 2016, 40, 729–745. [Google Scholar]
  140. Aminrad, Z.; Zakariya, S.; Hadi, A.; Sakari, M. Relationship Between Awareness, Knowledge and Attitudes Towards Environmental Education Among Secondary School Students in Malaysia. World Appl. Sci. J. 2013, 22, 1326–1333. [Google Scholar] [CrossRef]
  141. The Total Number of Registered Wineries in the Republic of Serbia in 2020. Available online: https://www.minpolj.gov.rs/vinarski-registar (accessed on 3 December 2021).
  142. Pivac, T.; Maksimović, M.; Blešić, I. The Importance of Digital Marketing for Wineries and Development of Wine Tourism: Case Study Of Serbia. In 5th International Thematic Monograph: Modern Management Tools and Economy of Tourism Sector in Present Era; Association of Economists and Managers of the Balkans: Beogard, Serbia, 2020; pp. 241–251. [Google Scholar] [CrossRef]
  143. Sarstedt, M.; Ringle, C.M.; Hair, J.F. Partial Least Squares Structural Equation Modeling. In Handbook of Market Research; Homburg, C., Klarmann, M., Vomberg, A., Eds.; Springer International Publishing: Cham, Switzerland, 2017; pp. 1–40. [Google Scholar]
  144. Hair, J.F.; Sarstedt, M.; Hopkins, L.; Kuppelwieser, V.G. Partial Least Squares Structural Equation Modeling (PLS-SEM): An Emerging Tool in Business Research. Eur. Bus. Rev. 2014, 26, 106–121. [Google Scholar] [CrossRef]
  145. Hair, J.; Hollingsworth, C.L.; Randolph, A.B.; Chong, A.Y.L. An Updated and Expanded Assessment of PLS-SEM in Information Systems Research. Ind. Manag. Data Syst. 2017, 117, 442–458. [Google Scholar] [CrossRef]
  146. Hair, J.F.; Risher, J.J.; Sarstedt, M.; Ringle, C.M. When to Use and How to Report the Results of PLS-SEM. Eur. Bus. Rev. 2019, 31, 2–24. [Google Scholar] [CrossRef]
  147. Barclay, D.; Higgins, C.; Thompson, R. The Partial Least Squares (PLS) Approach to Causal Modeling: Personal Computer Adoption and Use as an Illustration. Technol. Stud. 1995, 2, 285–309. [Google Scholar]
  148. Cvijanović, D.; Ignjatijević, S.; Tankosić, J.V.; Cvijanović, V. Do Local Food Products Contribute to Sustainable Economic Development? Sustainability 2020, 12, 2847. [Google Scholar] [CrossRef] [Green Version]
  149. Vapa-Tankosić, J.; Ignjatijević, S.; Kiurski, J.; Milenković, J.; Milojević, I. Analysis of Consumers’ Willingness to Pay for Organic and Local Honey in Serbia. Sustainability 2020, 12, 4686. [Google Scholar] [CrossRef]
  150. Nazzaro, C.; Lerro, M.; Stanco, M.; Marotta, G. Do Consumers like Food Product Innovation? An Analysis of Willingness to Pay for Innovative Food Attributes. Br. Food J. 2019, 121, 1413–1427. [Google Scholar] [CrossRef]
  151. Al-Tuwaijri, S.A.; Christensen, T.E.; Hughes, K. The Relations among Environmental Disclosure, Environmental Performance, and Economic Performance: A Simultaneous Equations Approach. Account. Organ. Soc. 2004, 29, 447–471. [Google Scholar] [CrossRef]
  152. Dressler, M.; Paunovic, I. Not All Wine Businesses Are the Same: Examining the Impact of Winery Business Model Extensions on the Size of Its Core Business. Sustainability 2021, 13, 10117. [Google Scholar] [CrossRef]
  153. Akbar, A.; Ali, S.; Ahmad, M.A.; Akbar, M.; Danish, M. Understanding the Antecedents of Organic Food Consumption in Pakistan: Moderating Role of Food Neophobia. Int. J. Environ. Res. Public Health 2019, 16, 4043. [Google Scholar] [CrossRef] [Green Version]
  154. Kock, N. WarpPLS 5.0 User Manual. Available online: https://www.warppls.com/ (accessed on 3 December 2021).
  155. Gemmrich, A.; Arnold, R. Sustainable Winegrowing, Is It Sustainable or Just Another Fad? —An International Overview. Ann. Agrar. Sci. 2007, 5, 87–90. [Google Scholar]
  156. Albertini, E. What We Know About Environmental Policy: An Inductive Typology of the Research: An Inductive Typology of the Environmental Policy Research. Bus. Strat. Environ. 2017, 26, 277–287. [Google Scholar] [CrossRef] [Green Version]
Figure 1. The research framework and hypotheses.
Agriculture 12 00239 g001
Figure 2. Complete final models.
Agriculture 12 00239 g002
Table 1. Presentation of values of standardized factor loads and results of analysis of reflective measurement model.
VariablePath CoefficientsCronbach αCRAVE
BPCreating successful wine brands—BP10.830 0.816 0.885 0.720
The success of premium brands offered at this winery—BP20.797
Brand equity (awareness and positive association) of this winery—BP30.914
SP Growth of domestic visitors to this winery—SP10.9030.9010.9250.674
Growth of visitors from Europe to this winery—SP20.897
Attracting high-income visitors to this winery—SP30.825
Rate of revisit (visitor loyalty) to this winery—SP40.733
Cellar door sales as a percentage of total sales—SP50.733
Expenditure of visitors at this winery—SP60.817
FP Revenue growth of this winery—FP10.7790.8550.8950.6322
Sales growth of this winery—FP20.731
Volume growth (liters) of this winery—FP30.877
Overall profitability of this winery—FP40.811
Average wine retail price of wines from this winery—FP50.768
IP Successful new product introductions—IP10.8370.7890.8750.700
Innovativeness of this winery—IP20.813
Responsiveness of this winery to consumer trends—IP30.860
ATT At our winery sustainable initiatives lead to cost savings—ATT10.8790.8600.8960.633
At our winery, people feel a personal obligation to do whatever they can to minimize environmental harm—ATT20.794
At our winery sust.initiatives lead to increased customer demand—ATT30.778
At our winery sustainable initiatives lead to enhanced reputation in the community—ATT40.723
At our winery sustainable initiatives are implemented completely voluntarily—ATT50.797
Table 2. Discriminant validity—Fornell–Larcker Criterion.
ATTBPEBEDFPIPSP
ATT0.796
BP0.3660.848
EB0.4590.3130.860
ED0.5600.7820.6820.721
FP0.2400.5570.3710.7100.795
IP−0.048−0.021−0.269−0.1680.0250.837
SP0.4250.3050.8580.7020.362−0.1350.821
Table 3. Heterotrait-Monotrait Ratio (HTMT).
ATTBPFPIP
BP0.358
FP0.3320.668
IP0.2660.2350.182
SP0.4550.3280.3930.226
Table 4. Values of the collinearity coefficient of inflation variance (VIF).
VariableVIFVariableVIF
At our winery, we ensure worker job satisfaction—EB12.528Our wine branding strategy stresses the benefits of sustainability—ED11.151
Our winery uses environmentally safe fertilizers—EB22.856Our wine brands address the relationship between the environment and our wine—ED21.623
Our winery does not use artificial preservatives—EB31.756Our wine brands are linked to an environmental cause—ED31.510
Table 5. Statistical analysis of formative measurement variables.
Outer WeightsStandard DeviationT-Valuep-Value
EB1 > EB0.9330.009103.7910.000
EB2 > EB0.8570.01270.4930.000
EB3 > EB0.8240.01555.6290.000
ED1 > ED0.8430.01085.4550.000
ED2 > ED0.7040.01546.3580.000
ED3 > ED0.7360.01259.0940.000
Table 6. Inner VIF values.
EBED
BP1.4781.478
FP1.5521.552
IP1.0261.026
SP1.1991.199
Table 7. Values of path coefficients in the model.
Direct PathTotal Indirect EffectSpecific Indirect EffectsTotal Effects
BP > EB0.026 0.026
FP > EB0.069 0.069
SP > EB0.803 0.803
IP > EB−0.162 −0.162
BP > ED0.489 0.489
FP > ED0.282 0.282
SP > ED0.436 0.436
IP > ED−0.106 −0.106
ATT > EB 0.375 0.375
ATT > ED 0.437 0.437
ATT > BP 0.366
ATT > FP 0.240
ATT > IP −0.048
ATT > SP 0.425
ATT > BP > EB 0.009
ATT > SP > EB 0.341
ATT > FP > EB 0.017
ATT > IP > EB 0.008
ATT > BP > ED 0.179
ATT > SP > ED 0.186
ATT > FP > ED 0.068
ATT > IP > ED 0.005
Table 8. Results of hypothesis testing using the PLS-SEM technique.
β Original Sample (O)Standard Deviation (STDEV)T Statistics (|O/STDEV|)p ValuesConfidence Interval
2.5–97.5%
Hypothesis Confirmation
H1: BP > EB0.0260.0191.3220.187−0.0160.063
H4: SP > EB0.8030.01078.2750.0000.7830.821+
H3: IP > EB−0.1620.01312.1610.000−0.186−0.134
H2: FP > EB0.0690.0135.4050.0000.0450.095+
H5: BP > ED0.4890.01337.6070.0000.4650.514+
H8: SP > ED0.4360.01043.7620.0000.4180.458+
H7: IP > ED−0.1060.00813.8290.000−0.121−0.092
H6: FP > ED0.2820.01420.7580.0000.2560.307+
ATT > BP0.3660.02713.4920.0000.3060.414+
ATT > FP0.2400.0376.5590.0000.1570.303+
ATT > IP−0.0480.0331.4300.153−0.1170.017
ATT > SP0.4250.02219.3910.0000.3820.471+
Publisher’s Note: MDPI stays neutral with regard to jurisdictional claims in published maps and institutional affiliations.

