Abstract
The main aim of this research was to evaluate the efficiency of the use of public financial support investment activities into selected dairy farms in Poland. The research targeted 207 farms that earned their living through milk production and benefited from the 2011–2014 European Union (EU) financial support for investments carried out under the “modernization of agricultural holdings” included in the Rural Development Programme (RDP 2007–2013). Two research hypotheses were developed for this work. The first research hypothesis, “the possibility of obtaining funding for an investment is a factor that determines its implementation”, was positively verified. This was mainly due to the size of the investments carried out in the research farms, where an average increase in fixed assets was recorded at the level of 90%. The econometric calculations were carried out indirectly from the declarations of the farmers themselves, who, during the research, excluded the possibility of carrying out investments without receiving external support. The second research hypothesis, “investments carried out in farms improved their economic situation”, was positively verified. This was shown with the calculated results of agricultural income in the research farms, which increased in the analyzed period from 66.5%, to 125%.
1. Introduction
Public support is a disruption, by the state institutions, of the economic system. The idea is to allocate, in any form, assistance to an entity or group of market entities, and the implementation of goals is set by the legislature (economic, social, environmental, etc.). The underlying public policy in agriculture and rural areas has the desire to stimulate, for example, income support, improve food security, increased competitiveness, multifunctional development, and the protection of the environment and the natural resources. Public support is, therefore, the result of the conviction that public institutions can determine who achieves market success better than the market itself and, therefore, have the right to intervene because of the differences between entities to achieve the previously assumed goal [1]. The investments help to improve efficiency and to reduce the lack of labor [2]. They also help in achieving the better sustainability of dairy farms [3].
Interventionism in the European Union (EU) consists of conducting a policy in the community that not only allows for harmonious change, but also allows for the development of the economies of the countries that make it up. Only then will economic growth and development be possible throughout the community. In connection with such assumptions, the European Union supports the economies of the community countries, as well as those striving for integration with the EU. Farms invest in machinery, milking systems, and other equipment [4]. This is done through the transfer of funding from European funds. These funds must be allocated by the candidate countries for the development and adjustment of individual industries and agriculture to the European Union (EU) standards. The European Union has a community budget. A characteristic feature of this budget is that it cannot be used as a macroeconomic policy tool that could fulfill regulatory functions for the budgets of the community countries. However, a feature of state budgets is the fact that an important role is, in fact, played by the budget deficit, and the properly conducted financial policy of the state towards it, through this deficit. The most important item in the EU budget on the expenditure side is agriculture. In the decade from 1960 to 1970, as much as 85% of the expenditure from the community budget was allocated to this sector of the economy. It is still a critical point, but the reforms carried out with greater or lesser success allowed for the reduction of budget expenditures in the following years.
Undoubtedly, the greatest benefits were sought for the Polish agriculture accession to the structures of the European Union. In the years between 2000 and 2006, the European Union allocated almost half of its budget to the Common Agricultural Policy (CAP), spending EUR 300 billion for this purpose [5]. Polish farmers reached for financial resources for the restructuring of their farms. The first aid measure addressed to Polish farmers was the Special Accession Program for Agriculture and Rural Development (SAPARD), Across Poland, 12.36 thousand farmers benefited from it, who received the amount of PLN 563.6 million for the restructuring of their farms [6]. Another possibility of using financial support for investments in agricultural holdings appeared in the Sectoral Operational Program (SOP), “Agriculture”, for the years between 2004 and 2006. In the measure “investments in agricultural holdings”, 42.5 thousand applications were submitted. Applications and aid to the amount of PLN 1.84 billion was paid, which, in comparison to Special Accession Programme for Agriculture and Rural Development (SAPARD), showed an increase of over 300% [7].
The interest in obtaining support from the EU has grown to such an extent that there are more applicants than funds in the budget. This, in turn, meant that the Agency for Restructuring and Modernisation of Agriculture (ARMA) (the entity responsible for the distribution of aid funds for Polish agriculture) began to introduce the granting of aid based on previously assumed indicators. The criteria for assessing applications could be the farmer’s age, education, the farm size, or the level of milk production. Additionally, in the case of the aid measure, the “modernization of farms”, a higher priority was introduced for farms keeping dairy cattle, where these farms could apply for aid first. On the other hand, farmers involved in rearing and breeding other species of animals or plant production had the opportunity to apply for aid in the second call for proposals (provided that the first “dairy” call did not exhaust the entire pool of funds). It can, therefore, be concluded that the selection criteria themselves had a kind of preselection of the submitted applications for granting financial support. Their next verification, in terms of the legitimacy of granting financial aid, was the so-called economic and technical assessment carried out by the Agency for Restructuring and Modernisation of Agriculture (ARMA) employees.
World milk production is increasing and is stimulated by an increase in demand, dietary changes, and enterprises that supply farms with factors of production, feed, modern machines, and services [8]. Dairy producers are faced with increasing competition from producers at home and abroad. In an ever-changing global environment, milk producers must be prepared to seize opportunities and accept new technologies to remain competitive [9,10]. To cope with the increasing competition, milk producers must make the necessary investments to increase production and increase their standard. Investments improve the technical efficiency of dairy farms and generate income [11].
Therefore, it is reasonable to evaluate this process and estimate the effectiveness of the public support directed there.
The main aim of the research is to evaluate the public financial support for investment activities carried out in selected farms in the Podlaskie Voivodeship in Poland.
The specific goals are:
- The evaluation of investment change subsidies in the investment of dairy farms in the European Union countries;
- The assessment of the diversification of production, costs, and income of dairy farms, depending on the value of financial support in selected dairy farms in Podlaskie Voivodeship;
- The recognition of factors influencing the income of dairy farms benefiting from public financial support for investments in selected dairy farms in the Podlaskie Voivodship.
Additionally, the authors wanted to address following questions:
- What are the changes in investments in dairy farms in the European Union (EU)?
- How have the investments in Polish dairy farms changed?
- Has the public support had an impact on the economic results of dairy farms?
We have used different methods to achieve these goals. The multiple regression analysis was used to check the impact of selected factors on the efficiency of dairy farms in Poland.
The paper is organized as follows. Section 1 characterizes the efficiency and meaning of public aid. In Section 2, the methodology is explained. Then, we present the results of the analysis. The final section is the discussion and conclusion.
1.1. Efficiency and Its Kinds
While studying the literature, we came across various definitions of efficiency. The first association with the word usually relates to an analysis of whether the best results for a given action were achieved with the lowest possible expenditure [12]. Thus, efficiency should appear to us as the obvious fruit of praxeology; that is, an efficient operation or, as Kotarbiński says, good work [13]. Rutkowska [14] undertook an attempt to comprehensively investigate this concept. From its development, in the foreground is the statement by Samuelson and Nordhaus [15] where efficiency can be the main objective of economics. The concept of efficiency is also presented by Bórawski and Ogonowski [16], who present it in the most common terms:
- -
- Traditional, as the ratio of inputs to effects;
- -
- Resource, as the most optimal allocation of resources;
- -
- Strategic and organizational, as a general assessment of the company’s activities, considering all the elements affecting the effectiveness of its activities.
Efficiency researchers, apart from the multitude of definitions developed, also indicated many categories of efficiency, such as the below:
- -
- Organizational effectiveness, defined as the company’s strategic ability to adapt to changes in the environment in an ongoing basis, as well as the company’s abilty to productively use its resources to implement the adopted structure of goals [17];
- -
- Technical efficiency, understood as the maximization of the level of production with the best use of the resources available to carry it out [18]. It consists of searching for the best, most efficient techniques and technologies available for the implementation of production;
- -
- Economic efficiency, which consists of allocation efficiency (the optimal allocation of resources tending to the Pareto optimum), scale efficiency (which comes down to finding the production scale at which costs are the lowest), and price efficiency (the ability to achieve better conditions within the scope of the acquisition of inputs and the sales of products) [17].
It is also worth mentioning the efficiency of the organization, which consists of its operational and strategic aspects. Efficiency, in the operational sense, is the implementation of the same concept of business operation in a much better way than the competition. Optimal strategic efficiency consists of searching for a different concept of operation and distinguishing a given enterprise from the competition [17].
The efficiency of farming in agriculture, which is, in fact, one of the main methods of assessing the functioning of farms, was defined by Jóźwiak [19] as the relation of effects to the means used of agricultural land and its individual components obtained per one ha of agricultural land [20].
Correct investment decisions increase profits and increase the company’s value, but wrong decisions most often reduce profits, lower the company’s value, and even, as a last resort, lead to its bankruptcy. Hence, it is important to understand and apply appropriate measures to assess the profitability of planned investment projects [21].
1.2. Public Help and Its Meaning for the Development of Farms
The best functioning of the market is ensured by free competition and the strong economic individualism of the individual. The role of the state is limited to the guardianship of civil liberties [22].
The answer to the economic problems of that time was the doctrine of “Keynesianism”, which assumed state intervention in the economy. John Maynard Keynes, the creator of the doctrine, in his work “the general theory of employment, interest, and money” called for an increase in public spending to stimulate economic growth [23].
The presence of the state in the modern economy, both in the form of financial or legal and administrative involvement, is justified by the presence of so-called market failure [8]. Market failure means a situation in which the market does not effectively perform its basic Pareto allocation function. Optimum Pareto is a criterion that allows the evaluation of the effectiveness of a given solution [24]. According to Łącka and Worobjow [25], the market reliability consists of the following reasons:
- -
- No perfect competition in the markets and no attempts to monopolize or oligopolize them by producers;
- -
- Disputes between capital owners and the workforce over working and pay conditions;
- -
- The emergence of long-term mass unemployment;
- -
- The lack of interest in the fate of sick, old, and excluded people (unemployed, addicted, etc.);
- -
- The occurrence of negative externalities accompanying economic processes, such as environmental contamination, the excessive exploitation of natural resources, crime, noise, and the deterioration in the quality of life;
- -
- The improper allocation of scarce and limited resources;
- -
- No profit-transferring goods on the market;
- -
- An unequal access to information of economic entities (information asymmetry);
- -
- The lack of future goods and the reluctance of producers to make high-risk decisions;
- -
- The existence of certain social preferences in relation to production and consumption and the use of resources for socially undesirable goods.
The basic tools of the government influence on the economic situation in the country includes fiscal and monetary policies. If the government wants economic stimulation, employment, and consumption growth, then it conducts an expansionary fiscal policy, where taxes are low and state spending is high. This, however, is related to an increase in inflation, that is, a decrease in the purchasing power of money, which may lead to the impoverishment of the society if the increase in wages does not keep up with the increase in prices. The restrictive policy of the state, consisting of raising taxes and limiting government spending, is a model that is completely different from the one illustrated above. The consequence of such decisions is a slower increase in prices and also a reduction in production and an increase in unemployment. Monetary policies offer analogous possibilities of exerting an influence on the economy.
Environmental contamination, the over-exploitation of natural resources, crime, noise, and the deterioration in the quality of life are examples of the so-called negative externalities accompanying economic processes. The role of the state is to eliminate their occurrence or minimize the effects of their impact. The range of instruments used by the state is wide and includes, among others, legal actions, prohibitions on conducting specific types of activities, the application of penalties, additional taxes, emission limits to reduce the size of the contamination, and direct financial support for entities that prevent the occurrence of negative externalities [15].
The above-mentioned examples of market inefficiencies and the methods of eliminating them by the state will not always prove to be a rational and effective solution. Economists [26] recommend that before starting state interventions, it should be estimated as to what extent it will be more effective than the market mechanism. As with the market, the state and the public sector may turn out to be inefficient and unreliable. This is especially true in young democracies. The representatives of power act to achieve their own goals or to increase the scope of their power, prestige, or influence on decisions. Then, the costs of state intervention significantly exceed the losses resulting from market failure [27].
The issue of state intervention and state aid divided economists many years ago, and this division continues today [28]. The supporters of interventionism believe that it is necessary because the policy of influencing the demand stimulates development and stabilizes the economy. A different position is presented by the supporters of liberalism and the classical school of economics. According to them, the role of the state should be only to create good laws for the functioning of the market economy. More radical economists even believe that, in the long term, the market economy is stable and state intervention is unnecessary, or even harmful [29].
Receiving support for investment suggests that it is extremely profitable for the beneficiaries of such aid. It can be concluded that the level of support received is the investor’s profit, which results in smaller amounts of the farm’s own funds being used for the improvement. No research has been completed examining the effectiveness of investment support in agriculture. The current research provides an original research approach to the impact of EU funds on the effectiveness of investments carried out on farms. The results will determine in which cases the financing was most effective. This paper shows how the received investment support affects not only agricultural income, but also how agricultural income is correlated with other economic indicators of a farm. Two hypotheses were, therefore, developed.
Hypothesis 1 (H1).
The possibility of obtaining financing for an investment is a factor that determines its implementation.
Hypothesis 2 (H2).
Investments made in farms improve their economic situation.
2. Materials and Methods
2.1. Data Information
The subject of the research was investments carried out under the Rural Development Programme (RDP) between 2007 and 2013. Both primary and secondary sources of information were used to carry out the research. These sources of information included data from the Farm Accountancy Data Network system (FADN), the Agency for Restructuring and Modernisation of Agriculture (ARMA) data, literature studies on the subject, legal acts, public statistics data for the years between 2004 and 2018, Eurostat, literature reviews, textbooks, encyclopedias, dictionaries, and the Internet. The primary sources of information were surveys among milk producers carried out in 2019 regarding opinions on investments, and surveys among milk producers regarding the organization and economic results of farms. In the paper, a review of Polish and foreign literature on the subject, as well as legal acts in the field of the research subject matter, was made [30].
The selection of exogenous (independent) variables was made based on the possibility of their substantive justification and their impact on the value of income. From the set of exogenous variables, those that were strongly correlated with each other were removed. Finally, the model retained those variables that had a statistically significant impact on the dependent variables.
In dairy farms where investments were made, the following endogenous (explained) variables were adopted:
- Y2: Family farm income;
- Y2: Family farm income per one hectare of arable land;
- Y3: Family farm income per fulltime employee.
The set of independent (exogenous) variables were the factors describing the research farms (X1–X9 variables):
- X1: Value of fixed assets;
- X2: Ha of farmland;
- X3: Direct and general economic costs;
- X4: Number of people employed;
- X5: Amount of paid investment and co-financing;
- X6: Investment value;
- X7: Number of cows;
- X8: Total value of assets;
- X9: Equity (total assets: short-term and long-term liabilities).
The first research group included 207 dairy farms in the Podlaskie voivodeship, which had new investments and received public financial support. The largest milk processing plants in Poland (Mlekpol, Mlekovita, and Piątnica) are in Podlaskie Voivodeship. Podlaskie Voivodeship is characterized by the highest cattle concentration index in Poland, which is 94 head/100 ha. Moreover, one-third of the total amount of milk produced in Poland comes from breeders in Podlaskie Voivodeship. Therefore, the area of Podlaskie Voivodeship should be the best testing ground for determining the efficiency of public support for investment activities in the modernization of dairy farms.
The area of direct interest in the considerations and research carried outis the Podlaskie Voivodeship in Poland. The spatial scope of the research covers the dairy farms benefiting from EU support for investments in the Podlaskie Voivodeship. The average number of cows in the farms was 56 heads and the milk yield was 7292 L per cow. The farms focused on, predominantly, dairy production. They also had crops but used most of the crops for the dairy production as fodder. In the commodity structure of agricultural production, milk production was, on average, over 60%.
The dairy industry thrives in the Podlaskie Voivodeship. It is an area very rich in permanent grasslands, which delivers fodder used for cow feeding. There are 41 cows for every 100 ha of the voivodship, which is the largest number in Poland. The industry is developing rapidly, thanks to huge investments in the modernization of the machine parts of milk processors in the Podlaskie Voivodeship. Today, the dairies in Podlaskie Voivodeship are among the most modern in Europe. There is the automation of milking, milk storage, and feeding in dairy farms. Technological innovation is now ubiquitous. The unpolluted natural environment, combined with the commitment to tradition, gives the effect of the highest quality of milk.
The farms for the research project were selected based on the selection criterion of their location (in Podlaskie Voivodeship) with at least 60% of the farm income from milk production. Each survey was conditional on the farmer’s consent to complete the questionnaire.
The number of farms was estimated based on statistics and probability calculations focusing on a limited number of farms with a high certainty of obtaining reliable research results. It was calculated that for the population of N = 571 farms and the 1-alpha confidence coefficient of 90–95%, the required minimum number of farms covered by the study should be 184. The calculations were made with the use of the following equations [31]:
where:
1: alpha confidence ratio, 90–95%;
The error of results, d: 5%;
The population, N: 571;
From the tables of the t-distribution, the significance of 0.05 (95%) = 1.96, and a significance of 0.10 (90%) = 1.645.
The second research group included dairy farms in the EU and in Poland that were available in the FADN database. On a micro scale, farms that carried out investments and received EU support were analyzed. The test results were compared in time (vertical analyses) and in space (horizontal analyses).
2.2. Methods
The research was conducted in three stages.
Stage 1 involved obtaining data from aid applications submitted by farmers through the “modernization of farms” initiative in the recruitment phase in 2014 (data for the T0 period), with the consent of the Agency for Restructuring and Modernisation of Agriculture (ARMA).
Stage 2 involved obtaining data from the applications for payments from the Agency for Restructuring and Modernisation of Agriculture (ARMA).
Stage 3 involved conducting research, with the use of a questionnaire, among farmers (farm audit) to supplement the other indicated data that was necessary for the research (period T1-2019).
The results were presented in descriptive, tabular, and graphic forms. The research was multi-level: on a macro scale it included the EU countries, Poland, individual states, and dairy farms keeping Farm Accountancy Data Network (FADN) accounting. On a micro scale, it included a sample of farms that carried out investments and received EU (European Union) support (Figure 1).
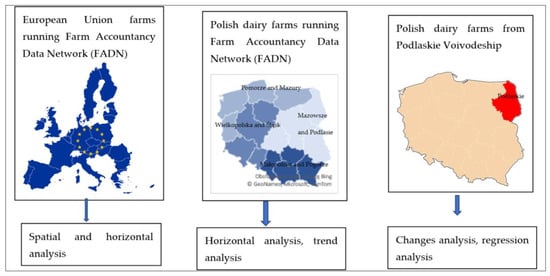
Figure 1.
The diagram of the research groups and methods. Source: own elaborations based on Farm Accountancy Data Network (FADN) [32].
The research examined the condition of farms in two time periods:
- T0: before the start of the investment (2014);
- T1: the investment exploitation phase (information obtained on the interview date, 2019).
The periods T0 and T1 summarized the level of the farm’s equipment with production factors (land, labor, and capital), the size of crop production (cultivation area and obtained crops), and livestock production (the size of the herd of animals and the obtained production effects). It was necessary to conduct research in two periods. The first period was in 2014 (T0) before the investment to measure the state of the farms and the economic situation. The second period (T1) was after the investment to measure the impact of the investment on the economic situation of the farms. Using such an approach enabled us to measure the efficiency of investment.
Additionally, the level of provided services, materials, cash costs, labor costs, subsidies obtained from operating activities, and the economic results of the research of farms were analyzed. The reasons for starting investment activity, the value of the investment outlays in the entire analyzed period, the characteristics of the realized production investments, and the economic and extra-economic effects of the implemented investments were also examined. The effects of investments were understood as the various effects that have been, or will be, revealed in the research of farms and their surroundings.
After collecting the complete research documentation, the analysis included the assessment of the investment activity of the research farms and the scope of the changes (the condition of farms in the T1 period to the T0 period was compared), with a particular emphasis on:
- -
- The changes in the scale and direction of production;
- -
- Changes in the equipment of farms with production factors;
- -
- Changes in the economic size of a farm, based on the standard value of the gross margin;
- -
- Changes in management efficiency.
For the purposes of the investment activity analysis, the research farms were divided into three groups, depending on the value of obtained public aid:
- -
- Group A, where the value of the obtained support did not exceed PLN 100 thousand,
- -
- Group B, where the value of support obtained was between PLN 100.1– and 200 thousand;
- -
- Group C, where the obtained financial support was greater than PLN 200 thousand.
The following methods were used to analyze the collected data: a comparative analysis, correlations, and a regression analysis.
2.3. A Regression Analysis of Factors Shaping the Efficiency of Dairy Farms in Poland
To determine the impact of production variables (land, capital, and workforce) on the income of dairy farms, a regression method was used. This model used information from the farms covered by the research. We did the regression analysis using the classical method of least squares.
The estimated model of regression can be written by the following Equation [32]:
where:
Yi = α + β1∙x1 + β2∙x2 + … + βi∙xi + εi for i = 1, 2, 3…n
Y: Dependent variable;
x: Independent variable;
α: Constant;
β1, β2, …: Regression coefficient;
εi: Random component.
Based on the regression equation, the strength of the relationship (forward multiple step regression coefficient) between the described (dependent) variables and the individual descriptive (independent) variables was calculated. The obtained results of the analysis were collected in tables containing the appropriate means and standard deviations of the examined features, the coefficient of the linear correlation between the examined features, and the multiple regression equations. The regression equation was assessed with the F-test, and the student’s t-test was used to assess the individual correlation coefficients. Significance was declared at the 0.05 level.
3. Results and Discussion
3.1. Gross Investment Outlays and Subsidies in Investments in Dairy Farms in the European Union in the Years 2004–2018
To check the investment outlays in the EU countries, the following variables were examined: the gross investment (SE516) and the investment subsidy (SE406). The observation results are summarized in Table 1.

Table 1.
The amount of investment outlays incurred by dairy farms from the European Union countries in 2004–2018 (EUR/farm).
Gross investments (SE516) are the values of the purchased and manufactured fixed assets reduced by the values of the sold and transferred free-of-charge fixed assets in the accounting year, plus the difference in the value of livestock [33].
The investment subsidy (SE406) includes the installment of investment subsidies to be settled within 12 months by the farm. Generally, it included funds from the European Union (EU) budget [33].
The highest average level of investment in dairy farms in the European Union in 2004–2018 was in Denmark, where an average of EUR 133 thousand was invested annually. Record-breaking investment expenditures occurred in 2008 (related to Danish farmers), where the level of investment expenditure was nearly EUR 300,000 per farm, on average. A high level of investment expenditure, on average, above EUR 80 thousand—was observed annually in Slovakia, Luxembourg, and the Netherlands. The countries with the lowest SE 516, or the gross investment ratio, were Greece and Cyprus. In the case of Greece, its positive value was observed only in 2006, and in the remaining years (if any) it was negative. This may show a reduction in the assets of the dairy farms. Moreover, in the case of Cyprus, the situation is special, where no information on investments in dairy farms was recorded in the Farm Accountancy Data Network (FADN) data.
The analysis of the data showed that in six countries (Bulgaria, Cyprus, Greece, Lithuania, and Latvia) the level of investment in dairy farms was lower than the total investment expenditure. The reasons for such a situation may be different. The dairy industry is not a strategic branch of agriculture in these countries, and the difficult general economic situation in each country, as well as the associated high investment risk, did not allow for the responsible spending of funds on the modernization and restructuring of dairy farms.
Another observed correlation was where the investments made in dairy farms were significantly greater than investments in total farms in some countries, for example in Malta, Italy, Ireland, Estonia, and Spain. In these countries, the level of investment outlays for dairy farms were more than twice as high (in the case of Malta, this quotient was over 12) as the average outlays that occurred in the development of agricultural holdings in general.
The last noticeable relationship was in the group of countries where the level of investment in the dairy cattle farming sector was close to the overall investment expenditure in agriculture. They were Germany, France, Belgium, the Netherlands, and Austria. This may indicate the sustainable investment expenditure in all agricultural sectors.
The last study of dependence conducted was the assessment of the SE 406 variable, which includes the subsidies for investments in dairy farms in the European Union in the years 2004–2018. The amount of this variable is presented in Table 2.
Table 2.
The amount of subsidies to investments made by dairy farms from the European Union countries in the years 2004–2018 (EUR/farm).
The highest levels of subsidies for the investment in dairy farms were noted in Luxembourg, Slovakia, the Czech Republic, Estonia, and Malta. The variable SE 406 had its maximum value in 2011. It amounted to EUR 42.5 thousand and it was related to the amount of subsidies in Slovakia. In the case of Cyprus and Greece, such subsidies were not observed at all. In the case of Romania and Croatia, they did not exceed EUR 100, on average, per year.
The analysis showed that the investment subsidies were not a primary factor for dairy farms with new investments. The example of Denmark, the leader in the amount allocated to investments, showed that investment subsidies were minimal. Slovakia and Luxembourg showed a strong link between new investments and subsidies.
Just as the amounts allocated to investments in dairy farms were generally higher than the amounts for investments in agriculture in general, the amounts of subsidies for investments in dairy farms in most European Union countries were higher than subsidies for agricultural investments in general. The exceptions were the Baltic countries, Lithuania and Latvia, as well as in Romania. In Cyprus and Greece, investment subsidies on dairy farms were completely absent in the FADN reports.
The existing possibility of the co-financing of investments on farms with EU funds enabled the improvement of the economic situation of farms to produce food at moderate prices, appropriate quantities, and of good quality, as well as also fulfilling additional functions [34]. There are also the environmental and climate goals and the goals of socially sustainable agriculture to be considered. In addition, competitiveness has increased [35]. This means that the European Union’s (EU) support will not be used by farmers whose investments would cause too much nitrogen production on the farm (over 170 kg N/ha). Moreover, for investments where the stocking density would exceed 210 livestock units (LU) in the target period, an environmental decision is required during which public consultations are carried out. It is also worth noting that EU support for investments is generally provided for the so-called small and medium-sized farmers.
3.2. The Level and Structure of Investment Outlays on Dairy Farms Keeping FADN Agricultural Accounting
The study of the level of investment outlays in dairy farms keeping FADN agricultural accounting, from the Mazowsze and Podlasie region, as well as those located only in the Podlaskie Voivodeship, consisted of the observation of the variable SE516, “gross investments”, over time. The structure of the expenditure is illustrated using the variable SE521, “net investments”, as an example. These are gross investments reduced by the value of depreciation calculated for the accounting year [33]. The abnormally low (or even negative) value of the variable SE521 “net investments” reflects large depreciation charges resulting from the earlier purchases of machinery and equipment for the farm. The annual depreciation rate was 14–30% per year, and for buildings it was only 2.5% per year. Thus, investments in equipment will generate higher depreciation values than investments in livestock buildings. Investments in equipment translated directly into low values of the SE521 variable in the following years [34,35,36]. The investments help to achieve the sustainable development of dairy farms [37]. The concept of sustainability of dairy farms creates more discussion about agricultural production [38].
The tested values for the above-mentioned variables are included in Table 3, where the data for the years 2009–2015 are presented.
Table 3.
Value of investments in the researched dairy farms.
The analysis of the information contained in Table 3 showed that the investment expenditure on farms in the Podlaskie voivodship was significantly higher than in the entire FADN Mazowsze and Podlasie region. For variable SE516 “gross investments”, these differences range from 3% (2015) to 34% (2011) and for variable SE521 “net investments” from 5% in 2015 to 37% in 2011.
Variable SE516 “gross investments” in the analyzed period were greater than the variable SE521 “net investments” by 16–30%, which shows the amount of the depreciation of fixed assets. Such a depreciation indicates a large share of machinery and equipment in the investment expenditure of dairy farms in the FADN region studied [39,40]. The data in this study is confirmed by other researchers. According to Bórawski [41], investment outlays for the purchase of machinery in dairy farms in the FADN Mazowsze and Podlasie region in 2012 accounted for nearly 75%, where the purchase of land accounted for 17% of the total expenditure, and the construction materials and services accounted for 9% of the total expenditure.
Knowing the total production (revenues), direct consumption (costs), and the amount of received payments (other revenues), we can determine the level of the gross value added in PLN. The gross value added in the FADN methodology was marked as variable SE410. The gross value added, minus depreciation (SE360), gives us the net value added, variable SE415. The net value added, minus the costs of remuneration for the work of hired employees, rents, and interest (defined in the FADN methodology as costs of external factors, SE365), and increased by the balance of subsidies to investment activities (variable SE406 minus variable SE408, i.e., VAT paid on investments) will allow the determination of the income from the family farm, variable SE420. Knowledge about the number of people employed on the farm, both from the farmer’s family (variable SE015 = SE430D) and, additionally, from outside the farm (variable SE010 = SE425D in total), will allow the determination of the following variables:
- -
- SE425: net value added per fulltime employee in PLN (SE415/SE010);
- -
- SE430: family farm income per fulltime employee in PLN (SE420/SE015).
The analysis of the below variables (Table 4) showed that the highest income was achieved by dairy farms in Podlaskie Voivodeship in 2011, when they achieved an average income of over PLN 180,000 per farm. In the entire FADN Mazowsze and Podlasie region, 2011 was also a record year. The income from a family farm amounted to nearly PLN 160 thousand on average, for a farm. The size of the SE430 variable (income per fulltime employee) was similar. Its highest value was recorded in 2011, both on dairy farms in the Podlaskie voivodship (PLN 86.19 thousand per person per year) and on farms in the FADN Mazowsze and Podlasie region (PLN 69.35 thousand per person per year).
Table 4.
Economic results of the research farms.
The investments in machinery and barns improved modernization in the farm and in milking parlors [42]. Investments in physical assets are an important component of the industrial structure, which should be rational and should enable sustainable development. If investments in fixed assets take place in countries with high energy consumption and high pollution, then the structure of investments is irrational, and the type of development is mismatched [43,44].
Moreover, the values of the variables SE410 and SE415 (gross and net value added) were higher on farms producing milk in the Podlaskie voivodship. The only variable whose value was higher in the entire FADN region in relation to dairy farms in the Podlaskie voivodship was the amount of funds obtained for investments (variable SE406).
Milk production is a stable enterprise in agricultural production. Its consumption is growing, which is due to the increase in the world population, as well as from the growing consumption of milk and dairy products (fresh and processed) [45].
Increasing the level of agricultural income and maintaining it at a satisfactory level requires necessary and well-thought-out investments. It is recommended to specialize in milk production and to gradually increase its marketability. It is estimated that the research farms required further equipment, herd optimization in terms of increasing the milk yield, and the optimization of nutrition [46].
3.3. Farm Profitability Depending on the Value of Public Aid—Participation and the Role of Public Aid in Investments
The main goal of running a business (both non-agricultural and agricultural) is to achieve a decent income. Income is largely the result of the difference between revenues and expenses.
The output (or, in other words, the total production) is the sum of the value of products produced as part of the conducted plant production (e.g., cereal grains) and animal production (milk, livestock, etc.). Additionally, the total production includes the by-products produced on farms, such as straw or manure, as well as changes in the herd (increases and losses in value) and works in progress. The value of intermediate consumption is defined as the value of agricultural products from the farmer’s own production that is used for production purposes. On the other hand, direct costs, in accordance with the FADN methodology, include:
- -
- The costs of purchasing seeds or seed potatoes;
- -
- The purchase costs of calves, heifers, and other animals;
- -
- The purchase costs of concentrates;
- -
- The costs of purchasing hay, straw, and others;
- -
- Fertilizer purchase costs (NPK and Ca);
- -
- The costs of purchasing plant protection products;
- -
- The costs of drugs and veterinary services;
- -
- Cleaning agent costs;
- -
- Solid and liquid fuel costs;
- -
- Water bills costs;
- -
- Electricity bill costs;
- -
- Telephone toll costs;
- -
- Spare parts costs;
- -
- The costs of building materials for building repairs;
- -
- The costs of maintenance and construction services;
- -
- The costs of workshop services (technical services, repairs);
- -
- The costs of transport services;
- -
- Land purchasing costs;
- -
- Machine purchasing costs;
- -
- The costs of materials for construction investments;
- -
- The costs of investment construction services;
- -
- Agricultural and real estate taxes;
- -
- Insurance expenses;
- -
- Extraordinary losses.
The gross value added (also defined as the pure production) is the difference between outputs, intermediate consumption, and the direct costs increased by the value of the balance of the current subsidies and taxes. The gross value added that is determined in this way is reduced by depreciation to determine the net value added. Farm income is the difference between the net value added and the costs of external factors (hired labor costs, interest, and rents).
We have divided the farms according to the value of financial support. In the first group, the average financial support was PLN 60.17 thousand. The second group achieved PLN 134 thousand, on average, in financial support. The last group was given PLN 276.8 thousand, on average, in financial support.
Group A (which obtained financial resources that did not exceed PLN 100 thousand for their investments) carried out investments with an average value of PLN 232.6 thousand. The largest purchase items were machines, on which 74.38% of the investment funds were spent. In the next place were purchases related to the purchase of land, where 23.87% of the total funds spent were allocated to them. The purchase of animals was a marginal expense, with only 1.75% of the total capital expenditure allocated to them.
In the next surveyed group of dairy farms, where the amount of support obtained for investments was greater than PLN 100 thousand and was not more than PLN 200 thousand, previously referred to as group B, the overall average amount allocated to investments was PLN 552.2 thousand. The level of expenses related to the purchase of machinery in this group amounted to 83.5% of the total investment purchases. Farmers spent 15.5% of the total amount of their expenditure on the purchase of land. The purchase of animals did not exceed PLN 5 thousand (the average price of one cow) and, thus, it constituted approximately 1% of the total expenses (Figure 2).
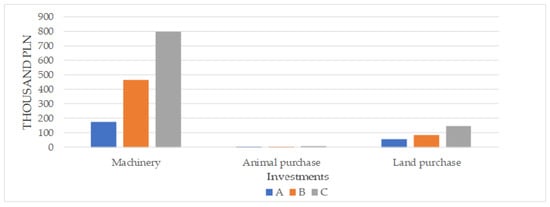
Figure 2.
Value of investments in dairy farms (PLN). Source: own elaborations based on own research.
The group of farms that managed to obtain the highest co-financing for their investments (more than PLN 200 thousand) who were defined, for the purposes of the research, as group C, were allocated an average amount of PLN 951.8 thousand per farm for investments. The structure of purchases in this group was similar to that in the B group. The purchases of machinery constituted the largest amount (83.7%), the purchase of land accounted for 15.4%, and the purchase of animals accounted for less than 1% of the total investment expenditure.
Summarizing the above subsection, it should be stated that the purchases of agricultural machinery for the research dairy farms clearly determined the structure of the investment expenditures made. Over 82% of all expenses were allocated to them. The purchase of agricultural land accounted for 16.6% of the total investment expenditure, and the purchase of animals did not exceed 1% of the total expenditure (0.98%). However, it should be noted that the expenses related to the purchasing of machinery were related to the possibility of their co-financing directly under the EU aid funds, where the purchases of land and animals were excluded from the possibility of such support. Nevertheless, they had to be incurred by the farmer to justify to the Paying Agency the purchase of equipment (and the related financing) with better parameters and greater efficiency.
The value of livestock production in all researched groups of farms increased in 2014–2019. The most interesting value, from the point of research conducted, was the level of milk production. On farms that received external support for their investments that did not exceed PLN 100 thousand, the increase in the value of milk production in the period from 2014 to 2019 was 23.19%. In group B, which obtained support for investments at the level of PLN 100.1–200 thousand, the increase in the value of milk production in the analyzed period was 29%. Dairy farms from the C group, which obtained financial support for their investments of more than PLN 200 thousand, increased the value of milk production by 38.35% in the analyzed period (Figure 3).
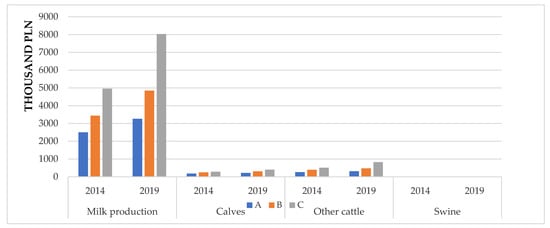
Figure 3.
Value of animal production in dairy farms (PLN). Source: own elaborations based on own research.
The production value of calves, i.e., the value of their sales, also increased. In the farms of the A group, the sales of calves increased by 15.46%. In the farms of the B group, sales of calves increased by 18.14% in the analyzed period. The highest increase in sales was observed in the farms of the C group, with an increase in the sales of calves in the years 2014–2019 of 29.56%.
In the case of other cattle (bulls and cull cows), an increase in turnover was recorded at the level of 16% in groups A and B, while in group C, the increase in the value of livestock production was 38.5%. This situation is most typical for farms specializing in milk production, where the herd turnover is a constant search for optimal quantitative and qualitative results of the obtained raw material.
Some of the dairy farms declared that, despite specializing in milk production, they still kept pigs. In groups A and C, there was an increase in the value of pig production by 12% and 16.5%, respectively, while in group B, there was a decrease in pig production by 19%. It should be noted that the average value of the kept pigs (PLN 50.1–277.1) indicated that they were single pigs intended for the farm’s own needs. The pigs were kept on only six farms.
Below, according to the previously presented chronology, the results of the research on individual categories of production, costs, and income in the surveyed farms are summarized (Table 5).
Table 5.
Total production (PLN) depending on the value of financial support (PLN).
Total production increased from 2014 to 2019. The highest increase was recorded in group C, which amounted to 60%, followed by group B, 35.4%, and the lowest result was recorded in group A, 17.5%. As a reminder, the inflation from 2014 to 2019 amounted to 4.43%.
When analyzing the total production in relation to one ha of agricultural land owned, we noticed that only group C achieved an increase that exceeded inflation. Farm group A recorded a decrease in income per one ha of agricultural land, amounting to 20.5%. In group B, an increase in production was observed, amounting to 3.8%, and group C generated an increase in production per one ha of agricultural land owned by 20.4%.
Slightly better results were recorded when examining the total production per one fulltime person. In group A, an increase in production was recorded, amounting to 8.7%, and in group B, this increase was 31.9%. In group C, this was 44.6%.
In general, summing up the above observations, a fundamental conclusion can be made. An increase in the obtained investment subsidy directly (exponentially) translates into the level of global production.
In the next table, the costs, taxes, and subsidies in the surveyed farms were analyzed (Table 6).
Table 6.
Costs and the balance of current subsidies and taxes (PLN) depending on the value of financial support (PLN).
Obtaining a subsidy for investments has an extremely positive effect on the economic performance of farms. A positive impact due to the co-financing was found, both for the income of the research farms and for other economic indicators.
The structure of the investment support program with the EU funds excludes the possibility of their negative impact on the natural environment and does not violate the principles of socially sustainable agriculture. Thanks to highly specialized administrative staff, the aid is directed to farms that best meet the criteria for granting it [47].
Intermediate consumption in the research farms was subject to slight fluctuations in the analyzed period. In the farms in group A, it decreased by 5%; in group B, it increased by 6%; and in farms in group C, it increased by 8%. Direct costs increased the least in group A, which was 8.7%; in group B, direct costs increased by 31%; and in group C, they increased by nearly half (47.3%). The balance of subsidies and taxes also increased the least in group A, which amounted to 3.8%; in group B, there was an increase of 10%; and in group C the increase was 22%.
The observed values of costs, taxes, and subsidies were directly proportional to the scale of production, and in all observations the highest values, previously on the side of revenues, now on the side of expenditures, appeared on the farms of the C group.
Subsequently, gross and net values added, as well as depreciation and the costs of external factors in the examined dairy farms, were determined. The results are presented in Table 7.
Table 7.
Gross and net value added (PLN) depending on the value of financial support (PLN).
The gross value added (or pure gross production) in the research farms (groups A and B) increased, in 6 years, almost twice as much as the Polish Gross Domestic Product (GDP) in the same period. The increase in gross value added in group A amounted to 65%, and in group B, it amounted to 63%. On the other hand, in group C, the gross pure production increased by 115% in the analyzed period.
As the research dairy farms made several investments in the discussed period, the value of depreciation also increased significantly. In group A, the increase in depreciation in 2014–2019 amounted to 90%; in group B, it amounted to 85.5%; and in group C, it was 109%.
As for the net value added (NVA), its level increased in the same way as the gross value added. In group A, an increase in the NVA was recorded, amounting to 58.5%; in group B, the increase in the NVA was 60%; and in group C, the increase in the net value added was 116%.
The above observations can be more precise by relating the added value generated in the researched dairy farms to the one hectare of agricultural land owned by them or to the one person employed fulltime on the farm, which is presented in Table 8 and Table 9 below.
Table 8.
Gross value added (PLN) depending on the value of financial support (PLN).
Table 9.
Net value added (PLN) depending on the value of financial support (PLN).
The gross value added per one hectare of cultivated land (GVA/ha) increased in all researched groups of farms; however, the greater its increase, the higher was subsidy obtained for the investment. Group A achieved an increase in GVA/ha amounting to 11.5%; in group B, the increase was 25%; and in group C, the increase in GVA/ha reached 61%.
In the case of referring the gross value added to one fulltime job in a farm, its highest value, amounted to over PLN 300 thousand in group C. Slightly over PLN 200 thousand was the GVA/fulltime job for group B farms, and for group A, the GVA/fulltime job was close to PLN 150,000. The largest increase in this value was observed in group C, where theGVA/fulltime job increased by 94% from 2014 to 2019. In groups A and B, increases of a similar value were observed, and they amounted to 52.5% and 59%, respectively.
The net value added per one hectare of kept agricultural land (similar to GVA/ha) increased in proportion to the amount of the investment support received. The smallest increase in NVA/ha was observed in group A of the research farms, where it amounted to 8%; in group B, the NVA/ha ratio increased by 22.5% over the analyzed period; and in group C, the increase in the NVA/ha ratio was the highest, and was 62%. At this point, it should be noted that in the base period T0 (i.e., in 2014) the net value added per one ha of agricultural land was the highest in the farm group B, where it amounted to PLN 14.7 thousand and increased by over PLN 2.1 thousand compared to group C. It should be concluded that the investments carried out directly translated into the reversal of this relationship, where the net value added per 1 ha of agricultural land in the T1 period for farms from group C was PLN 20.4 thousand and had increased by nearly PLN 2.3 thousand compared to the NVA/ha for farms of the agricultural area of group B. The differences in net value added per one ha of agricultural land also increased significantly, analyzing the T1 period in relation to the T0 period. In 2014, the value of NVA/ha was between PLN 12.1 thousand and PLN 14.7 thousand (the difference between the minimum and maximum value was PLN 2557.9), and 6 years later these values ranged from PLN 13.1 thousand to PLN 20.4 thousand (with a difference of PLN 7262.8).
The study of the net value added (NVA) in relation to one fulltime employee on the farm yielded similar observation results as before. In all groups of research farms, an increase in the value of WDN/fulltime job was observed. In farm group A, it amounted to 47%; in the farm group B, it amounted to 55.5%; and in group C, the NVA/fulltime increased by nearly 95%.
Summarizing these observations, it can be shown that the investments carried out (and the support received for them) significantly influenced the level of added value (gross and net) in the research farms. As the achieved values of added value increased, the level of received co-financing for the investments carried out increased.
What is noteworthy is the fact that farms from group A reduced the costs of external factors in the analyzed period. On the other hand, in the farms from groups B and C, an increase in these expenses was observed. Over the course of the studied 6 years, in group B, the costs of external factors increased by 21%, while in group C, there was a 36% increase in the costs of external factors. However, it allowed all analyzed farms to generate an income increase in the analyzed period, ranging from 66% to 125%. Detailed information on the income from the surveyed family farms is presented in Table 10.
Table 10.
Income from a family farm (PLN) depending on the value of financial support (PLN).
In group A, the farm income increased in the analyzed period by over PLN 85 thousand, which translated into an increase in income amounting to 66.5%. The amount of income from a family farm per one ha of arable land increased by 12.6%, to the amount of PLN 12,164.1. The recognition of family farm income per one fulltime employee also increased by 54% and amounted to PLN 105.4 thousand in 2019. The average income for the farm group A in 2014–2019 amounted to PLN 170.4 thousand.
In the farms in group B, an increase in income was also observed, which increased in the analyzed period by PLN 157.5 thousand. This translated into a percentage increase in income amounting to 69.5%. The amount of family farm income per one ha of agricultural land increased by 30% to the amount of PLN 17,161.9. The income from a family farm per one fulltime employee increased by 65% and amounted to PLN 166.9 thousand in 2019. The average income for farms from this group in the analyzed period amounted to PLN 305.1 thousand.
While examining the farms in group C, the greatest increases in the analyzed variables were generated. There was no difference in the case of the analysis of family farm income. In the T1 period (2019), the farms of group C achieved an income of over PLN 600 thousand, thus recording an increase compared to the base period, T0 (2014) of 125%. The ratio of the family farm income per one ha of agricultural land increased by 68.5% to the amount of PLN 19.1 thousand. The income from a family farm per one fulltime employee increased by 102.6% and amounted to PLN 249.7 thousand in 2019. The average income for farms in this group in the analyzed period amounted to PLN 440.3 thousand.
Public aid, which is the support for investments under the Rural Development Programme (RDP), stimulates the process of modernization on Polish farms and improves the competitive situation in relation to farms from other EU countries [48].
The current support system for agricultural investments should be maintained. The investments help in the development for not only large, but also small dairy farms [49].
We used the classical method of least squares to measure the individual impact of explanatory variables to predict the value of the dependent variable. Negative values of the regression coefficients indicated a negative impact, and positive values indicated a positive impact of the level of the independent variable on the dependent variable [50].
We used the Student’s t-test, standard error, the coefficient of regression, and the p-value to evaluate the impact of the chosen factors on income. With strong correlations between the independent variables, the multiple regression function was statistically significant (F-test). The basic measure of model fit is the coefficient of determination, R2. A well-fitted model has a high value of R2 close to unity [51].
The study investigated the impact of chosen factors on the efficiency of dairy farms that made investments in the Podlaskie voivodeship in Poland. The explanatory variable was the income from the family farm, Y1. Explanatory variables are presented in the methodology. The study was conducted using the Statistica software 13 and the results are included in Table 11. The research shows that the value of family farm income depended on the following variables (Table 11): X1, the value of fixed assets (PLN) and X7, the number of cows (number). The increase of X1, the value of fixed assets (PLN) and X7, the number of cows (number) caused an increase in family farm income. Increasing the value of fixed assets by PLN 1 thousand resulted in an increase in family farm income of PLN 306. Increasing the number of cows by one head caused an increase of family farm income of PLN 11.1 thousand. These results demonstrated that the average milk yield produced by one cow was 7293 L and it was the main reason for the increased income. The increase of the price of milk per liter in Poland caused the increase the farms’ competitiveness. The results of the regression demonstrate that the most profitable investments were in cows and fixed assets because they increased income.
Table 11.
Multiple regression results between the dependent variable Y1 (family farm income) and explanatory variables for 2019.
The regression analysis utilized the following variables: X2, ha of farmland; X3, the direct and general economic costs; X4, the number of people employed; and X9, equity (total assets minus short-term and long-term liabilities). These variables had a statistically significant impact on the value of the family farm income (the significance level was less than 0.05), but the impact was negative. It means that the increase of X2, ha of farmland; X3, the direct and general economic costs; X4, the number of people employed; and X9, equity (total assets minus short-term and long-term liabilities) caused the decrease in family farm income.
The goal of dairy farms is to optimize production and obtain a high milk yield. It is understandable because the researched dairy farms are larger in area and are characterized by a high work efficiency. Subsidies are of particular importance in small-area and low-efficiency farms. The fit of the model was high, where R2 = 0.698 and F = 50.804. The corrected R2 was 0.685.
The regression equation can be presented as following:
Y1 = 19,207.6 + 0.606X1 − 648.730X2 − 0.419X3 − 73,875.4X4 + 0.195X5 + 0.016X6 +111,13.9X7 + 0.079X8 − 0.324X9
In the second model, the dependent variable was the income from the family farm per one hectare of arable land, Y2. As before, the Statistica software was used to conduct the research, and the results are presented in Table 12.
Table 12.
Multiple regression results between the dependent variable, Y2 (family farm income per one hectare of arable land) and the explanatory variables for 2019.
The aim of multiple regression in the second model was to quantify the relationship between the describing (explanatory) variables and the dependent variable. In the tested model, the most important features influencing the variable dependency were searched for [52].
The research showed that the value of family farm income per one hectare of arable land depended on the following variables (Table 12): X5, the amount of paid investment co-financing and X7, the number of cows. It means that the increase of these variables caused the increase in family farm income calculated per one ha of arable land. Increasing the of amount of paid investment co-financing by PLN 1 thousand caused the increase in family farm income per one hectare of arable land of PLN 15.
The regression analysis also included following variables: X2, ha of farmland; X3, direct and general economic costs; and X4, the number of people employed, but these variables had a negative impact. The increase in these variables caused a decrease in family farm income per one hectare of arable land.
The model proved that all analyzed variables had an impact on family farm income per one ha of agricultural land. The fit of the model was at a low level, where R2 = 0.144 and F = 3.692. The corrected R2 was also low, which suggests that the fit of the model was low. An R2 close to 1 is the best for the model. In the case of our model, the low R2 suggested a low coherence between analyzed variables.
We calculated the following regression equation:
Y2 = 7483.23 + 0.000X1 − 41.288X2 − 0.011X3 − 409.742X4 + 0.015X5 + 0.000X6 + 84.409X7 − 0.001X8 +0.002X9
In the third model, the dependent variable was the income from a family farm per fulltime employee, Y3. The choice of explanatory variables remained the same, as did the software used to calculate multiple regression (Statistica). The results of the observations are included in Table 13. The research showed that the value of family farm income calculated per fulltime employee depended on the following variables (Table 13): X1, the value of fixed assets; X7, the number of cows; X5, the amount of paid investment co-financing; X6, the investment value; and X8, the total value of assets. It is understandable because the increase in the value of fixed assets always increases the income from the family farm calculated per 1 fulltime employee. The increase in the value of fixed assets by PLN 1 thousand caused an increase in the family farm income of PLN 140. Increasing of number of cows by one head caused the increase in the income of family farms per fulltime employee of PLN 3.8 thousand. Moreover, our research proved the positive impact of investments and public financial support. This means that the increase in dairy farm activities, in terms of investment, improved the economic situation of farms and increased their competitiveness.
Table 13.
Multiple regression results between the dependent variable Y3 (income from family farms per fulltime employee) and explanatory variables for 2019.
Moreover, the value of income from family farms per fulltime employee depended on: X3, the direct and general economic costs; X4, the number of people employed; and X9, equity (total assets minus short-term and long-term liabilities), but these variables had a negative impact. This mean that the increase in these variables caused the decrease in income from family farm that was calculated per 1 fulltime employee. The fit of the model was high, where R2 = 0.580 and F = 30.251. The corrected R2 = 0.561 was also quite high, suggesting the coherence between the analyzed variables.
The regression analysis helped the calculation of the following equation:
Y3 = 145,279 + 0.140X1 − 227.012X2 − 0.158X3 − 65,512.9X4 + 0.054X5 + 0.002X6 + 3828.53X7 − 0.041X8 − 0.156X9
4. Discussion
Poland’s accession to the structures of the European Union, supported by nearly 80% of the social referendum mandate for European integration, gave enormous hopes for improving the quality of life of most Poles. A special opportunity was seen for Polish agriculture, mainly because nearly half of the European Union (EU) budget was allocated to it. Polish agriculture needed significant expenditure to be able to compete in the European and world markets, as it was, above all, highly fragmented and largely underinvested [41]. In 2004, the Agency for Restructuring and Modernisation of Agriculture registered over 1.5 million farms. The average area of a farm in Poland was approximately 10 hectares, and the standard was to have one tractor. The change in this situation was possible thanks to the financial resources available under the Rural Development Programme (RDP), where an aid program was prepared for investing farmers, Known as the “modernization of agricultural holdings”. The Common Agricultural Policy (CAP) also included agri-environment schemes (AES) which helped to keep the biodiversity on farms [53,54].
The public financial support for the investment activity on farms is simply the funds available under the above-mentioned aid measure, the “modernization of farms” under the Rural Development Programme (RDP).
The effectiveness of public support for farms has been confirmed in the case of Slovakia. Research has shown that the creation of producer organizations in Slovakia, to strengthen the bargaining position of farmers in the supply chain supported by the Rural Development Programme (RDP), allows members of these organizations to achieve better economic results, i.e., higher profitability, added value, and increased employment and labor productivity compared to holdings that are not members of producer organizations [55].
Research in Latvia on the impact of investment support on the economic performance of farms has also shown that, for small- and medium-sized farms, this support facilitates the creation of additional added value. A different situation was observed for large farms [56].
In the 1990s, rural policies in Lithuania and Latvia had similar goals to those in Western countries in the 1950s, 1960s, and 1970s, which was increasing and intensifying production, increasing the scale of agriculture, and reducing production costs to be able to offer cheap food and increase self-sufficiency. Investment support for farms was conducive to a constant increase in the area of crops per work unit and was accompanied by an increase in the use of synthetic plant protection products and mineral fertilizers [57].
5. Conclusions
The main goal and the specific goals of the research have been fully implemented. The need, or even necessity, of making investments in dairy farms results both from external factors, such as the constantly growing demand (resulting from the growing number of people in the world and the increase in the consumption of dairy products per capita), as well as from internal factors, where agricultural income and the costs of agricultural activity are reduced and the efficiency and the scale of production are increased.
The H1 hypothesis, assuming that the possibility of obtaining financing for an investment is a factor that determines its implementation, was positively verified. This was mainly due to the size of the investments carried out in the research farms, which resulted in:
- -
- An increase in the area of agricultural land in the research farms by 65% in group A, 177% in group B, and 63% in group C;
- -
- An increase in the value of owned machinery and equipment in group A by 98%, in group B by 263%, in group C by 306%;
- -
- An increase in the value of milk production by 30% in group A, 40% in group B, and 62% in group C;
- -
- An increase in the number of cattle on a farm by 18% in group A, 25% in group B, and 29% in group C.
Moreover, using the Rural Development Programme (RDP) provides direct logical proof of the necessity to obtain subsidies to carry out the intended investments. Similarly, a significant number of farmers, when answering the questionnaire, ruled out the possibility of carrying out investments without receiving external support.
The second research hypothesis, H2, assumed that the investments made in farms improved their economic situation. This was positively verified. This is evidenced by the calculated results of agricultural income in the research farms, both in total and per one hectare of agricultural land on the farm, as well as per one fulltime job on the farm. In the group A farms, the income from an agricultural holding increased by 66.5% per one hectare of agricultural land, and by 12.6% per one fulltime job per farm; it increased by 54% in 2014–2019. In the group B farms, income from a family farm increased by 69.5%, income from a family farm per one hectare of agricultural land increased by 30%, and income from a family farm per one fulltime job on a farm increased by 65% in the same period. The highest increase in the researched income indicators were observed in the farms from group C. They increased their family farm income by 124.7%, as well as their family farm income per one hectare of agricultural land by 68.5%, and their family farm income per one fulltime job on a farm by 102.5% in 2014–2019.
In addition, the multiple regression study performed showed that the income in the family farm is directly influenced by the increase in the value of fixed assets and obtained subsidies, which, in fact, is information about the investment made on the farm.
In addition, the Agency for the Restructuring and Modernisation of Agriculture (ARMA) employees, who, with great care and meticulousness, carried out the process of verifying the submitted applications for aid, lasting, on average, 9–12 months from the date of the submission of the application, to ensure the proper spending of funds from the Rural Development Programme (RDP) program.
Our research proved the impact of selected factors on income from family farms and the value of income from family farms per fulltime employee. The most important variables were: X1, the value of fixed assets and X7, number of cows. Some variables had negative impacts for example:
The value of income from family farms per fulltime employee depended on: X3, the direct and general economic costs; X4, the number of people employed; and X9, equity (total assets minus short-term and long-term liabilities), but these variables had a negative impact. According to our analysis, the variable X5, the amount of paid investment co-financing, and the investment, had positive impacts on the family farm income calculated per fulltime employee. Our results from regression analysis can also be important for farmers because they confirm the positive impact of investment on the farm. Farmers should invest in farms and use public financial support to increase the competitiveness of dairy farms.
Our research results from the regression analysis can also be useful for politics, because they confirm the positive impact of investment. Public support is needed to improve the economic situation and competitiveness of dairy farms. Bearing in mind the increased competition and huge demand for milk worldwide, Polish and European Union farms must invest and increase their scale of production.
Author Contributions
Conceptualization, P.B. and K.Z.; methodology, P.B. and K.Z.; software, P.B.; validation, P.B. and K.Z.; formal analysis, P.B.; investigation, K.Z.; resources, P.B.; data curation, P.B.; writing—original draft preparation, P.B., K.Z., A.P., I.Ż., L.H. and T.R.; writing—review and editing, P.B., K.Z., A.P., I.Ż., L.H. and T.R.; project administration, P.B.; funding acquisition, P.B. All authors have read and agreed to the published version of the manuscript.
Funding
The article was written by the project funded by the National Science Centre in Poland allocated on the project OPUS 15, number of the project: 2018/29/B/HS4/00392.
Institutional Review Board Statement
Not applicable.
Informed Consent Statement
Not applicable.
Data Availability Statement
Not applicable.
Acknowledgments
The Authors of the paper would like to thank two anonymous reviewers for their comments which helped to improve this paper.
Conflicts of Interest
The authors declare no conflict of interest.
References
- Wigier, M. Pomoc publiczna dla polskiego sektora żywnościowego (Public aid for the Polish food sector). In Przemysł Spożywczy Makrootoczenie, Inwestycje, Ekspansja Zagraniczna (Food Industry Macro-environment, Investments, Foreign Expansion); Iwona Szczepaniak, I., Firlej, K., Eds.; Uniwersytet Ekonomiczny w Krakowie: Kraków, Poland, 2015. [Google Scholar]
- Castro, A.; Pereira, J.M.; Amiama, C.; Bueno, J. Estimating efficiency in automatic milking systems. J. Dairy Sci. 2012, 95, 929–936. [Google Scholar] [CrossRef]
- Kozima, A.M.; Semkiv, L.P. Sustainable development of dairy farms thorough the use of digital technologies. IOD Conf. Ser. Earth Environ. Sci. 2020, 613. [Google Scholar] [CrossRef]
- Oudshoorn, F.W.; Kristensen, T.; van der Zijpp, A.J.; de Boer, I.J.M. Sustainability evaluation of automnative and conventional milling system on organic dairy farms in Denmark. NJAS-Wagenin. J. Life Sci. 2012, 59, 25–39. [Google Scholar] [CrossRef]
- Różańska, E.; Szpac, M.; Walczyk, M.; Jamińska, Z.; Klawe-Mikołajuk, E. Dopłaty dla Rolników w Ramach Wspólnej Polityki Rolnej Unii Europejskiej (Subsidies for Farmers under the Common Agricultural Policy of the European Union); ARiMR: Warszawa, Poland, 2002. [Google Scholar]
- Czubak, W. Wykorzystanie funduszy Unii Europejskiej wspierających inwestycje w gospodarstwach rolnych (Use of European agricultural fund supporting investments in agricultural holdings in Poland). J. Agribus. Rural Dev. 2012, 3, 57–67. [Google Scholar]
- Bułkowska, M.; Chmurzyńska, K. Wyniki Realizacji PROW i SPO “Rolnictwo” w latach 2004-2006 (Results of the Implementation of RDP and SOP “Agriculture” in the Years 2004–2006); Instytut Ekonomiki Rolnictwa i Gospodarki Żywnościowej—Państwowy Instytut Badawczy: Warszawa, Poland, 2007. [Google Scholar]
- Bednarski, M.; Wilkin, J. Ekonomia dla Prawników i Nie Tylko (Economics for Lawyers and More); LexisNexis: Warszawa, Poland, 2011. [Google Scholar]
- Moreira, A.; Bravo-Ureta, B. Technical efficiency and meta technology ratios for dairy farms in three southern cone countries: A stochastic meta-frontier model. J. Prod. Anal. 2010, 33, 33–45. [Google Scholar] [CrossRef]
- Blayney, D.P.; Gehlhar, M.J.U.S. dairy at a new crossroads in a global setting. Amber Waves 2005, 3, 1–6. [Google Scholar]
- Van Asseldonk, M.A.P.M.; Huirne, R.B.M.; Dijkhuizeb, A.A.; Beulens, A.J.M. Dynamic programming to determine optimum investments in information technology on dairy farms. Agric. Syst. 1999, 62, 17–28. [Google Scholar] [CrossRef]
- Matwiejczuk, R. Efektywność—Próba interpretacji (Efficiency—An attempt of interpretation). Przegląd Organ. 2000, 11, 27–31. [Google Scholar] [CrossRef]
- Kotarbiński, T. Dzieła Wszystkie. Traktat o Dobrej Robocie (All works. The Good Job Treaty); Ossolineum: Wrocław, Poland, 2000. [Google Scholar]
- Rutkowska, A. Teoretyczne aspekty efektywności—Pojęcie i metody pomiaru (Theoretical Aspects of Efficiency—The Concept and Methods of Measurement). Zarz. I Finans. 2013, 1, 450–451. [Google Scholar]
- Samuelson, P.A.; Nordhaus, W.D. Ekonomia (Economics); PWN: Warszawa, Poland, 2005. [Google Scholar]
- Bórawski, P.; Ogonowski, T. Efektywność gospodarstw rolnych prowadzących rachunkowość rolną FADN w regionie Pomorza i Mazur (Efficiency of farms running rural accountancy FADN in the region of Pomorze and Mazury). Zesz. Nauk. Ostrołęckiego Tow. Nauk. 2015, 29, 126–136. [Google Scholar]
- Szymańska, E. Efektywność przedsiębiorstw—definiowanie i pomiar (Enterprise effectoveness-degining and measurement). Rocz. Nauk Rol. 2010, 97, 152–163. [Google Scholar]
- Dębniewski, G.; Pałach, H.; Zakrzewski, W. Mikroekonomia (Microeconomics); Wydawnictwo UWM Olsztyn: Olsztyn, Poland, 2000. [Google Scholar]
- Józwiak, W. Efektywność Gospodarowania w Rolnictwie (Farming Efficiency); Encyklopedia Agrobiznesu: Warszawa, Poland, 1998. [Google Scholar]
- Bórawski, P.; Pawlewicz, A. Efektywność ekonomiczna indywidualnych gospodarstw rolnych w aspekcie zrównoważonego rozwoju obszarów wiejskich na przykładzie województwa warmińsko—Mazurskiego (Economic efficiency of individual farms in the aspect of sustainable development of rural areas on the example of tWarmia and Mazury voivodship. Zesz. Nauk. Akad. Rol. We Wrocławiu Rol. 2006, 540, 91–92. [Google Scholar]
- Listkiewicz, J.; Listkiewicz, S.; Niedziółka, P.; Szymczak, P. Metody realizacji projektów inwestycyjnych (Methods of implementing investment projects). Ośrodek Doradztwa i Doskonalenia Kadr sp. z o.o. Gdańsk 2004, 1, 16–20. [Google Scholar]
- Smith, A. Badania nad Naturą i Przyczynami Bogacenia się Narodów (Research on the Nature and Causes of Richer Nations); Wydanie Drugie Księga IV; Wydawnictwo Naukowe PWN: Warszawa, Poland, 2020. [Google Scholar]
- Keynes, J.M. The General Theory of Employment, Interest, and Money; Wydawnictwo Martino Fine Books: Cieszyn, Poland, 2011; pp. 11–20, (Reprint of 1936 edition). [Google Scholar]
- Encyklopedia PWN. Available online: https://encyklopedia.pwn.pl/haslo/optimum-w-sensie-Pareto;3951452.html (accessed on 30 November 2021).
- Łącka, I.; Worobjow, L. Mikroekonomia (Microeconomics); Stowarzyszenie Naukowe Instytut Gospodarki i Rynku: Szczecin, Poland, 2006; pp. 208–224. [Google Scholar]
- Wojtyna, A. Rola państwa we współczesnej ekonomii (The role of the state in modern economy). Ekonomista 1992, 3, 11–31. [Google Scholar]
- Lipowski, A. Mechanizm Rynkowy w Gospodarce Rynkowej. Podstawy Teoretyczne, Perspektywy, Dylematy (Market Mechanism in a Market Economy. Theoretical Foundations, Perspectives, Dilemmas); PWN: Warszawa, Poland, 1989; pp. 186–210. [Google Scholar]
- Verhees, F.; Malak-Rawlikowska, A.; Stalgiene, A.; Kuipers, A.; Klopčič, M. Dairy farmer’s business strategies in Central and Eastern Europe based on evidence from Lithuania, Poland and Slovakia. Ital. J. Anim. Sci. 2018, 17, 755–766. [Google Scholar] [CrossRef]
- Kusz, D. Pomoc Publiczna a Proces Modernizacji Rolnictwa (Public Aid and the Process of Agriculture Modernization); Oficyna Wydawnicza Politechniki Rzeszowskiej: Rzeszów, Poland, 2018. [Google Scholar]
- Jedlik, A.; Stalgiena, A.; Aamisepp, M.; Bratka, V.; Żekało, M. The comparison of entrepreneurship ability of dairy farms in Lithuania, Latvia, Estonia and Poland. Manag. Theory Stud. Rural Bus. Infrastruct. Dev. 2014, 36, 516–525. [Google Scholar] [CrossRef]
- Szreder, M. Metody i Techniki Sondażowych Badań Opinii (Methods and Techniques of Opinion Polls); PWE: Warszawa, Poland, 2004. [Google Scholar]
- Sobczyk, M. Statistics (Statistics); PWN: Warszawa, Poland, 2005. [Google Scholar]
- Wyniki Standardowe Uzyskane Przez Gospodarstwa Rolne Uczestniczące w Polskim FADN w 2009 Roku—(Standard Results Obtained by Farms Participating in the Polish FADN in 2009. Region 795 Mazowsze i Podlasie; Instytut Ekonomiki Rolnictwa i Gospodarki Żywnościowej—PIB, Zakład Rachunkowości Rolnej: Warszawa, Poland, 2011.
- Klopčič, M.; Kuipers, A.; Malak-Rawlikowska, A.; Stalgiene, A.; Ule, A.; Erjavec, K. Dairy farmer’s strategies in four European countries before and after abolition of the milk quota. Land Use Policy 2019, 88, 104169. [Google Scholar] [CrossRef]
- Irz, X.; Jansik, C. Competitiveness of dairy farms in northern Europe: A cross-country analysis. Agric. Food Sci. 2015, 24, 206–218. [Google Scholar]
- Zalewski, K.; Bórawski, P.; Bełdycka-Bórawska, A. Zróżnicowanie inwestycji w gospodarstwach rolnych regionu FADN Mazowsze i Podlasie w latach 2010–2014 (Investment differentiation in farms belonging to Mazowsze and Podlasie FADN region in the years 2010–2014). Rocz. Nauk. Stowarzyszenia Ekon. Rol. I Agrobisnesu 2017, 19, 196–201. [Google Scholar]
- Wieliczko, B.; Kurdyś-Kujawska, A.; Sompolska-Rzechuła, A. Savings of small farms: Their magnitude, determinants, and role in sustainable development. Example of Poland. Agriculture 2020, 10, 525. [Google Scholar] [CrossRef]
- Alem, H. The role of technical efficiency achieving sustainable development: A dynamic analysis of Norwegian Dairy Farms. Sustainability 2021, 13, 1841. [Google Scholar] [CrossRef]
- Gaworski, M.; Kamińska, N.; Kic, P. Evaluation and optimalization of milking in some Polish dairy farms differed in milking parlous. Agron. Res. 2017, 15, 112–122. [Google Scholar]
- Fernandes, F.; Pereira, P.; Regalo Silva, V.; Borkowski, P.; Gaworski, M. Premises of dairy systems development on an example of Polish and Portuguese conditions. Ann. Wars. Univ. Life Sci. SGGW Agric. 2014, 64, 49–57. [Google Scholar]
- Bórawski, P. Zróżnicowanie inwestycji w gospodarstwach mlecznych (Differentiation of investment in dairy farms). Rocz. Nauk. Stowarzyszenia Ekon. Rol. I Agrobiz. 2014, 16, 27–32. [Google Scholar]
- Herbut, P.; Nawalny, G.; Angrecka, S.; Sokołowski, P.; Godyń, D. A technical analysis of barns on large dairy farms in northern Poland. Infrastrukt. I Ekol. Teren. Wiej. 2017, 2, 837–847. [Google Scholar] [CrossRef]
- Lili, L.; Peng, Q. The impact of China’s investment increase in fixed assets on ecological environment: An empirical analysis. Energy Procedia 2011, 5, 501–507. [Google Scholar] [CrossRef]
- Wright, J.; Zhu, B. Monopoly rents and foreign direct investment in fixed assets. Int. Stud. Q. 2018, 62, 341–356. [Google Scholar] [CrossRef]
- Gaworski, M. Assessment of dairy production development on the example of Polish conditions and comparisons with certain European countries. J. Agric. Sci. 2016, 1, 12–18. [Google Scholar]
- Guyomard, H.; Le Mouël, C.; Alexandre Gohin, A. Impacts of alternative agricultural income support schemes on multiple policy goals. Eur. Rev. Agric. Econ. 2004, 31, 125–148. [Google Scholar] [CrossRef]
- Czubak, W.; Pawlowski, K.P.; Wiza, P.L.; Arion, F. Polish and Romanian dairy farms using eu investment support: A comparative study. Ann. Pol. Assoc. Agric. Agrobusiness Econ. 2019, 21, 4. [Google Scholar] [CrossRef]
- Kuliešis, G.; Lina Pareigienė, L. The impact of RDP 2007–2013 measures implementation on Lithuanian rural areas. Manag. Theory Stud. Rural Bus. Infrastruct. Dev. 2016, 38, 252–260. [Google Scholar] [CrossRef][Green Version]
- Bernard, J.; LeGal, P.Y.; Triophe, B.; Hoostiou, N.; Moulin, C.H. Involvement of small-scale dairy farms in an industrial supply chain: When production standards meet farm diversity. Animal 2011, 5, 961–971. [Google Scholar] [CrossRef] [PubMed]
- Aczel, A.D. Statystyka w Zarządzaniu (Statistics in Management); Wydawnictwo Naukowe PWN: Warszawa, Poland, 2018. [Google Scholar]
- Bitner, A. Konstrukcja modelu regresji wielorakiej przy wycenia nieruchomości (Concstruction od the multiple regression model in real estate valuation). Acta Sci. Pol. Adm. Locorum 2007, 6, 59–66. [Google Scholar]
- Hajduk, A. Weryfikacja modelu regresji wielorakiej na przykładzie nieruchomości rekreacyjnych gmin: Gródek nad Dunajcem i Łososina Dolna (Verification of the multiple regression model on the example of recreational properties in the municipalities of Gródek nad Du-Najcem and Łososina Dolna). Geomat. Environ. Eng. 2007, 1, 55–66. [Google Scholar]
- Syp, P.; Oduch, D. Dairy farmers; views on environment, results of questionanaire. Survey from regions of Mazowsze and Podlasie in Poland. Eng. Rural Dev. 2017. [Google Scholar] [CrossRef]
- Dries, L.; Germenji, E.; Noev, N.; Swinnen, J.F.M. Farmers, vertical coordination, and the restructuring of Polish supply chains in Central and Eastern Europe. World Dev. 2009, 37, 1742–1758. [Google Scholar] [CrossRef]
- Michalek, J.; Ciaian, P.; Pokrivcak, J. The impact of producer organizations on farm performance: The case study of large farms from Slovakia. Food Policy 2018, 75, 80–92. [Google Scholar] [CrossRef]
- Veveris, A. Investment support and its impact on the economic results of Rural farms of different groups. Econ. Sci. Rural Dev. 2014, 34, 154–162. [Google Scholar]
- de Roest, K.; Ferrari, P.; Knickel, K. Specialization and economies of scale or diversification and economies of scope? Assessing different agricultural development pathways J. Rural Stud. 2018, 59, 222–231. [Google Scholar] [CrossRef]
Publisher’s Note: MDPI stays neutral with regard to jurisdictional claims in published maps and institutional affiliations. |
© 2022 by the authors. Licensee MDPI, Basel, Switzerland. This article is an open access article distributed under the terms and conditions of the Creative Commons Attribution (CC BY) license (https://creativecommons.org/licenses/by/4.0/).