Abstract
Castor is a crop with an evergreen habit so artificially-induced ripening is an essential precondition for mechanical harvesting of new dwarf annual hybrids. Plants’ moisture imposes a determinant effect both on pre-harvest and post-harvest seed loss, so frequent monitoring of crop ripening is crucial for identifying the optimum moisture for harvest. Remote sensing information from Unmanned Aerial Systems (UASs) along with field measurements were utilized in the present study in order to evaluate three harvest aid chemicals, herbicides glyphosate (GLY) and diquat (DIQ) and the defoliant Spotlight® (DEF) for terminating the castor crop and identifying opportunities for using remote sensing as a tool for monitoring crop ripening. The results showed that glyphosate required more than two weeks to dry out the crop while diquat and spotlight® presented a rapid action within two to four days. Nineteen vegetation indexes (VIs) were derived from a multispectral and an RGB camera mounted on two UAS and were plotted against field measurements. NDVI presented a higher accuracy (R2 = 0.67) for predicting the castor stems’ and leaves’ moisture content while OSAVI and SIPI2 were more powerful in predicting moisture of capsules (R2 > 0.76). High efficiency was also obtained with VARIgreen, an index estimated from the common bands of a conventional RGB camera. The best performing VIs were further utilized in multiple linear regression models also incorporating the date of spraying as information. The VI models further improved the predicting power with an R2 of up to 0.73 for stems and leaves and 0.81 for capsules.
1. Introduction
Castor is a crop with a constantly growing interest all over the world. It provides a high-quality oil with unique properties which are essential for many industrial and pharmaceutical purposes [1,2,3] and also being important as a feedstock for biodiesel production [4,5]. Nevertheless, it is still lacking from widespread adoption mainly because mechanical harvesting still remains an issue [6,7]. Therefore, castor seed production relies on handpicking, which of course excessively increases the production cost and restricts its cultivation in countries with low labor costs such as India, which sustains more than 80% of the world’s production [8].
The castor plant grows as an annual or perennial shrub that may become taller than 5 m [9]. The fruits are three-lobed capsules containing three oily, bean-shaped seeds encapsulated by hulls. The fruits develop in erect inflorescences forming racemes. During ripening, the capsules shatter allowing the detachment of the hulls, which fall to the ground. The reproductive stage in annual types starts 40–70 days after sowing and continues throughout the plant’s life. The plant produces primary, secondary, and tertiary racemes that mature successively. Ripening is uneven, but even on the same raceme as the elder fruits mature earlier [10]. Therefore, the induction of artificial ripening either by spraying harvest aids or by mechanical cutting of the plants at some period prior to harvesting is essential for mechanical crop harvesting [11].
Despite new dwarf annual, shatter-tolerant hybrids that are adapted for mechanical harvesting being recently introduced in the market [12], mechanical harvesting still remains an issue and critical problems associated with seed losses and seed damages have to be solved. In particular, dry castor capsules are quite sensitive to mechanical disturbance and hulls may easily detach from the capsules prior to the harvester’s header managing to collect them [7]. Moreover, the seed is very sensitive and is often damaged by the cleaning system of the combines which requires thorough fine-tuning. Plant moisture in the above processes seems to be the most crucial factor affecting the performance of the harvester. The plant tissues (stems, leaves, hulls) have to be adequately dry in order to avoid the excess loading and probable clogging of the cleaning system. On the other hand, excessively dry capsules are susceptible to detaching from the plant either by natural dehiscence or by the impact of the harvester header. The problem is exacerbated by the indeterminate reproductive stage of the crop that provides fruits of different maturity stages. Therefore, the artificial ripening induced by harvest aids must be constantly monitored for evaluating the drying process and scheduled according to the appropriate harvest dates [10]. Empirically, in improved varieties with shatter-tolerant capsules, harvesting should start as soon as the capsules turn brown, an indication that they are adequately dry [9]. The chance to use color as a maturity index provides opportunities for utilizing remote sensing to apply it on a broad scale.
Remote sensing from satellite instruments and later, Unmanned Aerial Systems (UASs) involving drones that carry various sensors, is a constantly expanding technology for the broad-scale monitoring of crops [13,14]. Various types of images were widely investigated for their potential to provide information in recognizing plant stress conditions (drought, pests diseases, etc.) [15], quantifying crop needs (water, fertilizers, etc) [16,17], predicting crop yield [18] or the optimum harvesting time. For instance, Xu et al. (2019) [19] proposed a novel method for predicting a corn optimum harvest date by assessing corn kernel moisture through remote sensing. Such an approach would be of interest for castor crops for which, as mentioned above, mechanical harvesting is extremely sensitive to plant moisture.
In an earlier study, Vijaya Kumar et al. (1998) used a handheld infrared thermometer to indirectly estimate moisture from castor plant temperature [4]. Cao et al. (2015) performed a leaf dehydration experiment for a broad number of plant species in order to identify a universal index for detecting plant water status [20]. They found that indices based on the simple ratio and normalized difference of the (1415, 1430 nm) and (1530, 1895 nm) wavelengths were very effective for depicting plant water status. These wavelengths are captured from sophisticated instruments carried by satellites or by hyperspectral cameras mounted on aerial vehicles (planes, helicopters, drones). Satellite information may be freely available, but satellite revisiting time may be too sparse for the scope of monitoring castor ripening while hyperspectral cameras still remain an expensive option that is used mainly in research. There is an imperative need though to establish low-cost, simple-to-use technologies and UAS photogrammetry with low-cost multispectral, thermal or even simple RGB cameras seems to be a suitable solution [21].
The scope of the present work was therefore to evaluate the effects of alternative harvest aids in terminating the castor crop through field measurements and UAS-based remote sensing and investigate the opportunities of using UAS-based remote sensing as a tool for monitoring crop ripening and scheduling mechanical harvest. It is also important to highlight that this study represents the first attempt to apply remote sensing for the prediction of harvesting time of the castor bean and this aspect represents the main innovative feature of the present manuscript.
2. Materials and Methods
2.1. Field Experiment Setup
In 2021 a 0.94ha field in the farm of University of Thessaly, central Greece (39°24′4.84″ N; 22°45′37.65″ E; 68 m asl.) was cultivated with castor industrial hybrid Kaima C1012. The crop was planted on 24 April 2021 by direct drilling at rows 0.75 m apart using 62,300 seeds per ha. Weeds were controlled with glyphosate application ten days earlier at a rate of 5 L per ha. One mechanical operation with a row crop cultivator was also necessary in June to control late growing weeds. The soil type was clayey (47.1 clay 32.7 silt 20.1 sand), with 1.48% OM and PH 7.9. The crop was fertilized with 13 kg N ha−1 and 46 kg P ha−1 before sowing and 58.5 kg N ha−1 throughout the growing period by fertigation. Sprinkler irrigation was applied for the initial emergence and establishment and a drip irrigation system with pipes every second row, was established later. Totally 510 mm of water per ha were applied through irrigation from 5 May 2021 to 13 August 2021 and another 102 mm was received through precipitation. The cultivation practices were uniform all over the field but after 27 August 2021 the field was divided into sixteen plots comprising four crop termination treatments and four replications (Figure 1). The plots were fitted to the somehow irregular shape of the field and their size was 9 m wide by approximately 75 m long. The field terrain was flat (Figure 2).
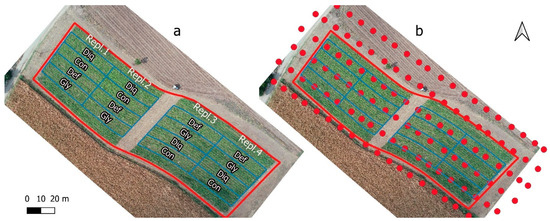
Figure 1.
(a) The experimental field (aerial view from 27 August 2021) with the four treatments (GLY = Glyphosate, DEF = Spotlight®, DIQ = Diquat and CON = Control) and the four replications and (b) the UAS flight plan with the calibrated images position on the same date.
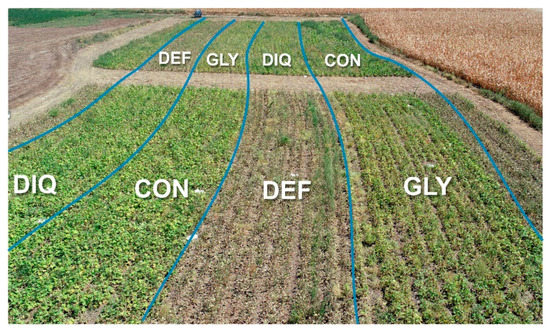
Figure 2.
Field view on 30 August 2021, three days after applying harvest aids in GLY and DEF treatments. (GLY = Glyphosate, DEF = Spotlight®, DIQ = Diquat and CON = Control).
The termination treatments were:
- GLY = Glyphosate herbicide spraying at a dose of 6 l ha−1 on 27 August 2021, about twenty days prior to harvesting.
- DEF = Defoliant Spotlight© BASF spraying at a dose of 6 l ha−1 also at 27 August 2021.
- DIQ = Diquat herbicide spraying at a dose of 5 l ha−1 on 4 September 2021, about ten days prior to harvesting.
- CON = Control treatment. No spraying, ripening followed the physiological process.
The date of application of the desiccants was decided based upon their expected physiological action. Glyphosate employs a systematic action that requires 4 to 20 days (depending on the temperature) to terminate the crop [22]. Authors decided therefore to allow a two-week period for effective action. Diquat acts by contact and requires 1–3 days to terminate the crop [23]. As early termination is associated with seed yield reduction [24] authors decided to postpone the application for one week to allow some extra growing time and on the other hand, avoid a prolonged maturity period until harvest. Spotlight® BASF (a.i. carfentrazone-ethyl) finally is widely used as a cotton defoliant and requires ten or more days depending on the air temperature to act [25]. Authors decided therefore to allow also an adequate two-week period for sufficient performance. All the chemicals were diluted at 400 L ha−1 of water and were applied with a conventional boom-type sprayer with flat fan nozzles operating at 300 kPa.
2.2. Field Measurements
The crop was harvested with a combine harvester on 15 September 2021. After applying the first two harvest aids on 27 August 2021 and until 13 September 2021, plant samples were collected in two to three days intervals. The samples were taken from one randomly selected sampling spot on each plot, each date. The sampling spots were different each time as the measurements were destructive. Each spot included two adjacent rows of the crop at a length of 4 m (3 m2). Seven sampling dates were achieved giving a total of 112 sampling spots. On these points we collected the aerial mass by cutting the plants at ground level. We also separated the capsules from the rest parts (leaves, stems). The samples (stems, leaves and capsules) were weighted fresh with a portable balance in the field and then transferred to the laboratory for oven drying until constant weight was reached. Plant material (leaves or capsules) fell on the ground were not accounted on the present work.
2.3. Remote Sensing
We used two UAS for monitoring the crop after spraying the chemicals. A DJI Phantom 4 Pro quadcopter equipped with its original 4K RGB CMOS camera set at 16 Mpix resolution and a Parrot Bluegrass quadcopter carrying a Parrot Sequoia multispectral 1.4 Mpix camera with four spectral bands (green band at 550 ± 40 nm, red band at 660 ± 40 nm, red-edge band at 735 ± 10 nm and near-infrared band at 790 ± 40 nm) and an irradiance sensor mounted at the top to capture ambient sunlight. Before each flight, the calibration panel provided by Parrot was pictured in order to calibrate all the images during the photogrammetry post-processing. The Pix4D Capture app was used in a smartphone to create automated flight plans (Figure 1). The flights were conducted at a height of 60 m above ground level with cameras pointing at a nadir direction providing a pixel resolution of around 1.6 cm/px for the RGB camera and 7.4 cm/px for the multispectral. The forward and side image overlapping were set at 80%. Flight plans were conducted on the same dates with the ground truth measurements from 12 p.m. to 2 p.m. under full sunlight. One flight was missed on 8 September 2021 due to unsuitable weather conditions. Throughout the remote monitoring campaign, twelve permanent ground control points (GCPs) were established in the field in order to precise georeference the orthomosaics created during post-processing with the Pix4Dmapper software. Consequently, these orthomosaics were uploaded in QGIS 3.22.1 software (QGIS.org, 2021. QGIS Geographic Information System. QGIS Association. http://www.qgis.org, accessed on 13 January 2022) for the estimation of the vegetation indices and further analysis. After some preliminary tests, totally, 19 common vegetation indices were derived from the orthomosaics (Table 1). Eighteen indexes were estimated from the single bands of Sequoia and one index was estimated from the RGB bands of the DJI Phantom 4 K camera. The vegetation indices were depicted as raster images in time series (e.g., Figure 3 for NDVI).

Table 1.
List of vegetation indices estimated from multiband images from the two cameras.
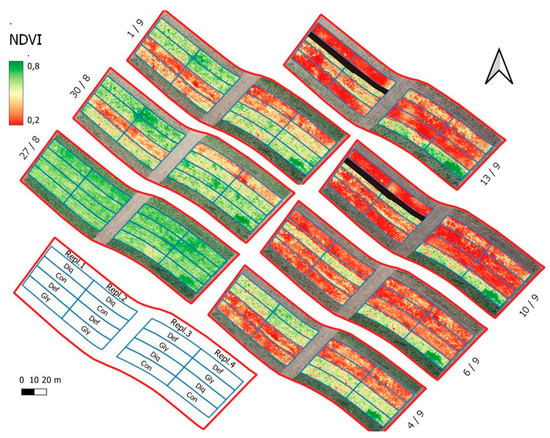
Figure 3.
NDVI raster time series after spraying the harvest aid chemicals on 27 August 2021. The black area appearing in the CON treatment (replications 1 and 2) after 10/9 denotes a region used by the combine harvester for preliminary harvest tests and therefore was excluded from the analysis.
During each sampling date, field markers were placed at the beginning and the end of each ground sampling point in order to distinguish the regions of interest (ROIs) in the RGB and the multispectral images. A polygon vector was drawn thereafter around each ROI to help extract information from the specific region and explore the relationships between remote sense and ground truth data.
2.4. Statistical Analysis
The JASP Computer software Version 0.15 (JASP Team 2021, Amsterdam, The Netherlands) was used for the statistical analysis of the data while charts were built in Microsoft Excel v2110 (Microsoft Corporation, Redmond, WA, USA).
2.5. Weather Data
Figure 4 presents the weather conditions during the application of the chemicals and until harvesting. The data were collected from the local weather station of University of Thessaly.
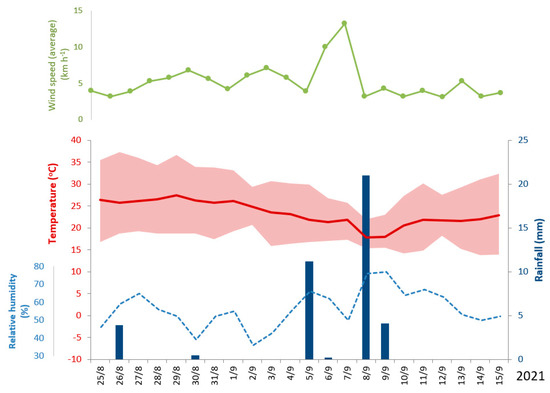
Figure 4.
Weather data for the ripening period. Red line denotes mean daily temperature and shaded area daily minimum and maximum. Columns indicate rainfall events and blue dotted line relative humidity (data from University of Thessaly weather station in Velestino).
3. Results
3.1. Harvest Aid Effects
The experimental findings revealed the alternative patterns of action among the three chemical-induced treatments (Figure 5). Glyphosate (GLY) acted slowly causing gradual desiccation of the crop that indeed required more than two weeks to dry. Diquat (DIQ) presented a rapid effect and plants dried out within four to six days. Opposite to what was expected, the defoliant (DEF) also presented also a rapid effect, and the plants dried out in almost two days while the capsules reached their lower moisture content in four days. Some physiological maturing of the crop was also revealed from the control (CON) treatment, which was most prominent for the capsules during the period 31 August to 4 September 21. The physiological maturing was induced because the last irrigation was applied on 13 August and until the end of August there were no rainfalls (Figure 4). Therefore, plant tissues started to lose water. Two rainfall events occurred however on 5 September and 8 September. These rainfalls triggered some new vegetation and helped the crop recover from the dry period. The phenomenon was more prominent in DEF during the last sampling date (Figure 6). It was also associated with an increase in moisture both in stems and leaves as also with the capsules (Figure 5). Carfentrazone-ethyl apparently had a temporary and not permanent action in terminating the crop. Similar effects were identified for diquat. Chemical products that act on contact often allow the intact tissues such as roots, lower leaves and basal stems to escape the spray, which then survives and stimulate later regrowth [24,41].
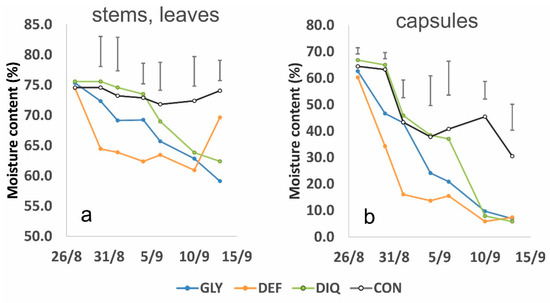
Figure 5.
Changes in moisture content in (a) vegetative (stems and leaves) and (b) reproductive (capsules) plant parts after applying the harvest aids (GLY = Glyphosate 27/8, DEF = Spotlight® 27/8, DIQ = Diquat 4/9 and CON = Control). Vertical bars denote LSD at p = 0.05.
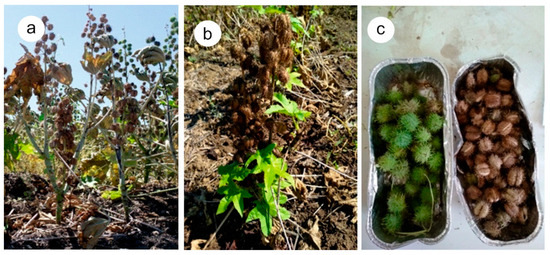
Figure 6.
(a) Castor plants shocked by the chemical in DEF treatment on 30 August 2021. (b) New leaves emerged in DEF treatment on 13 September 2021 (c) Fresh (left) and dry (right) capsules collected from CON and DIQ on 10 September 2021.
During harvesting, in the present study, the capsules of the three harvest aid treatments were sufficiently dry with moistures below 7.5%. The method with the drier capsules was DIQ (moisture content 5.8%) followed by GLY (6.9%) and DEF (7.4%). A significant correlation was also found between the vegetative (stem and leaves) and the reproductive (capsules) organs moisture content (Figure 7). Therefore, the null hypothesis that there is no significant prediction of the dependent variable (capsule moisture) by the predictor variable (stem and leaf moisture) is rejected.
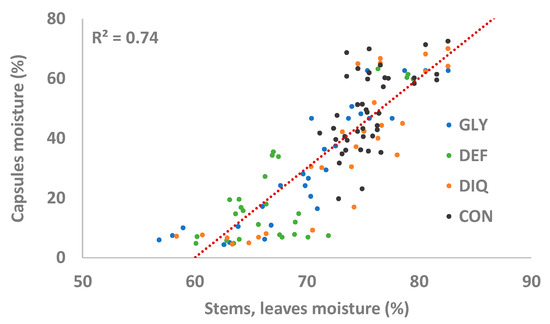
Figure 7.
Relationship between moisture content of stems and leaves and moisture of capsules. Data from the whole monitoring period.
Figure 8 shows the time-series patterns for six vegetation indices during the artificially-induced ripening period. Five of them (NDVI, OSAVI, SIPI2, TVI and VARIgreen presented high correlations with crop ripening while one, NDRE, was chosen for its low correlation for comparison reasons. Comparing these graphs with the drying patterns shown in Figure 5 it is perceived that, with the exception of NDRE, which presented a low correlation anyway, all the other indices closely represent the ripening process. The rapid drop in stem, leaf and capsule moisture in DEF is depicted well by NDVI, OSAVI, SIPI2, TVI and VARIgreen. The new vegetation appearing after 10 September 2021 is also depicted from the five indices and even from NDRE. The VARIgreen also showed a rather earlier response. The rapid drop in capsule moisture after the application of diquat in DIQ was well described from NDVI and VARIgreen while OSAVI, SIPI2 and TVI followed closer the changes in stems, leaves moisture. Glyphosate application in GLY caused a gradual decrease in plant moisture and this was well depicted from all the indices except NDRE. The physiological ripening in CON and the recovery at the end was well depicted by NDVI, OSAVI, SIPI2 and TVI but VARIgreen failed to capture the later change. The spatial differences in NDVI are clearly visualized also in Figure 3.
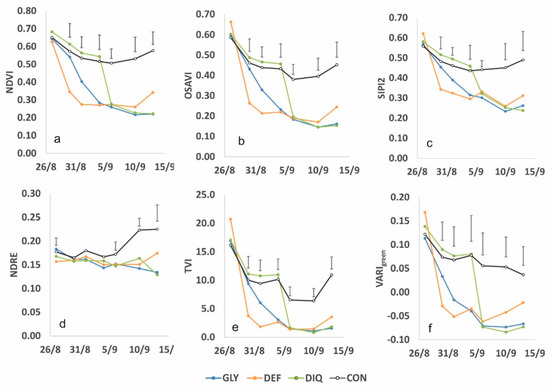
Figure 8.
Changes in selected VIs after applying the harvest aids (GLY = Glyphosate 27/8, DEF = Spotlight® 27/8, DIQ = Diquat 4/9 and CON = Control). Vertical bars denote LSD at p = 0.05. (a) NDVI, (b) OSAVI, (c) SIPI2, (d) NDRE, (e) TVI and (f) VARIgreen.
3.2. Crop Drying Models
The vegetation indices (VIs) derived by processing the UAS images were plotted against the corresponding field measurements on the same ROIs. Table 2 presents the regression coefficients between VIs and stems and leaves and between VIs and capsules. Figure 9 presents the scatter plots of the above relations for three well-performing indices, NDVI, from the first category, TCARI from the second and VARIgreen from the third. The best performance in predicting moisture content of stems and leaves was found for NDVI (R2 = 0.670). NDVI also performed well in predicting capsule moisture content (R2 = 0.760) but OSAVI and SIPI2 performed slightly better (R2 = 0.770 and 0.762, respectively). RDVI also showed some high prediction power both in the stem, leaves and also in capsule moisture content (R2 = 0.643 and 0.756, respectively). The above indices utilize only the near-infrared band (central wavelength 790 ± 20 nm) of the multispectral camera in various combinations with the two visible red and green bands. In indices utilizing combinations of the red-edge band (central wavelength 735 ± 5 nm), such as NDRE and CIred-edge, the performance was significantly reduced and only TVI and TCARI presented some considerable predicting power (R2 for stems, leaves 0.583 and 0.514 and for capsules 0.695 and 0.536, respectively). A remarkably high predicting power was also obtained with VARIgreen derived from the bands of the RGB camera (R2 = 0.546 for stem and leaves and 0.639 for capsules).
Table 2.
Regression coefficients between VIs and moisture content of vegetative (stems % leaves) and reproductive (capsules) plant parts (n = 112).
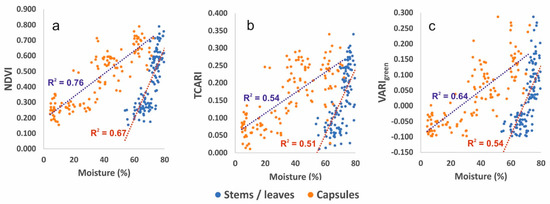
Figure 9.
Scatter plots depicting the relationship between moisture content of plant parts (stems, leaves and capsules) for three representative VIs, NDVI (a), TCARI (b) and VARIgreen (c).
The best performing indices from Table 2 were selected for further testing in models associated with the plant’s moisture. NDVI, OSAVI, SIPI2 and RDVI were chosen from the near-infrared category, TCARI and TVI from the near-infrared/red-edge category and VARIgreen from the category RGB. Consequently, a multiple linear regression method was applied for each VI and an additional parameter that was the days after spraying (DAS, days).
Table 3 presents the results of the multiple regression and the corresponding linear models for the seven selected VIs. The regression coefficients are the constant variables on the general model.
where MC is the moisture content (%) of (x) that denotes stems/leaves or capsules. The stability and predictive power of the models are evaluated through the adjusted R2 and the RMSE, respectively. The R2 for predicting stems/leaves moisture from the NDVI raises from 0.670 to 0.733 when the DAS, is entered into the model. Respectively, R2 for predicting the capsule’s moisture content raises to 0.799 from 0.760. Similar performances were also obtained with all the other VI models. Even TCARI, TVI and VARIgreen that showed a medium performance on a single model (Table 2) presented a considerable improvement (Table 3) when the date of spraying was also encountered. The RMSE was also reduced compared to the single regression models in Table 3 and ranges from 2.88 to 3.04 for stems/leaves moisture estimation and from 8.29 to 9.73 for the capsules (Table 3). Figure 10 shows the verification scatter plots for three representative models, NDVI-based, TCARI-based and VARIgreen-based. The lower RMSE for stems/leaves is justified from the lower range of the moisture drop (from 83% to 57%) while the moisture of the capsules dropped from 72% to 4%. Figure 11 compares the actual measured stems/leaves and capsules moistures with the values predicted from the respective NDVI models from Table 3. It could be assumed that all the treatments were satisfactorily assessed through the respective models for stems/leaves and capsules. The best fit was for GLY and DIQ.
MC(x) = a + b∙VI + c∙DAS
Table 3.
Results of the linear regression analysis for predicting stems/leaves or capsules moisture content (MC) from vegetation indices (VI) and the days after spraying (DAS).
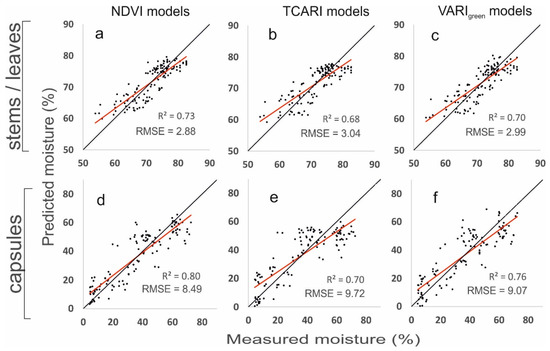
Figure 10.
Relationships between measured moisture content and best model estimates based on NDVI (a,d), TCARI (b,e) and VARIgreen (c,f) models. The black line corresponds to the 1:1 line and the red dotted is the best-fit line.
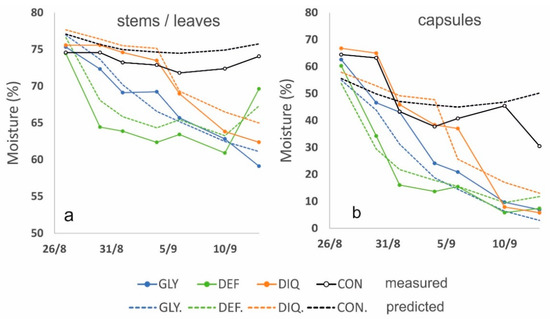
Figure 11.
Changes in moisture content of stems and leaves (a) and capsules (b) for the four alternative treatments. Solid lines indicate the measured values and dotted lines the predicted values from the NDVI model. (GLY = Glyphosate 27/8, DEF = Spotlight® 27/8, DIQ = Diquat 4/9 and CON = Control).
4. Discussion
Monitoring the ripening process in castor crops is very important for scheduling crop harvesting. Plants’ moisture is a crucial factor for determining the optimum time of harvesting and avoiding natural dehiscence from excessive dry fruits or preventing poor cleaning and combining harvester malfunctions due to excessive wet material [7]. Chemical or mechanical interventions are therefore essential for conditioning the crop for mechanical harvesting [11,42]. The time frame after the application might be considerably small as found, for example, by the rapid effects of diquat and Spotlight® and their temporary action. Diquat, in the presence of light, interferes with the photosystem by inducing oxidative stress that causes the destruction of chlorophyll-a inhibition through photosynthesis [23]. Plant tissues turn brown rapidly and plants are killed. Spotlight® BASF (a.i. carfentrazone-ethyl) is a triazolone herbicide, that inhibits, enzyme protoporphyrinogen oxidase (Protox) which is essential for the synthesis of chlorophyll [25]. Photobleaching and necrosis of the foliage are among the visual effects that start in a couple of days [43,44,45]. Nevertheless, their action may be temporary and later regrowth may occur some days later [25,41] as verified for the Spotlight in the present study (Figure 5). On the other hand, Glyphosate implies a slower but more permanent way of action. It acts upon a plant enzyme involved in the synthesis of aromatic amino acids that are vital for protein synthesis and plant growth [22]. While growth ceases within hours, it takes several days for chlorophyll to be destroyed and display visible changes in plant color. Under such varying conditions, frequent crop monitoring is indispensable to avoid escaping the crucial period for harvest. Currently, this is usually carried out by field observations but in the case of large areas with potential variability in crop and soil properties it might be difficult and remote sensing appears to be the only solution. Remote sensing has been widely used for monitoring ripening and scheduling harvest in many crops such as maize [19], wheat [46], tomatoes [47], cotton [48] and many others.
This study is the first attempt to apply remote sensing for the prediction of the harvesting time of castor beans. We evaluated the performance of 19 different vegetation indices obtained by remote sensing with UASs. NDVI presented a high correlation with stems, leaves moisture content while OSAVI and SIPI2 were associated closely with the moisture of the capsules. In general, those VIs utilizing the visible red, green bands in combination with the near-infrared performed better compared with the poor performance when the red-edge band was introduced (with an exception for TCARI and TVI). In the literature, the near-infrared band utilized in NDVI and other indices are assumed to correlate better with crop vigor and green leaf mass [49] while the red-edge used for instance in NDRE presents a higher association with leaf chlorophyll content, so it is more often utilized on estimating nitrogen needs of crops [38,50]. As such, reflectance ratios of 715/505 nm that correspond, respectively, to the red-edge and the cyan to green bands were found highly correlated with total chlorophyll concentrations in castor [51] but currently, this is the only article reporting a remote sensing application for castor. In our study, a remarkable high predicting performance was also obtained for the VARIgreen index derived from the bands of the RGB camera.
As a next step, we tried to integrate the best performing VIs in multiple linear regression models [52] including also the date of spraying as an additional parameter. Similar approaches are commonly used to investigate the impacts of different vegetation indices on various crop traits [53,54]. Indeed, the accuracy of the prediction was increased in all the cases. The time of spraying and the number of days after that, proved to be an important parameter for all the VI models. At a forward step, we made some preliminary tests trying to include some weather parameters such as the mean daily temperature, the relative humidity, the wind speed and the rainfall estimated all in a daily cumulative basis after a specific date and the power of prediction were considerably improved. However, we avoid presenting the results of the present study as weather data from more than one year and/or region are necessary for safe conclusions.
This information used in the present study provides the opportunity to monitor the crop drying process on wide scales if remote sensing information is available. Affordable multispectral sensors such as the Sequoia camera are today widely used in various agricultural applications [55]. Moreover, the ability to use even a simple RGB sensor to extract spectral information for estimating VARIgreen provides the chance for cheaper technical solutions. Satellite data may be another source of remote sensing information, with a benefit that they may be provided in free available sets (such as Sentinel images from ESA) but the frequency of the observations (e.g., 5-day intervals for Sentinels) are not sufficient for capturing the rapid ripening process. However, UAS data may be readily available on any day, given that there are no excessive wind, rain or mist conditions that are rare during the late May–June harvest period. Furthermore, as depicted in Figure 8, a rapid decline of VIs occurs when stem/leaf moisture starts to drop. This suggests that the optimal harvest time is some days later than the rapid decline of VIs, another important point for utilizing UAS to determine the harvesting date.
The prediction of the harvest date is, of course, crucial information that was mainly examined in the present study but several other prospects arise from the results. For instance, scheduling harvesting by selecting the earlier ripening fields and organizing the logistics for handling the production is an important issue for promoting this novel crop. Information about spatial variations in crop drying may be useful for planning local spraying of harvest aids to assist the uniform ripening and optimize the use of chemicals through precise applications. The separate VI patterns from the different chemicals also allow their discrimination from remote sensing data. This might be important for assessing some environmental and health risks such as the cancer risks imposed from the use of glyphosate [56].
5. Conclusions
Remote sensing based on UAS platforms proved to be a valuable tool for monitoring the castor ripening process after the application of harvest aids to terminate the evergreen crop. In particular, the NDVI, OSAVI, SIPI2, RDVI, TCARI, TVI and VARIgreen vegetation indices were all highly correlated (R2 = 0.54–0.77) with the stem/leaf and the capsule moisture content. These indices were incorporated into multiple linear regression models including information from the time of spraying. The models considerably improved the prediction power (R2 = 0.74–0.81) and were able to sufficiently depict the drying process after the application of three alternative harvest aids. The precise monitoring of crop ripening is essential for scheduling the harvest operation for castor, which is highly susceptible to losses if the appropriate but narrow timeframe is missed.
The findings of the present work, though novel, are a first step towards building successful generalized models for predicting castor moisture during ripening. They indicate which VIs are important, the sensors that could be used to retrieve these and explore other important parameters to be included in the equations. These models can be further improved if weather information and additional data from different years, regions, and crop varieties are incorporated.
Author Contributions
Conceptualization, C.C.; methodology, C.C., F.L., W.S., C.K.; software, C.C.; formal analysis, C.C.; writing—original draft preparation, C.C., F.L., W.S., C.K.; writing—review and editing, C.C., F.L., W.S., C.K., L.P., E.A.; supervision, L.P., E.A.; funding acquisition, L.P., E.A. All authors have read and agreed to the published version of the manuscript.
Funding
This research was funded by Horizon 2020 project Magic (grant number 727698).
Institutional Review Board Statement
Not applicable.
Informed Consent Statement
Informed consent was obtained from all subjects involved in the study.
Data Availability Statement
Data are available from the corresponding author and the dataset will be available on a publicly repository after the publication.
Acknowledgments
The authors would like to thank Sandu Lazar for the help in performing the field and laboratory tests.
Conflicts of Interest
The authors declare no conflict of interest.
References
- Ogunniyi, D.S. Castor oil: A vital industrial raw material. Bioresour. Technol. 2006, 97, 1086–1091. [Google Scholar] [CrossRef] [PubMed]
- Pari, L.; Suardi, A.; Stefanoni, W.; Latterini, F.; Palmieri, N. Environmental and Economic Assessment of Castor Oil Supply Chain: A Case Study. Sustainability 2020, 12, 6339. [Google Scholar] [CrossRef]
- Pędzik, M.; Janiszewska, D.; Rogoziński, T. Alternative lignocellulosic raw materials in particleboard production: A review. Ind. Crop. Prod. 2021, 174, 114162. [Google Scholar] [CrossRef]
- Vijaya Kumar, P.; Ramakrishna, Y.S.; Ramana Rao, B.V.; Khandgonda, I.R.; Victor, U.S.; Srivastava, N.N.; Rao, G.G.S.N. Assessment of plant-extractable soil water in castor beans (Ricinus communis L.) using infrared thermometry. Agric. Water Manag. 1999, 39, 69–83. [Google Scholar] [CrossRef]
- Arunkumar, M.; Mohanavel, V.; Afzal, A.; Sathish, T.; Ravichandran, M.; Khan, S.A.; Abdullah, N.A.; Bin Azami, M.H.; Asif, M. A Study on Performance and Emission Characteristics of Diesel Engine Using Ricinus Communis (Castor Oil) Ethyl Esters. Energies 2021, 14, 4320. [Google Scholar] [CrossRef]
- Severino, L.S.; Auld, D.L.; Baldanzi, M.; Cândido, M.J.D.; Chen, G.; Crosby, W.; Tan, D.; He, X.; Lakshmamma, P.; Lavanya, C.; et al. A review on the challenges for increased production of castor. Agron. J. 2012, 104, 853–880. [Google Scholar] [CrossRef]
- Pari, L.; Latterini, F.; Stefanoni, W. Herbaceous Oil Crops, a Review on Mechanical Harvesting State of the Art. Agriculture 2020, 10, 309. [Google Scholar] [CrossRef]
- Polito, L.; Bortolotti, M.; Battelli, M.; Calafato, G.; Bolognesi, A. Ricin: An Ancient Story for a Timeless Plant Toxin. Toxins 2019, 11, 324. [Google Scholar] [CrossRef] [PubMed]
- Maroyi, A. Ricinus Communis. 2007. Available online: https://uses.plantnet-project.org/en/Ricinus_communis_(PROTA) (accessed on 9 November 2021).
- Severino, L.S.; Auld, D.L. A framework for the study of the growth and development of castor plant. Ind. Crop. Prod. 2013, 46, 25–38. [Google Scholar] [CrossRef]
- Severino, L.S.; Freire, M.A.O.; Lucena, A.M.A.; Vale, L.S. Sequential defoliations influencing the development and yield components of castor plants (Ricinus communis L.). Ind. Crop. Prod. 2010, 32, 400–404. [Google Scholar] [CrossRef]
- Tsai, S.Y.; Tseng, W.S.; Wu, C.T.; Lin, C.P. Dwarf-castor oil made into a suitable biodiesel. Procedia Eng. 2014, 84, 940–947. [Google Scholar] [CrossRef][Green Version]
- Colomina, I.; Molina, P. Unmanned aerial systems for photogrammetry and remote sensing: A review. ISPRS J. Photogramm. Remote Sens. 2014, 92, 79–97. [Google Scholar] [CrossRef]
- Jin, X.; Kumar, L.; Li, Z.; Feng, H.; Xu, X.; Yang, G.; Wang, J. A review of data assimilation of remote sensing and crop models. Eur. J. Agron. 2018, 92, 141–152. [Google Scholar] [CrossRef]
- Pittu, V.S.R.; Gorantla, S.R. Image processing system integrated multicopter for diseased area and disease recognition in agricultural farms. Int. J. Control Autom. 2020, 13, 219–230. [Google Scholar]
- Yang, G.; Liu, J.; Zhao, C.; Li, Z.; Huang, Y.; Yu, H.; Xu, B.; Yang, X.; Zhu, D.; Zhang, X.; et al. Unmanned Aerial Vehicle Remote Sensing for Field-Based Crop Phenotyping: Current Status and Perspectives. Front. Plant Sci. 2017, 8, 1111. [Google Scholar] [CrossRef] [PubMed]
- Muñoz-Huerta, R.F.; Guevara-Gonzalez, R.G.; Contreras-Medina, L.M.; Torres-Pacheco, I.; Prado-Olivarez, J.; Ocampo-Velazquez, R.V. A review of methods for sensing the nitrogen status in plants: Advantages, disadvantages and recent advances. Sensors 2013, 13, 10823–10843. [Google Scholar] [CrossRef]
- Kern, A.; Barcza, Z.; Marjanović, H.; Árendás, T.; Fodor, N.; Bónis, P.; Bognár, P.; Lichtenberger, J. Statistical modelling of crop yield in Central Europe using climate data and remote sensing vegetation indices. Agric. For. Meteorol. 2018, 260–261, 300–320. [Google Scholar] [CrossRef]
- Xu, J.; Meng, J.; Quackenbush, L.J. Use of remote sensing to predict the optimal harvest date of corn. F. Crop. Res. 2019, 236, 1–13. [Google Scholar] [CrossRef]
- Cao, Z.; Wang, Q.; Zheng, C. Best hyperspectral indices for tracing leaf water status as determined from leaf dehydration experiments. Ecol. Indic. 2015, 54, 96–107. [Google Scholar] [CrossRef]
- Ezenne, G.I.; Jupp, L.; Mantel, S.K.; Tanner, J.L. Current and potential capabilities of UAS for crop water productivity in precision agriculture. Agric. Water Manag. 2019, 218, 158–164. [Google Scholar] [CrossRef]
- Roberts, T.R.; Hutson, D.H.; Lee, P.W.; Nicholls, P.H.; Plimmer, J.R.; Roberts, M.C.; Croucher, L. Metabolic Pathways of Agrochemicals: Part 1: Herbicides and Plant Growth Regulators; Royal Society of Chemistry: London, UK, 2007; ISBN 1847551386. [Google Scholar]
- Basi, S.; Noga, G.; Hunsche, M. Relevance of the deposit structure for the uptake and bio-efficacy of diquat, as monitored by the spatially resolved chlorophyll fluorescence. Pestic. Biochem. Physiol. 2013, 107, 218–225. [Google Scholar] [CrossRef]
- Oswalt, J.S.; Rieff, J.M.; Severino, L.S.; Auld, D.L.; Bednarz, C.W.; Ritchie, G.L. Plant height and seed yield of castor (Ricinus communis L.) sprayed with growth retardants and harvest aid chemicals. Ind. Crop. Prod. 2014, 61, 272–277. [Google Scholar] [CrossRef]
- Vítek, P.; Novotná, K.; Hodaňová, P.; Rapantová, B.; Klem, K. Detection of herbicide effects on pigment composition and PSII photochemistry in Helianthus annuus by Raman spectroscopy and chlorophyll a fluorescence. Spectrochim. Acta-Part A Mol. Biomol. Spectrosc. 2017, 170, 234–241. [Google Scholar] [CrossRef] [PubMed]
- Rouse, J.W.; Haas, R.H.; Schell, J.A.; Deering, D.W. Monitoring vegetation systems in the Great Plains with ERTS. NASA Spec. Publ. 1974, 351, 309. [Google Scholar]
- Barnes, E.M.; Clarke, T.R.; Richards, S.E.; Colaizzi, P.D.; Haberland, J.; Kostrzewski, M.; Waller, P.; Choi, C.R.E.; Thompson, T.; Lascano, R.J.; et al. Coincident detection of crop water stress, nitrogen status and canopy density using ground based multispectral data. In Proceedings of the Fifth International Conference on Precision Agriculture, Bloomington, MN, USA, 16 July 2000. [Google Scholar]
- Datt, B. Remote sensing of chlorophyll a, chlorophyll b, chlorophyll a+b, and total carotenoid content in eucalyptus leaves. Remote Sens. Environ. 1998, 66, 111–121. [Google Scholar] [CrossRef]
- Datt, B. A new reflectance index for remote sensing of chlorophyll content in higher plants: Tests using Eucalyptus leaves. J. Plant Physiol. 1999, 154, 30–36. [Google Scholar] [CrossRef]
- Daughtry, C.S.T.; Walthall, C.L.; Kim, M.S.; De Colstoun, E.B.; McMurtrey Iii, J.E. Estimating corn leaf chlorophyll concentration from leaf and canopy reflectance. Remote Sens. Environ. 2000, 74, 229–239. [Google Scholar] [CrossRef]
- Haboudane, D.; Miller, J.R.; Tremblay, N.; Zarco-Tejada, P.J.; Dextraze, L. Integrated narrow-band vegetation indices for prediction of crop chlorophyll content for application to precision agriculture. Remote Sens. Environ. 2002, 81, 416–426. [Google Scholar] [CrossRef]
- Qi, J.; Chehbouni, A.; Huete, A.R.; Kerr, Y.H.; Sorooshian, S. A modified soil adjusted vegetation index. Remote Sens. Environ. 1994, 48, 119–126. [Google Scholar] [CrossRef]
- Gitelson, A.A.; Kaufman, Y.J.; Stark, R.; Rundquist, D. Novel algorithms for remote estimation of vegetation fraction. Remote Sens. Environ. 2002, 80, 76–87. [Google Scholar] [CrossRef]
- Rondeaux, G.; Steven, M.; Baret, F. Optimization of soil-adjusted vegetation indices. Remote Sens. Environ. 1996, 55, 95–107. [Google Scholar] [CrossRef]
- Broge, N.H.; Leblanc, E. Comparing prediction power and stability of broadband and hyperspectral vegetation indices for estimation of green leaf area index and canopy chlorophyll density. Remote Sens. Environ. 2001, 76, 156–172. [Google Scholar] [CrossRef]
- Jiang, Z.; Huete, A.R.; Didan, K.; Miura, T. Development of a two-band enhanced vegetation index without a blue band. Remote Sens. Environ. 2008, 112, 3833–3845. [Google Scholar] [CrossRef]
- Chen, J.M. Evaluation of vegetation indices and a modified simple ratio for boreal applications. Can. J. Remote Sens. 1996, 22, 229–242. [Google Scholar] [CrossRef]
- Santana, D.C.; Cotrim, M.F.; Flores, M.S.; Rojo Baio, F.H.; Shiratsuchi, L.S.; Silva Junior, C.A.d.; Teodoro, L.P.R.; Teodoro, P.E. UAV-based multispectral sensor to measure variations in corn as a function of nitrogen topdressing. Remote Sens. Appl. Soc. Environ. 2021, 23, 100534. [Google Scholar] [CrossRef]
- Penuelas, J.; Frederic, B.; Filella, I.; Applications, F. Semi-empirical indices to assess carotenoids chlorophyll a ratio from leaf spectral reflectance. Photosynthetica 1995, 31, 221–230. [Google Scholar]
- Haboudane, D.; Miller, J.R.; Pattey, E.; Zarco-Tejada, P.J.; Strachan, I.B. Hyperspectral vegetation indices and novel algorithms for predicting green LAI of crop canopies: Modeling and validation in the context of precision agriculture. Remote Sens. Environ. 2004, 90, 337–352. [Google Scholar] [CrossRef]
- Trostle, C.L.; Wallace, S.; Texas, A.; Service, M.A.E. Harvest Aid Defoliation and Regrowth Suppression in Castor (Ricinus communis L.) in a Semi-Arid Environment. Available online: https://a-c-s.confex.com/crops/2012am/webprogram/Handout/Paper75401/ASA%20Castor%20Harvest%20Aid%202012.pdf. (accessed on 13 January 2022).
- Costa, A.G.F.; Severino, L.S.; So, V.; Freitas, J.G.; Gondim, T.M.S.; Cardoso, G.D. Pre-harvest desiccation of castor crop using 2,4-D and glyphosate. Ind. Crop. Prod. 2018, 122, 261–265. [Google Scholar] [CrossRef]
- Anastasiadis, B.; Garcia, B.A.; Laffranque, J.P.; Shires, S.W. Carfentrazone-Ethyl (F8426): A New Low-Dose Cotton Defoliant. In Proceedings of the World Cotton Research Conference-2, Athens, Greece, 6–12 September 1998; pp. 1175–1178. [Google Scholar]
- Guangyao, W.; Norton, R.; Lope, S. Choosing Harvest Aid Chemicals. Arizona Cooperative Extensive. 2011. Available online: https://cals.arizona.edu/crop/cotton/files/HarvestAid2vF.pdf (accessed on 13 January 2022).
- Van Saun, W.A.; Bahr, J.T.; Bourdouxhe, L.J.; Gargantiel, F.J.; Hotzman, F.W.; Shires, S.W.; Sladen, N.A.; Tutt, S.F.; Wilson, K.R. F8426-a new rapidly acting low rate herbicide for the post-emergence selective control of broad-leaved weeds in cereals. Brighton crop protection conference, weeds. In Proceedings of the an International Conference, Brighton, UK, 22–25 November 1993; British Crop Protection Council (BCPC): Farnham, UK, 1993; pp. 19–22, ISBN 0-948404-71-X. [Google Scholar]
- Fox, G.P.; Bloustein, G.; Sheppard, J. “On-the-go” NIT technology to assess protein and moisture during harvest of wheat breeding trials. J. Cereal Sci. 2010, 51, 171–173. [Google Scholar] [CrossRef]
- Yang, H. Remote sensing technique for predicting harvest time of tomatoes. Procedia Environ. Sci. 2011, 10, 666–671. [Google Scholar] [CrossRef]
- Ren, Y.; Meng, Y.; Huang, W.; Ye, H.; Han, Y.; Kong, W.; Zhou, X.; Cui, B.; Xing, N.; Guo, A.; et al. Novel vegetation indices for cotton boll opening status estimation using sentinel-2 data. Remote Sens. 2020, 12, 1712. [Google Scholar] [CrossRef]
- Prabhakara, K.; Dean Hively, W.; McCarty, G.W. Evaluating the relationship between biomass, percent groundcover and remote sensing indices across six winter cover crop fields in Maryland, United States. Int. J. Appl. Earth Obs. Geoinf. 2015, 39, 88–102. [Google Scholar] [CrossRef]
- He, L.; Song, X.; Feng, W.; Guo, B.B.; Zhang, Y.S.; Wang, Y.H.; Wang, C.Y.; Guo, T.C. Improved remote sensing of leaf nitrogen concentration in winter wheat using multi-angular hyperspectral data. Remote Sens. Environ. 2016, 174, 122–133. [Google Scholar] [CrossRef]
- Reddy, K.R.; Matcha, S.K. Remote sensing algorithms for castor bean nitrogen and pigment assessment for fertility management. Ind. Crop. Prod. 2010, 32, 411–419. [Google Scholar] [CrossRef]
- Johnson, R.A.; Wichern, D.W. Applied Multivariate Statistical Analysis, 6th ed.; Prentice-Hall: Hoboken, NJ, USA, 2007. [Google Scholar]
- Frels, K.; Guttieri, M.; Joyce, B.; Leavitt, B.; Baenziger, P.S. Evaluating canopy spectral reflectance vegetation indices to estimate nitrogen use traits in hard winter wheat. Field Crop. Res. 2018, 217, 82–92. [Google Scholar] [CrossRef]
- Balaghi, R.; Tychon, B.; Eerens, H.; Jlibene, M. Empirical regression models using NDVI, rainfall and temperature data for the early prediction of wheat grain yields in Morocco. Int. J. Appl. Earth Obs. Geoinf. 2008, 10, 438–452. [Google Scholar] [CrossRef]
- Mesas-Carrascosa, F.J.; Porras, F.P.; Triviño-Tarradas, P.; de Larriva, J.E.M.; García-Ferrer, A. Project-based learning applied to unmanned aerial systems and remote sensing. Remote Sens. 2019, 11, 2413. [Google Scholar] [CrossRef]
- Myers, J.P.; Antoniou, M.N.; Blumberg, B.; Carroll, L.; Colborn, T.; Everett, L.G.; Hansen, M.; Landrigan, P.J.; Lanphear, B.P.; Mesnage, R.; et al. Concerns over use of glyphosate-based herbicides and risks associated with exposures: A consensus statement. Environ. Health 2016, 15, 19. [Google Scholar] [CrossRef]
Publisher’s Note: MDPI stays neutral with regard to jurisdictional claims in published maps and institutional affiliations. |
© 2022 by the authors. Licensee MDPI, Basel, Switzerland. This article is an open access article distributed under the terms and conditions of the Creative Commons Attribution (CC BY) license (https://creativecommons.org/licenses/by/4.0/).