Article

Does the 10-Year Fishing Ban Compensation Policy in the Yangtze River Basin Improve the Livelihoods of Fishing Households? Evidence from Ma’anshan City, China

1
Business School, Ningbo Tech University, Ningbo 315000, China
2
College of Economics and Management, Shanghai Ocean University, Shanghai 201306, China
3
Yangtze River Ecological Protection Strategy Research Center, Shanghai 201306, China
*
Author to whom correspondence should be addressed.
Agriculture 2022, 12(12), 2088; https://doi.org/10.3390/agriculture12122088
Submission received: 31 October 2022 / Revised: 29 November 2022 / Accepted: 2 December 2022 / Published: 5 December 2022
(This article belongs to the Section Agricultural Economics, Policies and Rural Management)

Abstract

:
The implementation of the 10-year fishing ban compensation policy in the Yangtze River basin is the first practice of the river ecological compensation project in China, which has a milestone value to protect China’s ecological sustainability and boost green development. Based on the survey data of 212 retired fishing households in Ma’anshan city, this paper constructs a livelihood capital evaluation system, coupled with coordination model and mobility matrix to analyze the policy effect on participants’ livelihood from the changes of livelihood capital amounts on structure and mobility. The key results are threefold. (1) Policy implementation has significantly raised retired households’ livelihood capital index; (2) The households livelihood capital coupling coordination degree has significantly improved, and the capital structure has transitioned from imbalanced to coordinated; and (3) Households’ livelihood capital exhibits a high mobility, and the gap between rich and poor has been narrowed. This paper theoretically contributes to the research on ecological compensation by providing a more comprehensive perspective of policy effect analysis, and it can also provide a micro level empirical basis for policymakers to optimize the follow-up fishing ban policy.

1. Introduction

In recent years, a series of ecological environmental challenges related to rapid economic development in developing countries have been a widely recognized concern. In the past decades, rapid economic growth and an expanding population have significantly increased China’s food demand, placing considerable pressure on Chinese environmental resources [1,2]. The Yangtze River Basin, which crosses the eastern, middle, and western regions of China, covering one-fifth of the land area, is the third longest river system in the world and the longest river in China [3]. As one of the birthplaces of the Chinese people, it is home to one-third of the Chinese population (more than 0.4 billion) and generates more than 46% of China’s gross domestic product. Owing to its superior ecological environment and rich biodiversity, the Yangtze River Basin has provided numerous ecosystem services for China, supporting the development of China’s freshwater culture and fisheries [4]. The basin has approximately 416 fish species and subspecies, and more than two-thirds of China’s major freshwater aquaculture species are currently distributed in the Yangtze River Basin. In the 1950s, the wild capture fishing fields in the Yangtze River Basin accounted for more than 50% of the nation’s inland fish production, providing a vital food source for local residents [5], which was helpful in to dealing with Chinese hidden hunger issues [6].
The Yangtze River Basin has made enormous contributions to the intensive development of China’s economy and society in the past 70 years, but it has also experienced considerable alteration, environmental challenges, and severe overall stress from human activities [3,7], including damming [8], overfishing [9], water pollution [10], channel engineering [11], and lake reclamation [12], causing the destruction of the ecosystem and generating a decline in fishery resources. The indices of biological integrity in all regions have decreased to “degraded” or “poor”, and several species, such as Dabry’s sturgeon (Acipenser dabryanus), Chinese sturgeon (Acipenser sinensis), and the Finless porpoise (Neophocaena phocaenodies) are now critically endangered [4,13]. By 2021, the current stock of fishery resources in the Yangtze River was about 124,800 tons (42,300 tons in stem stream, 78,400 tons in the Dongting Lake and the Poyang Lake, and 4100 tons in the tributaries), only 27.3% of that in the 1950s. The annual total spawning amount (2019) of the four major Chinese carps (Mylopharyngodon piceus, Hypophthalmichthys molitrix, Aristichthys nobilis, Ctenopharyngodon idella) was only 3.9 and 24.9% of that in the 1960s and 1980s, respectively [14].
The rising ecological problems of the Yangtze River Basin generated severe challenges for the sustainable development of the Yangtze River Basin economic belt, which has attracted considerable attention from the Chinese government. Since 2000, the government has engaged in a series of active explorations of policy protection for the Yangtze River Basin [4]. In 2016, the state proposed a development strategy for the Yangtze River economic belt, to step up conservation of the Yangtze River and stop its over development. With this strategy as a policy orientation, in January 2019, the Ministries of Agriculture, Finance, and Human Resources collaboratively issued a fishing ban policy, establishing a compensatory system in the regions surrounding the key waters of the Yangtze River Basin, clearly communicating that productive fishing would be banned in the designated aquatic life reserve, and fishing would be banned in the river’s main stream and tributaries for 10 years, effective on 1 January 2021. Under the implementation of the policy, fishermen’s fishing appliances and production tools (fishing boats and nets) were recovered, and nearly 300,000 fishermen around the Yangtze River Basin lost their traditional livelihoods.
The aim of the 10-year fishing ban policy is to protect the Yangtze River environment and restore fishery resources. However, a series of benefits to ecological resources and environmental restoration generated by the fishing ban policy belong to the whole society, while a series of losses such as economy and catch are borne by individual fishermen. In this case, there will be a positive ecological externality issue, that is, fishermen’s benefits are less than social benefits. From the perspective of rational economic man, if there is no compensation for retired fishermen, every “rational” fisherman will not retire from fishing, and the collective behavior with positive externalities will be difficult to achieve, which may lead to illegal fishing behaviors. Therefore, it is necessary to compensate for the losses of retired fishermen to achieve external economy internalization. A package of compensation methods was published by local governments, including cash compensation, social insurance, reemployment training, employment subsidies, and housing resettlement to secure and protect retired fishing households’ livelihoods. The implementation of the fishing ban policy has changed the traditional livelihood strategy of fisherman. Whether the compensation methods could improve the livelihood of fishermen needs further exploration.

2. Literature Review

The ecological and environmental issues have brought great challenges to global sustainable development, which has always been the focus of scholars, and the research field involves but is not limited to crop production [15], underwater resources [16], green consumption [17] and livelihood [18]. Ecological compensation is one of the internationally recognized measures of ecological environment management that has been widely practiced around the world [19,20,21], and the compensation method of implementing a fishing ban in the Yangtze River Basin is the first practice of applying ecological compensation measures to river ecological conservation in China. The evaluation of the effects of ecological compensation policy primarily considers both ecological and economic benefits. As the stakeholders of the ecological compensation policy, changes in retired fishermen’s livelihood capital represent a concrete manifestation of the economic benefits of the policy [22]. From the perspective of sustainability, livelihood can be defined as the abilities, assets, and activities required for life [23]. The sustainable livelihood approach (SLA) established by the Department for International Development in 2000 is the mainstream paradigm for analyzing livelihood sustainability [24]. Focusing on vulnerable populations, the SLA expounds on the interaction between the vulnerability background, livelihood capital, livelihood strategy and livelihood outcome: in the uncertain environment created by the vulnerability background, people will choose appropriate livelihood strategies based on the existing livelihood capital to achieve the expected livelihood outcomes, and these livelihood outcomes will act on the livelihood strategy in reverse, resulting in the change of livelihood capital. Karki [25] used SLA to analyze the impact of conservation incentives on farmers’ livelihoods and found that the impact was dependent on household characteristics, access to prior capital, and household social position. Barnes [26] found that the external interventions will affect a community’s livelihood portfolios in a community forest management context. These studies indicate that the livelihood capital is a significant aspect of the SLA framework which can directly reflect farmers’ livelihood levels [27].
Due to promoting ecological conservation and livelihood protection in a “win-win” manner in theory, ecological compensation has gained legitimacy in developing countries [28]. However, in the practices of ecological compensation projects, the policy impact on farmers’ livelihood capital always has two sides. Based on the SLA, various studies have examined the effect of ecological compensation policy on farmers’ livelihood capital. There is evidence that the ecological compensation policy makes a positive impact on farmers’ livelihood. Cherni and Hill [29] studied the impact of renewable energy on the livelihoods of farmers in remote rural areas of Cuba, and found the efficient combination of small-scale renewable energy technologies and government’s sustainable development policies could significantly improve farmers’ livelihood; Hu [30] analyzed the ecological compensation effect on the livelihood capital of farmers in the nature reserve, and indicated that the implementation of ecological compensation policy had significantly improved the livelihood capital level of local farmers. On the other hand, however, the policy effect may be negative. Vista [31] took the Philippine land reform as the research background to analyze the policy impact on farmers’ livelihood, found that the land reform had provided more independent space for farmers to improve their living development prospects and social capital, but had no significant positive impact on livelihood sustainability. Kang et al. [32] indicated that grazing prohibition subsidy policy in China had a positive effect on the improvement of grassland ecological environmental but decreased the overall livelihood capital level in the short term. Furthermore, the ecological compensation project has also produced a significant increase of poor population in high participation rates areas of Mexico [33].
Previous studies have made considerable contributions to understanding ecological compensation’s effects on livelihood capital, which provide good references for evaluating the 10-year fishing ban compensation policy effect. However, the research angle needs to be further expanded to make the evaluation results more comprehensive. The first is the analysis of the changes to fishermen’s livelihood capital structure. According to the sustainability science, the sustainability of farmers’ livelihood capital is not only reflected in the change in total amount, but is closely related to the degree of coupling coordination of livelihood capital. Previous studies primarily focus on quasi-experimental techniques to examine changes in the livelihood capital index before and after policy implementation, but lack further investigations regarding capital structure. The second analytical approach focuses on capital mobility. From the perspective of welfare economics, implementation of the ecological compensation policy is often accompanied by a poverty reduction effect, and various policies elicit differing policy effects [34,35,36]. The effectiveness of the ecological compensation policy is also reflected in whether it narrows the gap between the rich and the poor and advances social equity and common development [37]. What are the differences and characteristics of retired fishermen’s livelihood capital mobility in the implementation of ecological compensation in the Yangtze River Basin? Does the policy narrow the gap between the rich and the poor? Answering these questions is critical to strategically refining and developing such ecological compensation policies in China.
According to this, we examine the retired fishing households of Ma’anshan City of Anhui province and try to analyze the fishing ban compensation policy effect from more comprehensive perspectives: the total amount, structure and mobility changes of livelihood capital. Specifically, we construct a livelihood capital index evaluation system suitable for retired fishing households first, and analyze the index changes before and after the implementation of ecological compensation policy in the Yangtze River Basin. We then endeavor to construct a coupling coordination degree model and mobility matrix of livelihood capital for further analysis of the changes of livelihood capital structure and mobility. This study strengthens the comprehensive understanding of the effects of the fishing ban policy and provides a micro level empirical basis for policymakers to optimize the follow-up fishing ban policy. It can also offer practical insights for policymakers to design the ecological conservation policies of inland rivers in other developing countries.

3. Data and Methodology

3.1. Data and Resources

Ma’anshan is located in the lower reaches of the Yangtze River, and is one of the important steel industry bases in China (Figure 1). A large number of chemical industries are also densely distributed along the river, generating severe pollution in the city and the Yangtze River Basin. The contradiction between economic development and environmental protection has become the primary factor restricting urban development. In response to national policies to restore the ecological environment of the Yangtze River Basin, the Ma’anshan government has comprehensively rectified illegal docks, polluting enterprises, solid waste dumps, and breeding farms along the river, taking the lead in implementing the fishing ban policy in May 2019, and setting an excellent example in fishing ban areas. Fishermen in Ma’anshan are representatives of typical traditional fishermen in the Yangtze River Basin who have been living on boats and fishing for a living for generations.
The survey was conducted in two retired fishing resettlement communities in November 2020, located in the Bowang district and Dangtu County of Ma’anshan. Based on a random sampling strategy, face to face interviews and questionnaire surveys were conducted with 219 random householders by ten researchers with expert training, and the questionnaire content included five livelihood capital status of the retired fishing households before and after the implementation of the fishing ban policy (2018 and 2020). Each questionnaire took at least 30 min. Seven questionnaires were excluded because of missing data, resulting in 212 valid questionnaires.

3.2. Variable Definition and Measurement

3.2.1. Evaluation System of the Livelihood Capital Index

The livelihood capital index is a quantitative reflection of livelihood sustainability. Capital evaluation examines five specific forms of natural, financial, material, human, and social capital. It is necessary to adjust the specific evaluation indicators according to the study regions’ actual circumstances, differences, and unique characteristics [38]. Traditional fishermen do not have cultivated land, forestland, or water claims, and their traditional natural capital of fishery resources in the Yangtze River was lost following the implementation of the fishing ban, with all of the transitioning to non-agricultural livelihood strategies. Consequently, this paper does not include natural capital in the capital evaluation system, instead integrating psychological factors into the system to evaluate these effects on livelihood sustainability [39]. Combined with previously validated livelihood capital index evaluation methods [40,41], we used human, physical, financial, social, and psychological capital as the main aspects of retired fishermen’s livelihood capital evaluation index, and selected the factors mainly affected by the policy as secondary indicators (Table 1): health and professional skills are the measurement indicators of human capital; physical capital includes residential area, durable consumer goods, and transportation; financial capital is measured by annual household income, household savings, medical insurance, and endowment insurance loans; social capital measures include the level of intimacy with relatives and friends, cadres, and communities; and psychological capital evaluates subjective well-being and the sense of living crisis as the measurement indicators.

3.2.2. Livelihood Capital Index Measures

The retired fishermen’s livelihood capital is calculated according to the constructed livelihood capital evaluation index. Because of variations in the dimension, order of magnitude, and change range of the evaluation indicators, and to maintain the relative gap between quantitative values before and after policy implementation, the min–max standardization method is used to homogenize the quantitative values of the evaluation indices:
Z λ i j t = X λ i j t X min X max X min
where Xλijt represents the jth index in λth livelihood capital of fisherman i in period t; Xmax and Xmin are the maximum and minimum values of the jth indicator for all fishermen; and Zλijt is the standardized indicator value.
A combination weight approach based on entropy and coefficient of variation methods is used to evaluate the combination weight of each index.
The entropy method is as follows:
P λ i j t = Z λ i j t t i Z λ i j t
e λ j = 1 ln r n t i P λ i j t ln P λ i j t
d λ j = 1 e λ j
G λ j = d λ j j d λ j
In Formulas (2)–(5), Pλtij represents the specific gravity of the jth indicator in the λth livelihood capital of fisherman i in period t; eλj is the entropy of the jth indicator in the λth livelihood capital; dλj is the entropy redundancies of the jth indicator in the λth livelihood capital; Gλj represents the weight of each index in the λth livelihood capital; n is the amount of research objects; and r represents the two periods before and after policy implementation, which equals 2.
The coefficient of variation method is as follows:
V λ j = σ λ j Y λ j
H λ j = V λ j i V λ j
In Formulas (6) and (7), Vλj represents the variations coefficient of the jth indicator in the λth livelihood capital; σλj is the standard deviation of each indicator in the λth livelihood capital; Yλj is the mean value of each indicator; and Hλj is the weight of the jth indicator in the λth livelihood capital.
The combination weight of each index for each form of livelihood capital is calculated using Formula (8):
W λ j = α G λ j + ( 1 α ) H λ j
where α is an equalization coefficient, which equals 0.5, and W λ j is the combination weight of the jth indicator in the λth livelihood capital.
The index of each form of livelihood capital is calculated using Formula (9):
S λ i t = j Z λ i j t × W λ j
where S λ i t represents the index of each form of livelihood capital of fisherman i in period t.
The total index of livelihood capital is calculated based on the previously introduced livelihood capital factors. To reduce the impact of livelihood capital endogeneity and render calculation results more consistent with the effect of livelihood capital composition on livelihood sustainability, this study does not use the simple sum average method of the index of five forms of livelihood capital applied in previous studies, instead calculating the pentagon area of livelihood capital to reference the total livelihood capital index [42] (Formula (10)).
G i t = ( H i t × P i t + P i t × F i t + F i t × S i t + S i t × P S i t + P S i t × H i t ) × sin α 2
where Git is the total index of livelihood capital of fisherman i in period t; Hit, Pit, Fit, Sit, and PSit are the indices of each form of capital of fisherman i in period t; and α is the degree of the angle between adjacent forms of livelihood capital in the livelihood pentagon, which equals 72° (360°/5).

3.2.3. Coupling Coordination Degree Measures

In the field of physics, coupling refers to a phenomenon in which two or more elements influence one another through various interactions. Coupling degree describes the level of interaction between elements in a system, and coordination degree measures the level of harmony and consistency between the elements during the development process. In the SLA framework, the various forms of livelihood capital interact with others, working in conjunction to advance livelihood sustainability. Therefore, fishermen’s livelihood sustainability not only requires considerable livelihood capital, but also necessitates effective coupling coordination between each capital form. We define this degree of interaction, mutual influence, and coordinated development among the five forms of capital as the livelihood capital coupling coordination degree, introducing the following model:
C i t = 5 × i = 1 5 S λ i t i = 1 5 S λ i t 5 1 5
T i t = λ β i S λ i t
D i t = C i t × T i t
In Formulas (11)–(13), Cit is the livelihood capital coupling degree of fisherman i in period t; Tit is the comprehensive score; βi is the weight of each capital form in Tit, wherein we hold each of the five forms of capital are equally important, and each β equals 0.2; and Dit is the value of livelihood capital coupling coordination degree of fisherman i in period t. The coupling coordination degree is divided into the following 10 levels (Table 2).

3.2.4. Livelihood Capital Mobility Measures

Based on changes in the total amount and structure of the forms of capital, we conduct further evaluation of the effect of the policy on capital mobility. The mobility matrix of livelihood capital was constructed to investigate the relative changes in capital levels in two periods (Formula (14)). Specifically, we first rank retired fishing households in ascending order of the total livelihood capital index in each period, dividing each into five levels of low, medium-low, medium, medium-high, and high. When the fishermen are in different groups in the two periods, this indicates an order change in the livelihood capital index. Comparing the differences in different periods can reflect the change in livelihood capital mobility.
P ( x , y ) = [ P i j ( x , y ) ] R + m × m
where Pij(x,y) is the probability that fishermen from group level i (before policy implementation) change to level j (after policy implementation); m is the number of livelihood capital group levels; and x and y are the total livelihood capital index of fishermen before and after policy implementation, respectively. The mobility measurement parameters selected in this paper include the chi-square index, the inertia ratio, the relative mobility ratio, and average moving position (Table 3).

4. Results

4.1. Capital Index of Retired Fishing Households

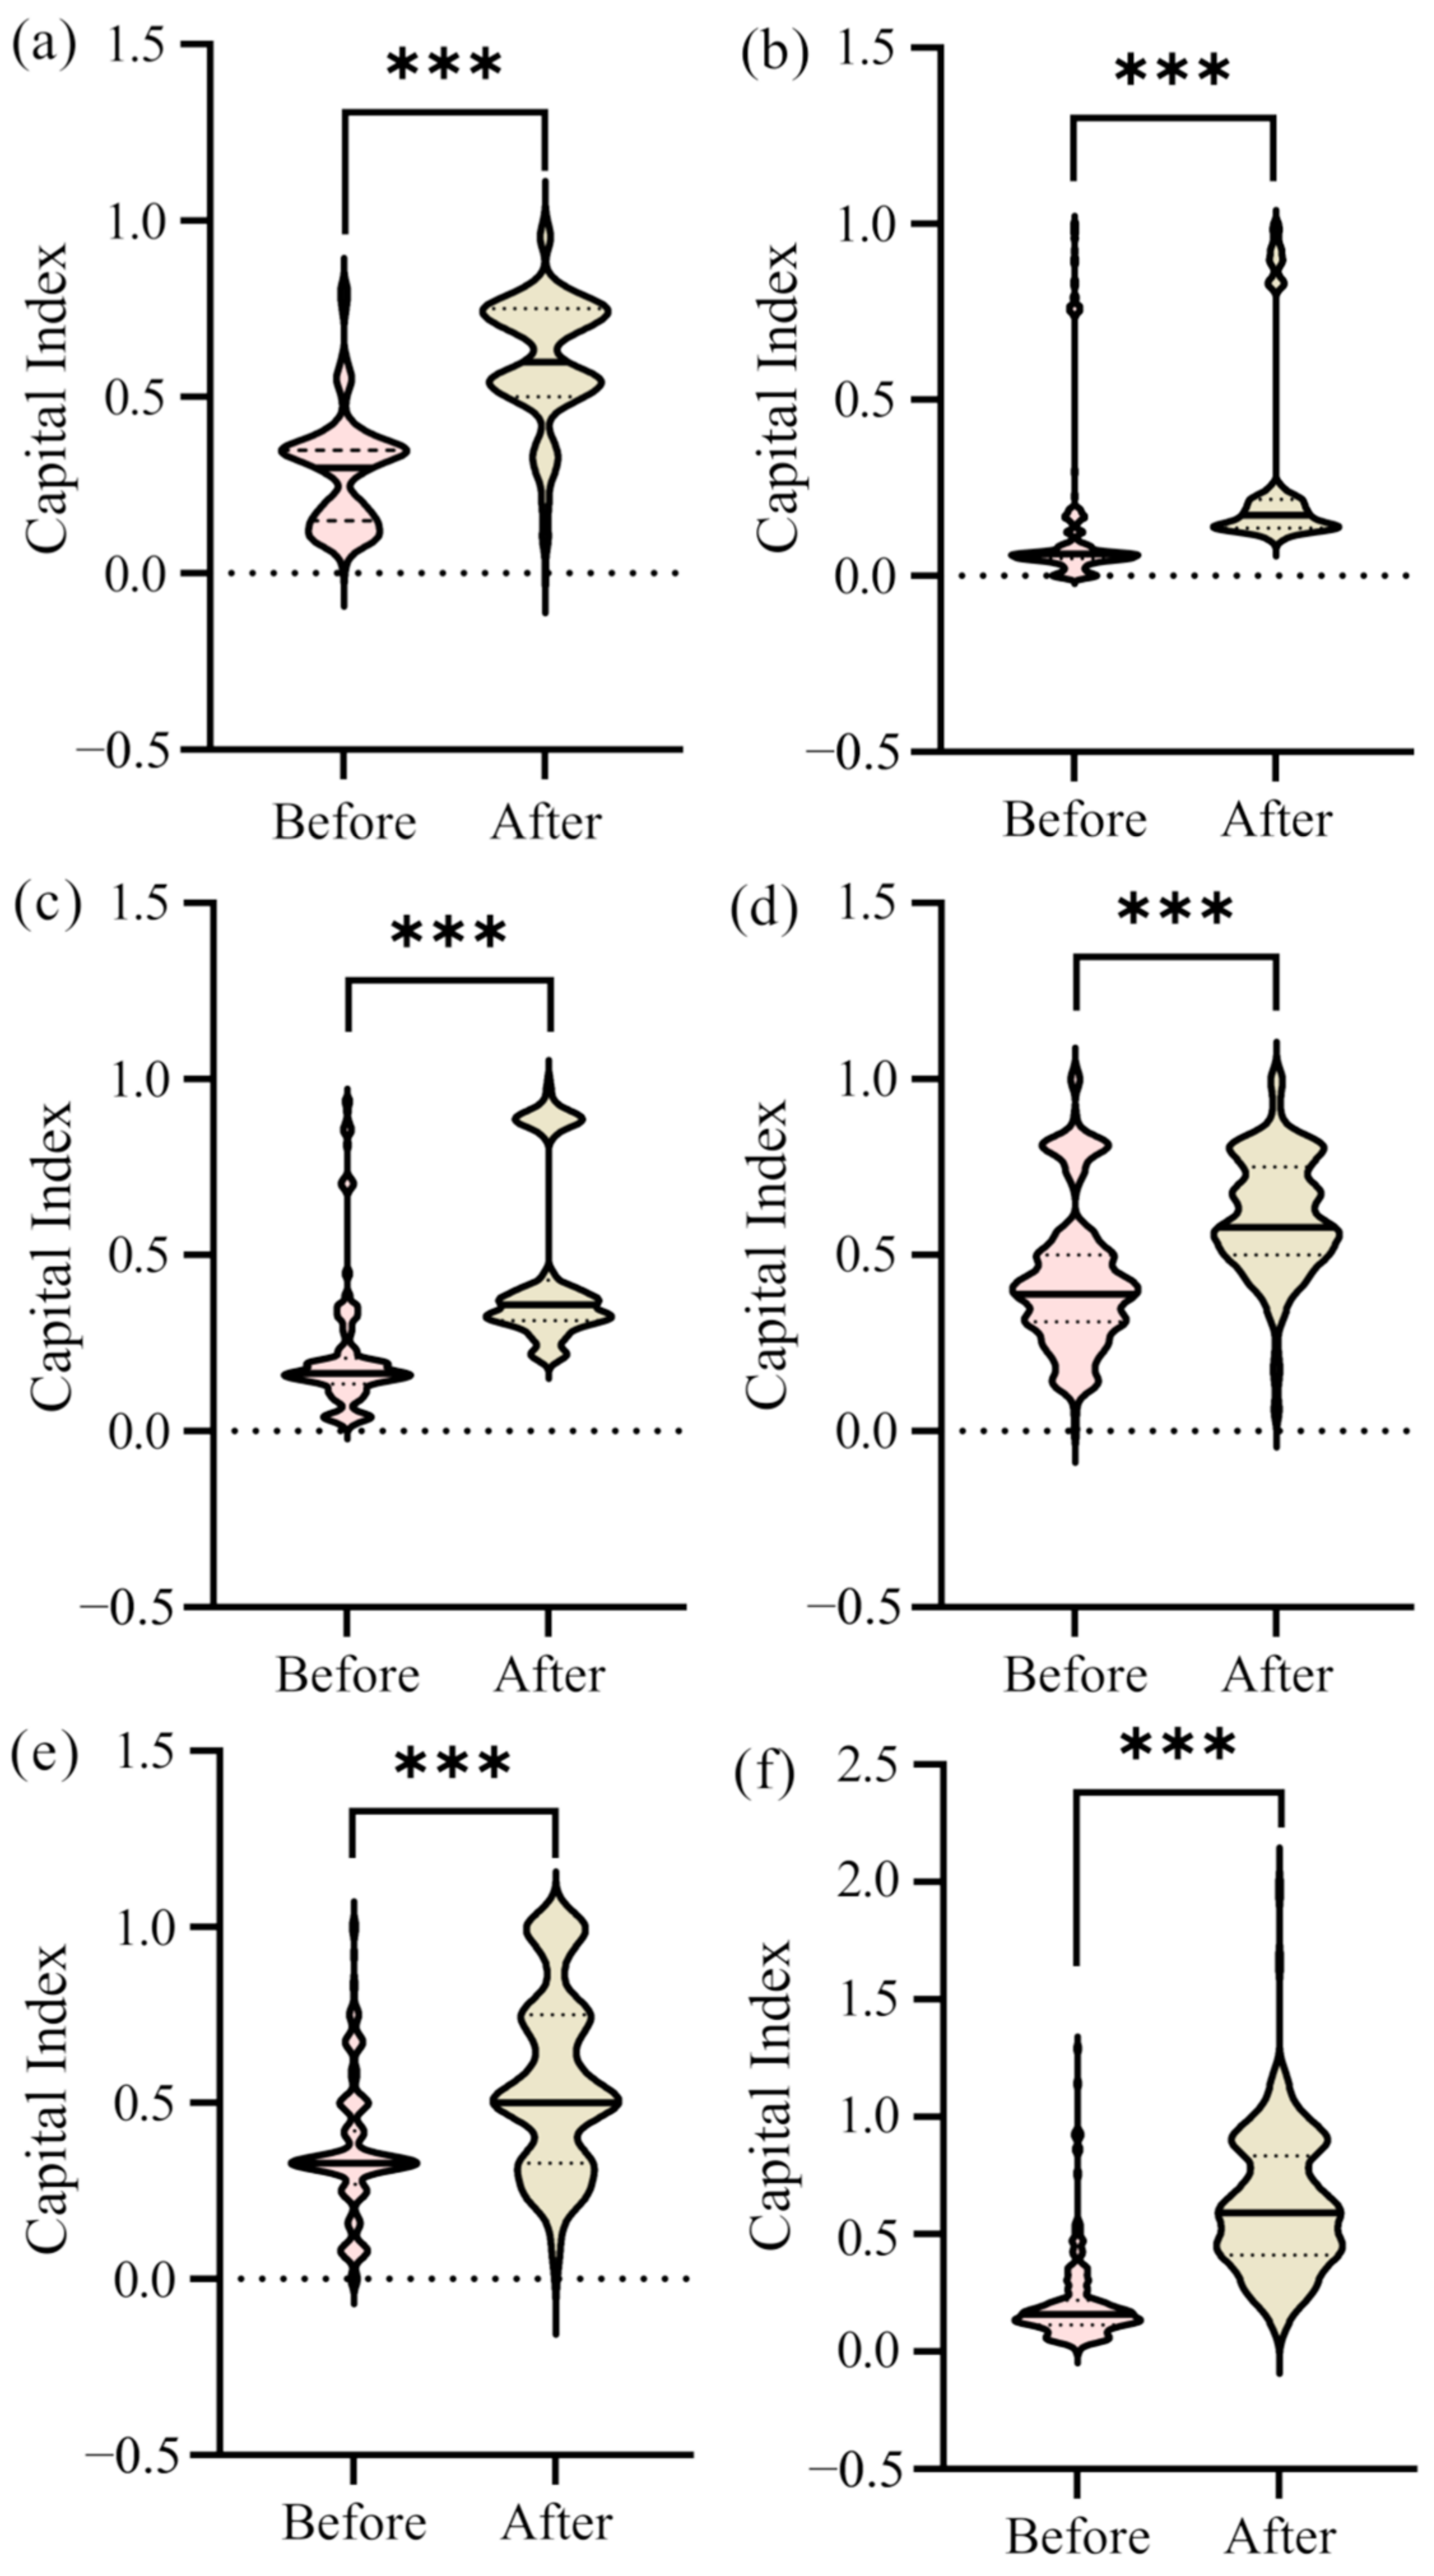
The Wilcoxon signed-rank test is used to analyze retired fishermen’s different livelihood capital indices (SPSS20.0). The results reveal significant differences in different capital indices in the two periods, indicating that each livelihood capital index has been significantly improved after retirement (Figure 2). In particular, the median of total livelihood capital index (f) increased from 0.158 to 0.591. In terms of individual forms of capital, the human capital index (a) increased the most, and the median index rose from 0.300 to 0.599; the median index of material capital (b) rose from 0.062 to 0.173; the median index of financial capital (c) rose from 0.164 to 0.359; and the median index of social (d) and psychological (e) capital increased from 0.389 and 0.329 to 0.578 and 0.500, respectively.
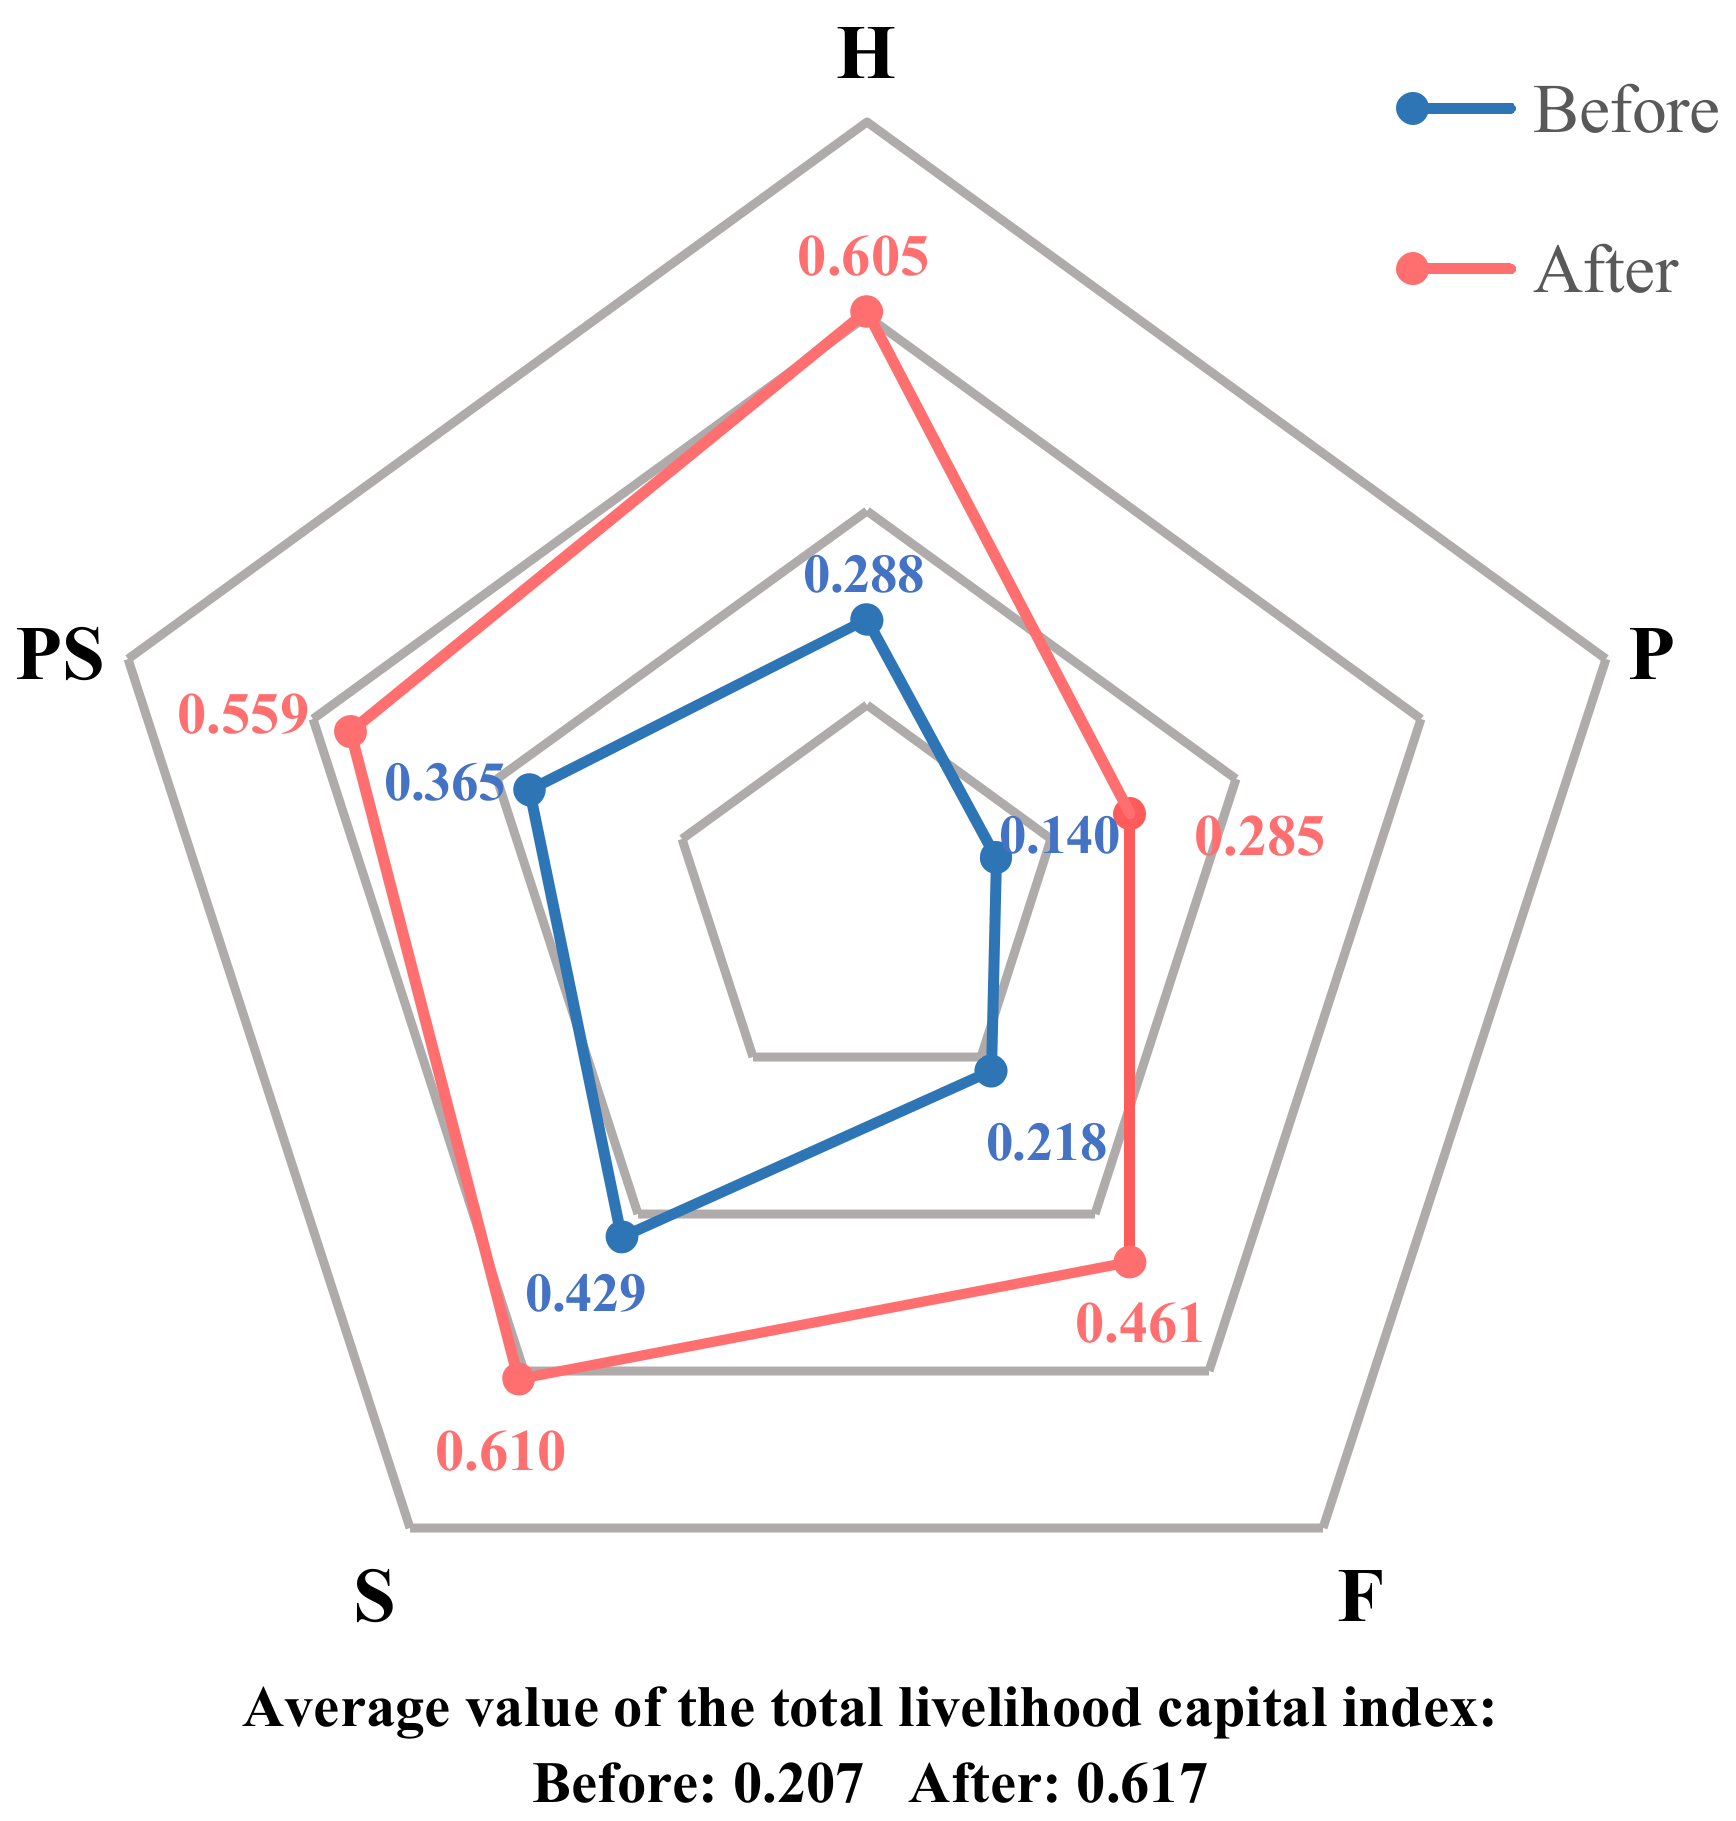
Figure 3 demonstrates that retired households’ livelihood capital characteristics have significantly changed in the two periods. Prior to retirement, the average value of the total livelihood capital index is 0.207; the order of the individual capital average indices is social capital (0.429) > psychological capital (0.365) > human capital (0.288) > financial capital (0.218) > material capital (0.140); and the capital pentagon reveals the domination of social capital. After retirement, the average value of the total livelihood capital index increased to 0.617, and the ranking order of the average value of each form of livelihood capital is social capital (0.610) > human capital (0.605) > psychological capital (0.559) > financial capital (0.461) > material capital (0.285). The characteristics of the capital pentagon has changed to social–human capital dominant. Notably, the material capital index remains at the lowest level in the two periods.
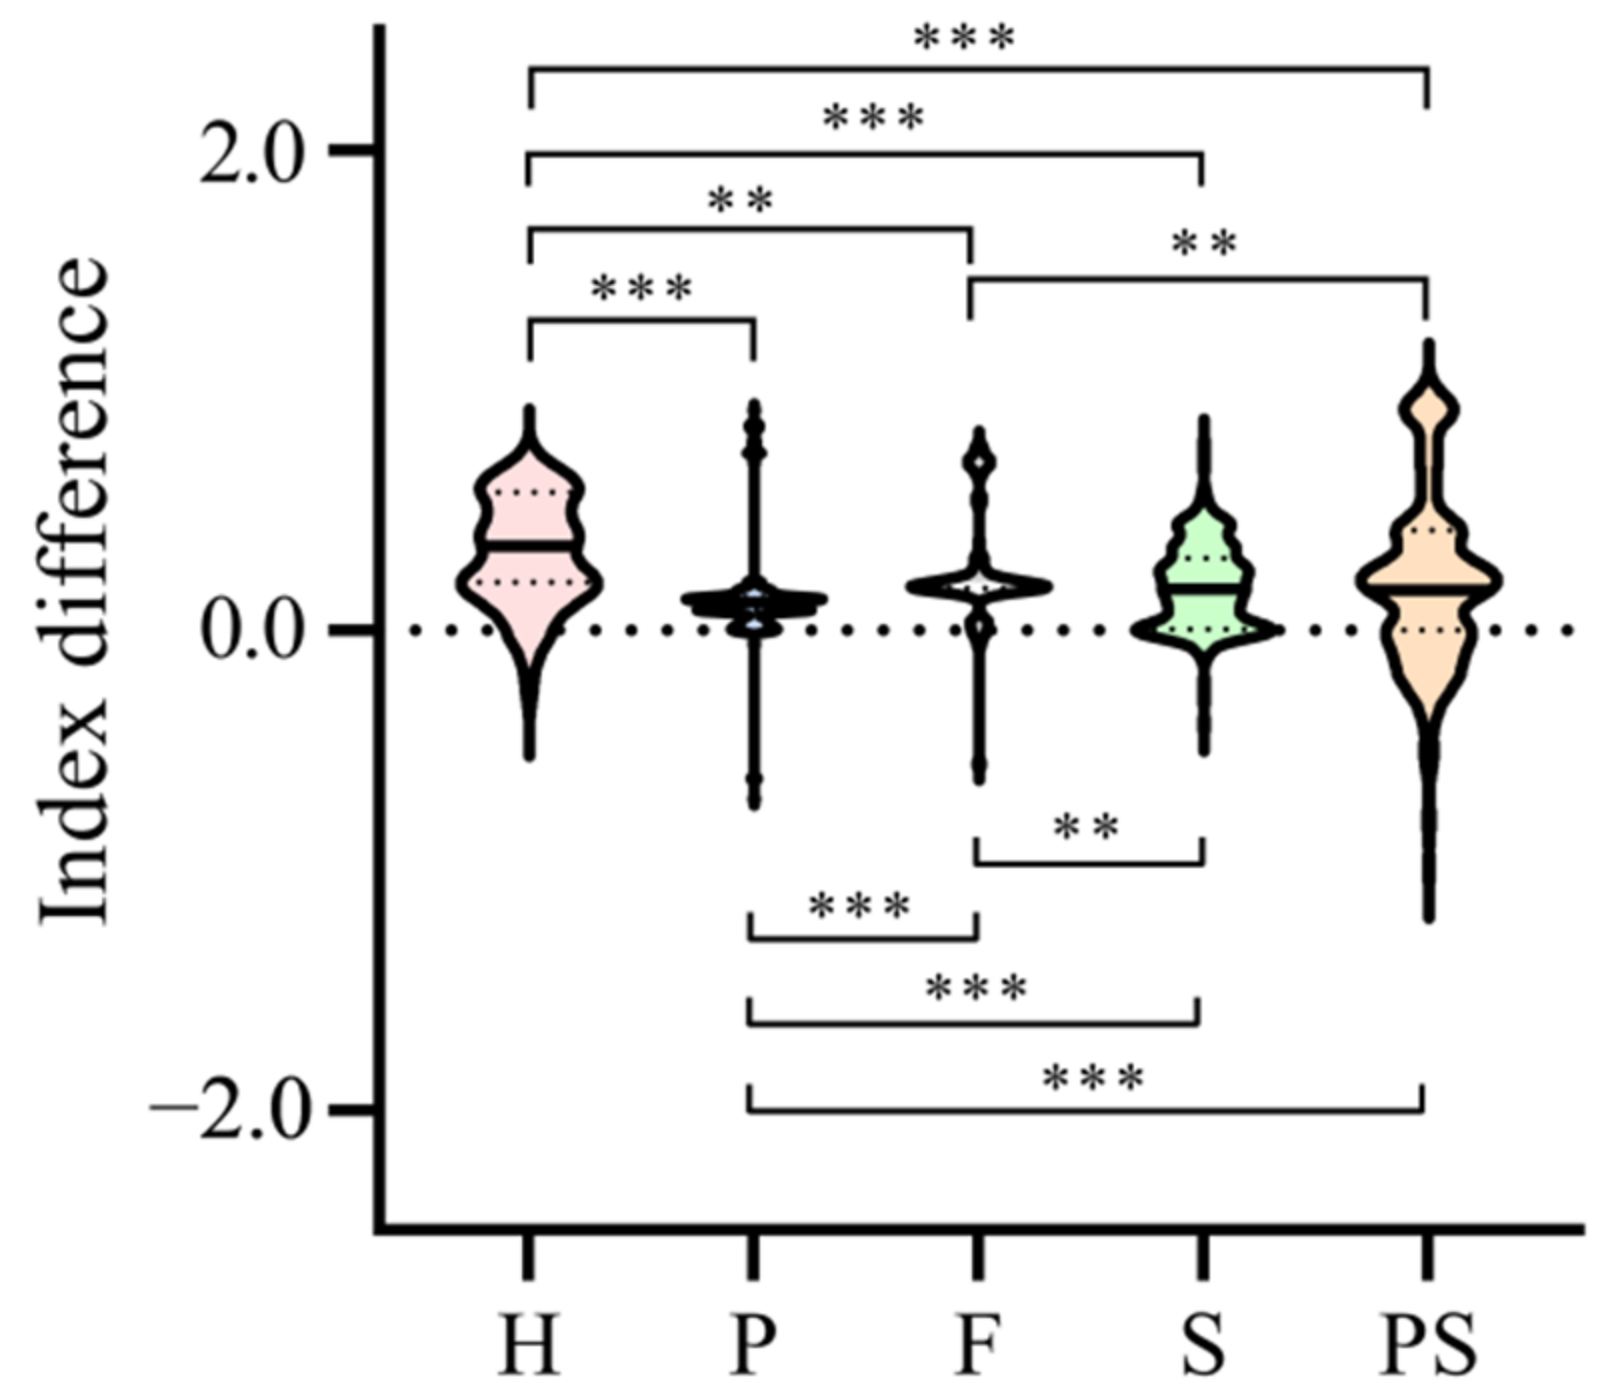
To further examine the policy’s effect on different forms of livelihood capital, the Kruskal–Wallis H test is used to analyze differences in individual capital increments. As shown in Figure 4, the median increment of human capital is 0.351, which is significantly higher than the other four capital increments. The median value of the material capital increment is the lowest, at only 0.116, which is significantly lower than the others. The median increment of financial capital is 0.177, which is significantly higher than social capital and psychological capital. The median value of social and psychological capital increments are 0.172 and 0.171, respectively, with no significant difference between them.

4.2. Livelihood Capital Coupling Coordination Degree

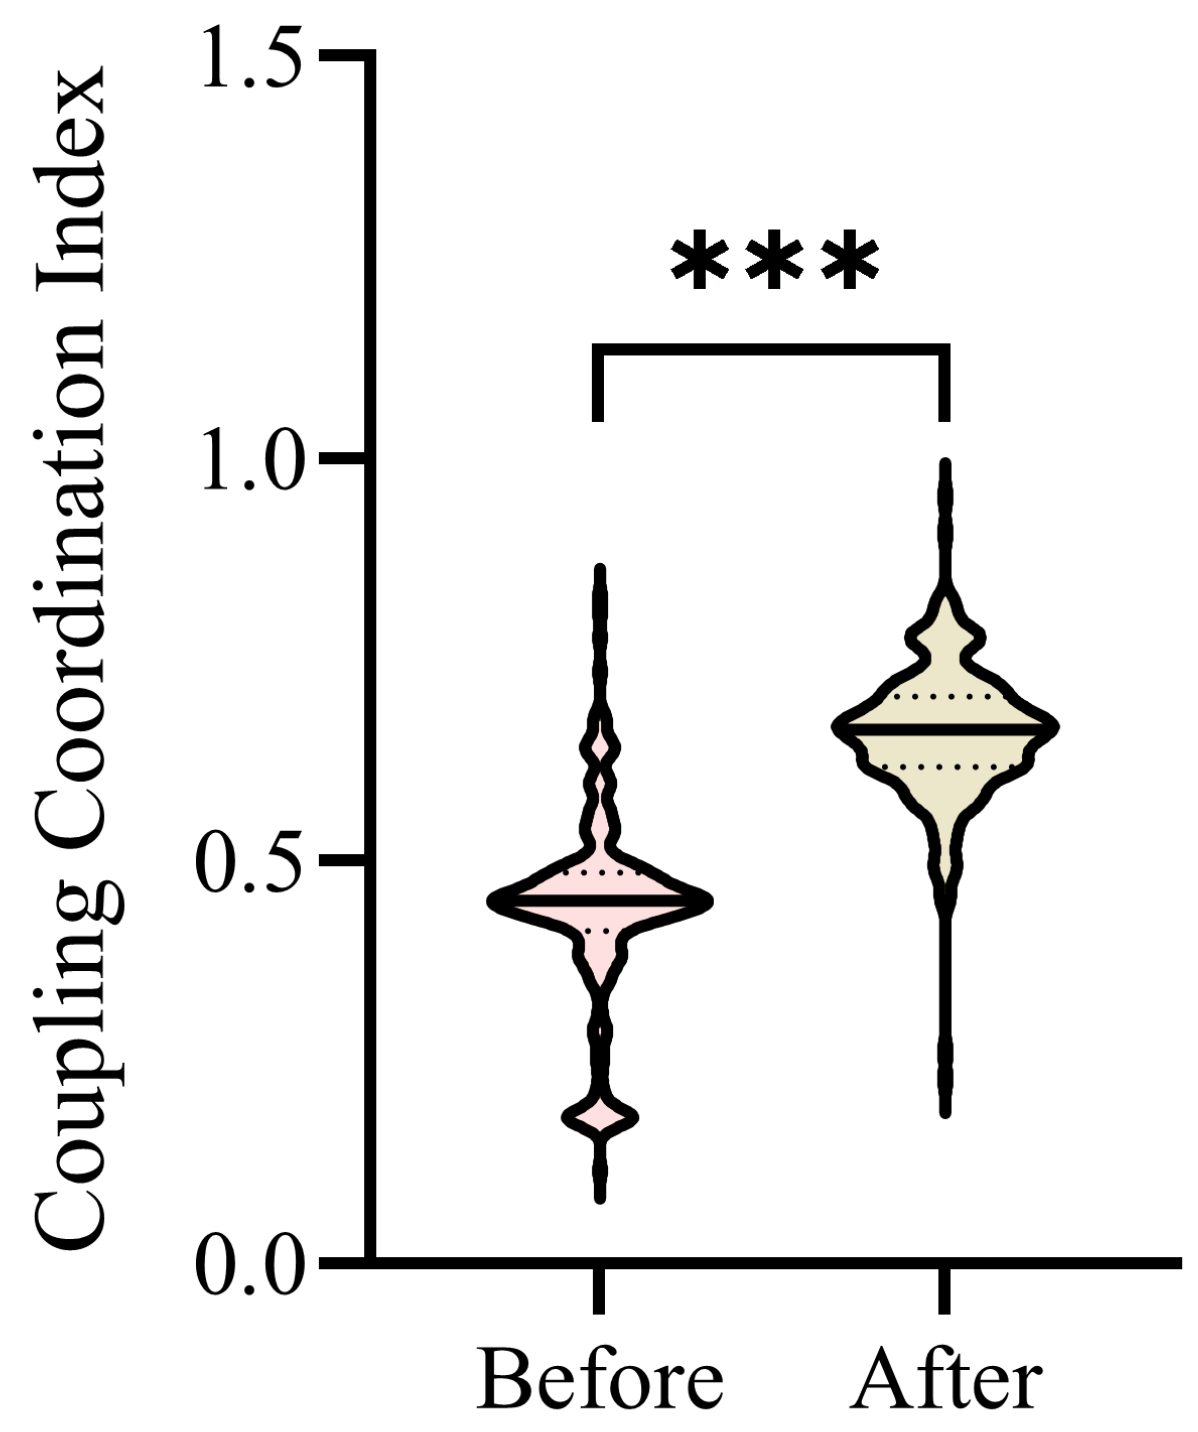
The Wilcoxon signed-rank test is used to analyze the difference in the coupling coordination degree index of livelihood capital. The results indicate a significant difference in the degree of coupling coordination in the two periods, with a median index increase from 0.451 to 0.663 (Figure 5), demonstrating that the compensation policy has significantly improved the coupling coordination degree of the livelihood capital of retired fishing households.
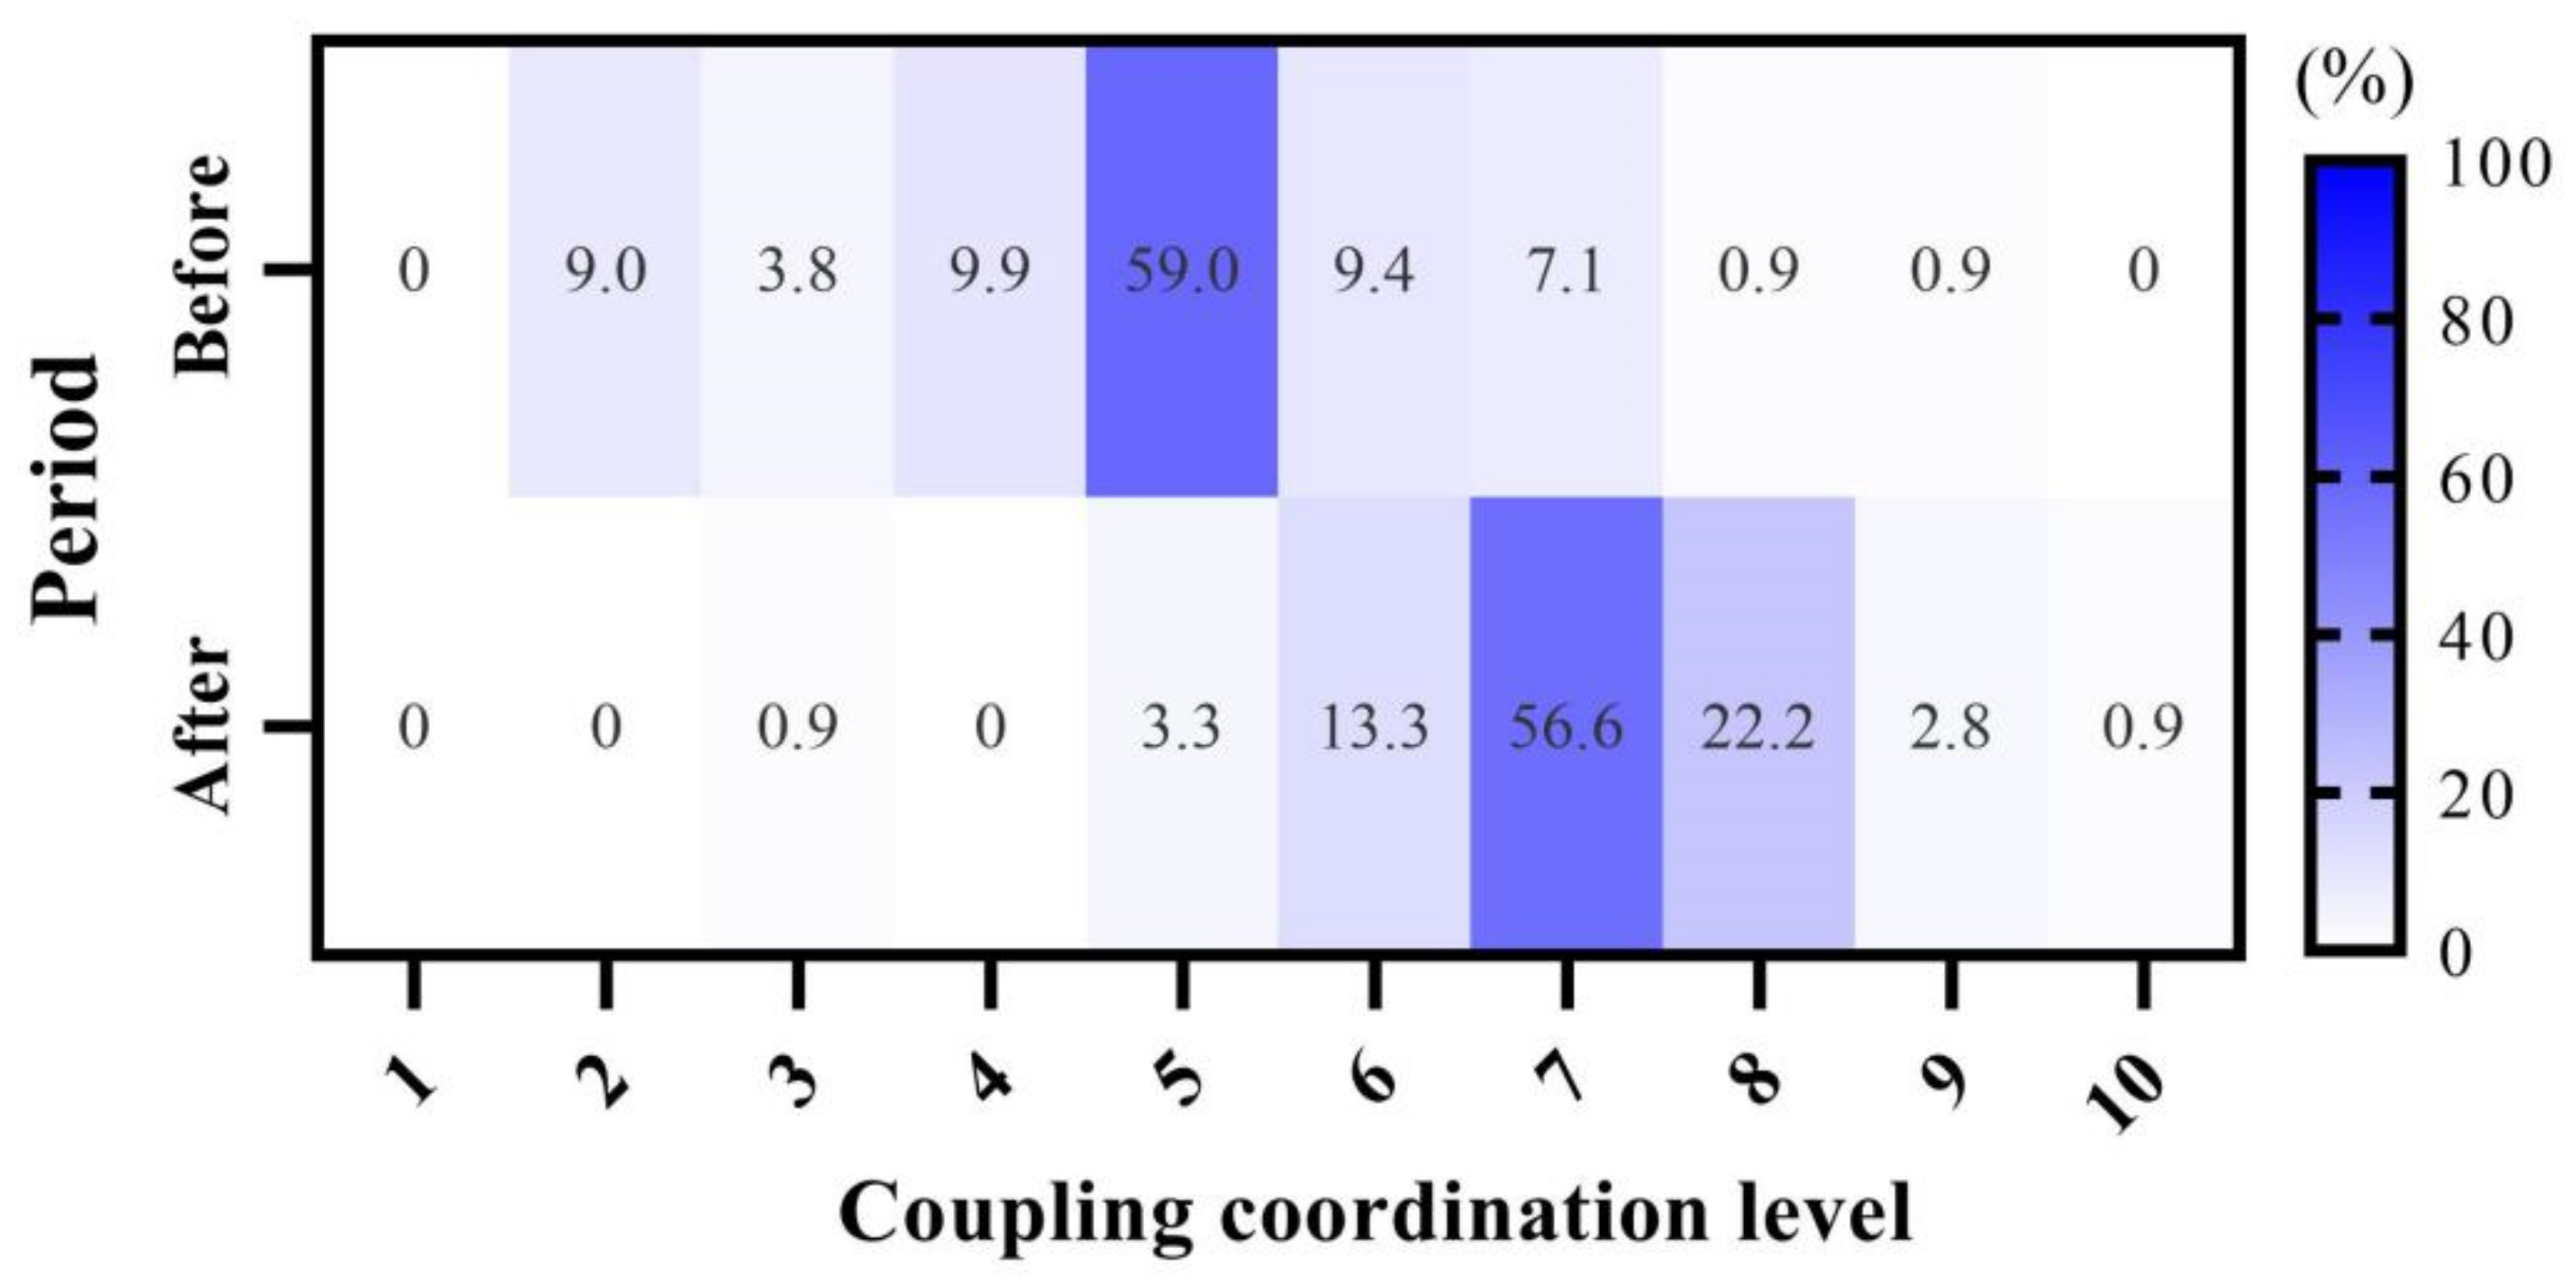
According to the distribution of households’ level of coupling coordination (Figure 6), 81.7% of the fishing households’ livelihood capital were at the imbalanced level prior to retirement. Among them, 9% were seriously imbalanced, 3.8% were moderately imbalanced, 9.9% were mildly imbalanced, and more than half were slightly imbalanced. After retirement, only 4.2% of the households’ livelihood capital is imbalanced, with more than 90% of households’ livelihood capital coordination falling between barely and moderately coordinated levels, with households at the primary coordination level accounting for the highest proportion, at 56.6%. Overall, the livelihood capital of retired fishing households has transitioned from imbalanced to coordinated.

4.3. Livelihood Capital Mobility

The retired fishing households’ livelihood capital mobility is presented in Figure 7. Ranking from low to high, the ratios of households’ maintaining the original livelihood capital order are 0.262, 0.310, 0.143, 0.163, and 0.442. Overall, the low and medium-low capital group exhibit “bottom to top” liquidity characteristics. Among them, the low livelihood capital group exhibits the highest upward mobility, with a 0.738 ratio of mobility. The medium-low livelihood capital group’s upward mobility ratio is 0.595, with a downward mobility ratio of only 0.095. The liquidity characteristics of the medium and above livelihood capital groups are “top to bottom”. Specifically, the upward mobility ratio of the medium group is 0.286, and the downward mobility ratio is 0.571. The downward mobility ratio of the medium-high livelihood capital group is 0.790, and the upward mobility ratio is only 0.047, while the downward mobility ratio of the high group is 0.558.
The relative mobility calculation results based on the livelihood capital flow matrix are presented in Table 4. In terms of mobility, the chi-square index and inertia ratio of livelihood capital mobility are 1.305 and 0.262, respectively, indicating that retired households’ overall livelihood capital mobility is high. In terms of flow direction, the relative mobility ratio is 0.826, indicating that the proportion of households with upward mobility in livelihood capital is less than those with downward mobility. From the perspective of mobility structure, the value of the average moving position is 1.852, indicating that most households’ livelihood capital mobility is a leapfrog change.

5. Discussion

Previous studies indicate that the implementation of ecological compensation policies will significantly improve policy participants’ overall livelihood capital level [31]. The improvements are not only reflected in the changes of livelihood capital indices, but also in the changes to the structure and mobility. First, a significant increase in the livelihood capital index demonstrates that the policy has a positive effect on promoting livelihood sustainability, which is specifically reflected in four aspects, as discussed below.
(1)
Optimization and reorganization of human capital, which are reflected in the diversification of household professional skills and health improvement. Traditional fishermen have a single professional skill and are often plagued by rheumatism, schistosomiasis, and other diseases in the long-term. Following retirement, the Ma’anshan government provides reemployment training services and special job fairs for fishermen. The retired fishermen can choose to participate in relevant vocational skills training, and fishing households’ livelihood strategies have changed from single-skilled to diversified skills, which is conducive to improving sustainable livelihood options [43]. In addition, with the change of working environment and the reduction of labor intensity, retired fishermen’s disease risk has been reduced, resulting in superior physical health, which further improves the level of human capital.
(2)
Overall improvement in physical capital resulting from housing resettlement projects. Most of the fishermen in Ma’anshan City were traditional workers who live on boats in poor living conditions. During the transition period, the Ma’anshan government provided low rent housing and public rental housing for retired fishermen and supported the acquisition of basic household equipment, aiming to improve retired fishermen’s living environments and provide reliable housing security.
(3)
Demand leading of financial capital, which is reflected in the full coverage of social security and increases in loan demand. The survey found that nearly half of the fishermen did not buy medical insurance prior to retiring, and more than 80% of them did not participate in endowment insurance, with weak participant willingness. Following retirement, the Ma’anshan government incorporated all retired fishermen who met the insurance conditions into endowment insurance with three levels of 1500¥, 2000¥, and 3000¥. Specifically, the government pays all fees for those who chose the lowest level, and will pay 1500¥ and 2000¥, respectively for those who chose 2000¥ and 3000¥ levels. Government insurance subsidies have an incentivizing influence on retired fishermen’s willingness to participate. More than half of the fishermen chose to participate at the 2000¥ level or more, and demand for participation in insurance has risen. In addition, the Ma’anshan government also introduced a series of employment subsidy measures and provided entrepreneurship guarantee loans for retired fishermen, which has also stimulated loan demand, consequently improving retired households’ financial capital.
(4)
The expansion of social and psychological capital, which is reflected in the community management of retired fishermen. The Ma’anshan government adopted centralized community management for the retired fishermen. The homogeneity of fishermen’s social relations increases the frequency of visits between families and friends, significantly improving social capital. By establishing a helping post station for retired fishermen in the community to provide employment assistance, policy consultation, skills training, and other public services, the relationship between fishermen and government staff has been strengthened, which enhances the sense of belonging among retired fishermen and improves psychological capital [44].
Second, the compensation policy has optimized household livelihood capital structure and improved the overall degree of livelihood capital coupling coordination (Figure 5). The livelihood capital mode has transformed from social capital dominated to a human–social capital dominant configuration (Figure 2). Prior to retirement, the fishing households’ livelihood capital maintained a persistently imbalanced state, due to single livelihood activities and lack of human, material, and financial capital. Fishery activities are labor-intensive, with periodicity and seasonality characteristics. Limited by human capital, most fishermen could only rest during off fishing seasons, which increased opportunities for visits between friends and neighbors. In this circumstance, household livelihood capital is dominated by social capital, but its formation is passive. There is no effective coupling and coordination mechanism between various livelihood capital, which can easily generate the intangible loss of other forms of capital [45]. After retirement, human capital has become an advantageous form of capital, which is caused by the optimization and reorganization of human capital under the policy effect. A previous study indicates that advantageous capital is easier to fully leverage under the guidance of government policies [46], which is presumably the reason that capital mode changed to human–social capital dominant. Human capital is the basis of all forms of livelihood capital and has a driving role among all other capital forms, and the livelihood capital structure has changed from imbalanced to coordinated. The results also indicate that a series of employment security measures taken by the Ma’anshan government have been effective. The significant growth in human capital index is the primary reason for the improvement of the coupling coordination degree of retired fishing household livelihood capital.
Finally, the livelihood capital of a retired fishing household exhibits great mobility. Most of the fishermen in Ma’anshan are traditional workers, and differences in the stock of operating tools and fishery skills are the main reason for capital differentiation before retirement. The implementation of the policy has completely changed fishermen’s original living activities, leading directly to the dynamic change on livelihood capital demonstrated in this study. “Rational” fishermen affected by the fishing ban will choose new livelihood strategies based on existing capital and preferences, in order to break the stratum differentiation of the original livelihood capital. From a dynamic perspective (before and after the retirement), the continuous differentiation of household livelihood capital leads to a transformation of the order of household livelihood capital, revealing a capital mobility phenomenon. According to the research results, low and medium-low livelihood capital groups exhibit high upward mobility, while the medium and above livelihood capital groups exhibit high downward mobility, indicating that the policy further reduces the livelihood capital gap between retired households on the basis of improving the livelihood capital index. Some scholars assert that ecological compensation policy could narrow the gap between the rich and the poor, which was further confirmed in this paper [47,48]. Barro and Lee [49] noted that differences in human capital are the main cause of the gap between the rich and the poor, and that improvement of human capital can narrow this gap. The fishing ban compensation policy improves retired fishermen’s human capital by raising the level of vocational skills and providing more opportunities for fishermen to transfer from a low livelihood capital group to a higher level.
The implementation of the 10-year fishing ban compensation policy in the Yangtze River is the first practice of a river ecological compensation project in China, which provides a unique Chinese experience for river governance in the word. However, as the policy is dominated by the Chinese government and is mandatory, the ability to extend the policy to other countries is limited. However, a series of compensation methods covered by the policy can still provide excellent reference for the practice of ecological compensation projects in others. Existing ecological compensation projects focus more attention on providing cash compensation to participants to improve their income level but achieve little [50]. The case from Ma’anshan shows that the ecological compensation methods should involve as many aspects of livelihood capital as possible, which can not only increase the capital amounts, but also optimize the capital structure and narrow the gap between the rich and the poor, so as to ultimately improve the participants’ livelihood. In addition, theoretically speaking, this study provides a more comprehensive analysis method for the ecological compensation policy effect evaluation with the help of the SLA, so as to better understand the mechanism between ecological compensation policies and livelihood sustainability. This study also enriches the limited literature on river ecological compensation in the Chinese context.

6. Conclusions

Based on the two periods of survey data of fishing households in Ma’anshan, this paper evaluates the effect of the fishing ban compensation policy in the Yangtze River Basin on retired fishermen’s’ livelihood capital from the three perspectives of total amount, structure, and mobility. The results are threefold.
(1)
The policy’s implementation has significantly raised the livelihood capital of retired fishing households. The growth of human capital is significantly higher than other forms of capital, and the growth of material capital is the lowest. The livelihood capital mode has transformed from social capital dominated to a human–social capital dominant configuration.
(2)
The policy’s implementation has optimized retired fishermen’s livelihood capital structure, significantly improving the degree of capital coupling coordination, with a median value increase from 0.451 to 0.663. Overall, the coupling coordination level of household livelihood capital has transitioned from an imbalanced to a coordinated state.
(3)
Retired fishing households’ livelihood capital has high mobility, with notable differences among various groups, revealing that most of the low and medium-low livelihood capital groups exhibit upward mobility characteristics, whereas the mobility characteristics of medium and above livelihood capital groups are primarily downward.
According to the results, we find that the compensation policy in Ma’anshan City of Anhui province has an overall positive effect on the livelihood sustainability of retired fishing households, and narrows the gap between rich and poor groups, but this positive effect may be a short-term one. From a long-term perspective, two potential risks remain for the livelihood of retired fishermen. The first is the stagnation development of livelihood, which is due to the disappearance of policy welfare, as fishermen continue to face the dilemma of difficult development and low living standards. The second is the challenge of social harmony and stability caused by the prolonged period of livelihood strategy transformation and new levels of livelihood capital stratum differentiation following policy implementation. The long-term effects of the compensation policy require continuous investigation for strategic insights. In fact, in order to master the livelihood dynamic status of retired fishermen, the Chinese Agriculture Ministry has formulated a tracking investigation project in 2021, and more than 3000 households in 100 districts or counties of 10 provinces along the river are required to be tracked and investigated every year, and the project will be carried on for 10 years. With the growing accessibility of survey data, we will further explore the long-term policy effects in follow-up research.

Author Contributions

Y.H.: conceptualization, investigation, formal analysis, methodology, writing-original draft; T.C.: funding acquisition, conceptualization, investigation, supervision, writing-review & editing. All authors have read and agreed to the published version of the manuscript.

Funding

This study was funded by the National Natural Science Foundation of China (grant no. 72173084) and Shanghai Planning Office of Philosophy and Social Science, China (grant no. 2019BGL011).

Institutional Review Board Statement

Not applicable.

Data Availability Statement

Data used in this study are available upon request from the authors.

Conflicts of Interest

The authors declare that they have no conflict of interest.

References

  1. Huang, J.; Rozelle, S.; Zhu, X.; Zhao, S.; Sheng, Y. Agricultural and rural development in China during the past four decades: An introduction. Aust. J. Agric. Resour. Econ. 2019, 64, 1–13. [Google Scholar] [CrossRef]
  2. Huang, W.; Bruemmer, B. Balancing economic revenue and grazing pressure of livestock grazing on the Qinghai-Tibetan-Plateau. Aust. J. Agric. Resour. Econ. 2017, 61, 645–662. [Google Scholar] [CrossRef] [Green Version]
  3. Liu, J.; Diamond, J. China’s environment in a globalizing world. Nature 2005, 435, 1179–1186. [Google Scholar] [CrossRef] [PubMed]
  4. Chen, T.; Wang, Y.; Gardner, C.; Wu, F. Threats and protection policies of the aquatic biodiversity in the Yangtze River. J. Nat. Conserv. 2020, 58, 125931. [Google Scholar] [CrossRef]
  5. Zhang, H.; Kang, M.; Shen, L.; Wu, J.; Li, J.; Du, H.; Wang, C.; Yang, H.; Zhou, Q.; Liu, Z.; et al. Rapid change in Yangtze fisheries and its implications for global freshwater ecosystem management. Fish Fish. 2020, 21, 601–620. [Google Scholar] [CrossRef]
  6. Razzaq, A.; Tang, Y.; Qing, P. Towards Sustainable Diets: Understanding the Cognitive Mechanism of Consumer Acceptance of Biofortified Foods and the Role of Nutrition Information. Int. J. Environ. Res. Public Health 2021, 18, 1175. [Google Scholar] [CrossRef]
  7. Qiu, J. Trouble on the Yangtze. Science 2012, 336, 288–291. [Google Scholar] [CrossRef]
  8. Castello, L.; Macedo, M.N. Large-scale degradation of Amazonian freshwater ecosystems. Glob. Chang. Biol. 2015, 22, 990–1007. [Google Scholar] [CrossRef]
  9. Ma, T.; Zhou, W.; Chen, L.; Wu, L.; Peter, C.; Dai, G. Concerns about the future of Chinese fisheries based on illegal, unreported and unregulated fishing on the Hanjiang river. Fish. Res. 2018, 199, 212–217. [Google Scholar] [CrossRef]
  10. Müller, B.; Berg, M.; Yao, Z.P.; Zhang, X.F.; Wang, D.; Pfluger, A. How polluted is the Yangtze river? Water quality downstream from the Three Gorges Dam. Sci. Total Environ. 2008, 402, 232–247. [Google Scholar] [CrossRef]
  11. Xie, P. Ecological impacts of three gorges dam on lakes Dongting and Poyang. Resour. Environ. Yangtze Basin 2017, 26, 1607–1618, (In Chinese with English Abstract). [Google Scholar] [CrossRef]
  12. Cheng, L.; Blanchet, S.; Loot, G.; Villéger, S.; Zhang, T.; Lek, S.; Lek-Ang, S.; Li, Z. Temporal changes in the taxonomic and functional diversity of fish communities in shallow Chinese lakes: The effects of river-lake connections and aquaculture. Aquat. Conserv. Mar. Freshw. Ecosyst. 2013, 24, 23–34. [Google Scholar] [CrossRef]
  13. Zhang, H.; Jarić, I.; Roberts, D.L.; He, Y.; Du, H.; Wu, J.; Wang, C.; Wei, Q. Extinction of one of the world’s largest freshwater fishes: Lessons for conserving the endangered Yangtze fauna. Sci. Total Environ. 2020, 710, 136242. [Google Scholar] [CrossRef] [PubMed]
  14. Yang, H.; Shen, L.; He, Y.; Tian, H.; Gao, L.; Wu, J.; Mei, Z.; Wei, N.; Wang, L.; Zhu, T.; et al. Status of aquatic organisms resources and their environments in Yangtze river system (2017–2021). J. Fish. China 2022. Available online: https://kns.cnki.net/kcms/detail/31.1283.S.20221009.1234.004.html (accessed on 20 November 2022). (In Chinese with English abstract).
  15. Elahi, E.; Khalid, Z.; Tauni, M.Z.; Zhang, H.; Lirong, X. Extreme weather events risk to crop-production and the adaptation of innovative management strategies to mitigate the risk: A retrospective survey of rural Punjab, Pakistan. Technovation 2022, 117, 102255. [Google Scholar] [CrossRef]
  16. Razzaq, A.; Xiao, M.; Zhou, Y.; Liu, H.; Abbas, A.; Liang, W.; Naseer, M.A.U.R. Impact of Participation in Groundwater Market on Farmland, Income, and Water Access: Evidence from Pakistan. Water 2022, 14, 1832. [Google Scholar] [CrossRef]
  17. Zou, J.; Tang, Y.; Qing, P.; Li, H.; Razzaq, A. Donation or Discount: Effect of Promotion Mode on Green Consumption Behavior. Int. J. Environ. Res. Public Health 2021, 18, 1912. [Google Scholar] [CrossRef]
  18. Bremer, L.L.; Farley, K.A.; Lopez-Carr, D.; Romero, J. Conservation and livelihood outcomes of payment for ecosystem services in the Ecuadorian Andes: What is the potential for ‘win–win’? Ecosyst. Serv. 2014, 8, 148–165. [Google Scholar] [CrossRef]
  19. Westman, W.E. How Much Are Nature’s Services Worth? Science 1997, 197, 960–964. [Google Scholar] [CrossRef]
  20. Costanza, R.; d’Arge, R.; de Groot, R.; Farber, S.; Grasso, M.; Hannon, B.; Limburg, K.; Naeem, S.; O’Neill, R.V.; Paruelo, J.; et al. The value of the world’s ecosystem services and natural capital. Nature 1997, 387, 253–260. [Google Scholar] [CrossRef]
  21. Jayachandran, S.; de Laat, J.; Lambin, E.F.; Stanton, C.Y.; Audy, R.; Thomas, N.E. Cash for carbon: A randomized trial of payments for ecosystem services to reduce deforestation. Science 2017, 357, 267–273. [Google Scholar] [CrossRef]
  22. Small, L.-A. The Sustainable Rural Livelihoods Approach: A Critical Review. Can. J. Dev. Stud. 2007, 28, 27–38. [Google Scholar] [CrossRef]
  23. Scoones, I. Livelihoods perspectives and rural development. J. Peasant. Stud. 2009, 36, 171–196. [Google Scholar] [CrossRef]
  24. Moyo, C.S.; Francis, J.; Bessong, P.O. Perceptions of community-based field workers on the effect of a longitudinal biomedical research project on their sustainable livelihoods. BMC Public Health 2017, 17, 267. [Google Scholar] [CrossRef] [PubMed] [Green Version]
  25. Karki, S.T. Do protected areas and conservation incentives contribute to sustainable livelihoods? A case study of Bardia National Park, Nepal. J. Environ. Manag. 2013, 128, 988–999. [Google Scholar] [CrossRef] [PubMed]
  26. Barnes, C.; Claus, R.; Driessen, P.; Dos Santos, M.J.F.; George, M.A.; Van Laerhoven, F.; Dos Santos, M.F. Uniting forest and livelihood outcomes? Analyzing external actor interventions in sustainable livelihoods in a community forest management context. Int. J. Commons 2017, 11, 532–571. [Google Scholar] [CrossRef] [Green Version]
  27. Liu, Z.; Chen, Q.; Xie, H. Influence of the Farmer’s Livelihood Assets on Livelihood Strategies in the Western Mountainous Area, China. Sustainability 2018, 10, 875. [Google Scholar] [CrossRef] [Green Version]
  28. McAfee, K.; Shapiro, E.N. Payments for Ecosystem Services in Mexico: Nature, Neoliberalism, Social Movements, and the State. Ann. Assoc. Am. Geogr. 2010, 100, 579–599. [Google Scholar] [CrossRef]
  29. Cherni, J.A.; Hill, Y. Energy and policy providing for sustainable rural livelihoods in remote locations—The case of Cuba. Geoforum 2009, 40, 645–654. [Google Scholar] [CrossRef]
  30. Hu, G.J.; Chen, C.M.; Guo, L.C.; Hou, Y.F. The effects of ecological compensation on livelihood capital and correlation of rural residents in Nature Reserve: Taking Minjiangyuan National Nature Reserve in Fujian as an example. Ecol. Econ. 2018, 34, 6. Available online: https://www.cnki.com.cn/Article/CJFDTOTAL-STJJ201808026.htm (accessed on 21 November 2022). (In Chinese with English abstract).
  31. Vista, B.M.; Nel, E.; Binns, T. Land, landlords and sustainable livelihoods: The impact of agrarian reform on a coconut hacienda in the Philippines. Land Use Policy 2012, 29, 154–164. [Google Scholar] [CrossRef]
  32. Kang, X.H.; Shi, J.H.; Zhang, W.J.; Gai, Z.Y. Research on the current situation of the livelihood capital of the herdsman and its factors influencing the background of grazing prohibition subsidy policy in Inner Mongolia. J. Arid. Land Resour. Environ. 2018, 32, 59–65. Available online: https://www.cnki.com.cn/Article/CJFDTOTAL-GHZH201811010.htm (accessed on 23 November 2022). (In Chinese with English Abstract).
  33. Sims, K.R.E.; Alix-Garcia, J.M. Parks versus PES: Evaluating direct and incentive-based land conservation in Mexico. J. Environ. Econ. Manag. 2017, 86, 8–28. [Google Scholar] [CrossRef]
  34. Muradian, R.; Corbera, E.; Pascual, U.; Kosoy, N.; May, P.H. Reconciling theory and practice: An alternative conceptual framework for understanding payments for environmental services. Ecol. Econ. 2010, 69, 1202–1208. [Google Scholar] [CrossRef]
  35. Adhikari, B.; Boag, G. Designing payments for ecosystem services schemes: Some considerations. Curr. Opin. Environ. Sustain. 2013, 5, 72–77. [Google Scholar] [CrossRef]
  36. Li, D.; Pei, Y.; Chen, H. Is fiscal transfer payment “blood transfusion” or “blood maki-ng”?: An empirical study based on the state-designated poverty-stricken counties. Financ. Trade Econ. 2019, 40, 22–39, (In Chinese with English Abstract). [Google Scholar] [CrossRef]
  37. Liu, G.G.; Ge, Y.X.; Zhang, H.N. Ecological compensation for poverty alleviation: Synergy, antagonist and docking. Chin. J. Environ. Manag. 2020, 12, 95–101, (In Chinese with English Abstract). [Google Scholar] [CrossRef]
  38. Su, F.; Xu, Z.M.; Shang, H.Y. An overview of sustainable livelihoods approach. Adv. Earth Sci. 2009, 1, 61–69, (In Chinese with English Abstract). [Google Scholar] [CrossRef]
  39. Zhao, X.Y.; Jie, Y.Q.; He, X. Livelihood adaptability of farmers in key ecological functional areas under multiple pressures: A case study of Yellow River water source areas of Gannan. China Popul. Resour. Environ. 2020, 30, 140–149, (In Chinese with English Abstract). [Google Scholar] [CrossRef]
  40. Liu, M.-Y.; Feng, X.-L.; Wang, S.-G.; Zhong, Y. Does poverty-alleviation-based industry development improve farmers’ livelihood capital? J. Integr. Agric. 2021, 20, 915–926. [Google Scholar] [CrossRef]
  41. Tran, D.D.; Huu, L.H.; Hoang, L.P.; Pham, T.D.; Nguyen, A.H. Sustainability of rice-based livelihoods in the upper floodplains of Vietnamese Mekong Delta: Prospects and challenges. Agric. Water Manag. 2020, 243, 106495. [Google Scholar] [CrossRef]
  42. Liu, Y.; Xu, Y. A geographic identification of multidimensional poverty in rural China under the framework of sustainable livelihoods analysis. Appl. Geogr. 2016, 73, 62–76. [Google Scholar] [CrossRef]
  43. Pang, J.; Xu, K.; Jin, L.S. Research on the impact of wetland eco-compensation on farmers’ livelihood strategies and income: An empirical analysis of Poyang Lake. China Land Sci. 2021, 35, 72–80+108, (In Chinese with English Abstract). [Google Scholar] [CrossRef]
  44. Yu, Y.H. Urban community public service, life satisfaction, and sense of gain. Northwest Popul. J. 2021, 42, 78–90, (In Chinese with English Abstract). [Google Scholar] [CrossRef]
  45. Sun, T.S.; Hu, X.H. Grassland adaptive management in arid region based on livelihood capitals of peasants and herdsmen-A case study of Fuyun county in the north of Junggar basin, China. J. Nat. Resour. 2018, 33, 761–774, (In Chinese with English Abstract). [Google Scholar] [CrossRef]
  46. Shi, Y.D.; Li, J.J. The multifunctional development of rural tourism and rural sustainable livelihood: A collaborative study. Tour. Trib. 2018, 33, 15–26, (In Chinese with English Abstract). [Google Scholar] [CrossRef]
  47. Li, G.P.; Shi, H.Y. The relationship between GTGP and regional economic growth based on Ramsey-Cass-Koopmans modeling. Resour. Sci. 2017, 39, 1712–1724, (In Chinese with English Abstract). [Google Scholar] [CrossRef] [Green Version]
  48. Milder, J.C.; Scherr, S.J.; Bracer, C. Trends and Future Potential of Payment for Ecosystem Services to Alleviate Rural Poverty in Developing Countries. Ecol. Soc. 2010, 15, 4. [Google Scholar] [CrossRef] [Green Version]
  49. Barro, R.J.; Lee, J.W. A new data set of educational attainment in the world, 1950–2010. J. Dev. Econ. 2013, 104, 184–198. [Google Scholar] [CrossRef]
  50. Li, J.; Feldman, M.W.; Li, S.; Daily, G.C. Rural household income and inequality under the Sloping Land Conversion Program in western China. Proc. Natl. Acad. Sci. USA 2011, 108, 7721–7726. [Google Scholar] [CrossRef]
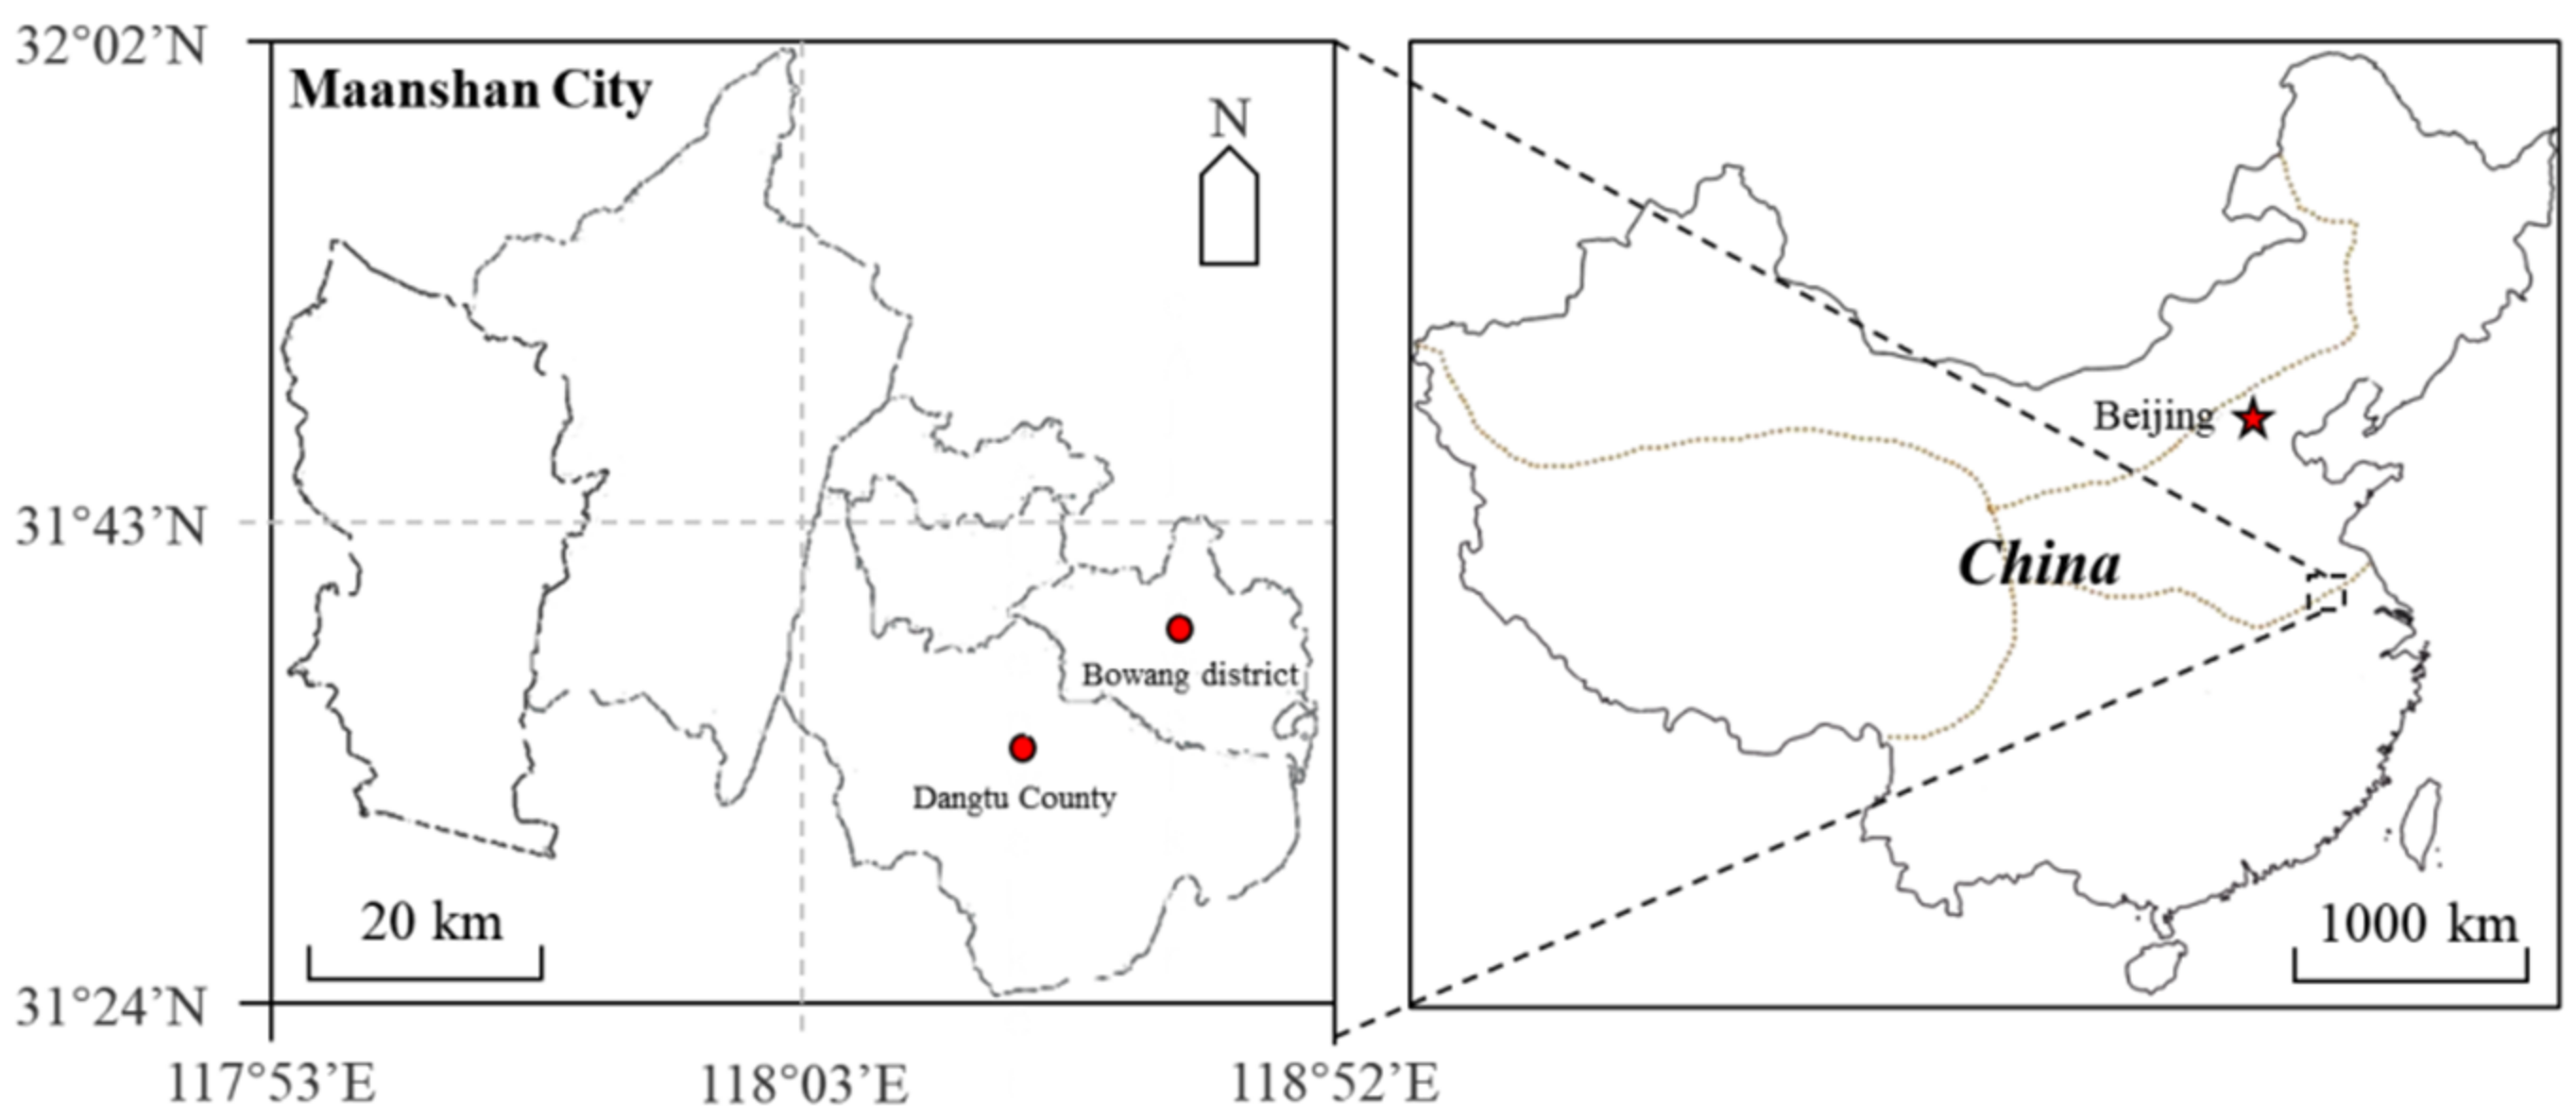
Figure 1. The location map of the study area and sample districts.
Agriculture 12 02088 g001
Figure 2. Index of each form of capital before and after policy implementation. (a) human capital, (b) physical capital, (c) financial capital, (d) social capital, (e) psychological capital, and (f) livelihood capital; ***: p < 0.001).
Agriculture 12 02088 g002
Figure 3. Pentagon of the five forms of livelihood capital. H: human capital, P: physical capital, F: financial capital, S: social capital, PS: psychological capital.
Agriculture 12 02088 g003
Figure 4. Index difference of each form of capital. (**: p < 0.01, ***: p < 0.001).
Agriculture 12 02088 g004
Figure 5. Coupling coordination degree of livelihood capital before and after implementation. (***: p < 0.001).
Agriculture 12 02088 g005
Figure 6. Distribution of coupling coordination levels.
Agriculture 12 02088 g006
Figure 7. Mobility matrix of livelihood capital. (Numbers 1–5 represent different levels of livelihood capital: 1: low; 2: medium-low; 3: medium, 4: medium-high; 5: high).
Agriculture 12 02088 g007
Table 1. Evaluation system of the retired fishermen’s livelihood capital index.
CapitalIndicatorIndicator Description and Score AssignmentWeight
Human Capital
(H)
Health
(H1)
Health of fishing couples:
Long illness = 1; Frequent illness = 2;
Occasional illness = 3; Rarely illness = 4; No illness = 5
0.1982
Professional Skills
(H2)
Participation of professional skills training:
Never = 1; Rarely = 2; Occasionally = 3;
Frequent = 4; Always = 5
0.8018
Physical Capital
(P)
Residential Area
(P1)
Housing construction area (m2)0.2101
Durable Consumer Goods
(P2)
The number of family durable consumer goods0.0868
Transportation
(P3)
Whether the household has a car: Yes = 1, No = 00.7031
Financial Capital
(F)
Income
(F1)
Annual household income after retirement
(thousand yuan):
F1 < 10(1); 10 ≤ F1 < 30(2); 30 ≤ F1 < 50(3);
50 ≤ F1 < 80(4); F1 ≥ 80(5)
0.0519
Deposit
(F2)
Household Deposit (thousand yuan):
F2 < 10(1); 10 ≤ F2 < 50(2); 50 ≤ F2 < 100(3);
100 ≤ F2 < 150(4); F2 ≥ 150(5)
0.1251
Medical Insurance
(F3)
Whether the household has medical insurance:
Yes = 1; No = 0
0.0933
Endowment
Insurance
(F4)
Whether the household has endowment insurance:
Yes = 1; No = 0
0.1771
Loans
(F5)
Whether the household has loans:
Yes = 1; No = 0
0.5525
Social Capital
(S)
Relatives and Friends Closeness
(S1)
Visiting relatives and friends:
Never = 1; Rarely = 2; Occasionally = 3;
Frequent = 4; Always = 5
0.2423
Cadres Closeness
(S2)
Communicate with cadres:
Never = 1; Rarely = 2; Occasionally = 3;
Frequent = 4; Always = 5
0.3130
Communities
Closeness
(S3)
Participation of community activities:
Never = 1; Rarely = 2; Occasionally = 3;
Frequent = 4; Always = 5
0.4447
Psychological
Capital
(PS)
Subjective
well-being
(PS1)
Satisfaction with standard of living:
Very dissatisfied = 1; Dissatisfied = 2; General = 3; Satisfied = 4; Very satisfied = 5
0.3167
Sense of living crisis
(PS2)
Feel anxious about the future:
Always = 1; Frequent = 2; Occasionally = 3; Rarely = 4; Never = 5
0.6833
Table 2. Coupling coordination degree levels.
LevelIndex IntervalImbalanceLevelIndex IntervalCoordination
10.00 < D ≤ 0.09Extreme imbalance60.49 < D ≤ 0.59Barely coordination
20.09 < D ≤ 0.19Serious imbalance70.59 < D ≤ 0.69Primary coordination
30.19 < D ≤ 0.29Moderate imbalance80.69 < D ≤ 0.79Moderate coordination
40.29 < D ≤ 0.39Mild
imbalance
90.79 < D ≤ 0.89Well coordination
50.39 < D ≤ 0.49Slightly imbalance100.89 < D ≤ 1.00Highly coordination
Table 3. Relative mobility parameters of the five forms of livelihood capital.
ParametersFormulas
Chi-square index i = 1 m j = 1 m [ p i j ( x , y ) 1 / m ] 2 1 / m
Inertia ratio 1 m i = 1 m P i i
Relative mobility ratio j > i P i j / i > j P i j
Average moving position 1 m 1 i = 1 m j = 1 m i j P i j
Table 4. Value of relative mobility parameters.
ParametersValue
Chi-square index1.305
Inertia ratio0.262
Relative mobility ratio0.826
Average moving position1.852
Publisher’s Note: MDPI stays neutral with regard to jurisdictional claims in published maps and institutional affiliations.