Article

Influence of Sieve Surface Attitude on Sieving Performance of Granular Materials with Non-Uniform Feeding Conditions

1
School of Electrical and Information Engineering, Jiangsu University, Zhenjiang 212013, China
2
Key Laboratory of Modern Agricultural Equipment and Technology of Ministry of Education, Jiangsu University, Zhenjiang 212013, China
*
Author to whom correspondence should be addressed.
Agriculture 2022, 12(12), 2023; https://doi.org/10.3390/agriculture12122023
Submission received: 20 October 2022 / Revised: 17 November 2022 / Accepted: 25 November 2022 / Published: 26 November 2022
(This article belongs to the Section Agricultural Technology)

Abstract

:
The screen surface particle distribution is an important factor affecting screening performance. A vibrating screen with an adjustable horizontal attitude angle was used, the non-uniform feeding and horizontal attitude angles were used as variables and the screening of rice particles was simulated by the discrete element method. The screen surface distribution and movement speed of the rice particles were analyzed based on the influence of the variables on screening performance. The results indicated that the material distribution became more unbalanced with the increase in non-uniform feeding, and the particles’ speed increased with the increase in attitude angle on the y-axis. The particles experienced accelerated dispersion, which improved the unbalanced distribution of the particles and screening performance. According to the loss rate, the horizontal attitude angle adjustment model was established and optimized under non-uniform feeding. The reliability of the model was verified by simulation. A bench test was carried out to verify the simulation. The optimization model can reduce the loss rate, improve the screening performance of non-uniform feeding, and provide a reference for the material screening of non-uniform feeding.

1. Introduction

Sieving is an important link for separating particles according to their sizes. As a major sieving machine, vibrating screens are widely used in industrial and agricultural production, such as grain screening, iron ore, and coal separation [1,2,3]. As a very serviceable technique, extensive research was carried out on the theoretical modeling of vibrating sieving [4,5,6]. Most of the theoretical models could be divided into two categories: probability models and kinetic models. However, these models generally ignore the interaction of particles and only apply to uniform and shallow particle-sieving situations when particles are assumed to behave independently [7]. The models are developed for a specific type of sieve and have many parameters which need to be determined by actual tests, which greatly restrict the popularization and application.
The traditional reciprocating vibrating screen found it difficult to meet the requirements of high efficiency and adaptability for vibrating screening [8,9]. Recently, the screening mechanism and motion law of particles was extensively studied to improve screening performance. The particle stratification performance and screening efficiency of the vibrating screen were studied under different feeding rates by DEM [10]. The optimal operating parameters for maintaining the stability of the vibrating screen were found, which solved the reduced screening efficiency under material fluctuation feeding [11]. The influence of various working parameters was analyzed on the double-layer linear vibration screening efficiency [12], and the results indicated that the screen surface inclination had a significant influence on the screening efficiency. A circular vibrating screen was designed, which changed the inclination and vibration frequency of the screen surface to reduce the screen blockage of wet coal and improve the screening performance [13]. The influence of key operating parameters for drum screens on screening performance was studied based on DEM [14]. The screening performance and mechanism of variable amplitude equal thickness screens were studied by DEM [15]. The material screening process of multi-degrees of freedom vibrating screens was simulated by DEM and the results indicated that multi-degrees of freedom vibration could improve the dispersion and stratification performance of material particles, which greatly improved the screening efficiency of materials [16,17,18]. The particle motion and distribution characteristics of the two degrees of freedom vibrating screen were studied to improve the non-uniform distribution of material for the reciprocating vibrating screen [19]. In addition, many scholars have studied the multi-dimensional vibrating screen [20,21,22]. The structure and working parameters of the sieve had a significant impact on the screening performance [23]. Compared with the traditional reciprocating vibrating screen, the structure of the multi-degrees of freedom vibrating screen was more complex. However, the mechanism characteristics had a better effect on the dispersion and screening performance of screen surface materials (especially the non-uniform distribution of screen surface materials under non-uniform feeding). From this, the discrete element method (DEM) was widely used [24].
The traditional reciprocating vibrating screening device was mainly used in the particle screening process [25,26]. Many scholars have widely studied the influence of the structure and operating parameters for the vibrating screen (vibration frequency, amplitude, inclination, pore size, and shape, etc.) on particle motion and screening performance [27,28,29,30,31] and have then put forward many optimization control models to improve the vibrating screen and further improve screening performance [32,33,34]. However, when the particles entered the vibrating screen, the radial distribution of the surface of the sieve was non-uniform due to the feeding state of the particle group. When the vibrating screen vibrated with one degree of freedom, the conveying capacity of the particles along the axis of the screen surface was equal due to the vibration direction remaining unchanged. This cannot quickly promote the uniform distribution of particles on the vibrating screen surface under non-uniform feeding and improve the utilization efficiency and screening performance of the screen surface.
Therefore, a hybrid multi-degree-of-freedom vibrating sieving device was proposed to improve the sieving performance of the harvester. For the non-uniform feeding of material, the horizontal attitude of the sieve could be adjusted. The material screening process was simulated by DEM under different non-uniform feeding, the influences of horizontal attitude on particle movement and distribution was analyzed, and the particle loss distribution at the end of the sieve was estimated and calculated to obtain the relationship between the horizontal attitude angle, feeding state, and the loss rate. Then, an optimal adjustment model of the horizontal attitude angle was established to reduce the loss rate. Finally, bench tests were carried out to verify the feasibility of the proposed model.

2. Material and Methods

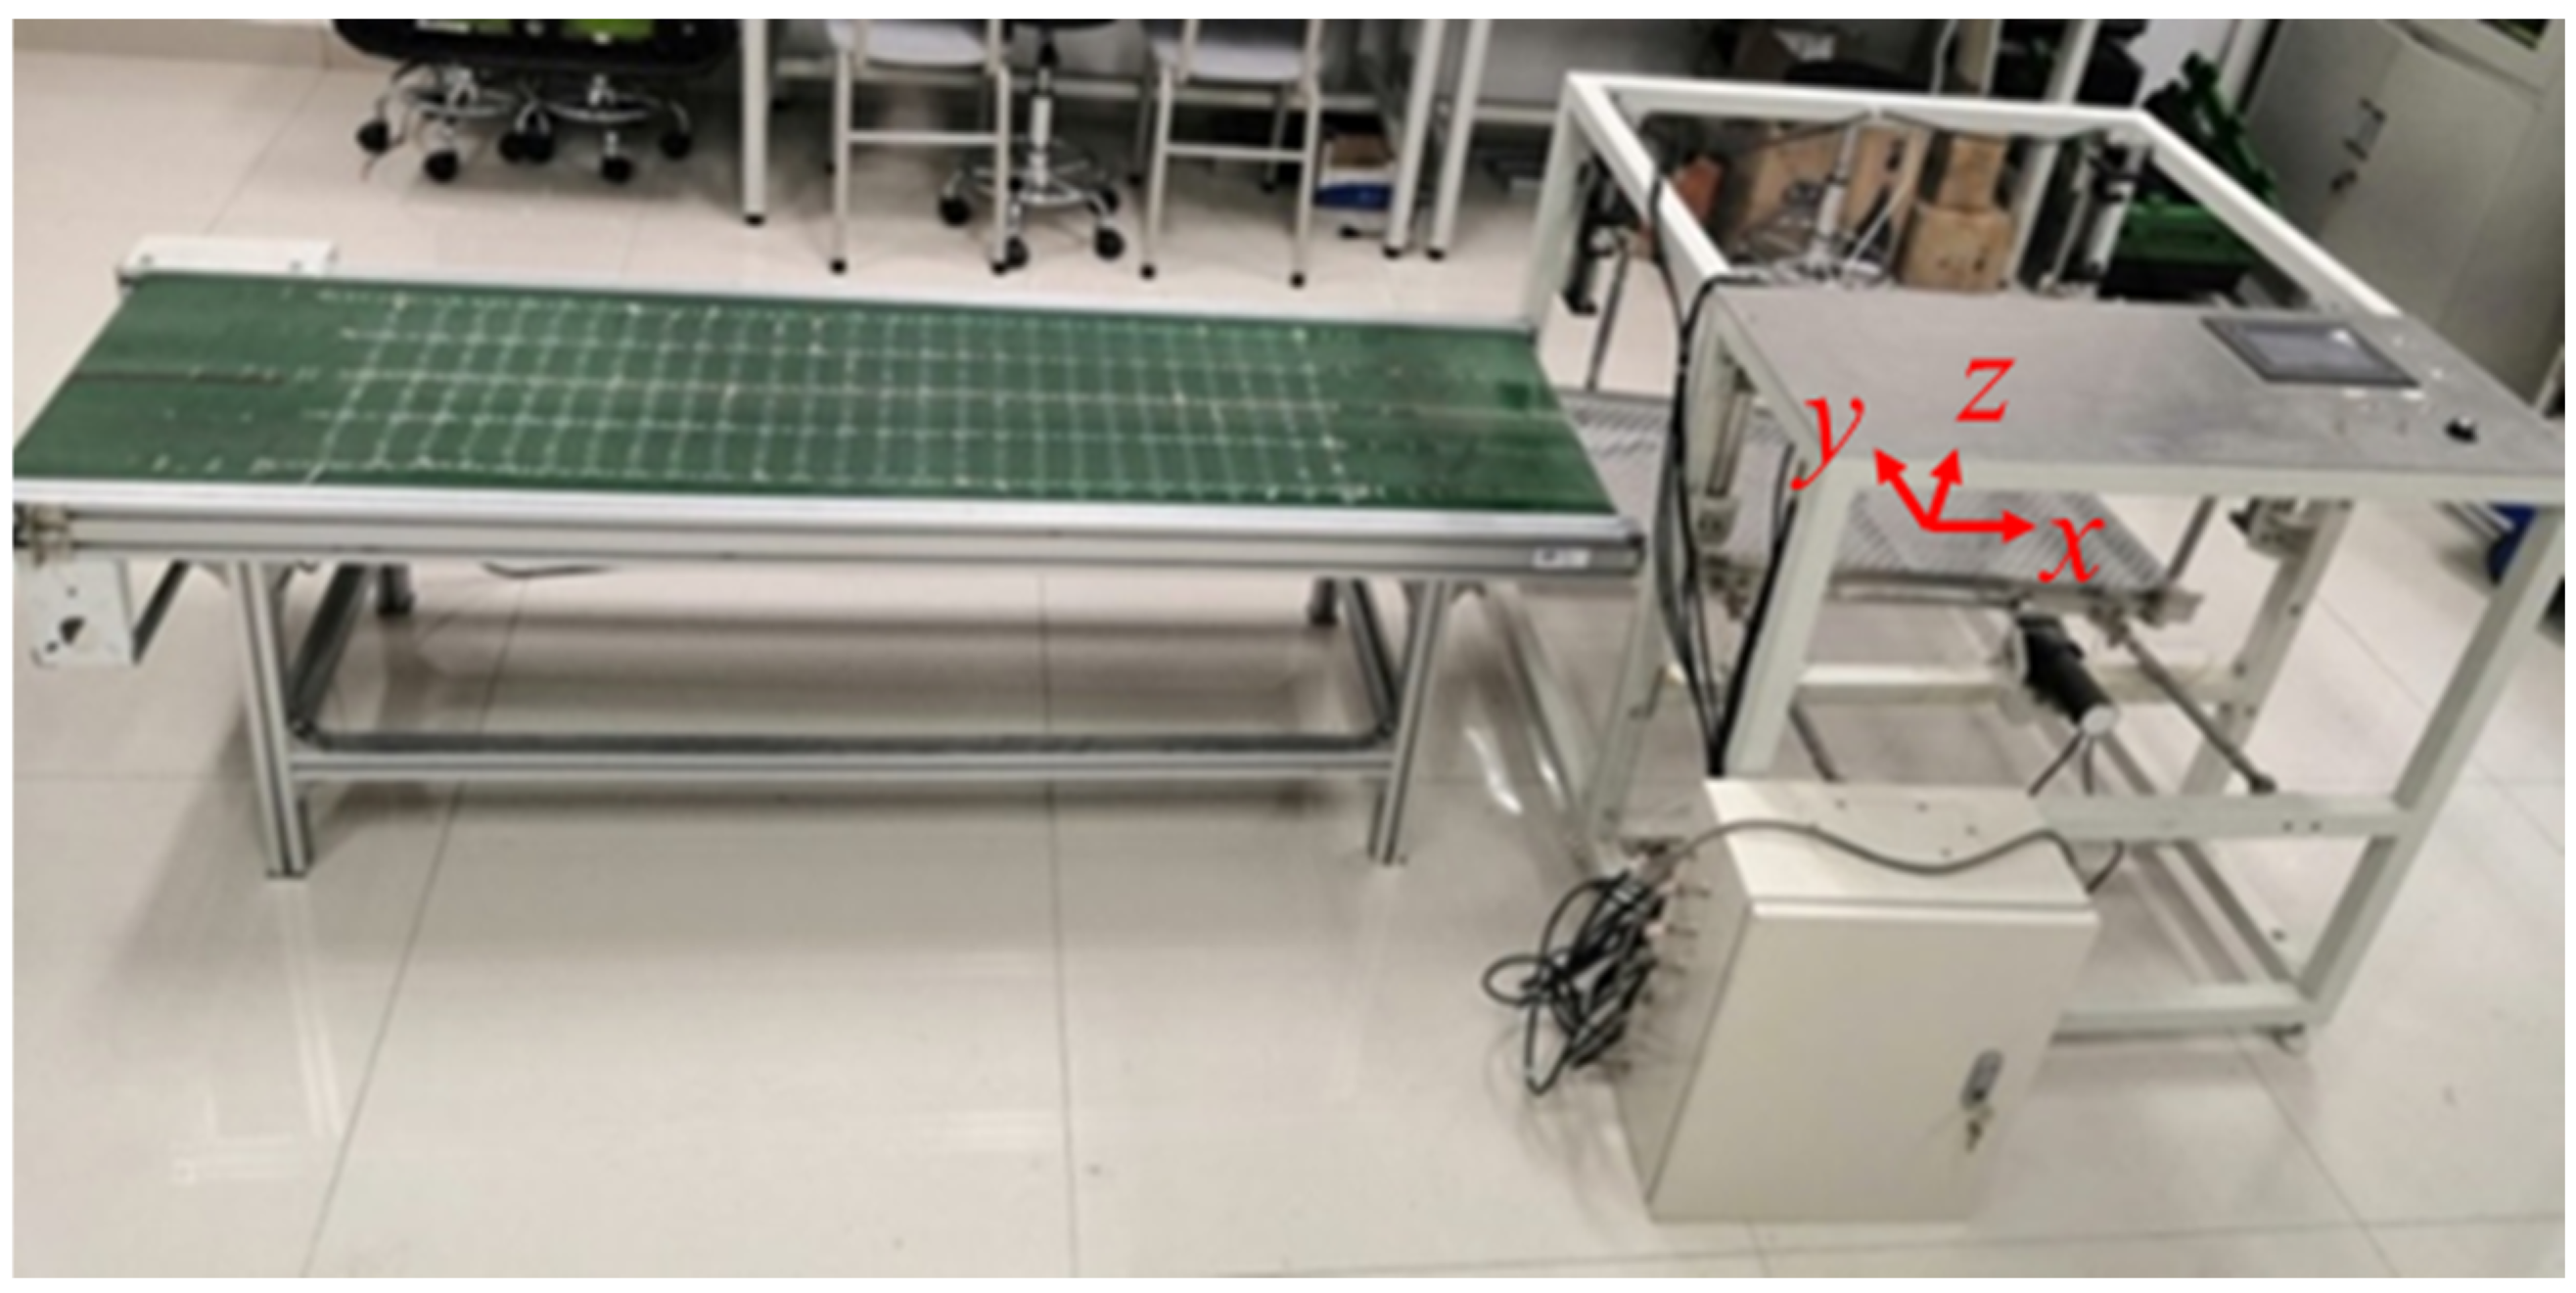
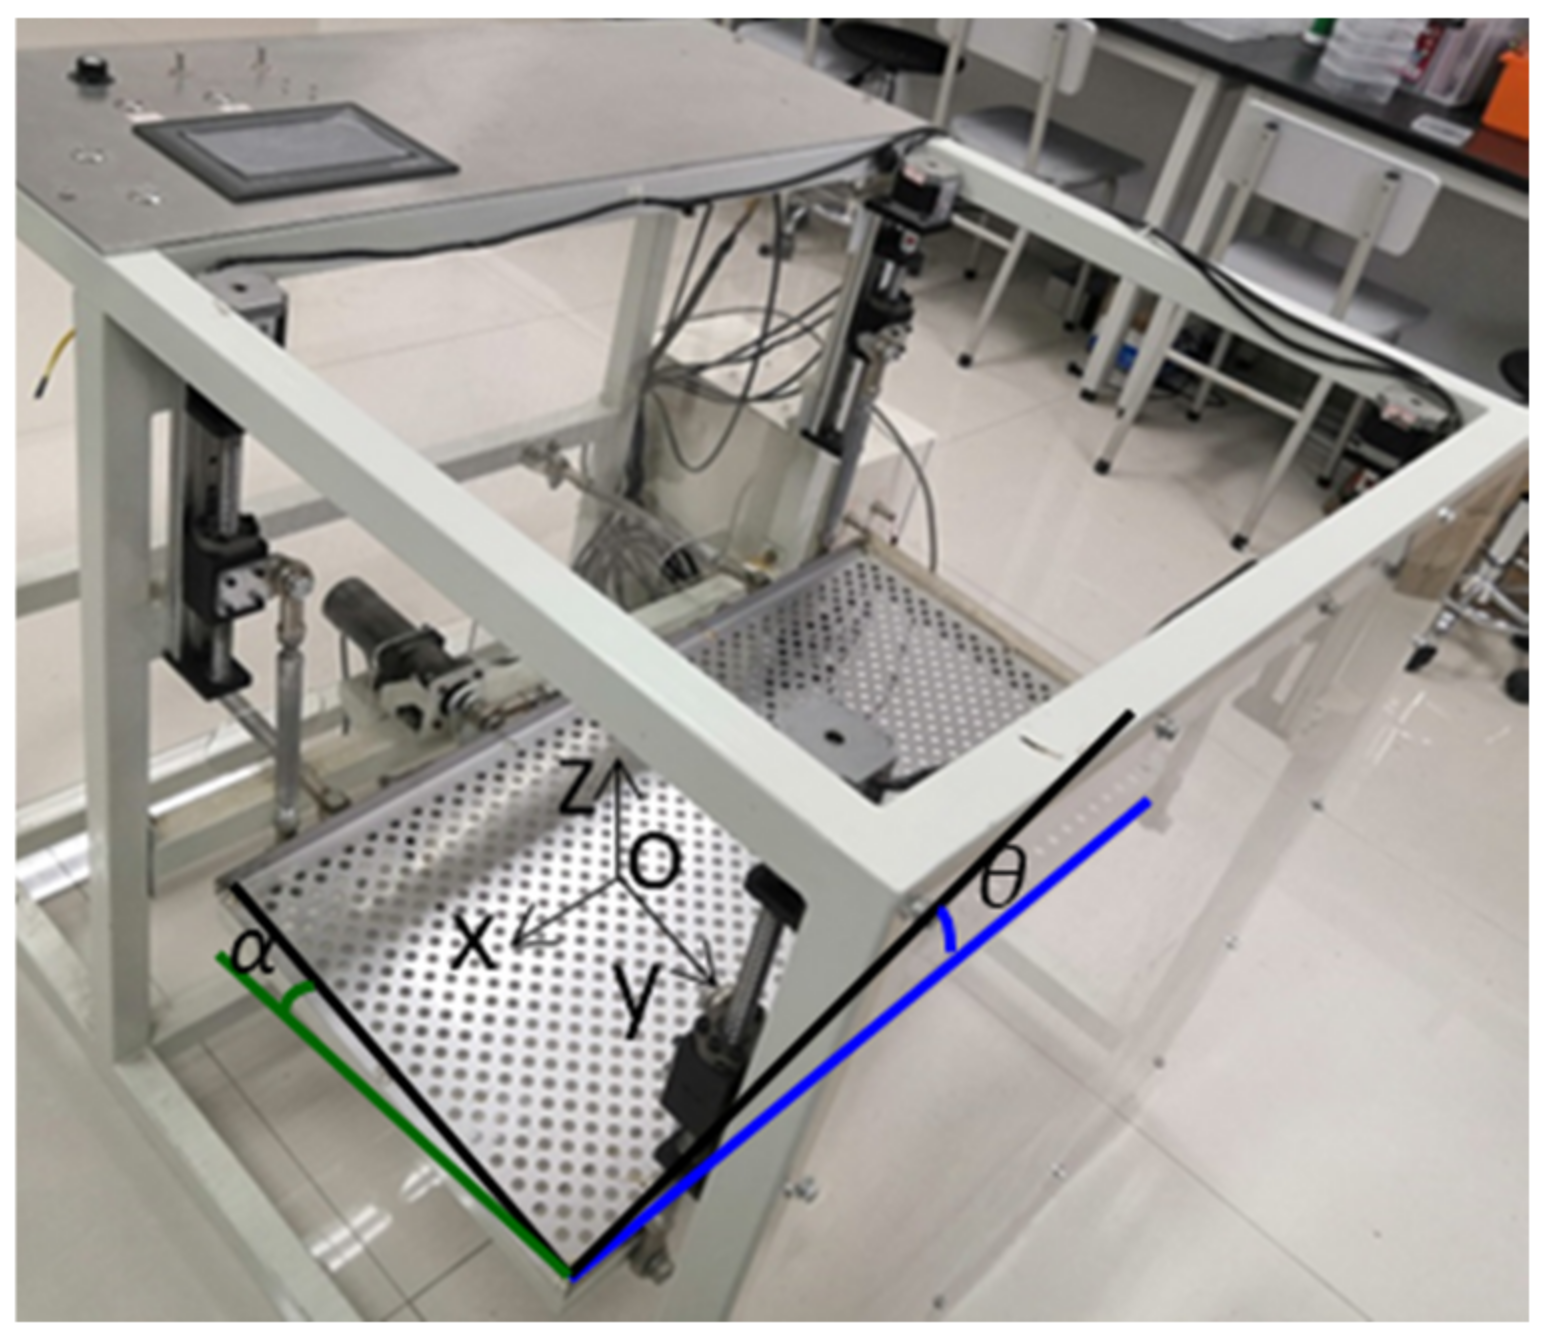
2.1. Multi-DOF Hybrid Vibrating Screen

In Figure 1, the multi-DOF hybrid vibrating sieve was suspended on the moving sliders of 4 vertical sliding tables by 4 sets of linkage booms. The sieve was driven by a DC motor and a slider–crank mechanism, which could reciprocate along the tangential direction of the booms. When the screen surface is horizontal, the center of the sieve surface as the origin, an inertial coordinate was established, denoted as [x, y, z]. The movement of 4 sliders in parallel was controlled by a programmable logic controller (PLC), which could realize the rotation of the sieve surface along the x-axis and y-axis through the height adjustment of the four sliders. Two horizontal connecting rods improved the motion stability of the screen. Therefore, the sieve surface could perform 3-DOF motion. When the screen surface is not horizontal when it is working, the angle between the normal vector of the sieve surface (n) and the x-z plane is defined as the attitude angle α, and the angle between n and the y-z plane is defined as the inclination angle θ, as shown in Figure 2. The green line is parallel to the y-axis and the blue line is parallel to the x-axis. The black lines are the two sides of the screen surface. The biggest adjustment ranges of α and θ were 10° and 20°, respectively. The size of rectangular sieve surface was 900 mm × 450 mm. The diameter of apertures was 10 mm which were arranged in a square on the sieve surface with center distance of 25 mm.

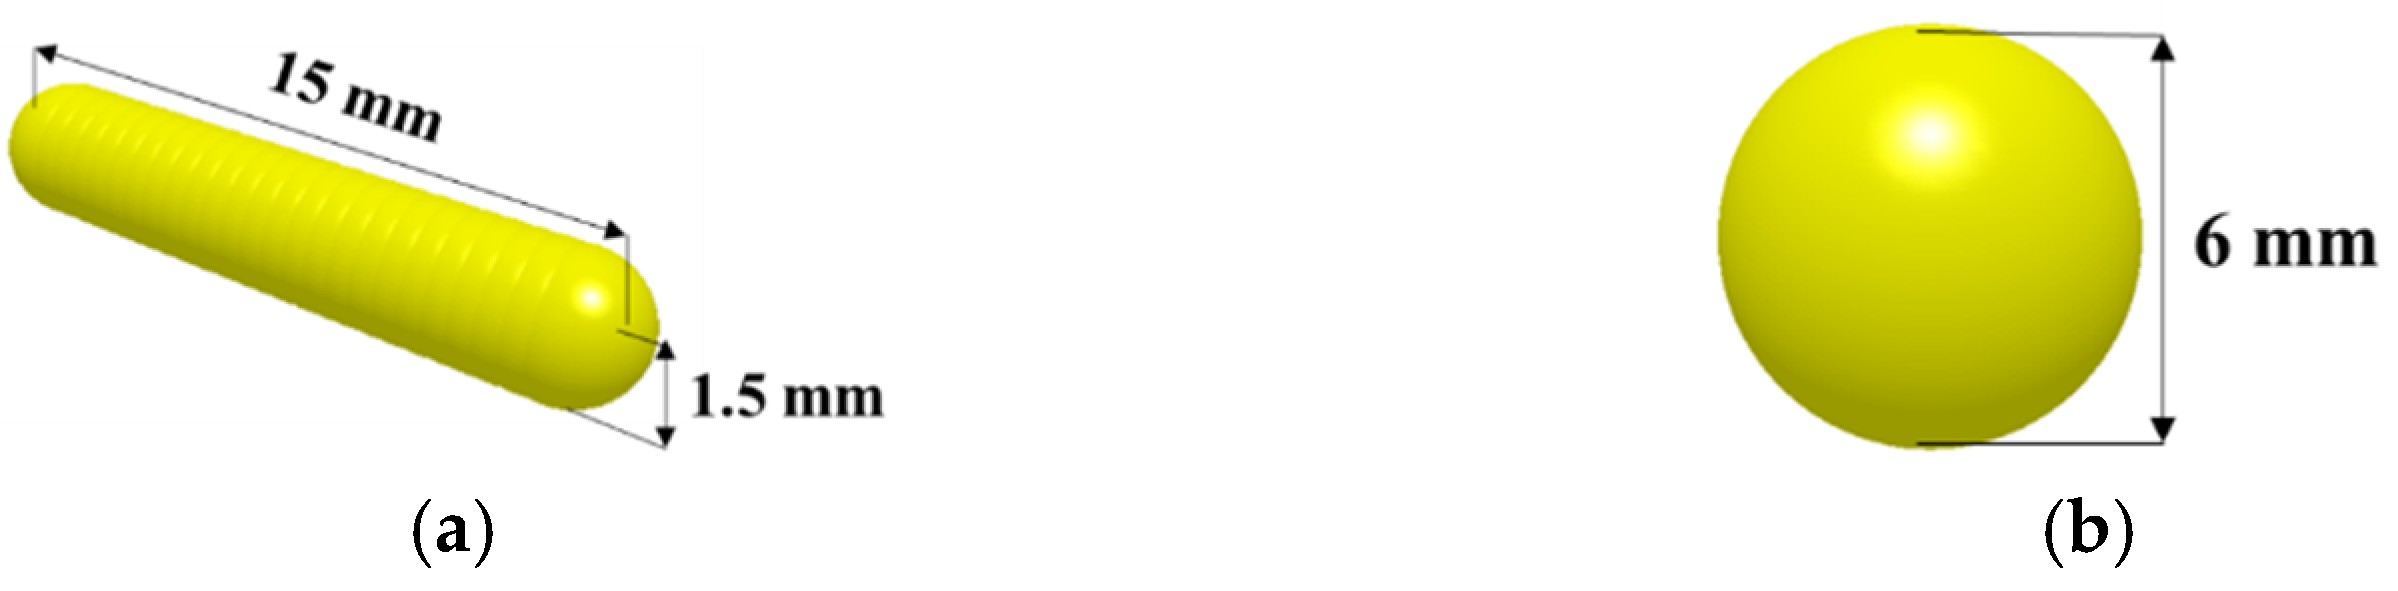
2.2. Discrete Element Method
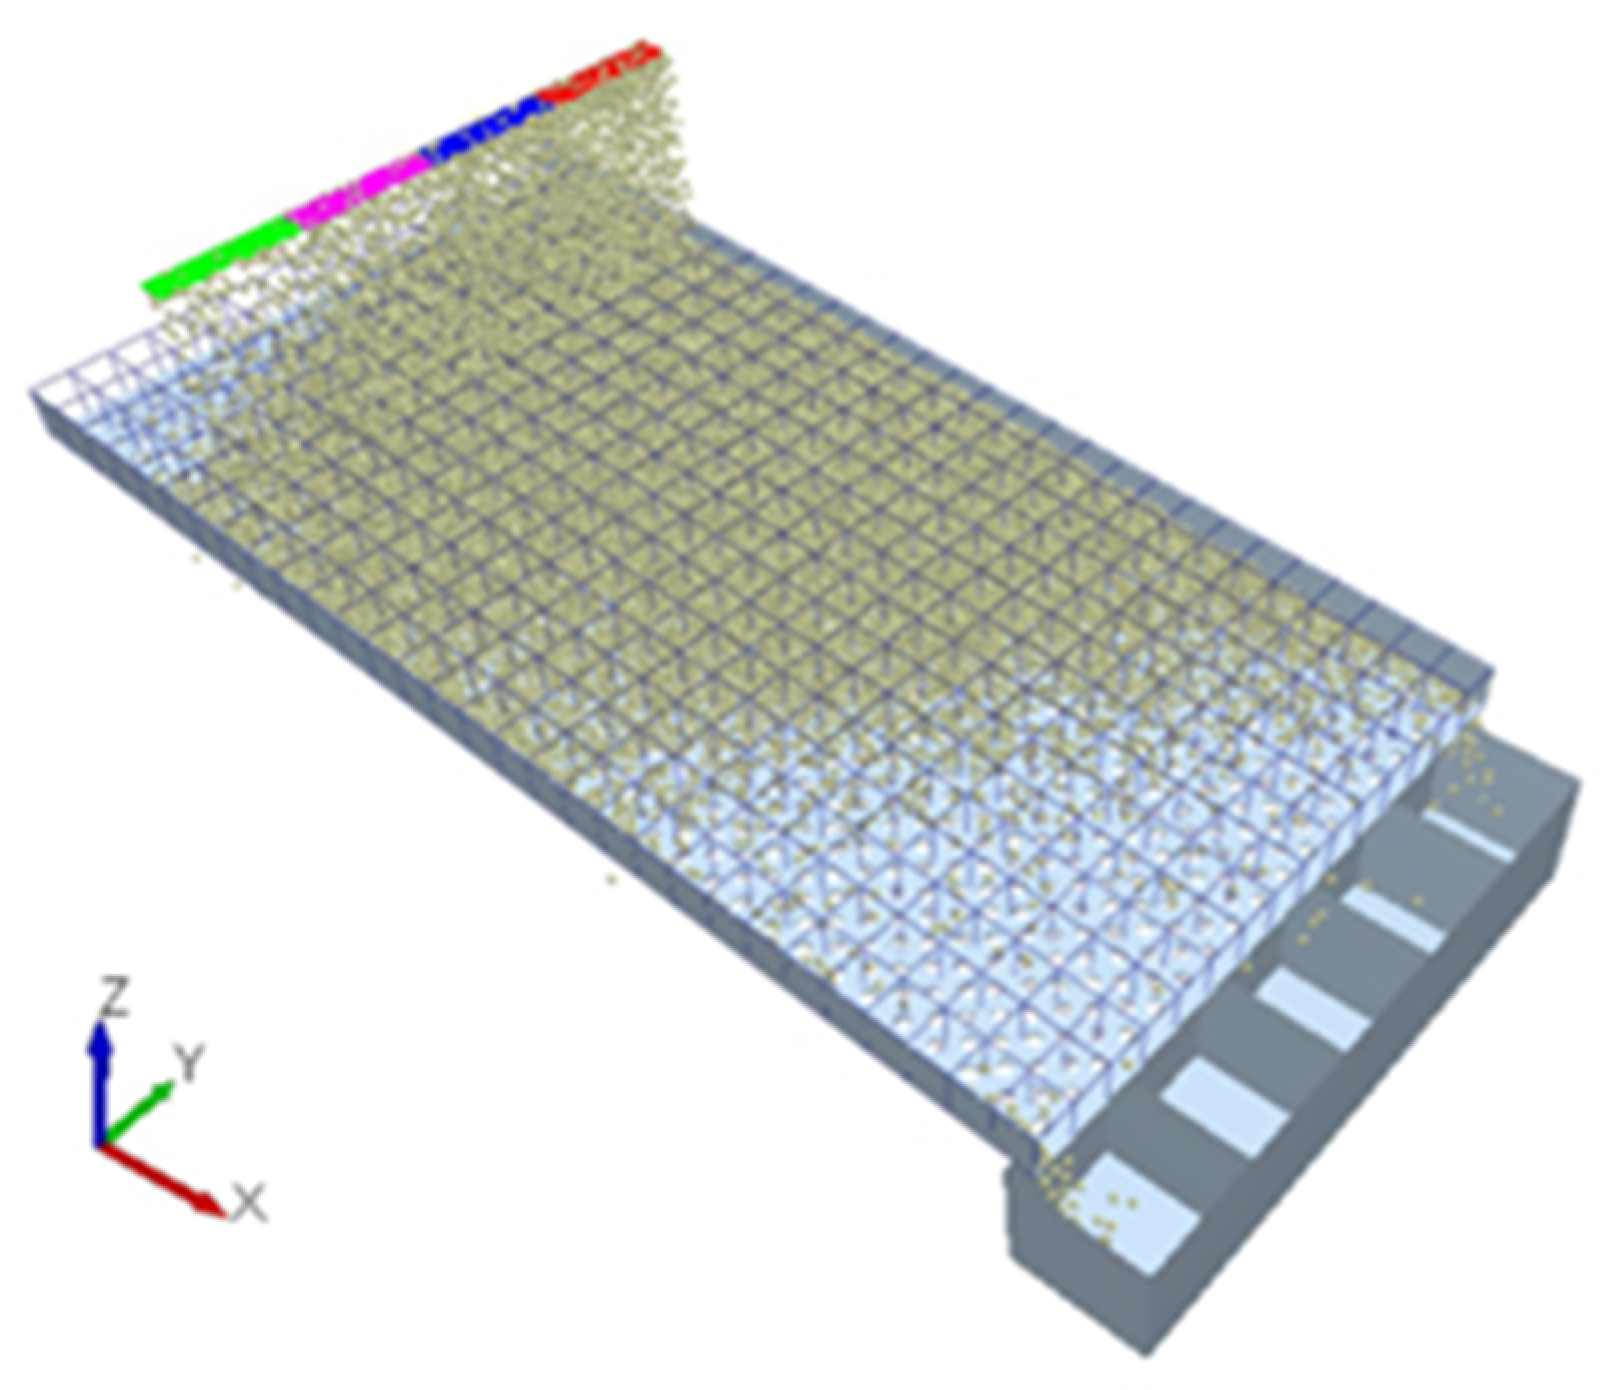
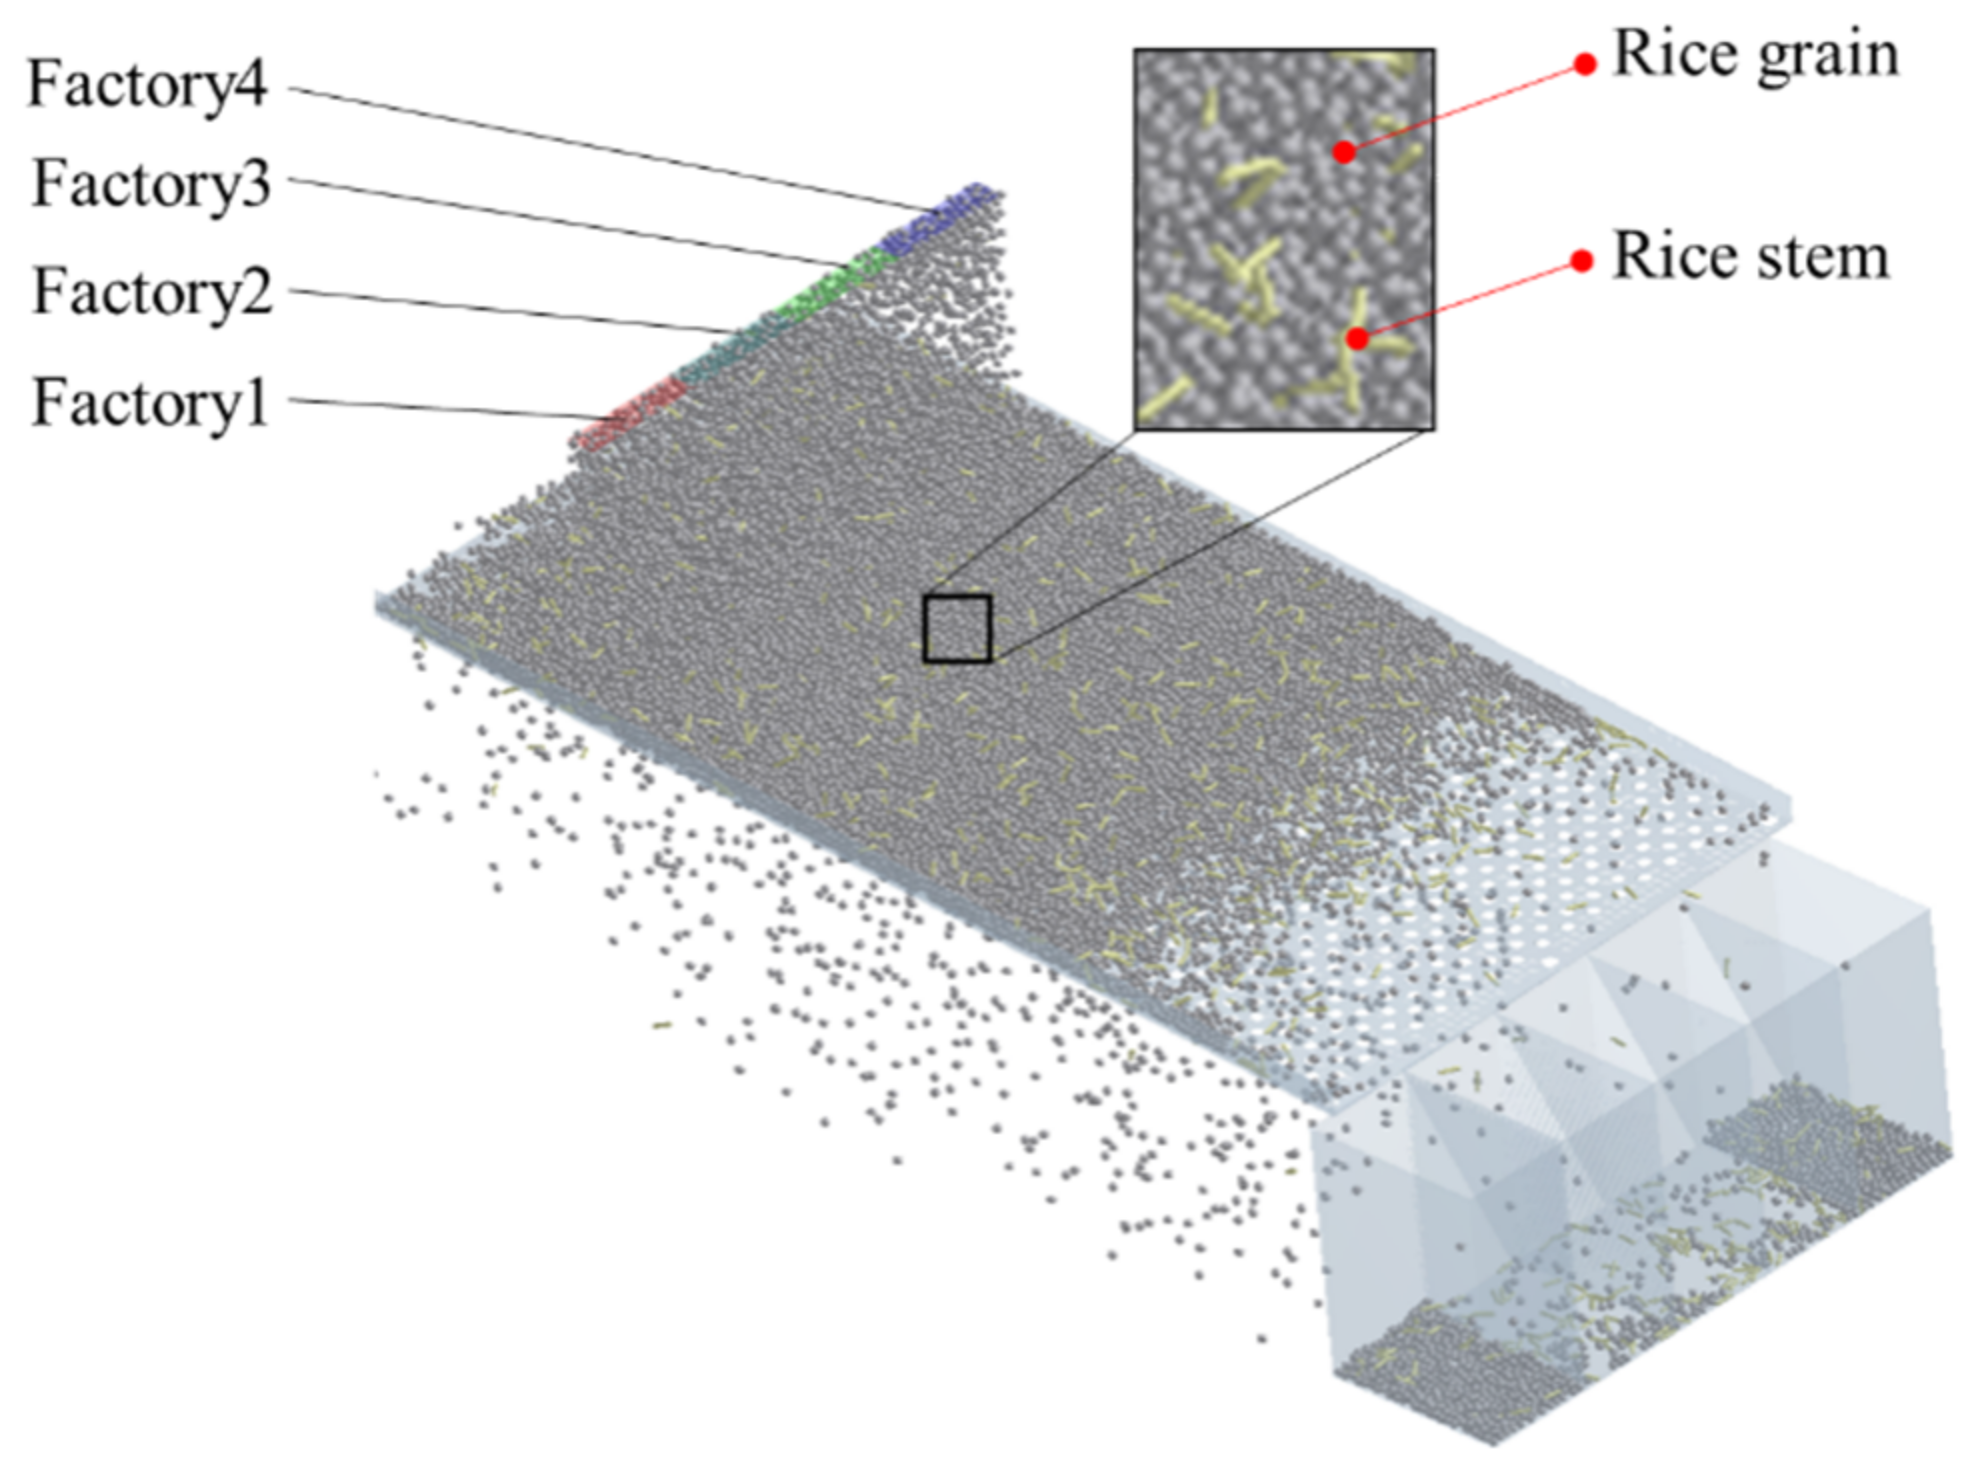
In the DEM, particles are rigid but deemed to overlap to model the deformation of the contacting surfaces during impact. Contact forces are expressed as functions of the overlaps. The Hertz–Mindlin contact model is most widely used in the dynamic analysis of agricultural dry granular materials. Therefore, this model was adopted to calculate the particle contact forces. The normal contact force Fn (unit, N) was calculated by:
F n = 4 3 E 0 δ n 3 / 2 R 0 2 5 6 ln e ln 2 e + π 2 2 E 0 R 0 δ n 4 m 0 v n r e l
The tangential force Fτ (unit, N) was expressed in incremental form, and the increment ΔFτ (unit, N) corresponding to the incremental tangential displacement Δδτ (unit, m) was given by:
Δ F τ = 8 δ n G 0 θ k Δ δ τ + ( 1 ) k f 1 θ k Δ F n
where E0 and G0 were the equivalent Young’s and shear modulus of the contact particles; δ n = v n r e l d t was the normal overlap; δ τ = v τ r e l d t was the tangential overlap; R0 was the equivalent radius (unit, m); m0 was the equivalent mass (unit, kg); e was the coefficient of restitution; vnrel and vτrel were the normal and tangential relative velocities (unit, m/s); f was the friction coefficient; and k = 1, 2 and 3 correspond to the loading, unloading and reloading processes. Detailed information about the governing equations, contact models, and interaction coefficient was given in the literature [35,36,37].
The shape of crop particles is usually irregular. There are many methods to express irregular shapes in DEM. The shape features have important effects on the dynamic characteristics of a single particle. However, when increasing the number of particles, the calculation load of the DEM increases sharply, resulting in extremely low calculation efficiency. Relevant studies indicated that the spherical particles were helpful to determine the interaction between particles and between particles and geometry, which was widely used. Rice grains are actually ellipsoidal, with spherical contact between grains. At the same time, considering the influence of particle shape on simulation efficiency, spherical particles are selected [38]. As shown in Figure 3, the radius of the sphere particle was 3.0 mm, the length of rice stem was 15 mm, and the radius was 1.5 mm. The parameters of materials are shown in Table 1 [37]. Simulations were performed by the DEM software (EDEM® 2018, Edinburgh, UK), in which the Hertz–Mindlin contact model was implemented through the API.

2.3. DEM Simulation

In the DEM simulations, particles were fed into the sieve from the front side, and the length and width of feed area were 400 and 25 mm, respectively. Particles transported towards the tail of the sieve and passed through the sieve apertures under the excitation of vibration. The grain thrown out from the tail of the sieve was the lost grain. According to the operation parameter range of grain harvester, the vibration frequency was 5 Hz, the amplitude was 16 mm, and the inclination angle θ was 4°. The effects of attitude angle and feeding uniformity on screening performance were mainly studied. Therefore, the above three parameters were set to be constant in all simulations.
In fact, the materials were not always in a state of uniform feeding. In the case of non-uniform feeding for agricultural materials, it was easy to observe problems, such as the accumulation of granular materials on the screen surface. Therefore, the non-uniform feeding of grain was further quantified and corresponding indicators were established. The feeding area was evenly divided into 4 subareas (each: 100 mm × 25 mm), the center coordinates were y1, y2, y3 and y4, respectively. y is a function used to describe the feeding position. Grain feeding rates of the 4 subareas can be defined r1, r2, r3 and r4 independently. The grain can be fed to the sieve with different distributions by changing the feeding rate of different subareas in the simulation parameters. The non-uniformity coefficient μ was proposed to describe the non-uniform feeding state of grain, which can be calculated by:
μ = i = 1 k r i · y i / i = 1 k r i
where k was the number of subareas and k = 4, ri was the feeding rate of the i particle plant (unit, grain/s). Due to the origin of the coordinate system that was selected at the center of the sieve surface, when the grains were fed into the sieve surface symmetrically along the x-axis, the non-uniformity coefficient μ was 0. The absolute value of μ increased, indicating that the difference in grain feeding rate on both sides of the x-axis became greater. Ten typical non-uniform feeding parameters were defined (see Table 2). The total feeding amount of materials was 10,200 grains/s and the feeding ratio of rice grain and stem was 50:1. They were re-distributed to each particle factory for feeding according to the ratio provided in Table 2.
Considering the non-uniform distribution of particles on the screen surface, 5 collection boxes were installed at the end of the vibrating screen to obtain the distribution of lost grains intuitively. The total sieving loss rate γ can be calculated by:
γ = j = 1 l y i = j = 1 l n j / i = 1 k r i
where nj was the number of lost grains in each collection box (l = 5 and k = 4). To obtain the distribution of grains on the vibrating sieve and analyze influence on the lost grains, the sieve surface was divided into 30 × 15 rectangular regions, as shown in Figure 4. The grain distribution on the vibrating sieve surface can be established by counting the number of grains in each region. When the attitude angle α was 0° and the total feeding rate r was 10,200 grains/s (approximately 1.2 kg/s). The DEM simulation of stable sieving state with feeding parameter S1 is shown in Figure 5.

3. Results and Discussion

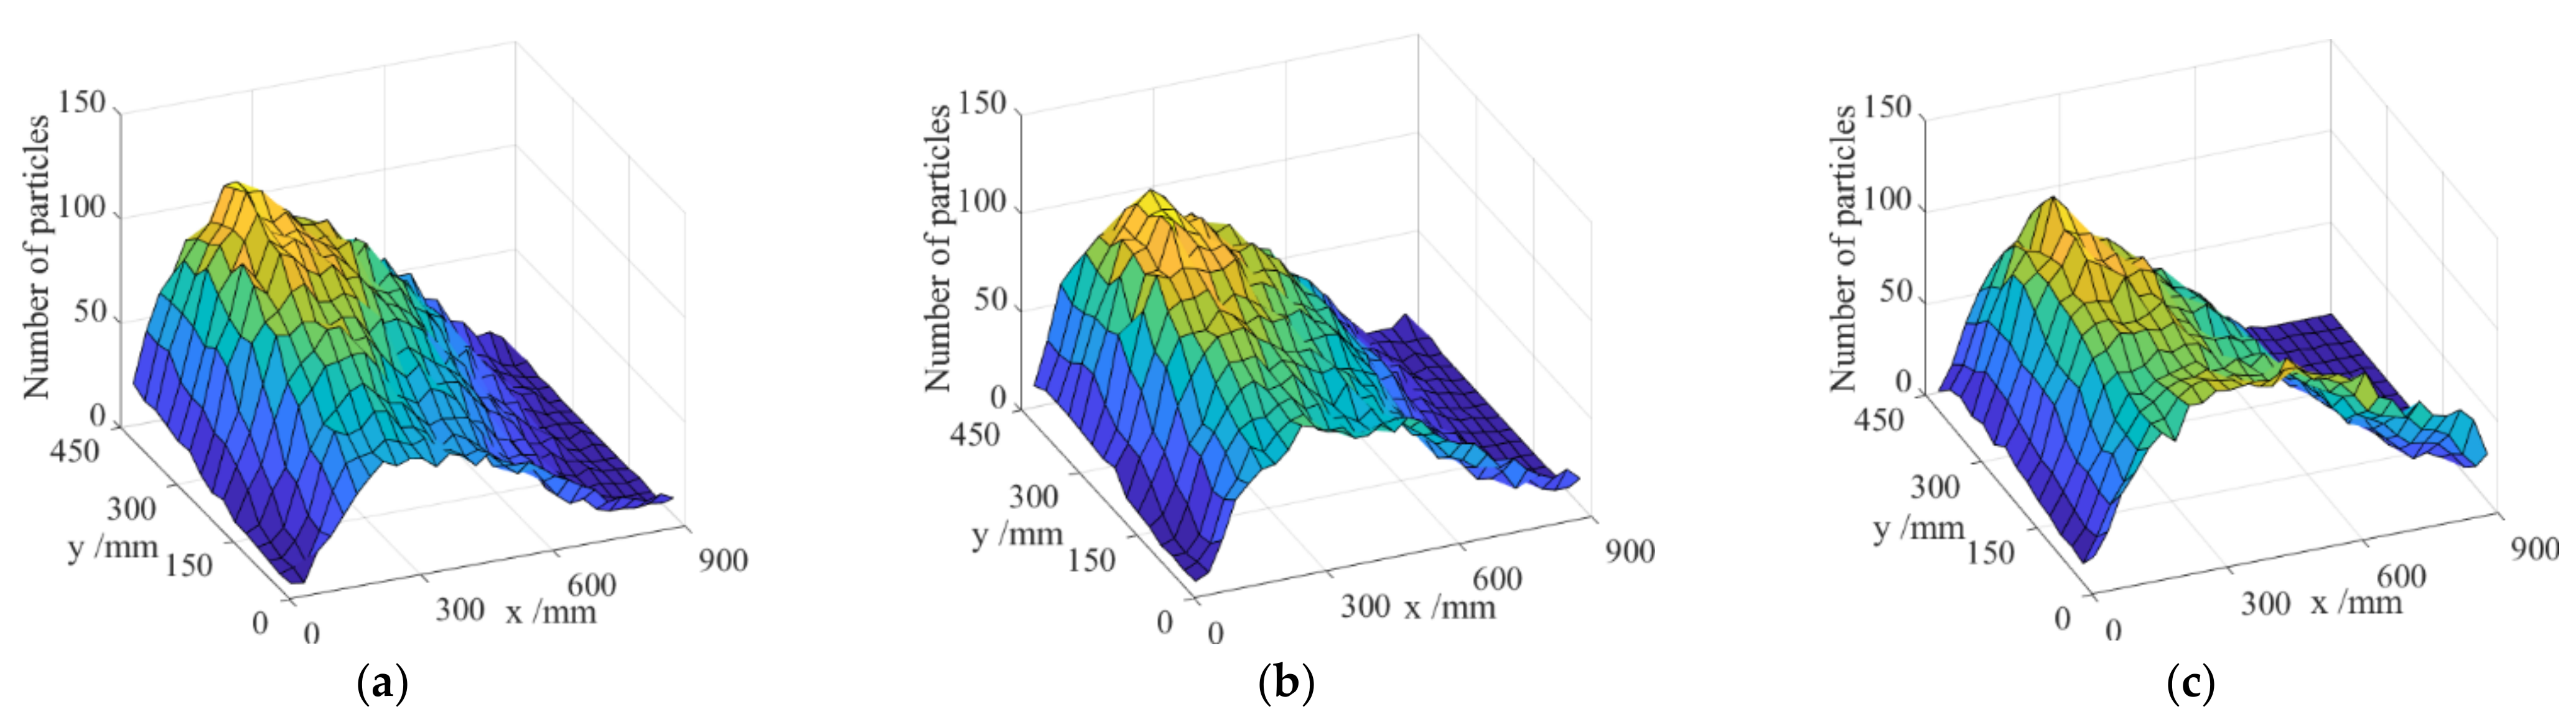
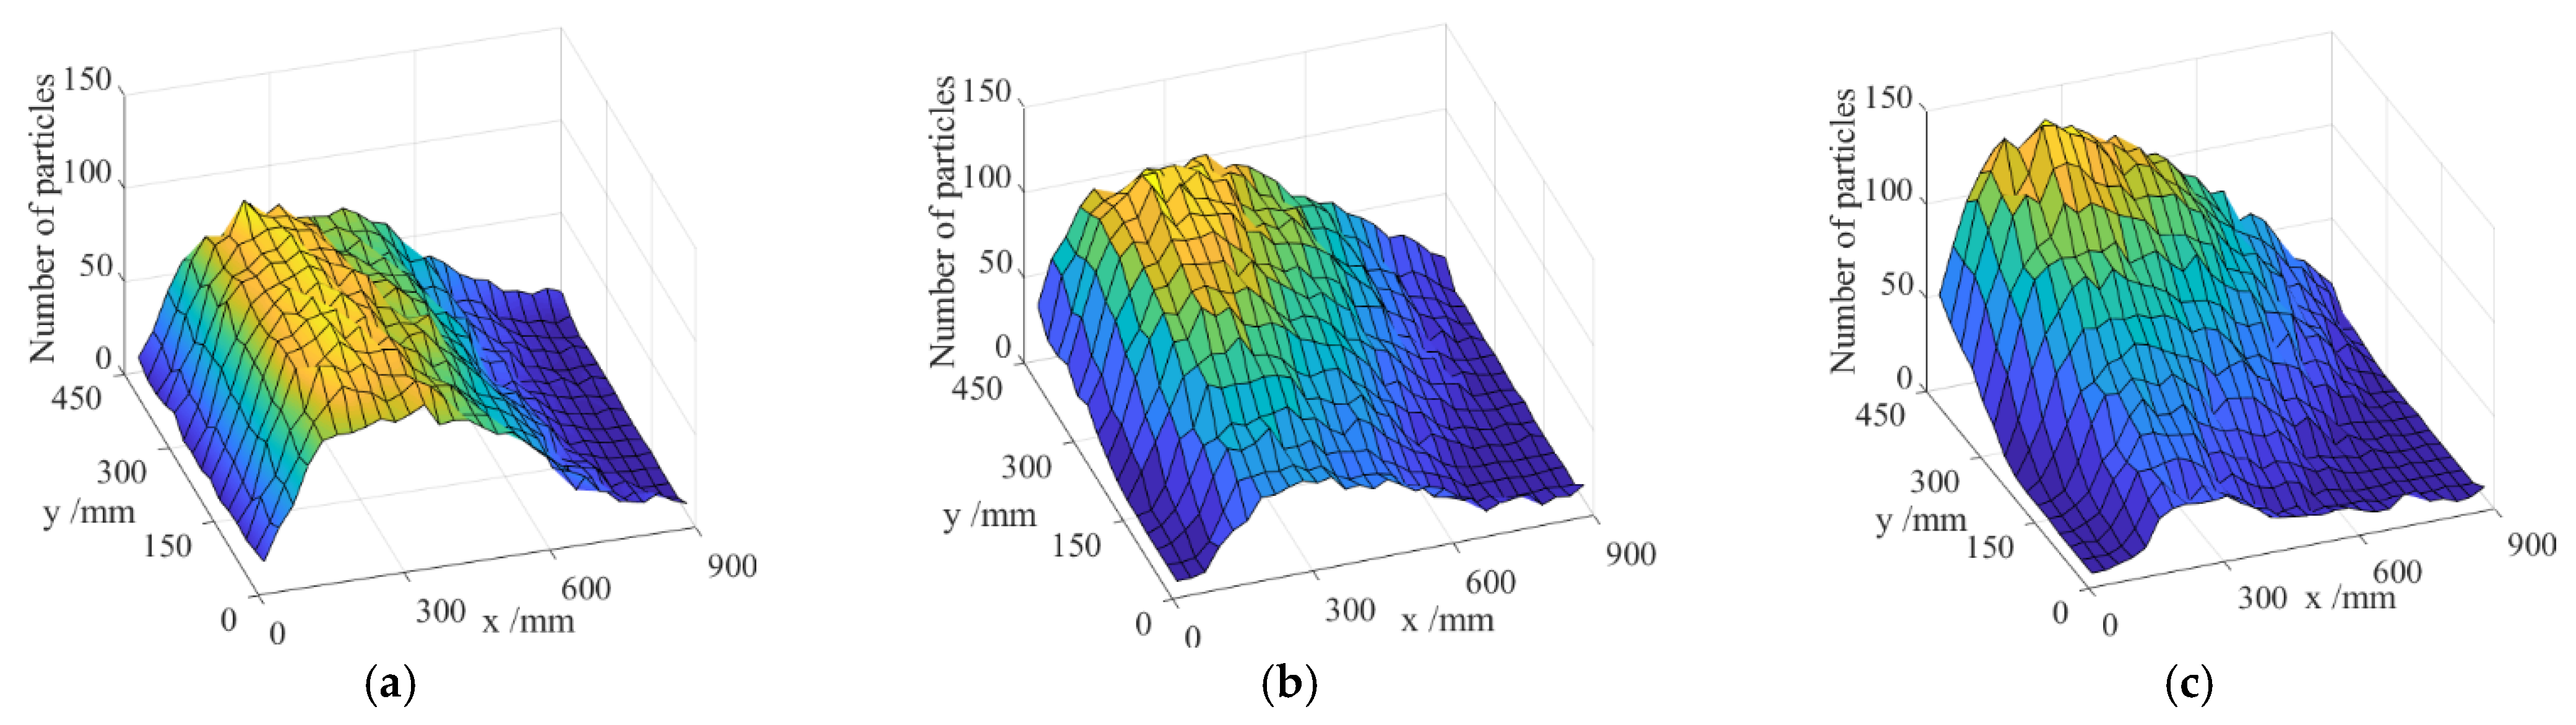
3.1. Grain Distribution on Sieve Surface

DEM simulations of the grain sieving process were carried out with the feeding parameters of Table 1 to obtain the distribution state of the material and analyze the influence on the loss rate under different feeding conditions. When the screen surface is at a stable time in the simulation, we counted the number of particles in different rectangular areas. As shown in Figure 6a, when the attitude angle α was 0°, the inclination angle θ was 4°, the non-uniformity coefficient μ was 0, the total feeding rate r was 10,200 grains/s, and the distribution of grains for the sieve surface was uniform along the y-axis. Due to the fences on both sides of the sieve, there was some accumulation of grains on both sides, especially in the screen feeding area. The reason for this was that α was 0°, the transport direction of the sieve for grains was along the x-axis, and the grains could move evenly to the tail of the sieve. As shown in Figure 6b, when the grains were fed into the sieve surface in a non-uniform state (μ = 1), the grains were asymmetrical along the y-axis of the sieve surface. The vibration of the sieve had no driving force along the y-axis, which cannot promote the movement of the grains from one side to the other side. As shown in Figure 6c, with the non-uniformity coefficient increased, the non-uniform distribution of grains on the sieve surface would also increase.
Therefore, the uniformity of the grains distributed along the y-axis was an effective way to increase the utilization efficiency of the sieve surface and improve sieving performance. Under the DEM simulation parameters in Figure 6b, the attitude angle α between 0° and 4° was applied to the sieve and the steady grain distribution on the sieve surface is shown in Figure 7. At this time, the parameters are the same as those set in Figure 4b, θ = 4° μ = 1. With the attitude angle α increased, there was obvious y-axis movement of the grains on the sieve surface, rather than them moving along the x-axis. The vibrating screen surface produced a tangential force component on the particles in the y-axis direction, which effectively promotes the transport of grain from the more side to the lesser side. The transport speed of the grain along the y-axis mainly depended on the attitude angle α. Compared to the grain distribution for the three angles, a reasonable selection of attitude angle guaranteed the uniform distribution of grains on the vibrating sieve. In addition, the results of different parameters for DEM simulation indicated that a reasonable attitude angle was closely related to the grain feeding non-uniformity coefficient.

3.2. Effects of Non-Uniformity Feeding and Attitude Angle on Screening Performance

The moving speed of particles was closely related to the screening performance of the vibrating screen. The greater the moving speed of the particles, the faster the diffusion on the screen surface, and the greater the processing capacity of the vibrating screen per unit of time. Therefore, the particle velocity was analyzed to express the influence of non-uniformity feeding and attitude angle on the screening performance.
As shown in Figure 8a, the average velocity of the particle group in the x-axis was basically unchanged under different non-uniformity feeding. Therefore, the non-uniformity feeding had little effect on the average velocity in the x-axis of the particle group. With the increased non-uniformity feeding, the y-axis average velocity of the particle group increased continuously. There was a linear relationship between non-uniformity feeding and the y-axis average velocity of the particle group. When the particles were fed non-uniformly, the number of particles in the areas on both sides of the x-axis for the screen surface was different. At this time, the interaction state of the internal balance for the particle group in the y-axis would be broken, which was similar to the flow of fluid to the lower part. The particle group moved to the area with less particle distribution and the average velocity in the y-axis would increase.
As shown in Figure 8b, the x-axis average velocity of the particle group remained almost unchanged with the change in the attitude angle for the screen surface. The results indicated that the attitude angle of the screen surface had little effect on the x-axis average velocity of the particle group. With an increase in the attitude angle for the screen surface, the y-axis average velocity of the particle group increased monotonously, and the slopes of the two lines were basically the same, which indicated that the attitude angle of the screen surface had a similar influence on the y-axis average velocity of the particle group under different non-uniformity feeding. When the attitude angle of the screen surface was not 0°, the screen surface presented a state of high on one side and low on the other side in the y-axis. At this time, the particles would accelerate to the lower area after falling on the screen surface. The larger the attitude angle of the screen surface, the greater the acceleration of the y-axis movement for the particle group.
Non-uniformity feeding and attitude angle had a great impact on the speed of particles in the y-axis. The speed of particles in the y-axis increased with the change in non-uniformity feeding and the increase in attitude angle, which showed that the particle dispersion in the y-axis of the screen surface was wider. This would be conducive to screening the materials on the screen surface and further improve the screening performance.

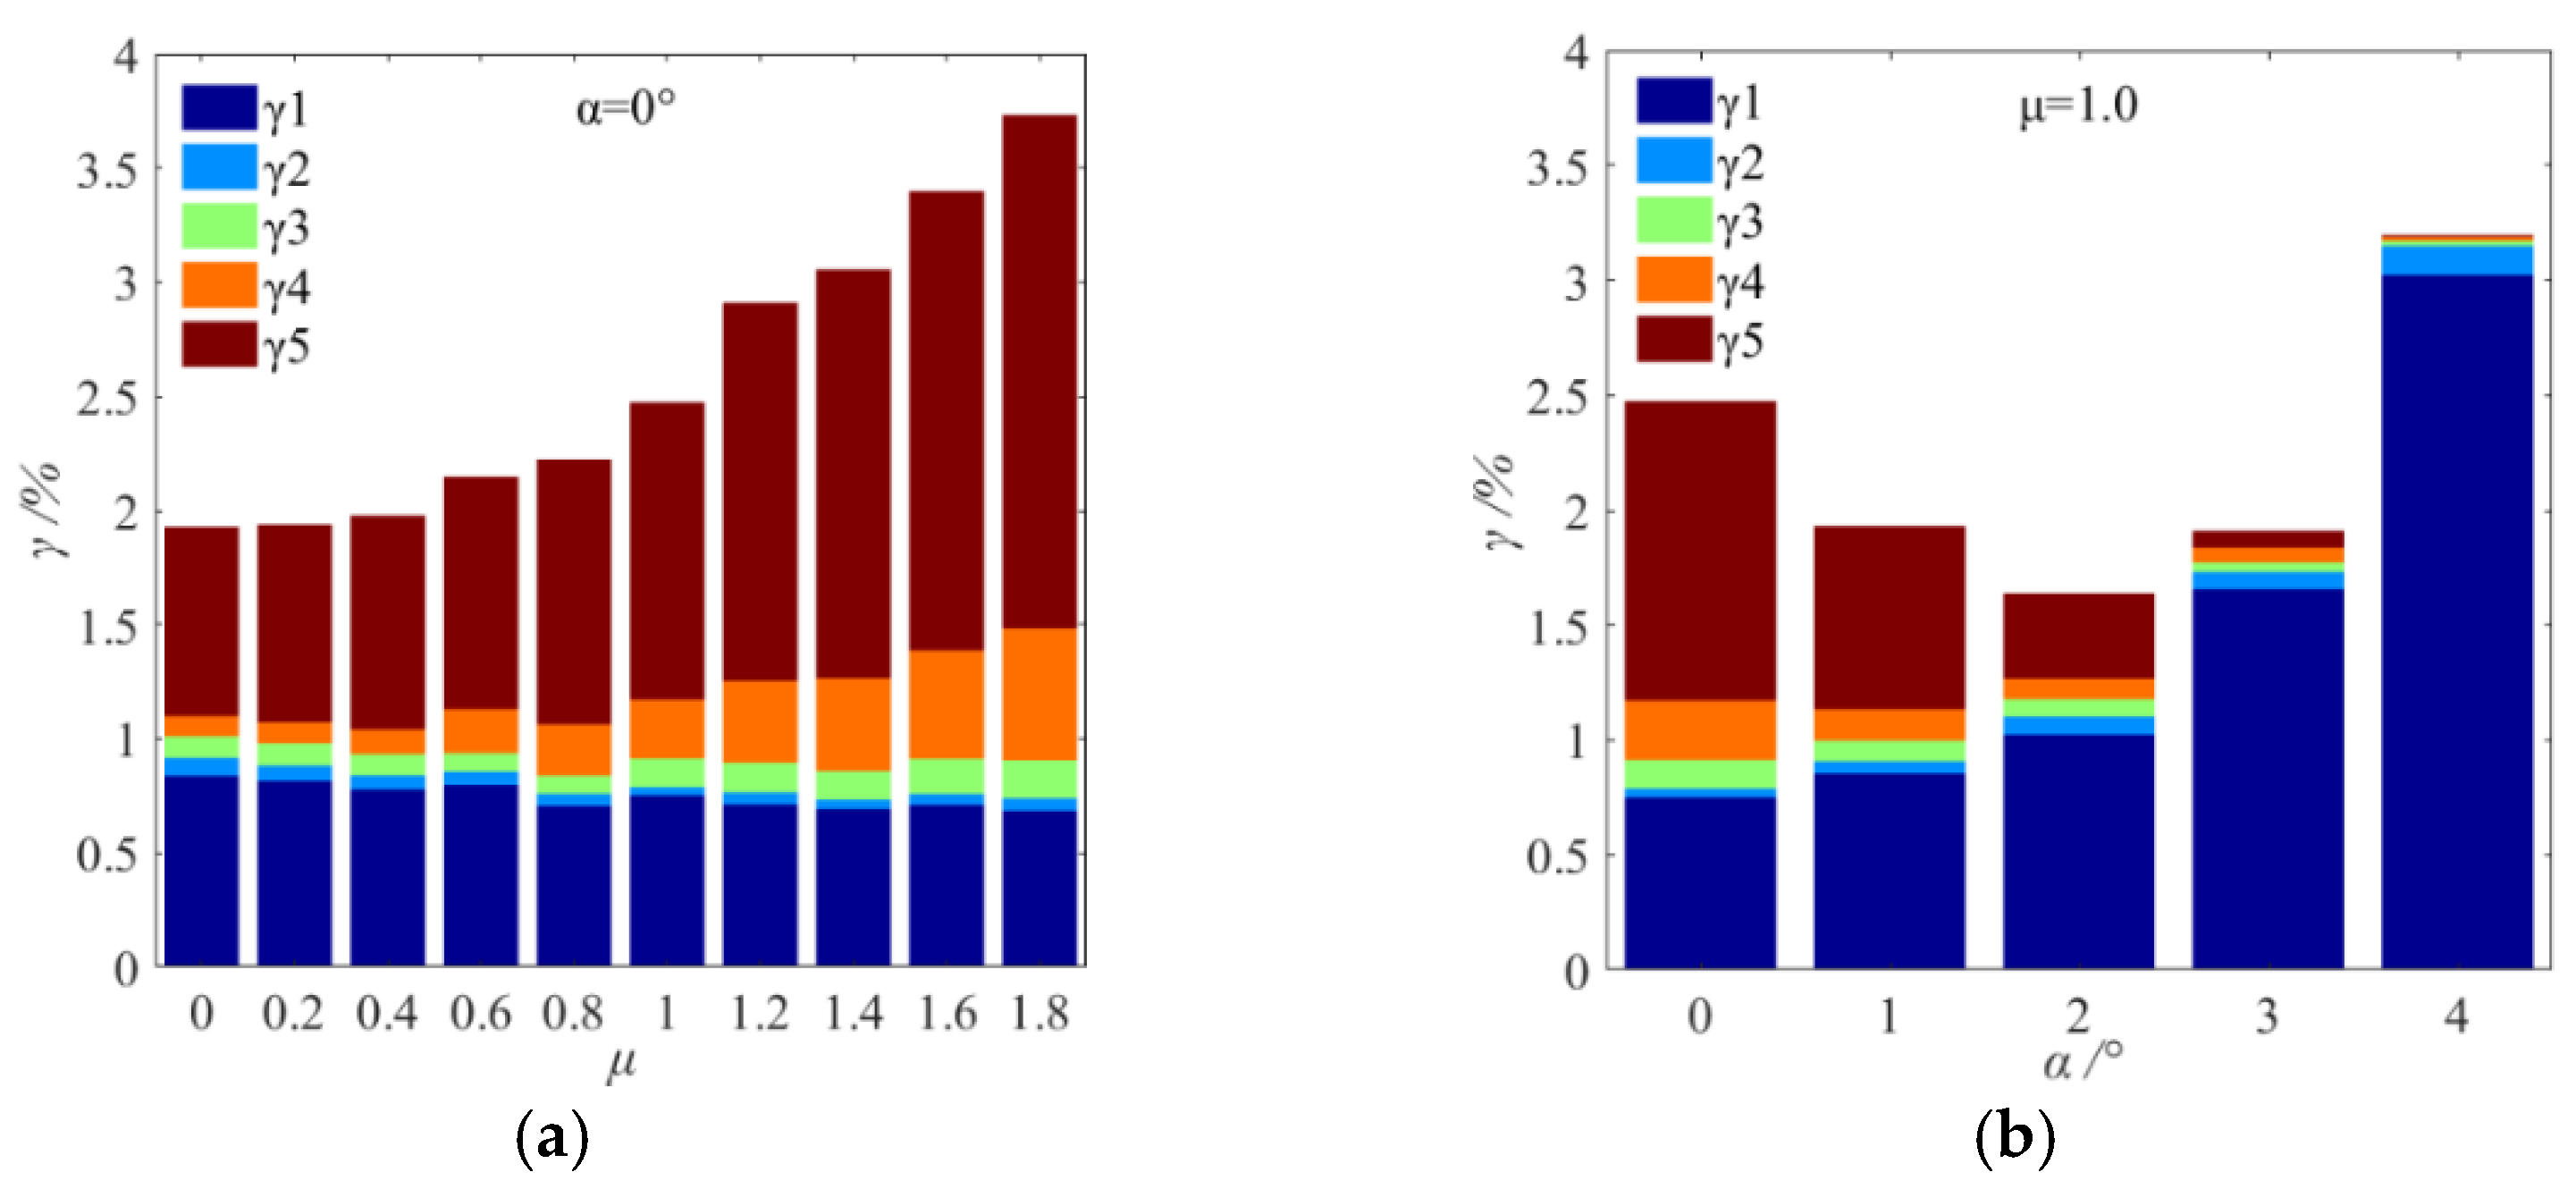
3.3. Distribution of Lost Grains

The influence of the grain feeding state and the attitude angle for the sieve surface on the distribution of lost grains and the total loss rate were the basis for improving the sieving performance. The distribution of lost grains was analyzed under 10 feeding conditions, as shown in Table 2. The attitude angle α was 0° and the total feeding rate r was 10,200 grains/s. As shown in Figure 9a, the grains lost in the areas of both sides of the sieve tail were significantly more than those in the middle area. This was mainly due to the grain accumulation by two fences of the sieve. When the grains were fed uniformly (μ = 0), the lost grains were also distributed symmetrically along the y-axis. However, when the grains were fed non-uniformly, more grains would be lost on the side with a higher feeding rate. The total loss rate (γ) would increase monotonically with the increase in the non-uniformity coefficient (μ).
Under the DEM simulation parameters in Figure 6b, Figure 9b showed the variation of grain loss rate with attitude angle α (0–4°). The change of lost grain was mainly on the two sides of the sieve. With the increase in α, the speed of grain movement in the y-axis increased accordingly, resulting in an increase in γ1, a decrease in γ5, and the minimum value appeared near α = 2°. Therefore, the variation of total loss rate γ majorly depended on γ1 and γ5, γ = γ1 + γ2 + γ3 + γ4 + γ5. This result was consistent with the results of grain distribution on the sieve surface given in Figure 7.
The total loss rate was the most important index reflecting the performance of the sieving operation. The relationships between the total loss rate (γ) and the attitude angle (α) at different non-uniformity coefficients (μ) are shown in Figure 10. The total loss rate could be fitted by the Fourier function:
γ = a 0 + a 1 cos ( ω α ) + b 1 sin ( ω α )
where a0, a1, b1 and ω were undetermined coefficients. These coefficients could be determined using nonlinear regression calculation under a certain μ. The fitting calculation results indicated that the coefficients of determination (R2) were all greater than 0.99.
The influence of attitude angle on loss rate was significant by SPSS 26.0, such as ANOVA and the Bonfreney comparison. The test results of ANOVA are shown in Table 3. The p-value was 0.031, far less than 0.05, which showed that the influence of attitude angle on loss rate was significant. The correctness and reliability of the formula were verified. In addition, Bonfreney’s results showed that the significance was mainly raised to the attitude angles of 1° and 4°.

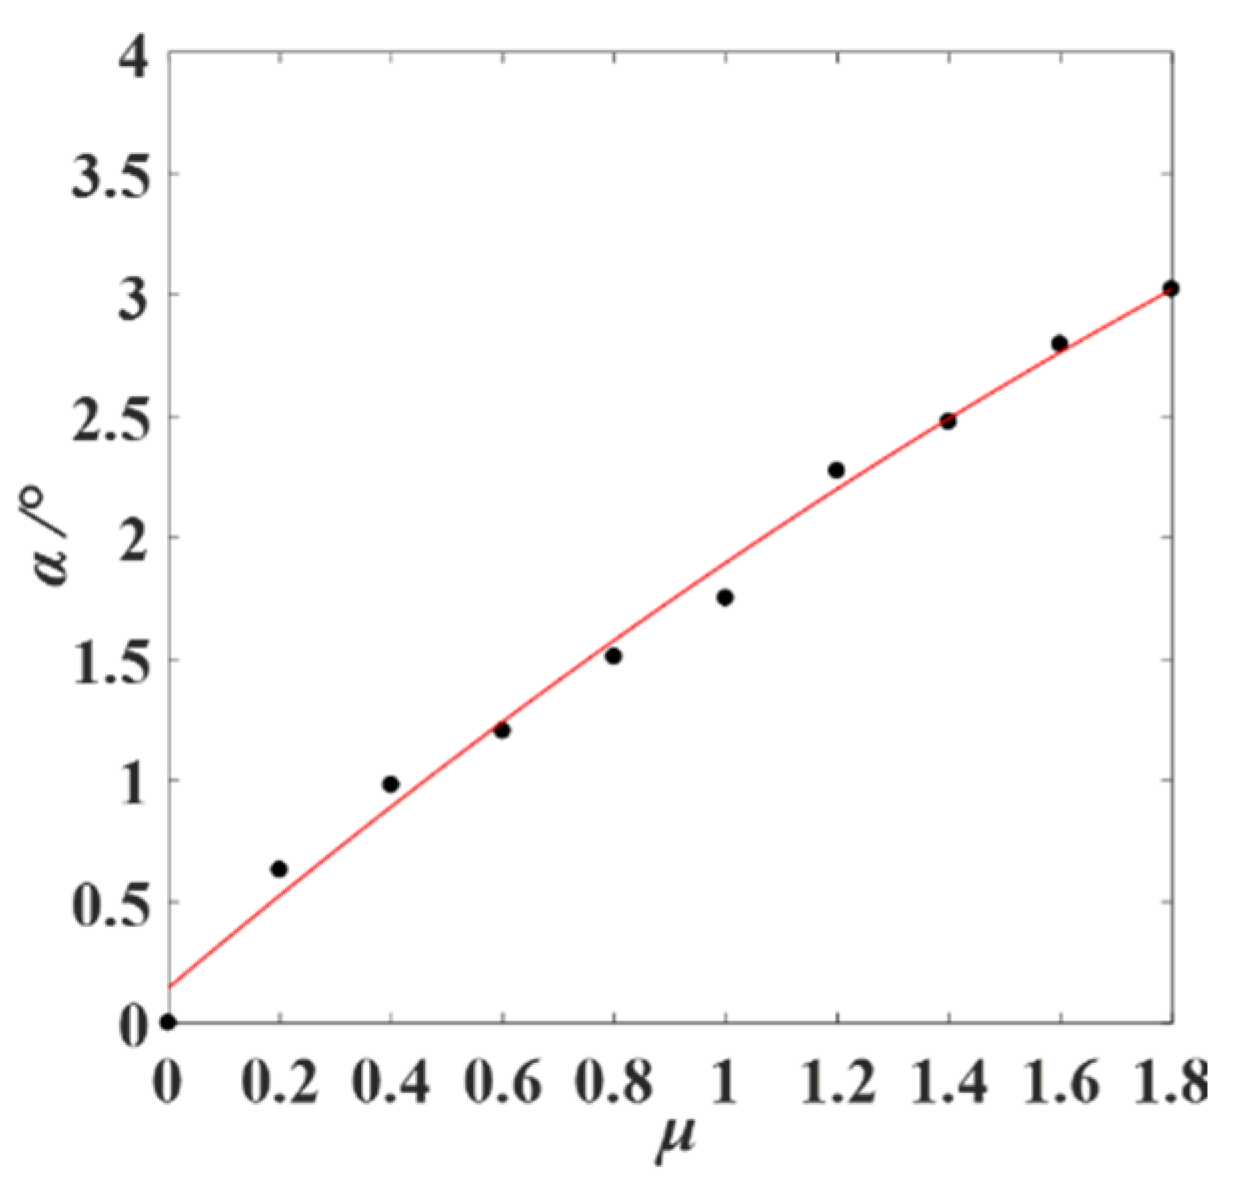
3.4. Optimization of Attitude Angle

The discussion about the attitude angle (α) and non-uniformity coefficient (μ) can be seen in Figure 10 and the results of the effect of attitude angle on loss rate in Table 3. The effect of attitude angle (α) on total loss rate γ was significant. When the grains were fed to the vibrating sieve surface non-uniformly, an optimized attitude angle was an effective way to reduce the loss rate. The optional attitude angle (αo) corresponding to the minimum loss rate (γmin) was the key under the non-uniformity coefficient (μ). According to Formula (5), when tan(ωα) = b1/a1, the loss rate would reach the minimum value γmin. The calculated variation of the optional attitude angle α is shown in Figure 11. The relationship could be fitted by an exponential function:
α = a · ( 1 1 + e b · μ 1 2 )
where the fitting coefficients a and b were 8.322 and 1.003, respectively. The coefficients of determination R2 were greater than 0.98.

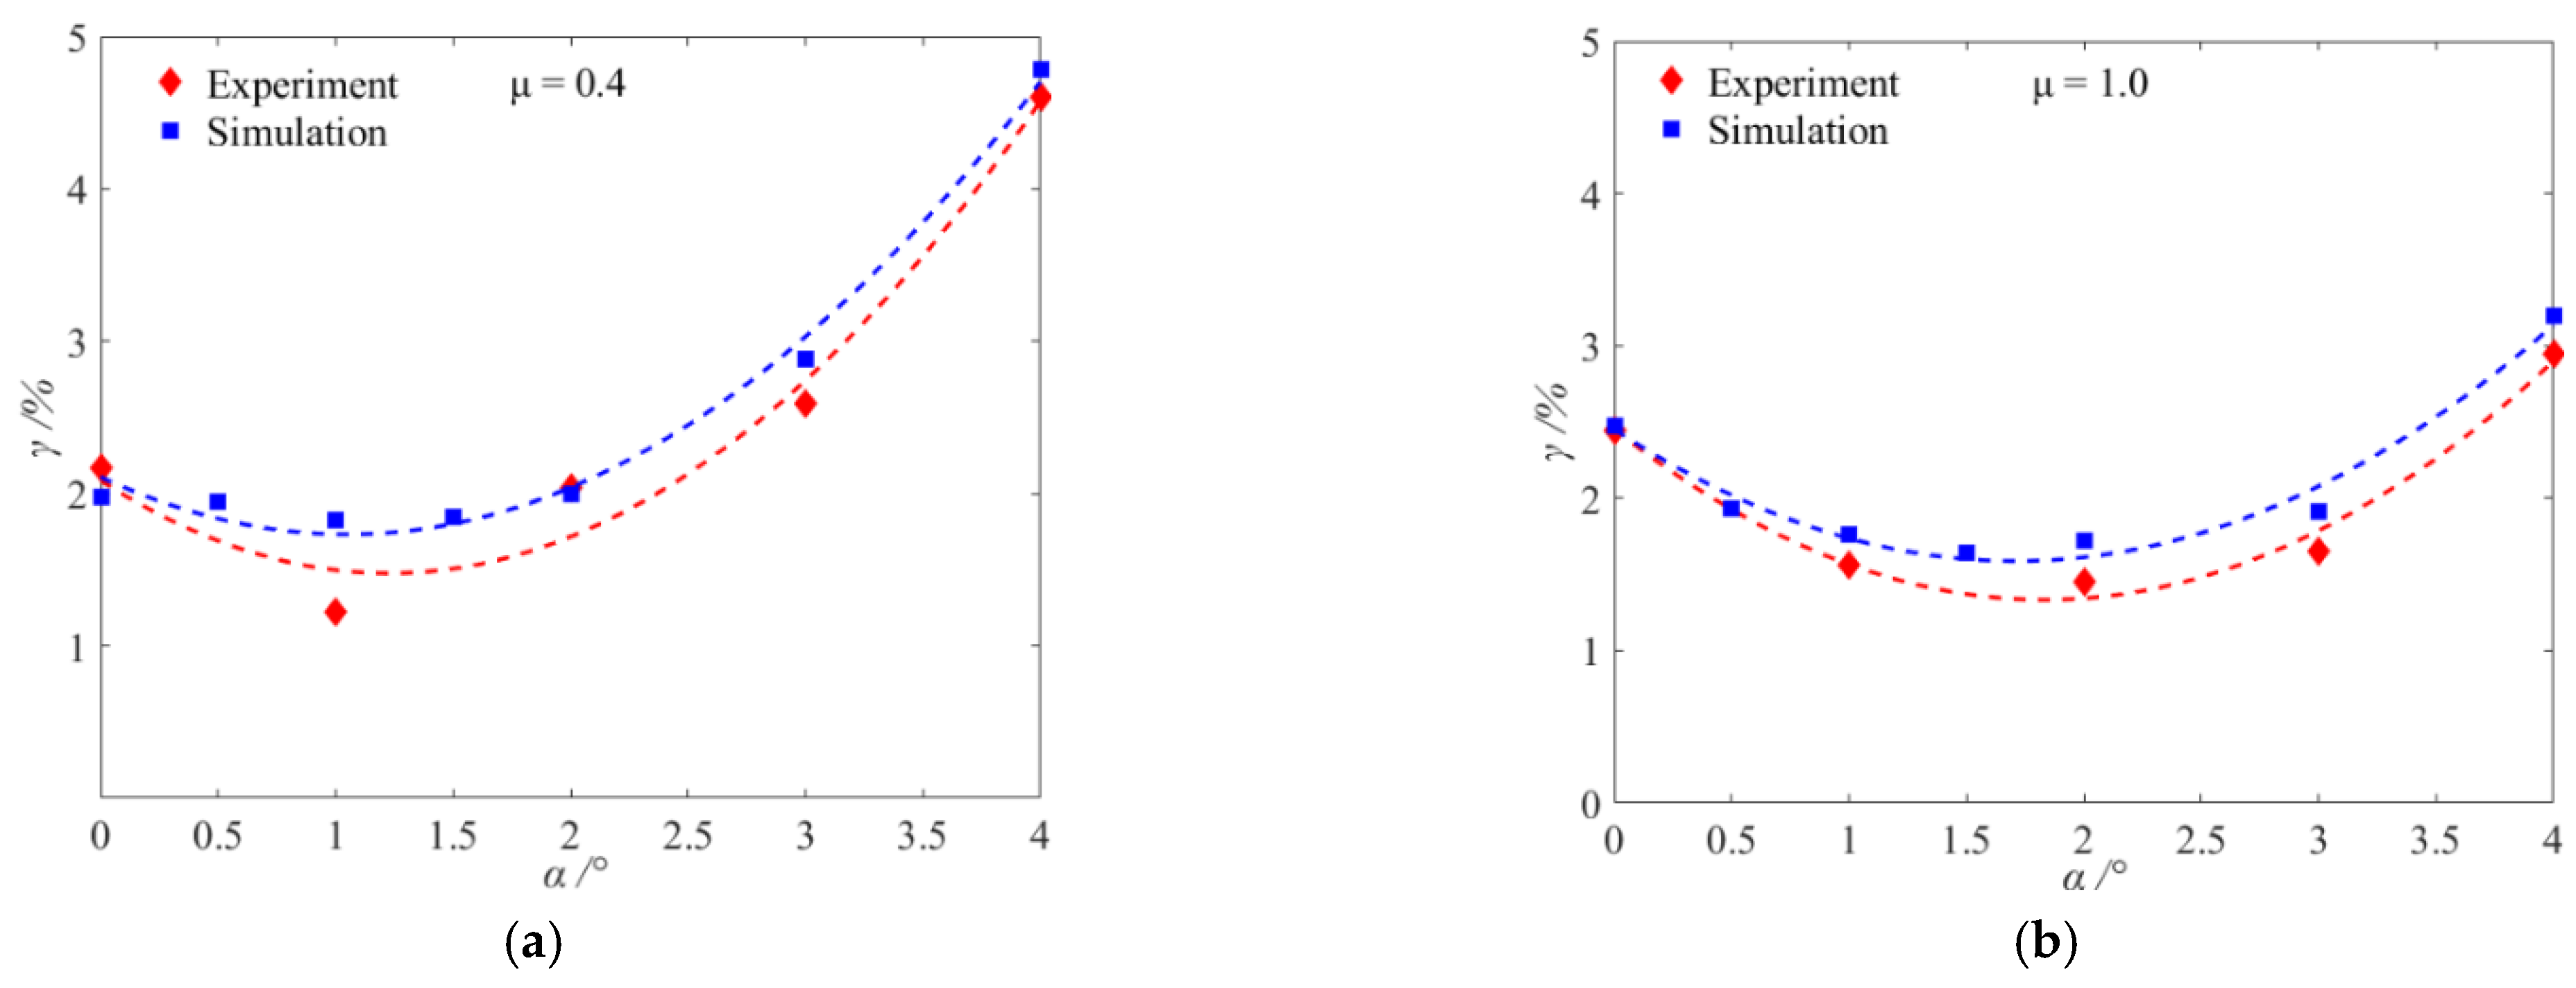
3.5. Verification of DEM Simulations

Several DEM simulations of different total feeding rates r were performed to verify the feasibility and stability of the established model. Two cases of different r values, i.e., 8160 grain/s and 12,240 grain/s were selected. The vibration frequency was 5 Hz, the amplitude was 16 mm, and the initial inclination angle was 4°. The attitude angle α was 0–4°.
The variation of the total loss rate (γ) with the attitude angle (α) at different total feeding rates (r) is shown in Figure 12. When the total feeding rate increased, the total loss rate would increase. The variation trend of total loss rate with attitude angle was similar, which both showed a decrease and then an increase. In Figure 12a, when the total feeding rate was 8160 grain/s and 12,240 grain/s, respectively, the total loss rate reached the minimum value γmin. At this time, the attitude angle was 1.93° and 0.88°, respectively. In Figure 12b, when the total feeding rate was 8160 grain/s and 12,240 grain/s, respectively, the total loss rate reaches the minimum value γmin. Meanwhile, the attitude angle was 2.99° and 1.70°, respectively. The total loss rate was low and the fluctuation was small at the total feed rate of 8160 grains/s, which is due to the total feed rate being far lower than the load tolerance limit of the vibrating screen, and the adjustment of attitude angle having little impact on the total loss rate for the vibrating screen. When the total feed rate was 12,240 grains/s, the total loss rate changed greatly with the attitude angle, and the total feed rate was higher than the upper limit of vibration screening load tolerance. According to the optimization model, it was necessary to adjust the attitude angle to reduce the total loss rate of the vibrating screen. In Formula (6), when the non-uniformity coefficients (μ) were 0.4 and 1.0, respectively, the optional attitude angle (αo) was 0.82° and 1.90°, respectively, and the prediction errors were 7.32% and 10.5%, respectively. For a large total feed rate with certain vibration parameters, the obtained optimum model was universal.

3.6. Grain Sieving Tests

The bench tests for grain sieving were carried out to verify the performance of the proposed method for the simulation tests.
The vibration parameters were consistent with the DEM simulation parameters. The total feeding rate was 1.2 kg/s (r = 10,200 grains/s). As shown in Figure 13, two cases of different non-uniformity coefficient (μ) values, i.e., 0.4 and 1.0 were selected.
As shown in Figure 14a, the optional attitude angle (αo) of the experiment and simulation was 1.23° and 1.05°, respectively. In Figure 14b, the optional attitude angle (αo) of the experiment and simulation was 1.90° and 1.77°, respectively. The errors of the two groups of bench tests were 14.6% and 6.8%, respectively, which was small. The results indicated that the grain sieving loss rate could be effectively reduced by controlling the attitude angle. Due to operational errors during the sieving experiments of rice grains, there were some differences between the simulation and test results. However, the basic sieving dynamic characteristics were consistent, which proved that the DEM simulation and the established method were reliable.

4. Conclusions

The non-uniform feeding of materials affects vibration screening performance. Therefore, under different feeding states, the particle screening process of a multi-degrees of freedom hybrid vibrating screen with different attitude angles was simulated by the discrete element method (DEM). The research conclusions were as follows:
(1)
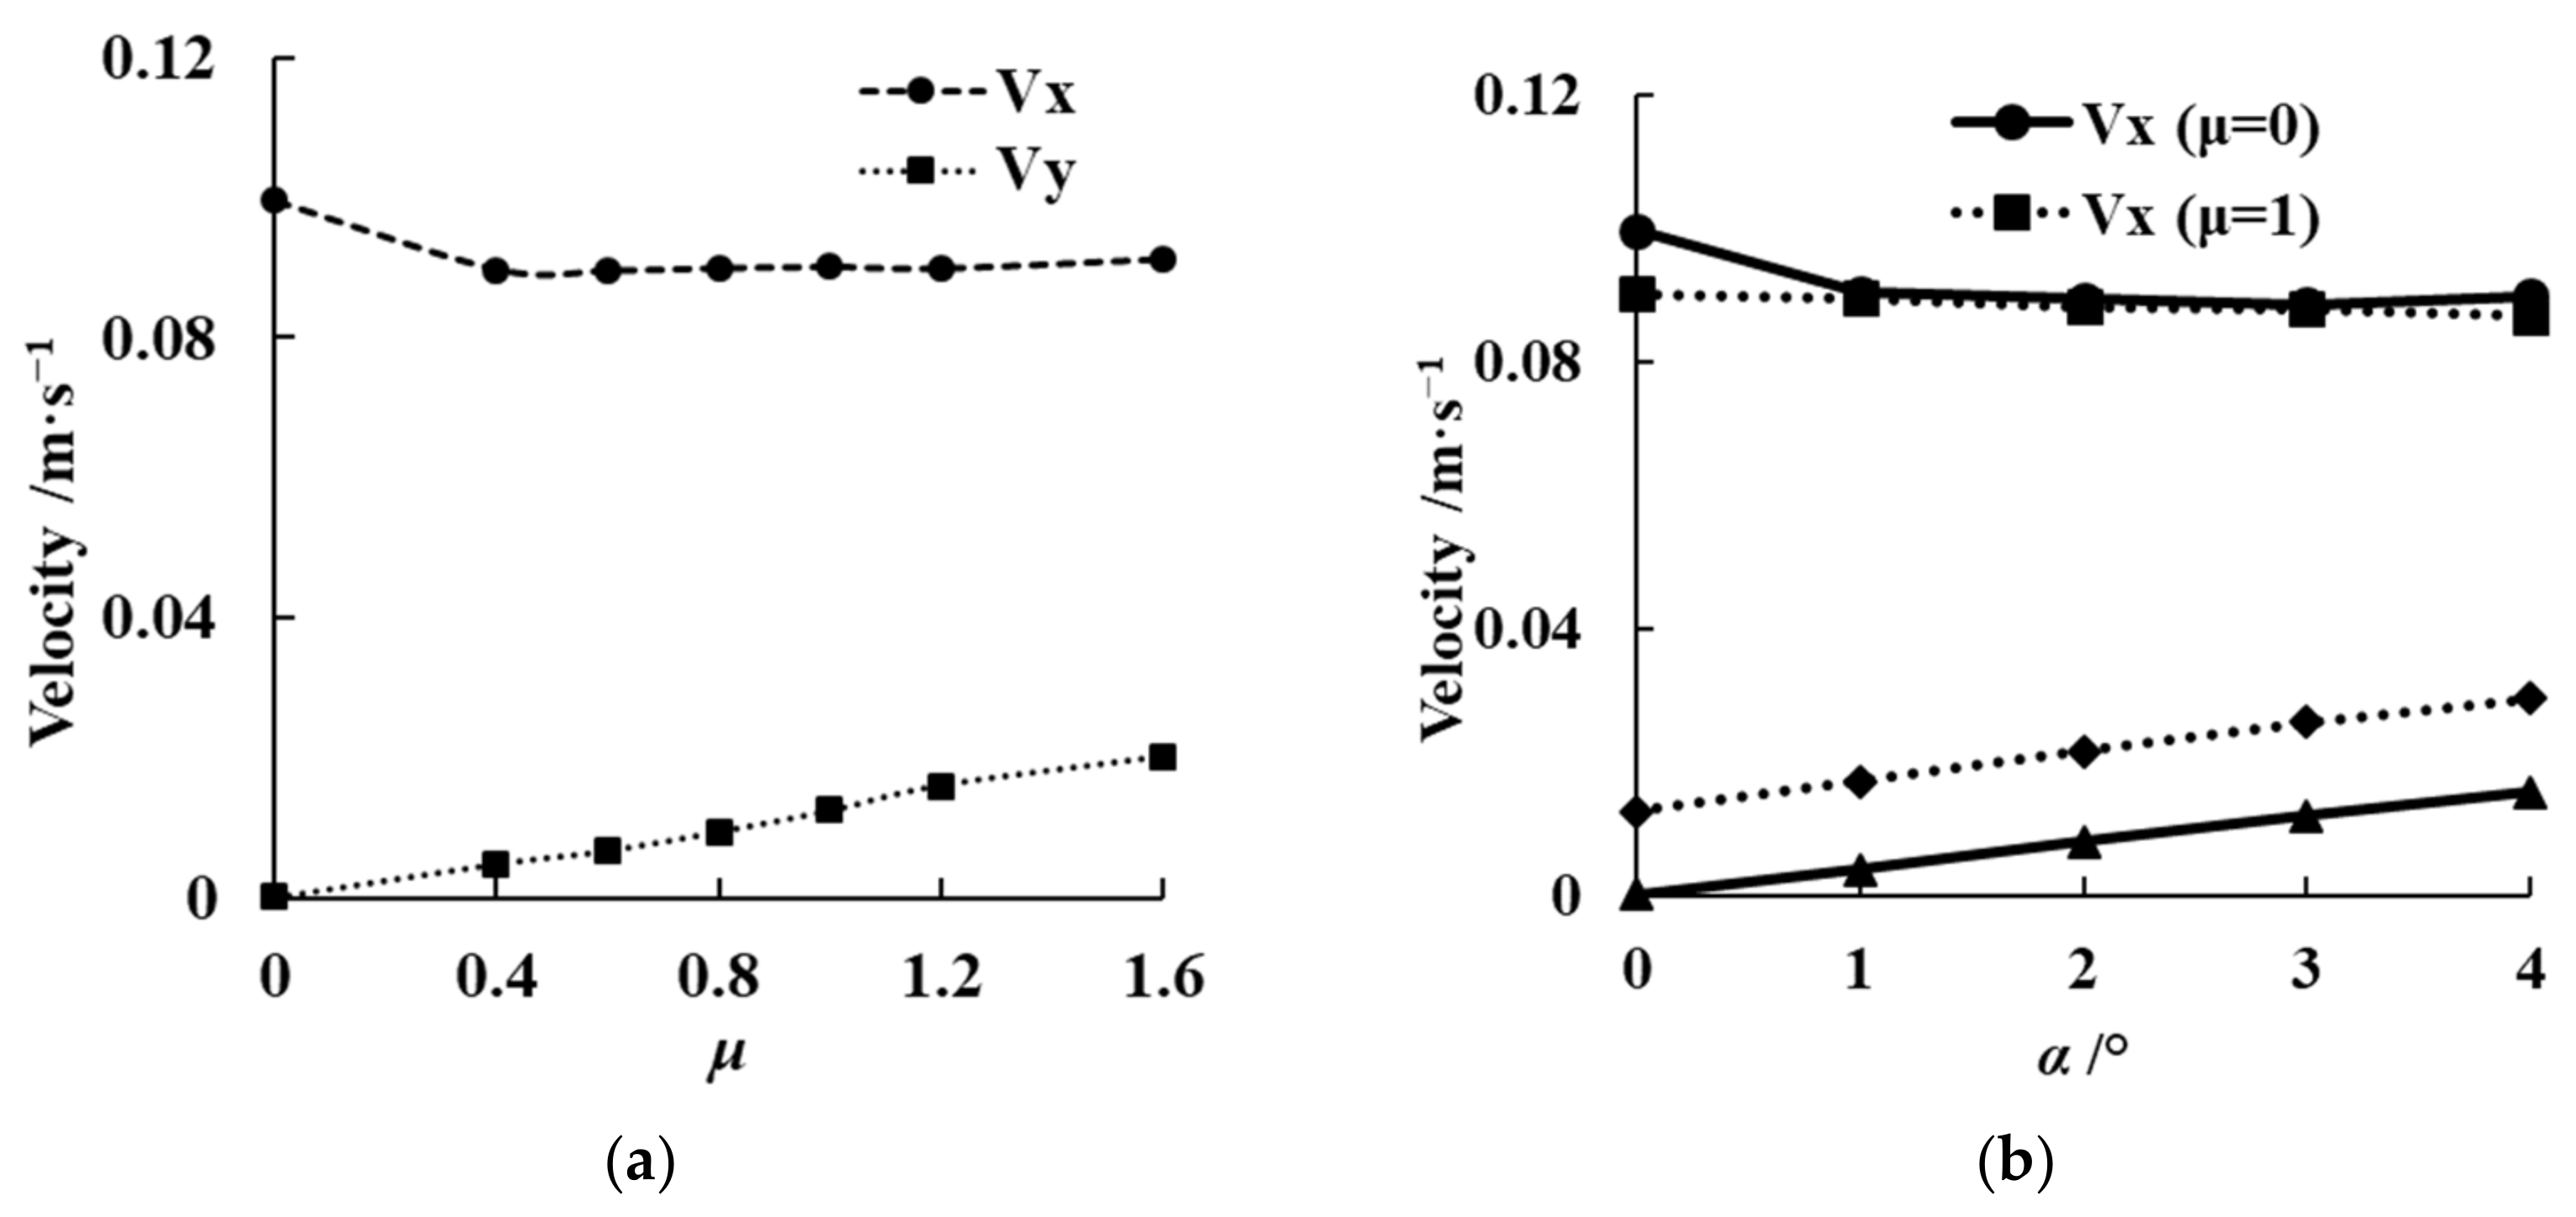
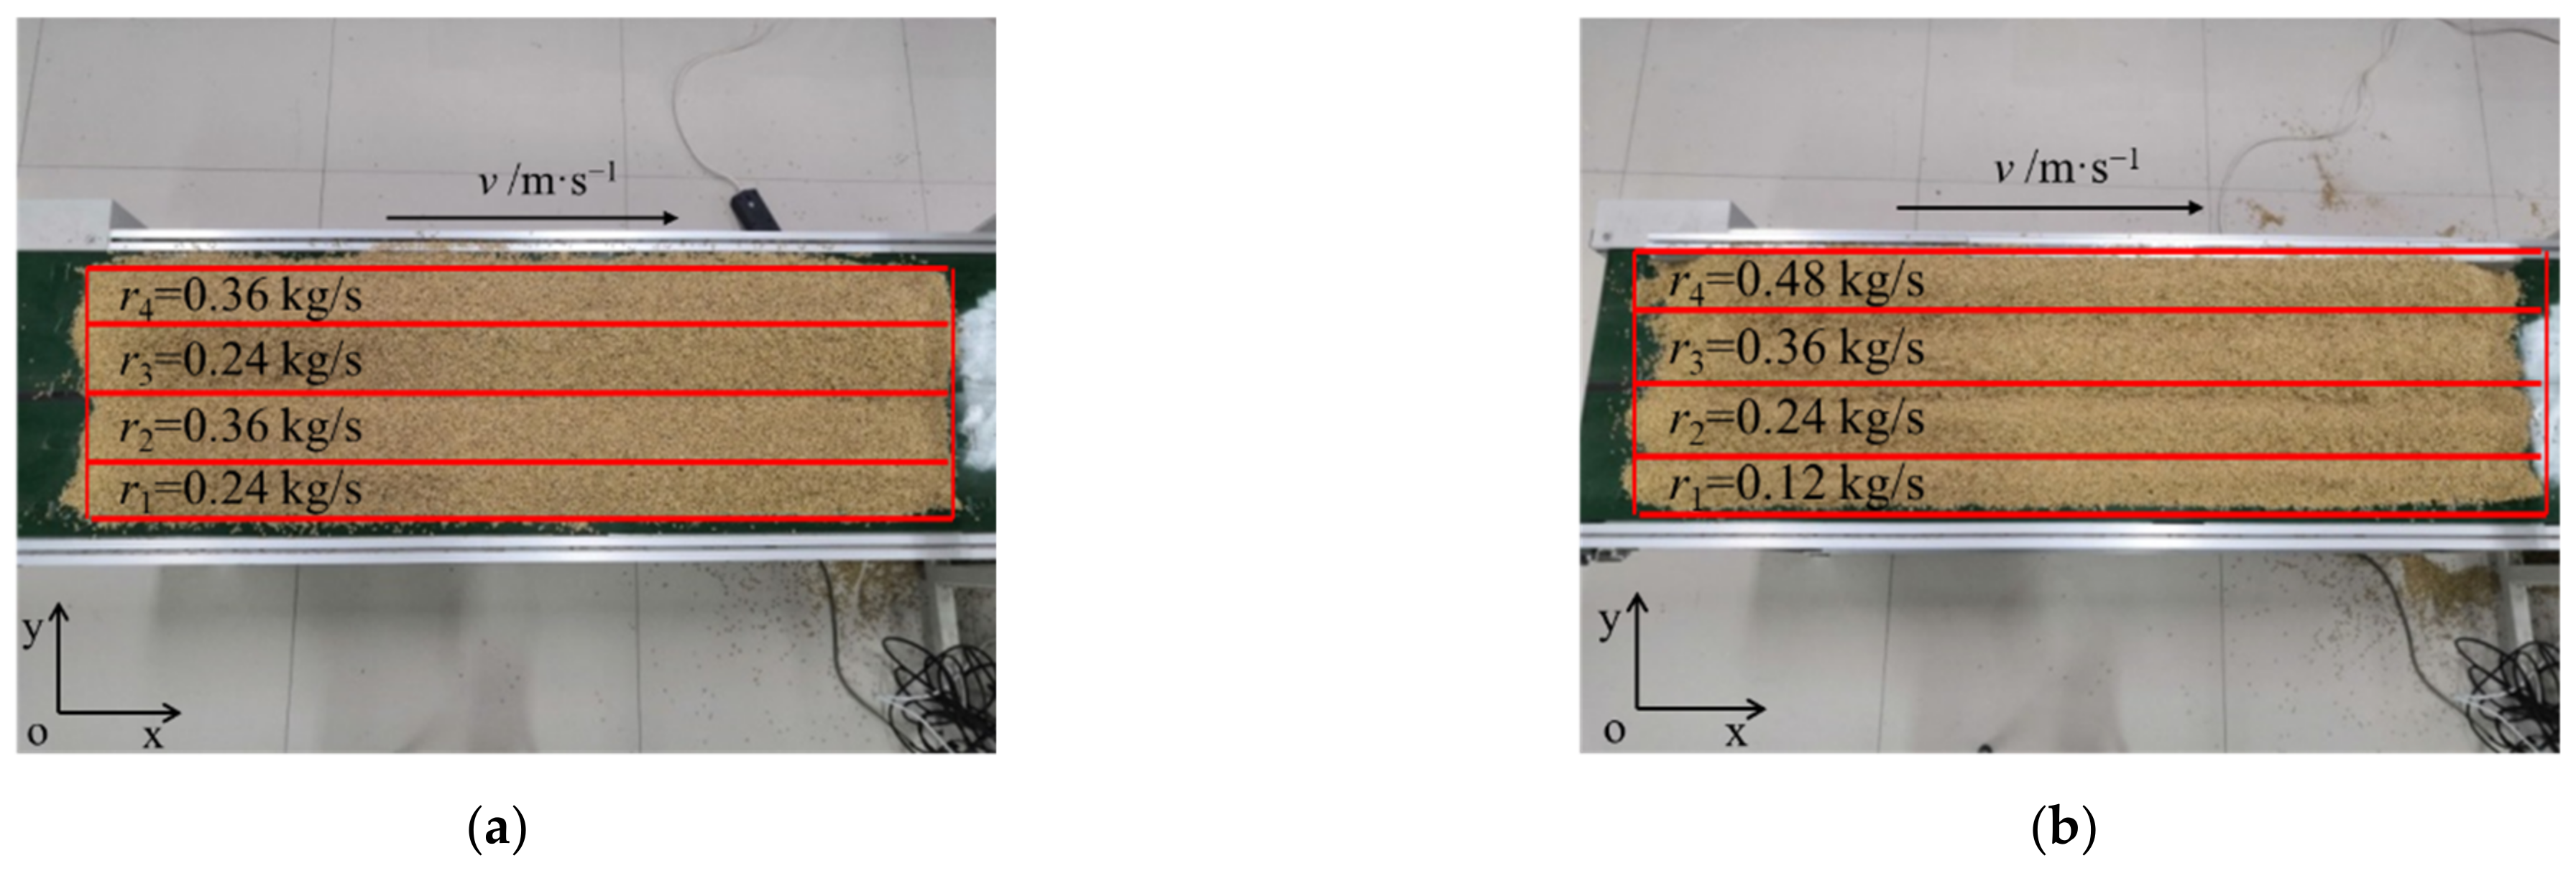
Simulation results showed that the non-uniform feeding would lead to the uneven distribution of grains along the y-axis. The attitude angle was closely related to the grain feeding non-uniformity coefficient. A reasonable attitude angle could ensure the uniform distribution of particles on the vibrating screen and increase the particle acceleration in the y-axis of the screen surface, which could improve screening performance.
(2)
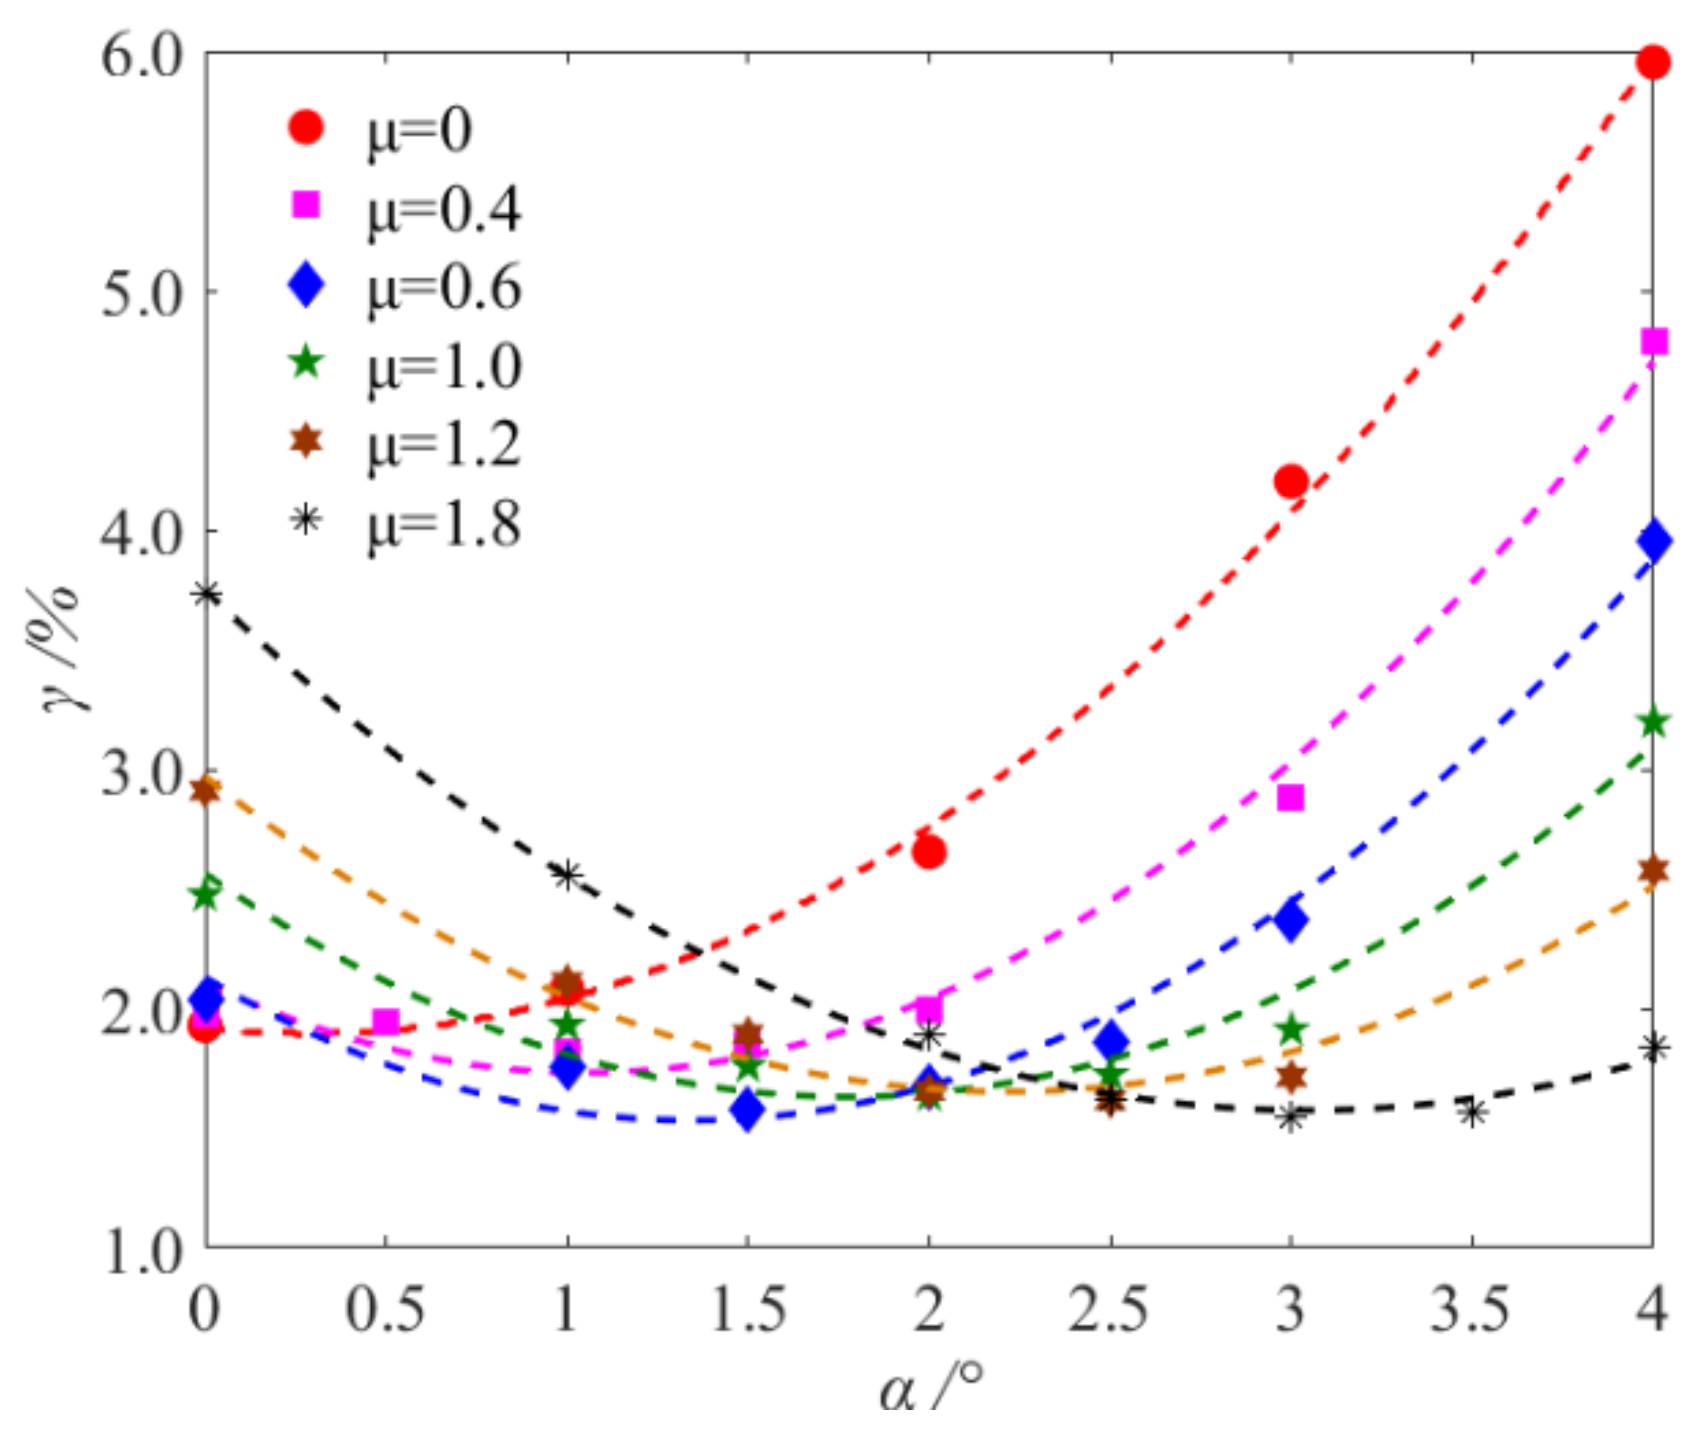
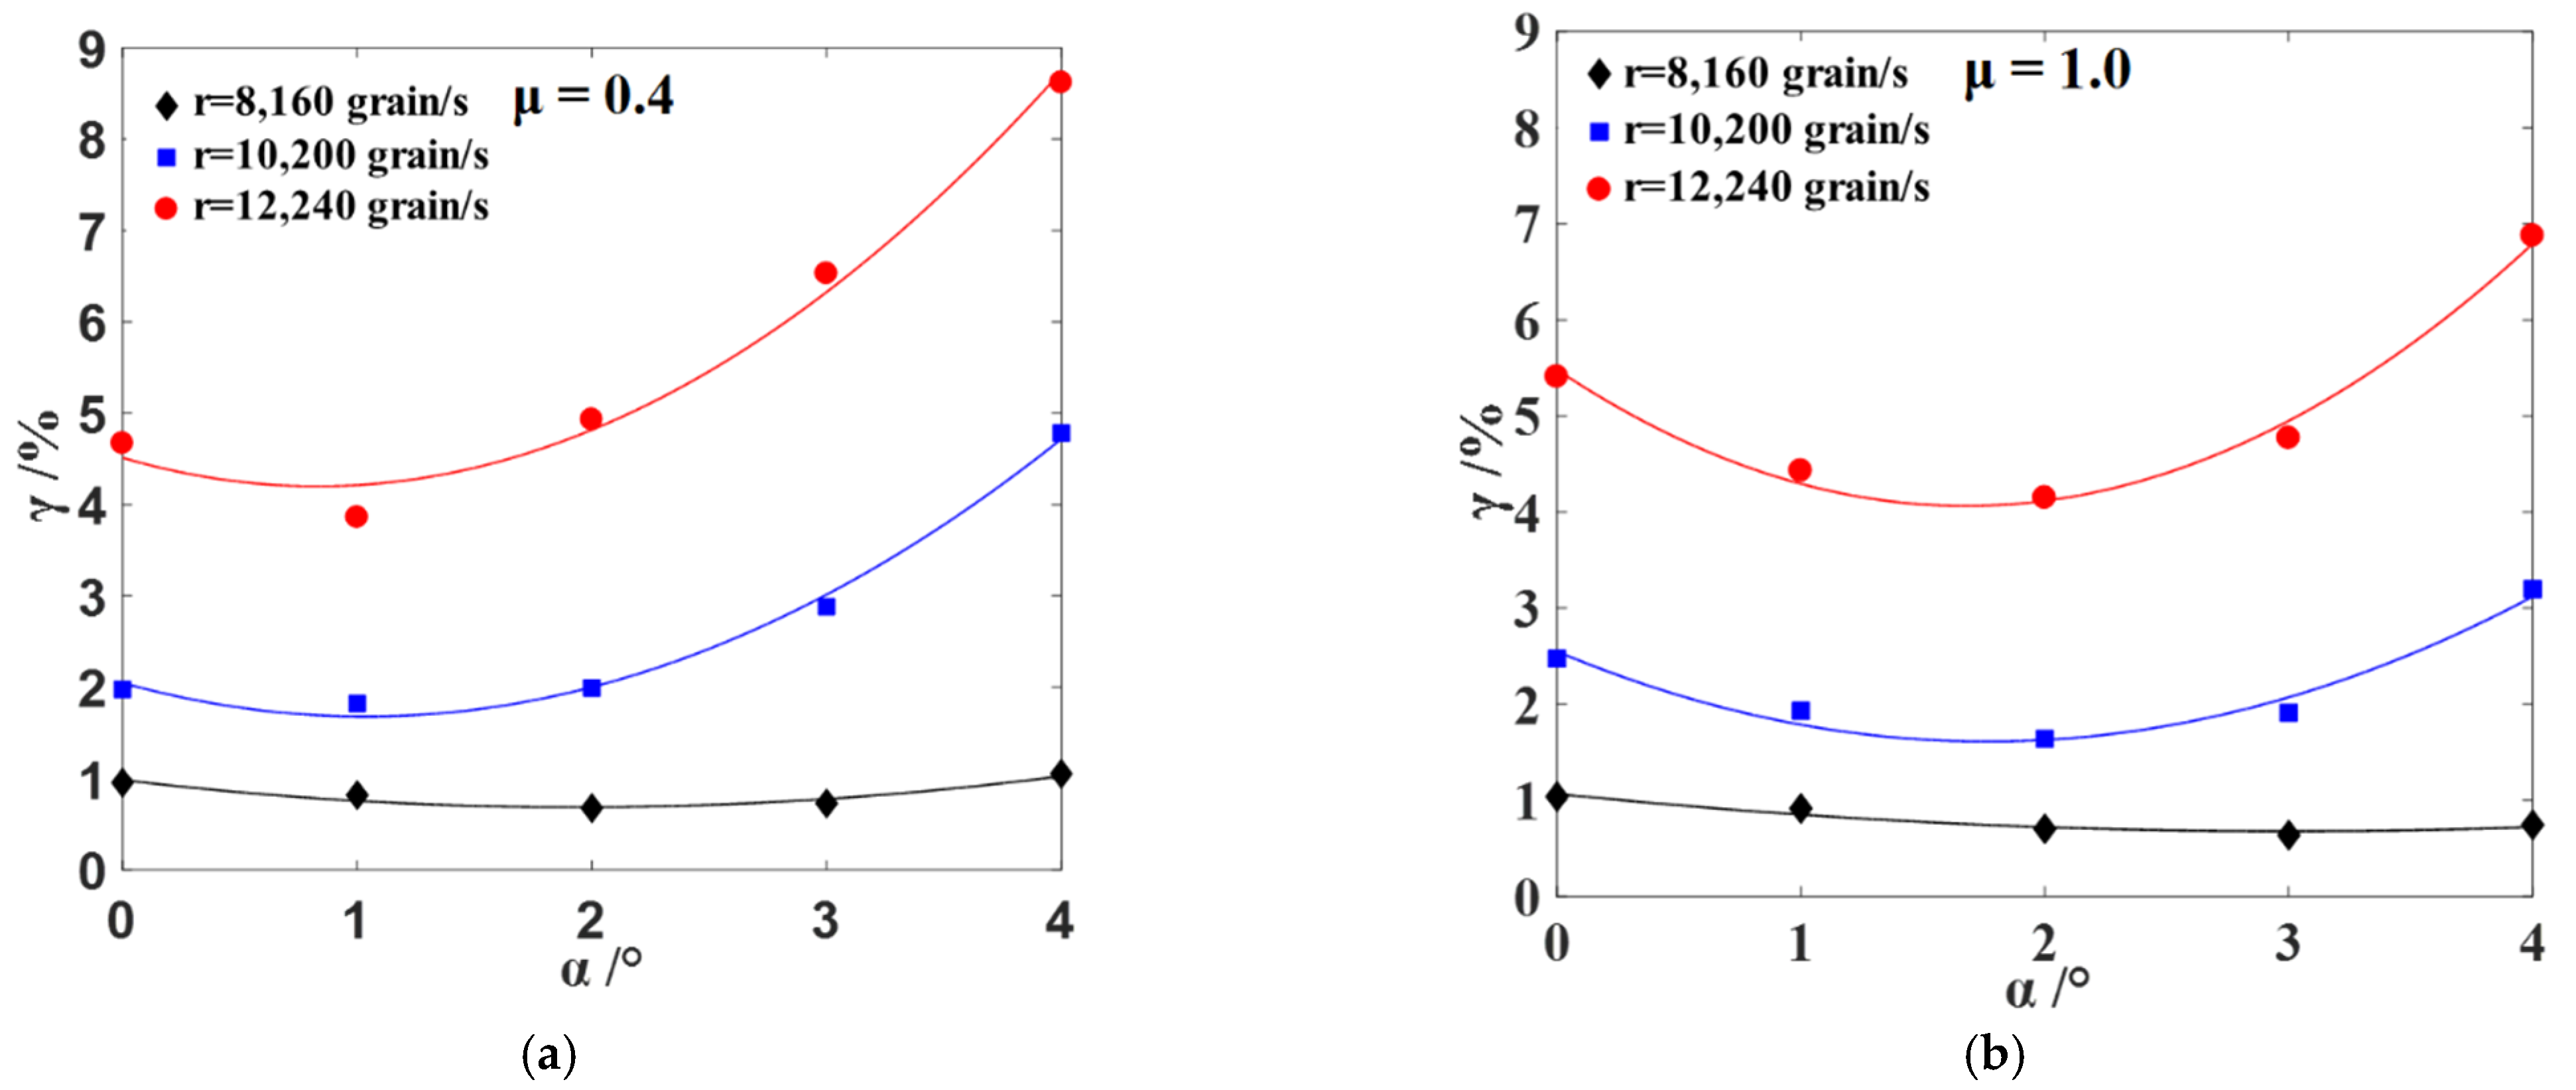
The total loss rate presented a monotonous increasing tendency with an increasing feeding non-uniformity coefficient (μ). The loss first decreased and then increased with the increase in attitude angle. The optimization of the attitude angle was an effective way to reduce the loss rate when the grains were non-uniformly fed onto the vibrating sieve surface.
(3)
According to the relationship between the optional attitude angle (αo) and the minimum loss rate (γmin) under different non-uniformity coefficients (μ), an optimum model for attitude angle was established. The feasibility and stability of the model were verified by simulations and experiments under different total feeding rates.
The attitude angle optimization model had good results in the simulations and bench tests. In the future, the fluid–structure coupling test under a multi-parameter combination will be considered to further optimize the model and improve the screening performance.

Author Contributions

Data curation, L.Z.; Formal analysis, S.C., Z.Z. and H.D.; Funding acquisition, S.C.; Methodology, L.Z. and Z.Z.; Software, Y.Z.; Writing—original draft, Y.Z.; Writing—review and editing, H.D. All authors have read and agreed to the published version of the manuscript.

Funding

This research work was supported by the Open Fund of Jiangsu Key Laboratory of Agricultural Equipment and Intelligent High Technology (MAET202118), the Laboratory of Crop Harvesting Equipment Technology of Zhejiang Province (2021E10018), Jiangsu University Scientific Research Project Funding Project (202110299037), Single Technology Research and Development Project of Jiangsu Agricultural Science and Technology Innovation Fund (CX(21)3144) and A Project Funded by the Priority Academic Program Development of Jiangsu Higher Education Institutions (No. PAPD-2018-87).

Institutional Review Board Statement

Not applicable.

Data Availability Statement

The data used to support the findings of this study are available from the corresponding author upon request.

Conflicts of Interest

The authors declare no conflict of interest.

References

  1. Li, J.; Webb, C.; Pandiella, S.S.; Campbell, G.M. Discrete particle motion on sieves—A numerical study using the DEM simulation. Powder Technol. 2003, 133, 190–202. [Google Scholar] [CrossRef]
  2. Tijskens, E.; Ramon, H.; Baerdemaeker, J.D. Discrete element modelling for process simulation in agriculture. J. Sound Vib. 2003, 266, 493–514. [Google Scholar] [CrossRef]
  3. Dong, K.J.; Yu, A.B. Numerical simulation of the particle flow and sieving behaviour on sieve bend/low head screen combination. Miner. Eng. 2019, 31, 2–9. [Google Scholar] [CrossRef]
  4. Trumic, M.; Magdalinovic, N. New model of screening kinetics. Miner. Eng. 2011, 24, 42–49. [Google Scholar] [CrossRef]
  5. Lawinska, K.; Wodzinski, P.; Modrzewski, R. Verification of the mathematical model of the screen blocking process. Powder technol. 2014, 256, 506–511. [Google Scholar] [CrossRef]
  6. Gong, S.P.; Oberst, S.; Wang, X.W. An experimentally validated rubber shear spring model for vibrating flip-flow screens. Mech. Syst. Signal Process. 2020, 139, 106619. [Google Scholar] [CrossRef]
  7. Fernandez, J.W.; Cleary, P.W.; Sinnott, M.D.; Morrison, R.D. Using SPH one-way coupled to DEM to model wet industrial banana screens. Miner. Eng. 2011, 24, 741–753. [Google Scholar] [CrossRef]
  8. Xiao, J.Z.; Tong, X. Characteristics and efficiency of a new vibrating screen with a swing trace. Particuology 2013, 11, 601–606. [Google Scholar] [CrossRef]
  9. Jiang, H.S.; Qiao, J.P.; Zhou, Z.G.; Zhao, Y.M.; Yang, Y.Z.; Duan, C.L.; Luo, Z.F.; Cai, L.F.; Wang, S.; Pan, M. Time evolution of kinematic characteristics of variable-amplitude equal-thickness screen and material distribution during screening process. Powder Technol. 2018, 336, 350–359. [Google Scholar] [CrossRef]
  10. Li, J.; Webb, C.; Pandiella, S.S.; Campbell, G.M. A numerical simulation of separation of crop seeds by screening—Effect of particle bed depth. Food Bioprod. Process. 2002, 80, 109–117. [Google Scholar] [CrossRef]
  11. Rotich, N.; Tuunila, R.; Elkamel, A.; Louhi-Kultanen, M. Dynamic and perturbative system analysis of granular material in a vibrating screen. Adv. Powder Technol. 2017, 28, 3257–3264. [Google Scholar] [CrossRef]
  12. Liu, Y.L.; Su, J.H.; Zhao, X.Q.; Chen, H.; Liu, C.; Liu, S.Q.; Wu, T.X. The study of vibrating screen efficiency based on discrete element method. J. Northeast Norm. Univ. Nat. Sci. Ed. 2018, 50, 78–83. [Google Scholar]
  13. Shanmugam, B.K.; Vardhan, H.; Raj, M.G.; Kaza, M.; Sah, R. Evaluation of a new vibrating screen for dry screening fine coal with different moisture contents. Int. J. Coal Prep. Util. 2022, 42, 752–761. [Google Scholar] [CrossRef]
  14. Yang, X.D.; Zhao, L.L.; Li, H.X.; Liu, C.S.; Hu, E.Y.; Li, Y.W.; Hou, Q.F. DEM study of particles flow on an industrial-scale roller screen. Adv. Powder Technol. 2020, 31, 4445–4456. [Google Scholar] [CrossRef]
  15. Qiao, J.P.; Duan, C.L.; Jiang, H.S.; Zhao, Y.M.; Chen, J.W.; Huang, L.; Wen, P.F.; Wu, J.D. Research on screening mechanism and parameters optimization of equal thickness screen with variable amplitude based on DEM simulation. Powder Technol. 2018, 331, 296–309. [Google Scholar] [CrossRef]
  16. Wang, C.J.; Zhang, T.Y.; Li, L.; Chen, J.Y.; Meng, X.R. Study on screening efficiency of moist raw coal particles on 3-DOF hybrid vibrating screen. Chin. J. Eng. Des. 2016, 23, 264–270. [Google Scholar]
  17. Wang, L.J.; Cui, Y.Q.; Zheng, Z.H.; Feng, X.; Shen, B.S.; Li, Y.B. Effect of Different Motion Forms of Vibrating Screen on Screening of Particle Group. Trans. Chin. Soc. Agric. Mach. 2019, 50, 119–129. [Google Scholar]
  18. Zhang, M.K.; Wang, C.J.; Yan, C.; Li, H. Design and Dynamic Analysis of a Four-Degree-of-Freedom Chaotic Vibrating Screen. Shock Vib. 2021, 2021, 1–10. [Google Scholar] [CrossRef]
  19. Lu, Y.S. Research of wheat vibrating screen based on two degrees of freedom. Diploma Thesis, Huazhong Agricultural University, Wuhan, China, 2017. [Google Scholar]
  20. He, B.X.; Shen, H.P.; Xue, G.X.; Chu, K.B. Experomental Research on the Screening characteristic of Parallel Vibration Sieve. J. Mech. Transm. 2011, 35, 52–54. [Google Scholar]
  21. Shen, H.P.; Zhang, J.T.; He, B.X.; Liu, Y.X.; Yang, T.L. Sifter efficiency and experimental study on a new type of vibrating sifter based on PKM. J. Mach. Des. 2011, 28, 83–86. [Google Scholar]
  22. Xie, J.; Zhang, X.Q.; Wang, C.J. Tea Sieving Based on Three Translation Parallel Machanism. Trans. Chin. Soc. Agric. Mach. 2012, 43, 101–104. [Google Scholar]
  23. Cocolo, G.; Curnis, S.; Hjorth, M.; Provolo, G. Effect of different technologies and animal manures on solid-liquid separation efficiencies. J. Agric. Eng. 2012, 43, e9. [Google Scholar] [CrossRef]
  24. Ayuga, F. Present and future of the numerical methods in buildings and infrastructures areas of biosystems engineering. J. Agric. Eng. 2015, 46, 1–12. [Google Scholar] [CrossRef] [Green Version]
  25. Lu, Y.; Xu, B.; Liu, Y.; Ye, S.B.; Li, L.H.; Kong, L.D.; Zheng, D.C. Design optimization and experimental evaluation of a reciprocating grain vibrating screen based on ADAMS system. J. Shanxi Agric. Univ. Nat. Sci. Ed. 2019, 39, 98–104. [Google Scholar]
  26. Wills, B.A.; Finch, J.A. Chapter 8—Industrial screening. In Wills’ Mineral Processing Technology, 8th ed.; Wills, B.A., Finch, J.A., Eds.; Butterworth-Heinemann: Oxford, UK, 2016; pp. 181–197. [Google Scholar]
  27. Folami, A.A.; Obioha, E.N.; Adewole, A.A.; Ibiyemi, K.S. Performance evaluation of a developed rice-processing machine. J. Agric. Eng. 2016, 47, 171–176. [Google Scholar] [CrossRef] [Green Version]
  28. Zhao, L.L.; Li, Y.W.; Yang, X.D.; Jiao, Y.; Hou, Q.F. DEM study of size segregation of wet particles under vertical vibration. Adv. Powder Technol. 2019, 30, 1386–1399. [Google Scholar] [CrossRef]
  29. Li, Y.B.; Xu, Y.; Cui, T.; Zhang, D.X.; Fan, H.F.; Gao, X.J.; Su, Y.; Qiao, M.M.; Song, Z.S. Improving particle dispersion characteristics with a novel cleaning screen: Parameter design and numerical simulation. Powder Technol. 2022, 397, 116987. [Google Scholar] [CrossRef]
  30. Modrzewski, R.; Obraniak, A.; Rylski, A.; Siczek, K. A Study on the Dynamic Behavior of a Sieve in an Industrial Sifter. Appl. Sci. 2022, 12, 8590. [Google Scholar] [CrossRef]
  31. Gursky, V.; Kuzio, I.; Krot, P.; Zimroz, R. Energy-saving inertial drive for dual-frequency excitation of vibrating machines. Energies 2021, 14, 71. [Google Scholar] [CrossRef]
  32. Jahani, M.; Farzanegan, A.; Noaparast, M. Investigation of screening performance of banana screens using LIGGGHTS DEM solver. Powder Technol. 2015, 283, 32–47. [Google Scholar] [CrossRef]
  33. Jafari, A.; Nezhad, V.S. Employing DEM to study the impact of different parameters on the screening efficiency and mesh wear. Powder Technol. 2016, 297, 126–143. [Google Scholar] [CrossRef]
  34. Cleary, P.W.; Wilson, P.; Sinnott, M.D. Effect of particle cohesion on flow and separation in industrial vibrating screens. Miner. Eng. 2018, 119, 191–204. [Google Scholar] [CrossRef]
  35. Raji, A.O.; Favier, J.F. Model for the deformation in agricultural and food particulate materials under bulk compressive loading using discrete element method. I: Theory, model development and validation. J. Food Eng. 2004, 64, 359–371. [Google Scholar] [CrossRef]
  36. Zhao, Z.; Li, Y.M.; Liang, Z.W.; Gong, Z.Q. DEM simulation and physical testing of rice seed impact against a grain loss sensor. Biosyst. Eng. 2013, 116, 410–419. [Google Scholar]
  37. Zhao, Z.; Jin, M.Z.; Qin, F.; Yang, S.X. A novel neural network approach to modeling particles distribution on vibrating screen. Powder Technol. 2021, 382, 254–261. [Google Scholar] [CrossRef]
  38. Delaney, G.W.; Cleary, P.W.; Hilden, M.; Morrison, R.D. Testing the validity of the spherical DEM model in simulating real granular screening processes. Chem. Eng. Sci. 2012, 68, 215–226. [Google Scholar] [CrossRef]
Figure 1. Structure of multi-DOF hybrid vibrating screen.
Agriculture 12 02023 g001
Figure 2. Classification of attitude angle and inclination angle.
Agriculture 12 02023 g002
Figure 3. The agricultural material particles used in the simulation: (a) rice stem, and (b) rice grain.
Agriculture 12 02023 g003
Figure 4. Rectangular regions division and coordinate axis of screen surface.
Agriculture 12 02023 g004
Figure 5. Snapshot of DEM simulation.
Agriculture 12 02023 g005
Figure 6. Distribution of grains at different non-uniformity coefficients: (a) μ = 0, (b) μ = 1, and (c) μ = 1.8.
Agriculture 12 02023 g006
Figure 7. Distribution of grains at different attitude angles: (a) α = 1°, (b) α = 2°, and (c) α = 4°.
Agriculture 12 02023 g007
Figure 8. Variation of average particle velocity: (a) non-uniformity feeding, (b) attitude angle.
Agriculture 12 02023 g008
Figure 9. Variation of distribution of lost grains for different: (a) non-uniformity coefficients, (b) attitude angles.
Agriculture 12 02023 g009
Figure 10. Variation of total loss rate with attitude angle.
Agriculture 12 02023 g010
Figure 11. Variation of optional attitude angle with non-uniformity coefficient.
Agriculture 12 02023 g011
Figure 12. Variation of the total loss rate with the attitude angle at different total feeding rates: (a) μ = 0.4, (b) μ = 1.0.
Agriculture 12 02023 g012
Figure 13. Grain feeding conditions: (a) μ = 0.4, (b) μ = 1.0.
Agriculture 12 02023 g013
Figure 14. Variation of the total loss rate with the attitude angle of simulation and experiment: (a) μ = 0.4, (b) μ = 1.0.
Agriculture 12 02023 g014
Table 1. Material characteristic parameters and contact parameters of materials.
ParameterRice GrainStemSieveGrain–GrainGrain–SieveGrain–StemStem–SieveStem–Stem
Density (kg/m3)11501002800
Yang’s modulus (MPa)11.5172,000
Poisson’s ratio0.250.40.33
Restitution coefficient 0.420.480.20.20.2
Static friction coefficient 0.560.350.80.80.8
Rolling coefficient of friction 0.050.020.010.010.01
Table 2. Grain feeding parameters.
State NumberRatio of Feeding Rates, r1:r2:r3:r4Non-Uniformity Coefficient (µ)
S11:1:1:10
S22:3:2:30.2
S32:2:3:30.4
S42:2:2:40.6
S51:2:4:30.8
S61:2:3:41.0
S71:1:4:41.2
S81:1:3:51.4
S91:1:2:61.6
S101:1:1:71.8
Table 3. ANOVA results of the effect of attitude angle on loss rate.
Square SumMean SquareFp
11.5032.8763.3190.031
Publisher’s Note: MDPI stays neutral with regard to jurisdictional claims in published maps and institutional affiliations.

