Article

Evaluating Data Augmentation Effects on the Recognition of Sugarcane Leaf Spot

1
College of Mechanical Engineering, Guangxi University, Nanning 530004, China
2
Agricultural Genomics Institute at Shenzhen, Chinese Academy of Agricultural Sciences, Shenzhen 518120, China
3
College of Business Administration, Guangxi University, Nanning 530004, China
4
Agricultural College, Guangxi University, Nanning 530004, China
*
Author to whom correspondence should be addressed.
Agriculture 2022, 12(12), 1997; https://doi.org/10.3390/agriculture12121997
Submission received: 17 October 2022 / Revised: 18 November 2022 / Accepted: 21 November 2022 / Published: 24 November 2022
(This article belongs to the Special Issue Model-Assisted and Computational Plant Phenotyping)

Abstract

:
Research on the recognition and segmentation of plant diseases in simple environments based on deep learning has achieved relative success. However, under the conditions of a complex environment and a lack of samples, the model has difficulty recognizing disease spots, or its recognition accuracy is too low. This paper is aimed at investigating how to improve the recognition accuracy of the model when the dataset is in a complex environment and lacks samples. First, for the complex environment, this paper uses DeepLabV3+ to segment sugarcane leaves from complex backgrounds; second, focusing on the lack of training images of sugarcane leaves, two data augmentation methods are used in this paper: supervised data augmentation and deep convolutional generative adversarial networks (DCGANs) for data augmentation. MobileNetV3-large, Alexnet, Resnet, and Densenet are trained by comparing the original dataset, original dataset with supervised data augmentation, original dataset with DCGAN augmentation, background-removed dataset, background-removed dataset with supervised data augmentation, and background-removed dataset with DCGAN augmentation. Then, the recognition abilities of the trained models are compared using the same test set. The optimal network selected based on accuracy and training time is MobileNetV3-large. Classification using MobileNetV3-large trained by the original dataset yielded 53.5% accuracy. By removing the background and adding synthetic images produced by the DCGAN, the accuracy increased to 99%.

1. Introduction

Sugarcane is a major sugar crop that is widely planted worldwide, accounting for approximately 80% of global sugar production [1]. China is the third-largest sugar-producing country, and Brazil and India rank first and second, respectively [2]. Sugarcane asexually reproduces, and so it is easily infected by various plant viruses that cause diseases [3]. Diseases are one of the important factors that threaten the yield of sugarcane. Failure to recognize and prevent sugarcane diseases in a timely manner can easily reduce sugarcane yield and quality and cause significant economic losses to growers. With the development of deep learning in image recognition, convolutional neural networks (CNNs), which comprise a momentous branch of deep learning, have made breakthroughs in plant disease identification [4,5,6,7,8,9,10].
For disease identification, Militante et al. [11] collected 13,842 sugarcane images and proposed a sugarcane leaf disease classification method based on deep learning. The model was used to classify cane leaves into diseased and nondiseased categories, which resulted in an accuracy of 95%. Yan et al. [12] proposed an improved model based on VGG16 to identify apple leaf diseases; the results showed that the overall accuracy of apple leaf classification based on the proposed model reached 99.01%. Loti et al. [13] compared the features of chili pests and diseases extracted by the traditional approach with those extracted by the deep-learning-based approach. Brahimi et al. [14] used a large dataset compared with the state-of-the art. The dataset contained 14,828 images of tomato leaves infected with nine diseases, which resulted in an accuracy of 99.18%. Adem et al. [15] proposed the hybrid use of a Yolov4 deep learning model and image processing for the automatic determination of leaf spot disease on sugar beets and classifications of severity. The proposed hybrid method for the diagnosis of diseases and identifying the severity were trained and tested using 1040 images, and the classification accuracy rate of the most successful method was found to be 96.47%.
High recognition rates were obtained in many of the above studies, but they also included problems. Firstly, the studies involving sugarcane disease recognition were only conducted to distinguish whether plants were infected or not, and they did not involve various sugarcane disease recognition studies. Secondly, the backgrounds of the datasets used in the above studies were simple laboratory backgrounds and did not include the native complex backgrounds of the crops. With the development of semantic segmentation, the following studies have been completed accordingly to the second point.
For the complex environment, Kianat et al. [16] presented a hybrid framework based on feature fusion and selection techniques. The framework included three core steps: image contrast enhancement; feature extraction, fusion, and selection; and classifier classification. The experimental results showed that feature selection can improve the recognition accuracy of a system. Wang et al. [17] proposed a two-stage model that fused DeepLabV3+ and U-Net (DUNet) for cucumber leaf disease severity classification in complex backgrounds, and the leaf segmentation accuracy reached 93.27%. Bai et al. [18] proposed an improved fuzzy C-means (FCM) algorithm. The results showed that the average segmentation error was only 0.12%. Lin et al. [19] proposed a semantic segmentation model based on convolutional neural networks (CNNs) to segment powdery mildew on cucumber leaf images at the pixel level, achieving an average pixel accuracy of 96.08% and intersection over union of 72.11% on twenty test samples. Wang et al. [20] proposed a segmentation method based on a cascaded convolutional neural network for crop disease leaf images and conducted segmentation experiments on disease leaf images in different environments, with a segmentation accuracy of 87.04%, recall of 78.31%, and comprehensive evaluation index value of 88.22%.
In the crop disease identification studies described above, parts of the research used public datasets, and crops such as sugarcane, for which there is no public dataset, face a data insufficiency problem in the process of disease identification, which was addressed in one of the above studies using traditional data augmentation. However, with the introduction of generative adversarial networks (GAN), a more effective measure for data augmentation has been provided.
Liu et al. [4] proposed a leaf GAN in which 8124 images were generated using 4062 grape leaf disease images, which resulted in an accuracy of 98.7%. Unsupervised data augmentation is more commonly utilized in medical imaging. Abbas et al. [21] proposed a deep learning-based method for tomato disease detection that used 16,012 images of tomato plant leaves to train the conditional generative adversarial network (C-GAN) to generate synthetic images of tomato plant leaves. Douarre et al. [22] presented a method to annotate images by generative adversarial networks (GANs), and they found that the simulated data could provide an important increase in segmentation performance, up to a 17% increase in F1 score, compared to segmenting with weights initialized on ImageNet. Zhang et al. [23] proposed a deep learning model for classifying citrus canker, and they augmented the training set by feeding the convolutional network with both real-world samples and artificial ones using deep convolutional generative adversarial networks (DCGAN). Zhang et al. [24] proposed conducting the recognition of cucumber leaf diseases under field conditions based on a small sample size and a deep convolutional neural network. Implementing rotation and translation, the lesion images were fed into the activation reconstruction generative adversarial networks (ARGAN) for data augmentation to generate new training samples.
Although the abovementioned studies on recognition have achieved ideal results, in the studies of disease identification and data augmentation, their datasets were obtained from simple background environments, while in the studies of image segmentation, data augmentation experiments were not performed to improve the recognition accuracy of the models. Based on existing studies, a two-stage model based on DeepLabV3+ and DCGAN is proposed in this study for sugarcane leaf disease classification under complex background and sparse sample conditions.
The main contributions of this paper are summarized as a proposed method based on DeepLabV3+, DCGAN, and MobileNetV3-large for the accurate identification of sugarcane spots classes in real environments.

2. Materials and Methods

2.1. Research Roadmap

First, the original image was acquired by data acquisition, and then the original image was segmented by using DeepLabV3+ to retain the leaves and remove the complex background. Second, the leaf images with the background removed and the original dataset were expanded by using supervised data augmentation and DCGAN. MobileNetV3-large, AlexNet, ResNet, and DenseNet were trained by comparing the original dataset, original dataset with supervised data augmentation, original dataset with DCGAN augmentation, background-removed dataset, background-removed dataset with supervised data augmentation, and background-removed dataset with DCGAN augmentation. Last, the recognition ability of the trained model was compared using the same validation set, as shown in Figure 1.

2.2. Dataset

In this paper, four types of sugarcane leaf images (red rot, ring spot, rust, and healthy sugarcane) as shown in Figure 2, were selected for the study. The dataset was divided into two parts, as shown in Table 1. The first part of the dataset consisted of 790 images obtained from the network and the experimental field of Guangxi University, which was only used to train the image segmentation network without considering the disease type. The second part of the dataset, which was collected from the sugarcane experimental fields in the New City of Agricultural Science of Guangxi University, consisted of 30 images that were collected for each of the four study subjects to investigate the identification of sugarcane diseases under the conditions of sample scarcity.
These images were acquired by different people from different devices, enhancing the generalizability of this research. The acquisition devices were a Oneplus 8T, an Apple 6, and a Vivo s9, and the minimum resolution of the images was 1800 × 4000.

2.3. DeepLabV3+

DeepLabV3+ [25] is considered a new peak in semantic segmentation; this model is mainly improved in structure compared with the previous Deep Lab family. DeepLabV3+ extends DeepLabV3 by adding a simple but effective decoder module to refine the segmentation results, especially along object boundaries. Applying deep separable convolution to atrous spatial pyramid pooling (ASPP) [26] and decoder modules produces a faster and stronger encoder-decoder network. Moreover, deep separable convolution is added to the ASPP and decoder modules to improve the efficiency of the overall model. The DeepLabV3+ network block structure is shown in Figure 3.

2.4. DCGAN

A GAN is composed of a generator G and a discriminator D. According to the antagonism idea, and the min-max strategy is adopted to generate new images without supervision. Its principal block diagram is shown in Figure 4, and its loss function is:
min G   max D V ( G , D ) = E x ~ P d a t a ( x ) [ log D ( x ) ] + E z ~ P z ( z ) [ log ( 1 D ( G ( z ) ) ) ]
where G is the generator, D is the discriminator, P d a t a is the real data sample, and P z is the noise distribution. The loss function trains D to maximize the probability of assigning the correct label to both training examples and samples from G . The loss function simultaneously trains G to minimize log ( 1 D ( G ( z ) ) ) . D and G play a two-player minimax game with the value function V (G, D) [27].
A DCGAN is mainly improved in its generator and discriminator compared with a GAN, and both D and G use a CNN structure that is suitable for image processing tasks.
The size of a generated image is increased layer by layer, and the change process is noise → 4 × 4 × 1024 → 8 × 8 × 512 → 16 × 16 × 256 → 32× 32 × 128 → 64 × 64 × 3. A synthetic sugarcane leaf can be generated, shown in Figure 5a. The size of the discriminator images is decreased layer by layer, and the change process is 64 × 64 × 3 → 32 × 32 × 128 → 16 × 16 × 256 → 8 × 8 × 512 → 4 × 4 × 1024; then, real or fake images can be output, shown in Figure 5b. When a fake image from G is classified as real by D, the image is saved.

2.5. Image Recognition Network

2.5.1. MobileNetV3-Large

The MobileNetV3 network published in 2019 is a lightweight neural network that fully combines the advantages of the deeply separable convolution of MobileNetV1 and the inverted residual structure with linear bottlenecks of MobileNetV2 [28,29,30]. Using NAS (platform-aware NAS) and NetAdapt to search the configuration and parameters of the network, a lightweight attention model SE Block is introduced, and a new and effective activation function, h – swish[x], is proposed:
h s w i s h [ x ] = x R e L U 6 ( x + 3 ) 6
The final part of the network is pooled on average, and then the features used to train the final classifier are extracted by a 1 × 1 convolution, which further reduces the latency while preserving the high-dimensional features. The MobileNetV3-large network block structure is shown in Figure 6.

2.5.2. AlexNet

AlexNet, designed by Alex Krizhevsky, consisting of five convolutional layers, followed by three fully connected layers, was the first large-scale and deep CNN and the winner of ILSVRC 2012. It utilized a rectified linear unit (ReLU) for the very first time to introduce non-linearity instead of a tanh or sigmoid, resulting in a significant increase in the training speed. The use of a tanh and sigmoid is affected by the vanishing gradient problem, which is not the case with a ReLU. Hence, now, a ReLU, a non-saturating activation, is a standard for most deep learning architectures. To overcome overfitting and obtain a generalized model, data augmentation (cropping, rotation, and flips) was employed and a 50% dropout was implemented after every fully connected layer. The network was split in two parts and trained continuously for five to six days on two parallel GTX 580 GPUs for the classification of 1.2 million images into 1000 classes, achieving a top-5 error rate of 15.3%.

2.5.3. ResNet

ResNet18 is an 18-layer version of ResNets, or Residual Networks, the winner of ILSVRC 2015, and it has been employed for several computer vision implementations. Before residual networks were introduced, deeper networks were affected by the vanishing gradient problem. ResNet employs ‘identity skip connections’, where the original input is added element-wise with the output of the convolution block, followed by a ReLU, providing an alternate path for the gradient to pass while also ensuring that the performance of the higher layer is similar to that of the lower layer. These residual modules are stacked together, followed by the final branch of global average pooling, fully connected, and softmax layers. ResNet18 has comparably lower number of parameters than AlexNet.

2.5.4. DenseNet

The basic concept of the DenseNet model is the same as that of ResNet, but it builds a dense connection between all the previous layers and the later layers. These features allow DenseNet to achieve better performance than ResNet, with fewer parameters and computational cost, and DenseNet won the CVPR 2017 Best Paper Award.
The dense connection of DenseNet requires the feature maps to be of the same size. To solve this problem, the DenseNet network uses the structure of DenseBlock+Transition, where DenseBlock is a module containing many layers, each layer has the same feature map size, and the layers use dense connections between each other. Transition is a module that connects two DenseBlock adjacent to each other, and the feature map size is reduced by pooling. The network structure of DenseNet, as shown in Figure 7, contains 4 DenseBlocks, and each DenseBlock is connected together by Transition.

2.6. Evaluation Metric

The metrics used to evaluate the performance of the CNN models are shown in Equations (3)–(10). In these equations, TP represents the true positive, FN represents the false negative, FP represents the false positive, and TN represents the true negative. IoU measures the intersection rate of the candidate bound and ground truth bound indicates the ratio of their intersection to their concatenation. The Dice similarity coefficient (DSC) evaluates the overlapped results from two independent regions [31,32]. The VOE is calculated by subtracting the Jaccard coefficient from the value of a unit based on the dissimilarities between the two volumes [33]. Accuracy measures how many positive and negative observations are correctly classified. Precision measures the proportion of all positives predicted by the model that are correctly predicted. Recall measures the proportion of all positive samples in the test set that are correctly identified as positive samples. Specificity measures the proportion of all negative samples in the test set that are correctly identified as negative samples. The F1 score is considered a weighted average of the precision and recall of the model.
I o U = T P F P + T P + F N × 100 %
D S C = 2 T P F P + 2 T P + F N
V O E = 100 × ( 1 2 T P F P + 2 T P + F N )
A c c u r a c y = T P + T N T P + F P + T N + F N × 100 %
P r e c i s i o n = T P T P + F N × 100 %
R e c a l l = T P T P + F N
S p e c i f i c i t y = T N T N + F P
F 1 s c o r e = 2 × R e c a l l × P r e c i s i o n R e c a l l + P r e c i s i o n

3. Results

The hardware configuration used in this research for training and testing is detailed as follows: Intel Core i7-12700H CPU @ 2.70 GHz, 512 G memory, NVIDIA GeForce RTX3060 GPU, 64-bit Windows Server 2016 operating system, CUDA version 11.0, and Torch version 1.7.1.

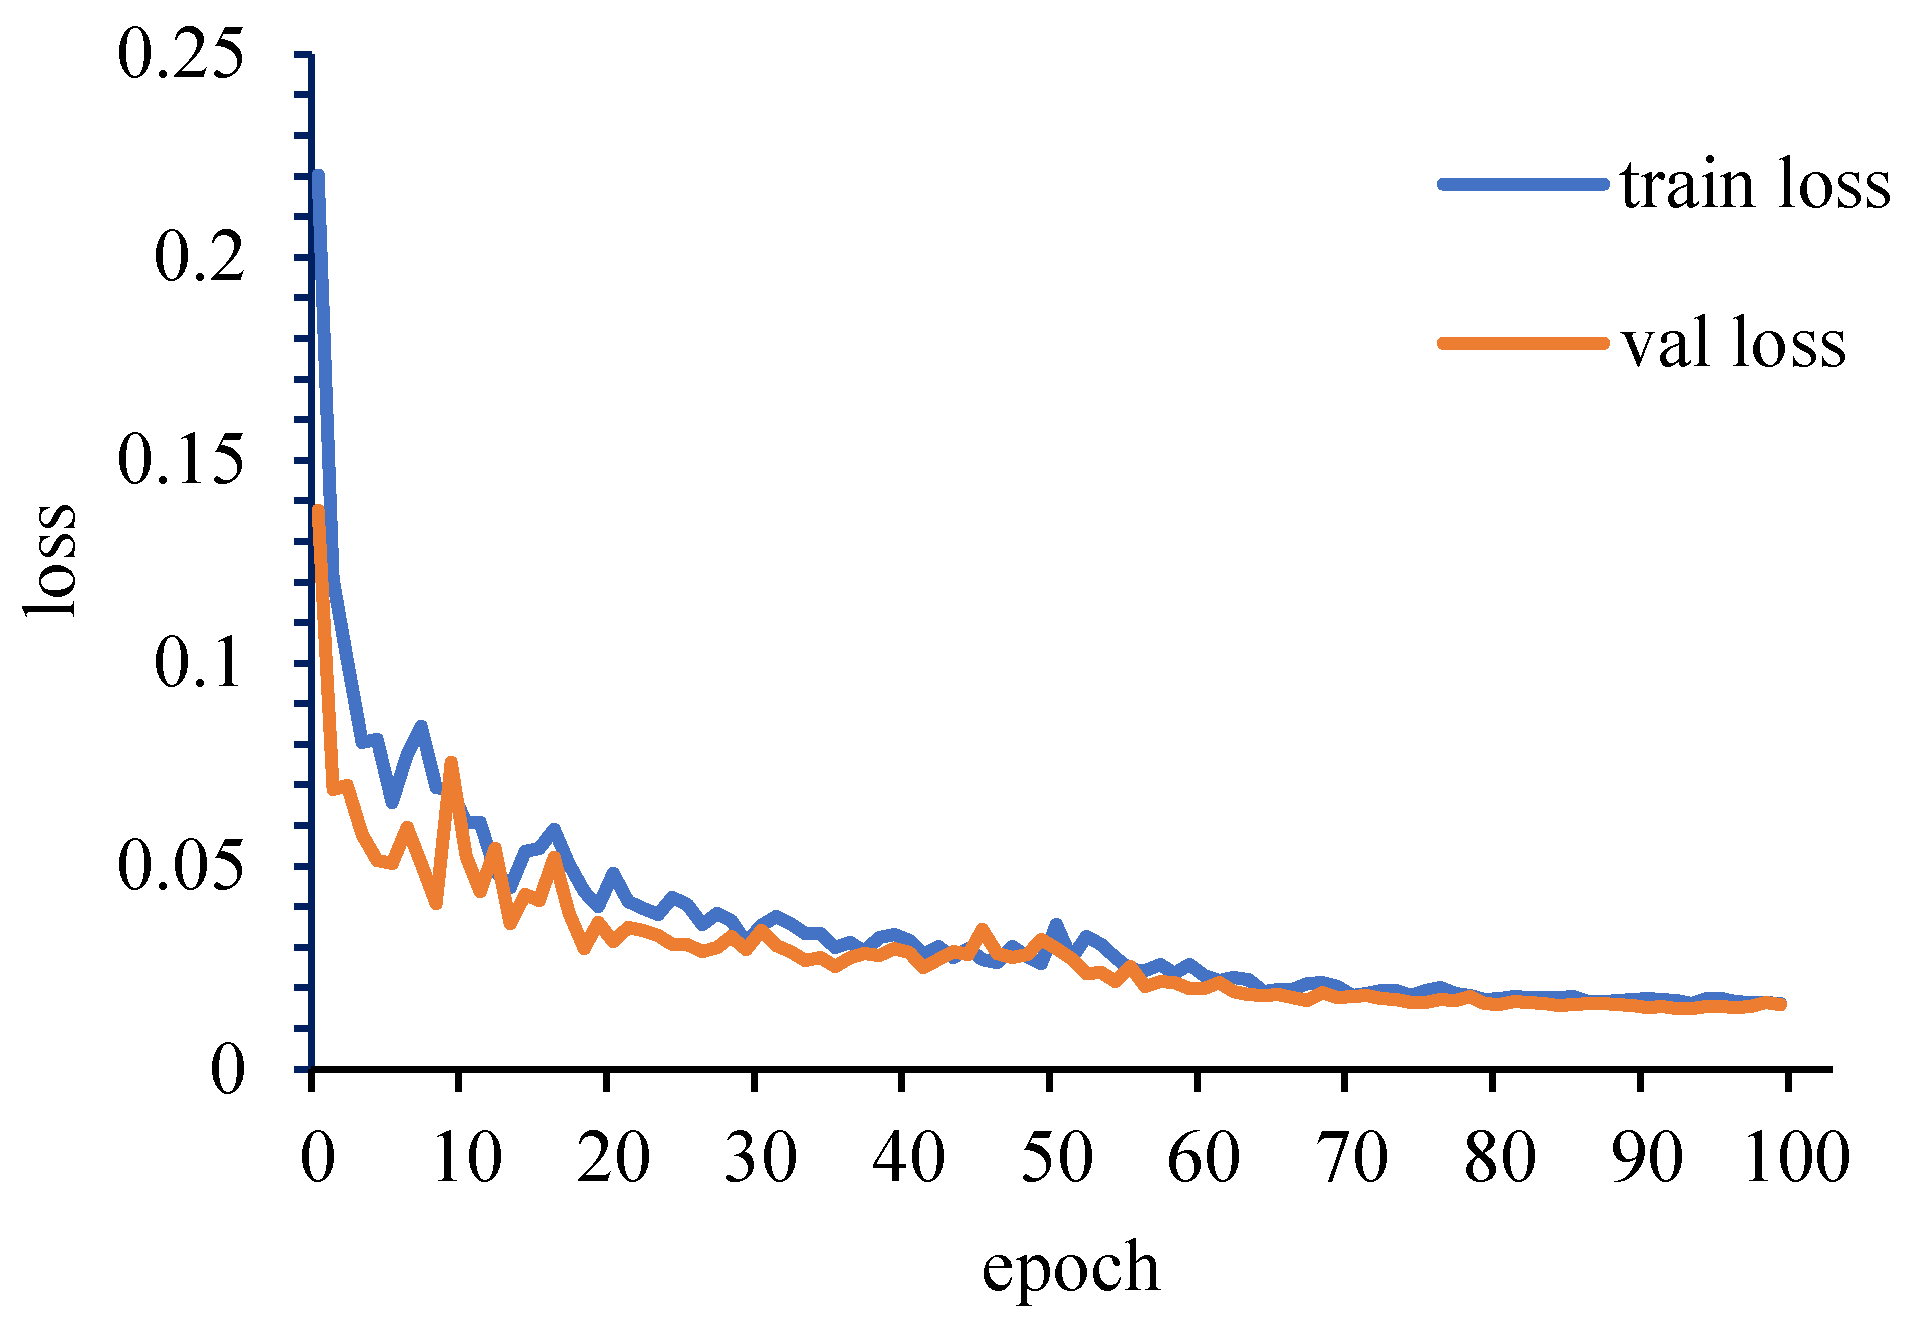
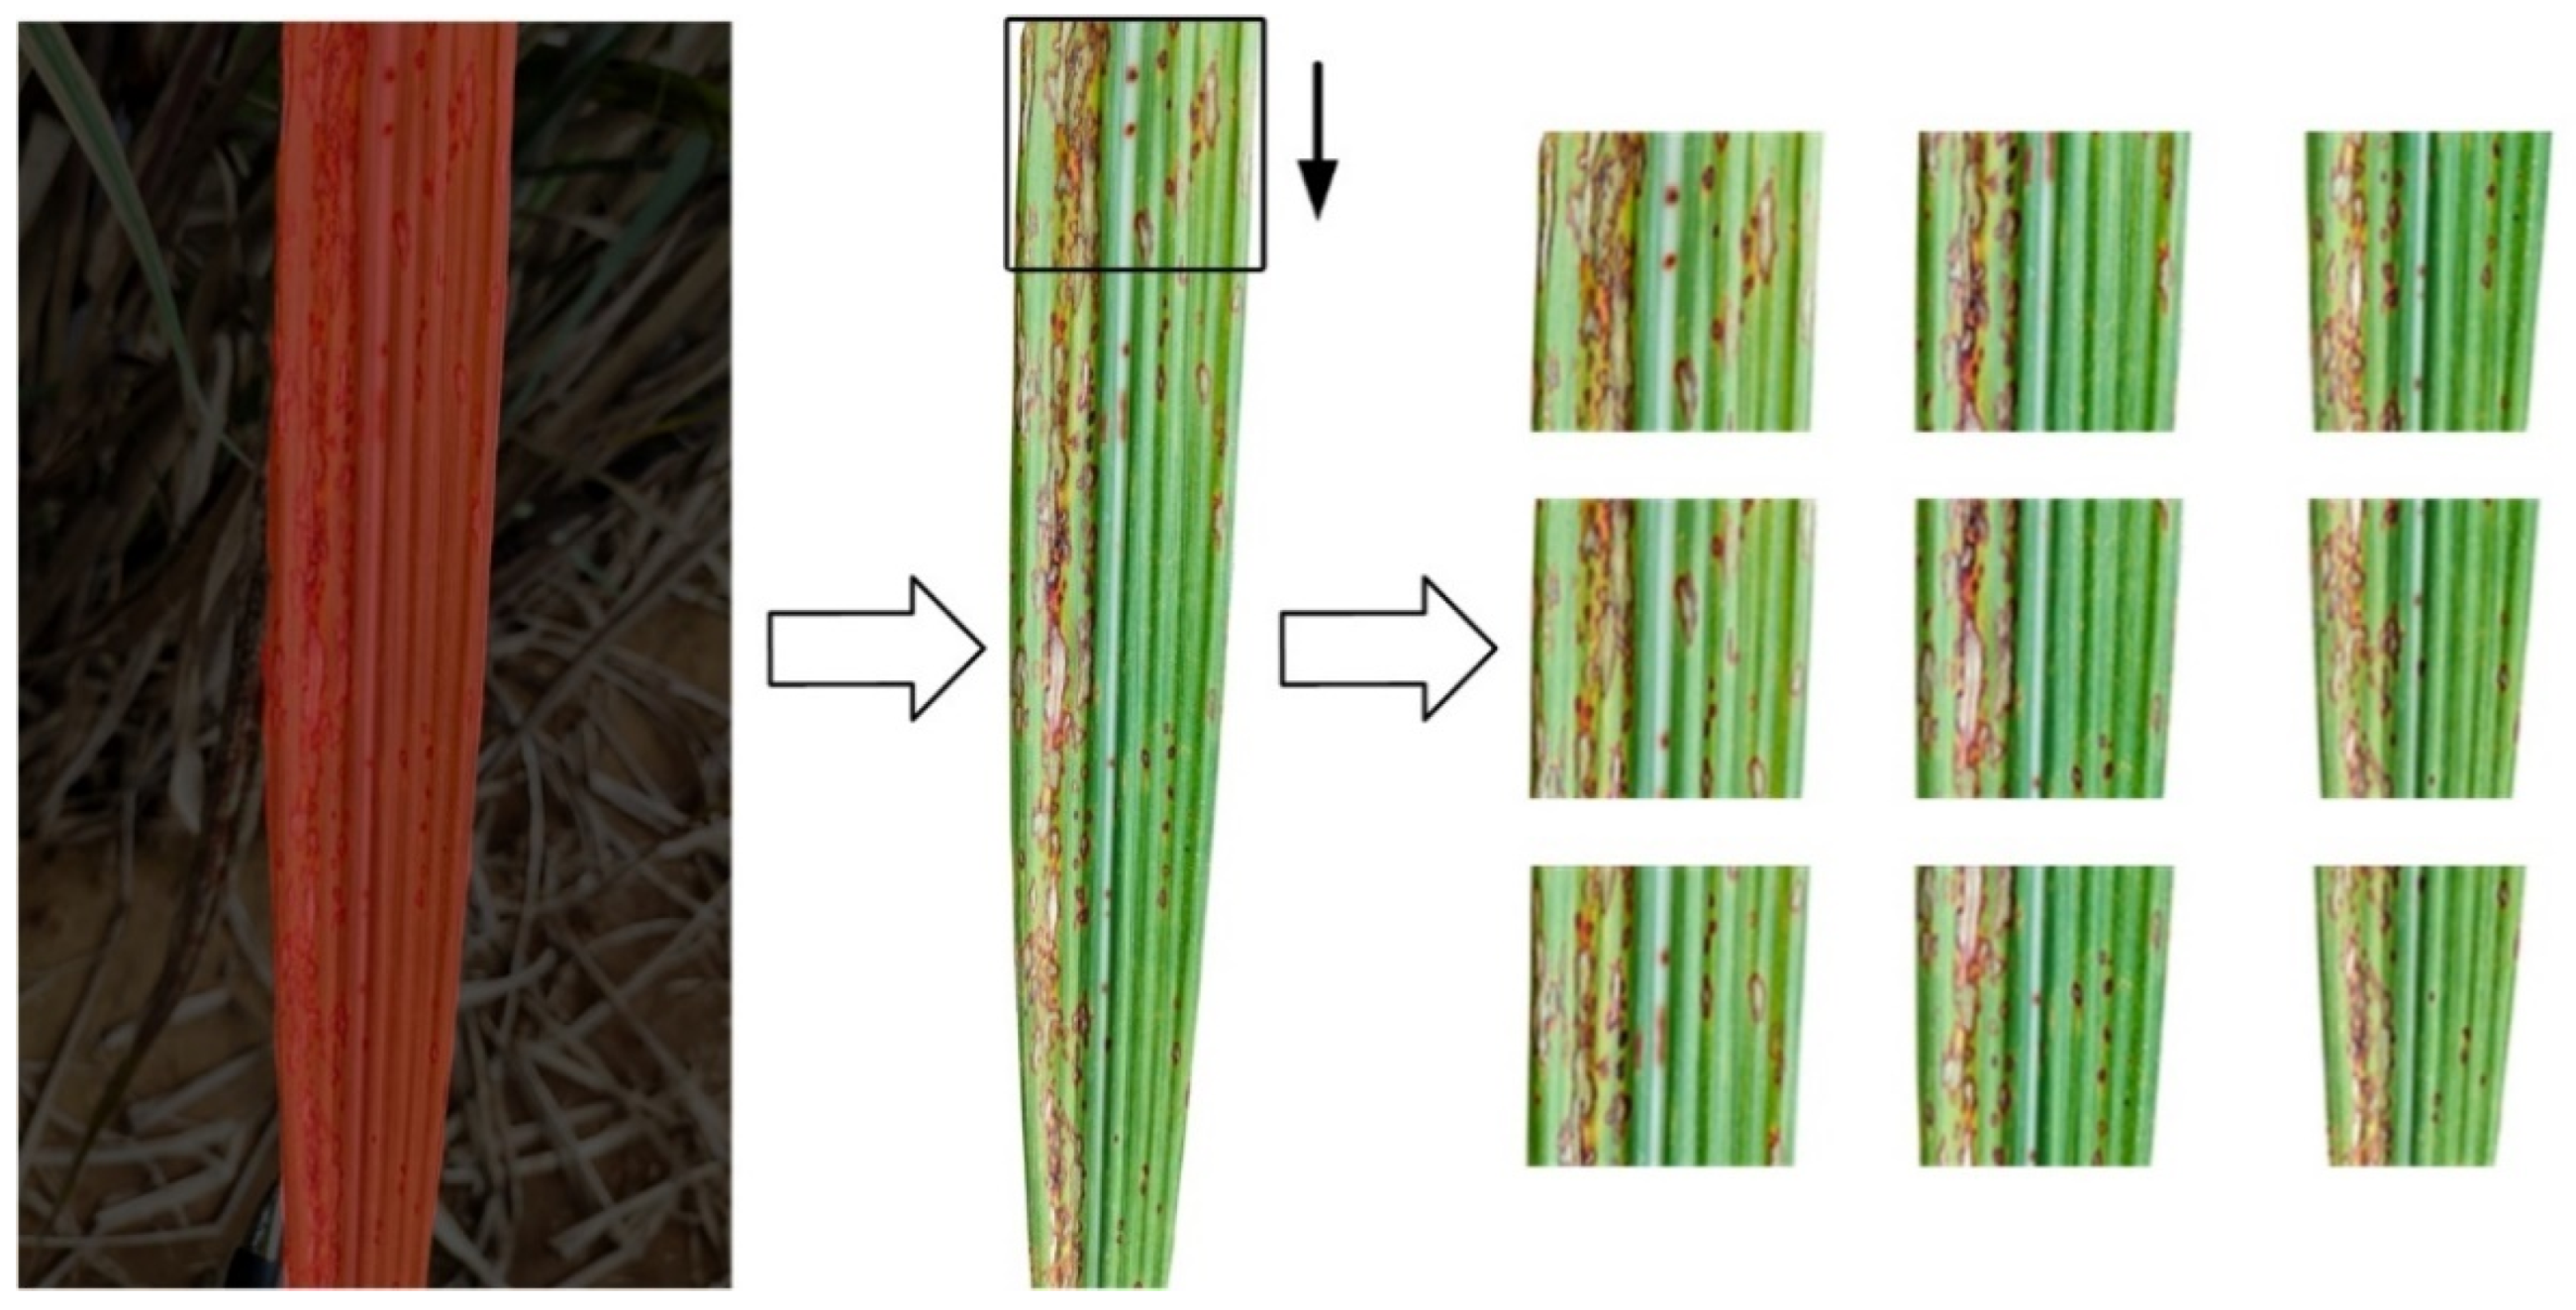
3.1. Image Segmentation Based on DeepLabV3+

A total of 790 original images (used only to train the image segmentation network without considering the disease type) were captured by a mobile phone and network, and the leaves were labeled by Labelme software to generate a mask map. Manually labeled images were taken as the benchmark to evaluate the accuracy. The 790 images were divided into the training set and test set according to a ratio of 9:1. The image segmentation and labeling are shown in Figure 8.
The downsampling multiplier was 16, the input image size was set to 512 × 512 × 3, the training was divided into freezing and unfreezing, and the hyperparameter settings involved in the training process are shown in Table 2.
The DeepLabV3+ network training loss after training is shown in Figure 9, and the image segmentation confusion matrix is shown in Table 3.
The evaluation metric of image segmentation was obtained according to 2.6, as shown in Table 4.
Since the pretraining weights of the network were added during the training process of this experiment, the five evaluation indices of IoU, DSC, VOE, PA, and Precision were relatively excellent. The background was removed by the trained DeepLabV3+ for the second part of the dataset (30 images for each of the four diseases) to obtain the slender sugarcane leaf image, after which the slender sugarcane leaf image was cut into a square partial image by using sliding interception, as shown in Figure 10. The number of images per class are listed as follows: 141 red rot, 135 ring spot, 115 rust, and 138 healthy.

3.2. Supervised Data Augmentation

After considering that image identification experiments would be conducted later, to ensure the accuracy and reliability of the experiments, the test set of the identification experiments could not be involved in the data augmentation, and 50 images of each of the four classes obtained here were removed and utilized as the test dataset in the identification module. Therefore, 91, 85, 65, and 88 images of red rot, ring spot, rust, and healthy sugarcane leaves, respectively, were used in the data augmentation for this stage.
In this stage, three supervised data augmentations of contrast–brightness transformation, increasing noise, and geometric transformation were used to expand the images. Sixty images in each of the four categories were selected to consider the sample balance problem. Table 5 shows the eight operations of 90° rotation, 180° rotation, 270° rotation, increasing salt and pepper noise, increasing Gaussian noise, increasing random noise, increasing brightness, and decreasing brightness. A total of 1920 images were obtained by data augmentation of the original images and background-removed images respectively, with 480 images for each of the four categories.

3.3. Data Augmentation Based on DCGAN

The hyperparameters of the training process were set as follows: the learning rate of the generator was 0.0001, the learning rate of the discriminator was 0.00005, the epoch was 100,000, and the batch size was 64, and the input image size was set to 64 × 64 × 3.
Four classes of samples of red rot, ring spot, rust, and healthy sugarcane leaf images were data-augmented by DCGAN to generate 900 images of each of the four categories for a total of 3600 images. Similarly, four classes of samples with complex backgrounds of red rot, ring spot, rust, and healthy sugarcane leaf images were data-augmented by DCGAN. Three images were randomly selected from each category of the original samples and the generated samples; the results are shown in Table 6.

3.4. Image Recognition Based on MobileNetV3-Large, Alexnet, Resnet, and Densenet

Six groups of samples, named A, B, C, D, E, and F were used to train MobileNetV3-large, Alexnet, Resnet, and Densenet. The training set of sample A included 240 original images; the training set of sample B included 240 original images and 1920 images generated with supervised data augmentation; the training set of sample C included 240 original images and 3600 images with DCGAN data augmentation, totaling 3840 images; the training set of sample D included 240 background-removed images; and the training set of sample E included 240 background-removed images and 1920 images generated with supervised data augmentation, totaling 2160 images. The training set of sample F included 240 background-removed images and 3600 images with DCGAN data augmentation, totaling 3840 images, and the ratio of the training dataset to the validation dataset was 2:1 for all four groups. The test set included 50 images each of red rot, ring spot, rust, and healthy sugarcane leaves, totaling 200 images, as shown in Table 7.
The six groups of samples were trained in image recognition models using the same hyperparameters: the epoch was 50, the batch size was 16, the learning rate was 0.0005, and the input image size was set to 64 × 64 × 3.
After training, the confusion matrices of the six groups were as shown in Figure 11.

4. Data Analysis and Discussion

4.1. Data Analysis

The accuracy and the training time of the six groups by the four image recognition networks were as shown in Table 8.
As shown in Table 8, the highest accuracies for groups A, C, D, and F were obtained by MobileNetV3-large and were 53.5%, 66.5%, 87.5%, and 99%, respectively. The highest recognition accuracies for groups B and E were obtained by Densenet and were 60% and 93%, respectively. The training times for the four networks from low to high were: Alexnet, MobileNetV3-Large, Densenet, and Resnet. Considering the above two points, the MobileNetV3-Large was chosen as the image recognition network for this experiment. The evaluation metric of image recognition was obtained according to 2.6, as shown in Table 9.
By comparing groups A, B, and C with groups D, E, and F, it could be seen that MobileNetV3-Large trained by the background-removed dataset had higher accuracy. According to the confusion matrix of group C in Figure 11a, it can be seen by comparing group B that the number of correct classifications for red rot, ring spot, and healthy sugarcane leaves increased. Only the number of correct classifications for rust decreased, and since the same test dataset was used, it was the change in the training dataset that led to this phenomenon, as shown in the rust images with a complex background generated in Table 6. The rust images generated by DCGAN were very similar to the ring spot images, which eventually caused an increase in the number of misclassifications for rust.
According to the confusion matrix of group D in Figure 11a, the recognition results of the network trained by the samples of group D were general, in which the misidentification mainly occurred between ring spots and rust and between red rot and healthy sugarcane leaves. The reasons for the misidentification of red rot and healthy sugarcane leaves could be attributed to the following two points: first, because the two types of sugarcane leaves only had different colors of leaf veins, and the leaf parts were all healthy colors, with small areas of difference; and second, because the sample size was insufficient and the network training results were poor.
According to the confusion matrix of group E in Figure 11a, the recognition results of the network trained by the group E samples were better, and the number of misidentifications between cane leaves with red rot and healthy cane leaves and between rust and ring spots were reduced in the control of groups D and E, but the false identification cases could not be completely eliminated. The two images were found to be ‘‘CF-03-a’’ and ‘‘CF-17-a’’ by visualizing the misclassification, and the number of classification errors was found to be three and two for these two images in the six recognition processes, respectively. We traced back ‘‘CF-03-a‘‘ and ‘‘CF-17-a‘‘ to the original image with an attached image of healthy sugarcane leaf for comparison, as shown in Figure 12, which indicated that the recognition ability of the network could be improved by supervised data augmentation of the training set.
According to the confusion matrix of group F in Figure 11a, the network trained by group F had the best recognition results. However, there was an error in the classifications of two of the samples, which misidentified two rust images as ring spots. The two images were found to be ‘‘XB-07-a’’ and ‘‘XB-07-b’’ by visualizing the misclassification, and the number of classification errors was found to be five and six for these two images in the six recognition processes, respectively. We traced back ‘‘XB-07-a’’ and ‘‘XB-07-b’’ to the original image with an attached image of ring spot disease for comparison, as shown in Figure 13.
This error occurred because the areas of ring spots and rust were similar, and based on the legend of ringspot disease and rust disease shown in Figure 2, the spots were similar in color, both being yellowish-brown. Although a single area of ring spot is larger than that of rust, it is more difficult to distinguish between the two diseases when the areas of rust disease are crowded.
The MobileNetV3-large trained by group F had the highest precision, recall, specificity, and F1 score for each class compared with those of the other five groups, especially in the two classes of red rot and healthy. The precision, recall, specificity, and F1 score reached 1.00, which indicated that the classification was completely correct. To summarize, MobileNetV3-large trained by the sample with background removal and DCGAN data augmentation had the best recognition ability.

4.2. Discussion

(1)
When using MobileNetV3-large to identify disease on sugarcane leaves, the accuracy of the validation set was only 53.50% when the training set had a complex background and the amount of data was small, and the accuracy of the validation set was increased from 53.50% to 87.50% by removing the complex background of the training set by DeepLabV3+. Then, the accuracy of the validation set was further increased from 87.50% to 99.00% by DCGAN data augmentation. These two methods can not only disregard the problem of image background but also save manpower and material resources in the process of sample collection.
(2)
The comparison shows that the recognition accuracy of the background-removed model trained by supervised data augmentation was only 91.50% and that the recognition accuracy of the network trained by the DCGAN augmented dataset could rise to 99.00%, indicating that the data augmentation using DCGAN was more effective than the supervised data augmentation. Supervised data augmentation does not generate a new sample, and it is difficult for the recognition model to learn more information because of the high similarity between the augmented sample and the original sample. Moreover, adding noise obscures the spots and affects the learning ability of the model, but data augmentation by DCGAN can generate a new spot color, spot shape, and spot distribution, which made the trained model have a better recognition ability. A modern, advanced form of augmentation is synthetic data augmentation, which overcomes the limitations of classical data augmentation.
(3)
In the recognition of sugarcane leaf spots, the morphological characteristics of the spots will affect the recognition ability of the model. In this study, we discovered through the confusion matrix that the misidentification problem caused by only a small area (leaf veins) of color difference between cane leaves with red rot and healthy cane leaves could be solved by data augmentation, but the spot color and spot distribution between the ring spots and rust were similar, especially when the rust infestation was serious, as well as when the rust spot areas were large and very similar to ring spots and when removing the background and data augmentation could reduce, but not completely resolve, the misidentification.
(4)
This analysis has a variety of limitations. Firstly, the variety of supervised data enhancements can continue to grow, and this paper proves that using these eight supervised data augmentations is inferior to using only a DCGAN, but not that using more and more supervised data augmentations is still inferior to using only a DCGAN. Secondly, we used a small dataset to train the DCGAN, and the quality of the synthetic samples produced in this research could be improved by integrating more labeled data, which would improve the learning process of the GAN. Thirdly, this experiment was performed in stages, with background removal, then data augmentation, and finally inputs to the recognition network, and we did not integrate these three parts into a single procedure. Lastly, in the future, we intend to improve not only the segmentation accuracy by enhancing the image segmentation model but also the quality of the synthetic crop images by training a D2PGGAN [34].

5. Conclusions

In this research, we propose an unsupervised data augmentation method for complex backgrounds that generated synthetic sugarcane leaf images to enlarge the dataset and to improve the performance of MobileNetV3-large in sugarcane leaf disease detection. Our limited dataset highlighted the scarcity of crop images in research communities. Initially, DeepLabV3+ was trained with 790 random sugarcane leaves, and the trained DeepLabV3+ was used to perform complex background removal on 120 sugarcane leaves of four classes. Then, data augmentation of background-removed sugarcane leaf images and original sugarcane leaf images with supervised data augmentation and the DCGAN was performed. Furthermore, the performance of MobileNetV3-large with the synthetic data augmentation technique was investigated. Synthetic data augmentation added more variability to the dataset by enlarging it. The DCGAN was used to generate synthetic images of background-removed sugarcane leaf images. An improvement in classification performance from an accuracy of 53.5% to 99% was recorded when MobileNetV3-large was trained on the background-removed data and synthetic augments. An increase in precision, recall, specificity, and F1 score of the classes was also observed. Our experimental results in Table 6 show that synthesized images of sugarcane leaves had significant visualizations and features that helped detect sugarcane diseases. A detailed analysis of the performance of our MobileNetV3-large architecture with the synthetic data augmentation technique is given in Table 9.
In conclusion, we have proposed a way to enhance the accuracy of sugarcane disease detection with minimal data by generating synthetic images of sugarcane leaves. Because of our excellent results, we hope to promote this method to simplify subsequent crop image acquisition and to reduce labor and material consumption.
The findings of this paper provide promising results that encourage the use of this approach to enrich identification studies in agriculture.

Author Contributions

Conceptualization, Y.H. and R.L.; methodology, Y.H.; software, R.L.; validation, X.W., Z.W. and R.L.; formal analysis, X.Q.; investigation, T.G.; resources, X.Q.; data curation, T.G.; writing—original draft preparation, R.L.; writing—review and editing, X.Q.; visualization, R.L.; supervision, Y.H.; project administration, X.Q.; funding acquisition, X.Q. All authors have read and agreed to the published version of the manuscript.

Funding

This work was supported by the National Key R&D Program of China (2021YFD1400100, 2021YFD1400101), the Guangxi Natural Science Foundation Project (2021JJA130221), and the Agricultural Science and Technology Innovation Program.

Data Availability Statement

The data used to support the findings of this study are available from the corresponding author upon request.

Acknowledgments

We thank the Shenzhen Agricultural Genome Research Institute, Chinese Academy of Agricultural Sciences, and all the other members of Guangxi University for their helpful suggestions and constructive criticisms.

Conflicts of Interest

The authors declare that there is no conflict of interest.

References

  1. Karamchandani, B.M.; Chakraborty, S.; Dalvi, S.G.; Satpute, S.K. Chitosan and its derivatives: Promising biomaterial in averting fungal diseases of sugarcane and other crops. J. Basic Microbiol. 2022, 62, 533–554. [Google Scholar] [CrossRef] [PubMed]
  2. Li, Y.R.; Yang, L.T. Sugarcane Agriculture and Sugar Industry in China. Sugar Tech. 2015, 17, 1–8. [Google Scholar] [CrossRef]
  3. Zhang, K.; Xu, X.; Guo, X.; Ding, S.; Gu, T.; Qin, L.; He, Z. Sugarcane Streak Mosaic Virus P1 Attenuates Plant Antiviral Immunity and Enhances Potato Virus X Infection in Nicotiana benthamiana. Cells 2022, 11, 2870. [Google Scholar] [CrossRef] [PubMed]
  4. Liu, B.; Tan, C.; Li, S.Q.; He, J.R.; Wang, H.Y. A Data Augmentation Method Based on Generative Adversarial Networks for Grape Leaf Disease Identification. IEEE Access 2020, 8, 102188–102198. [Google Scholar] [CrossRef]
  5. Khasawneh, N.; Faouri, E.; Fraiwan, M. Automatic Detection of Tomato Diseases Using Deep Transfer Learning. Appl. Sci. 2022, 12, 8467. [Google Scholar] [CrossRef]
  6. Kosamkar, P.K.; Kulkarni, V.Y.; Mantri, K.; Rudrawar, S.; Salmpuria, S.; Gadekar, N. Leaf Disease Detection and Recommendation of Pesticides using Convolution Neural Network. In Proceedings of the 4th International Conference on Computing Communication Control and Automation (ICCUBEA), Pune, India, 16–18 August 2018. [Google Scholar]
  7. Kaur, P.; Harnal, S.; Tiwari, R.; Upadhyay, S.; Bhatia, S.; Mashat, A.; Alabdali, A.M. Recognition of Leaf Disease Using Hybrid Convolutional Neural Network by Applying Feature Reduction. Sensors 2022, 22, 575. [Google Scholar] [CrossRef]
  8. Liang, W.J.; Zhang, H.; Zhang, G.F.; Cao, H.X. Rice Blast Disease Recognition Using a Deep Convolutional Neural Network. Sci. Rep. 2019, 9, 1–10. [Google Scholar] [CrossRef] [Green Version]
  9. Dhaka, V.S.; Meena, S.V.; Rani, G.; Sinwar, D.; Ijaz, M.F.; Wozniak, M. A Survey of Deep Convolutional Neural Networks Applied for Prediction of Plant Leaf Diseases. Sensors 2021, 21, 4749. [Google Scholar] [CrossRef]
  10. Jiang, P.; Chen, Y.H.; Liu, B.; He, D.J.; Liang, C.Q. Real-Time Detection of Apple Leaf Diseases Using Deep Learning Approach Based on Improved Convolutional Neural Networks. IEEE Access 2019, 7, 59069–59080. [Google Scholar] [CrossRef]
  11. Militante, S.V.; Gerardo, B.D.; Medina, R.P. Sugarcane Disease Recognition using Deep Learning. In Proceedings of the IEEE Eurasia Conference on IOT, Communication and Engineering (IEEE ECICE), Natl Formosa Univ, Yunlin, Taiwan, 3–6 October 2022; pp. 575–578. [Google Scholar]
  12. Yan, Q.; Yang, B.H.; Wang, W.Y.; Wang, B.; Chen, P.; Zhang, J. Apple Leaf Diseases Recognition Based on An Improved Convolutional Neural Network. Sensors 2020, 20, 3535. [Google Scholar] [CrossRef]
  13. Loti, N.N.A.; Noor, M.R.M.; Chang, S.W. Integrated analysis of machine learning and deep learning in chili pest and disease identification. J. Sci. Food Agric. 2021, 101, 3582–3594. [Google Scholar] [CrossRef] [PubMed]
  14. Brahimi, M.; Boukhalfa, K.; Moussaoui, A. Deep Learning for Tomato Diseases: Classification and Symptoms Visualization. Appl. Artif. Intell. 2017, 31, 299–315. [Google Scholar] [CrossRef]
  15. Adem, K.; Ozguven, M.M.; Altas, Z. A sugar beet leaf disease classification method based on image processing and deep learning. Multimed. Tools Appl. 2020, 18, 1–18. [Google Scholar] [CrossRef]
  16. Kianat, J.; Khan, M.A.; Sharif, M.; Akram, T.; Rehman, A.; Saba, T. A joint framework of feature reduction and robust feature selection for cucumber leaf diseases recognition. Optik 2021, 240, 166566. [Google Scholar] [CrossRef]
  17. Wang, C.S.; Du, P.F.; Wu, H.R.; Li, J.X.; Zhao, C.J.; Zhu, H.J. A cucumber leaf disease severity classification method based on the fusion of DeepLabV3+and U-Net. Comput. Electron. Agric. 2021, 189, 106373. [Google Scholar] [CrossRef]
  18. Bai, X.B.; Li, X.X.; Fu, Z.T.; Lv, X.J.; Zhang, L.X. A fuzzy clustering segmentation method based on neighborhood grayscale information for defining cucumber leaf spot disease images. Comput. Electron. Agric. 2017, 136, 157–165. [Google Scholar] [CrossRef]
  19. Lin, K.; Gong, L.; Huang, Y.X.; Liu, C.L.; Pan, J. Deep Learning-Based Segmentation and Quantification of Cucumber Powdery Mildew Using Convolutional Neural Network. Front. Plant Sci. 2019, 10, 155. [Google Scholar] [CrossRef] [Green Version]
  20. Wang, Z.; Zhang, S.; Zhao, B. Crop Diseases Leaf Segmentation Method Based on Cascade Convolutional Neural Network. Comput. Eng. Appl. 2020, 56, 242–250. [Google Scholar]
  21. Abbas, A.; Jain, S.; Gour, M.; Vankudothu, S. Tomato plant disease detection using transfer learning with C-GAN synthetic images. Comput. Electron. Agric. 2021, 187, 9. [Google Scholar] [CrossRef]
  22. Douarre, C.; Crispim-Junior, C.F.; Gelibert, A.; Tougne, L.; Rousseau, D. Novel data augmentation strategies to boost supervised segmentation of plant disease. Comput. Electron. Agric. 2019, 165, 9. [Google Scholar] [CrossRef]
  23. Zhang, M.; Liu, S.H.; Yang, F.Y.; Liu, J. Classification of Canker on Small Datasets Using Improved Deep Convolutional Generative Adversarial Networks. IEEE Access 2019, 7, 49680–49690. [Google Scholar] [CrossRef]
  24. Zhang, J.Y.; Rao, Y.; Man, C.; Jiang, Z.H.; Li, S.W. Identification of cucumber leaf diseases using deep learning and small sample size for agricultural Internet of Things. Int. J. Distrib. Sens. Netw. 2021, 17, 13. [Google Scholar] [CrossRef]
  25. Chen, L.C.E.; Zhu, Y.K.; Papandreou, G.; Schroff, F.; Adam, H. Encoder-Decoder with Atrous Separable Convolution for Semantic Image Segmentation. In Proceedings of the 15th European Conference on Computer Vision (ECCV), Munich, Germany, 8–14 September 2018; pp. 833–851. [Google Scholar]
  26. Chen, L.C.; Papandreou, G.; Kokkinos, I.; Murphy, K.; Yuille, A.L. DeepLab: Semantic Image Segmentation with Deep Convolutional Nets, Atrous Convolution, and Fully Connected CRFs. IEEE Trans. Pattern Anal. Mach. Intell. 2018, 40, 834–848. [Google Scholar] [CrossRef] [Green Version]
  27. Goodfellow, I.J.; Pouget-Abadie, J.; Mirza, M.; Xu, B.; Warde-Farley, D.; Ozair, S.; Courville, A.; Bengio, Y. Generative Adversarial Nets. In Proceedings of the 28th Conference on Neural Information Processing Systems (NIPS), Montreal, QC, Canada, 8–13 December 2015; pp. 2672–2680. [Google Scholar]
  28. Sandler, M.; Howard, A.; Zhu, M.L.; Zhmoginov, A.; Chen, L.C. MobileNetV2: Inverted Residuals and Linear Bottlenecks. In Proceedings of the 31st IEEE/CVF Conference on Computer Vision and Pattern Recognition (CVPR), Salt Lake City, UT, USA, 18–23 June 2022; pp. 4510–4520. [Google Scholar]
  29. Chollet, F. Xception: Deep Learning with Depthwise Separable Convolutions. In Proceedings of the 30th IEEE/CVF Conference on Computer Vision and Pattern Recognition (CVPR), Honolulu, HI, USA, 21–26 July 2017; pp. 1800–1807. [Google Scholar]
  30. Howard, A.; Sandler, M.; Chu, G.; Chen, L.C.; Chen, B.; Tan, M.X.; Wang, W.J.; Zhu, Y.K.; Pang, R.M.; Vasudevan, V.; et al. Searching for MobileNetV3. In Proceedings of the IEEE/CVF International Conference on Computer Vision (ICCV), Seoul, Republic of Korea, 27 October–2 November 2019; pp. 1314–1324. [Google Scholar]
  31. Litjens, G.; Toth, R.; van de Ven, W.; Hoeks, C.; Kerkstra, S.; van Ginneken, B.; Vincent, G.; Guillard, G.; Birbeck, N.; Zhang, J.D.; et al. Evaluation of prostate segmentation algorithms for MRI: The PROMISE12 challenge. Med. Image Anal. 2014, 18, 359–373. [Google Scholar] [CrossRef] [Green Version]
  32. Khan, Z.; Yahya, N.; Alsaih, K.; Meriaudeau, F. Zonal Segmentation of Prostate T2W-MRI using Atrous Convolutional Neural Network. In Proceedings of the 17th IEEE Student Conference on Research and Development (SCOReD), Seri Iskandar, Malaysia, 15–17 October 2019; pp. 95–99. [Google Scholar]
  33. Crum, W.R.; Camara, O.; Hill, D.L.G. Generalized overlap measures for evaluation and validation in medical image analysis. IEEE Trans. Med. Imaging 2006, 25, 1451–1461. [Google Scholar] [CrossRef] [PubMed]
  34. Zhang, Z.Y.; Li, M.Y.; Yu, J. D2pggan: Two Discriminators Used in Progressive Growing of Gans. In Proceedings of the 44th IEEE International Conference on Acoustics, Speech and Signal Processing (ICASSP), Brighton, UK, 12–17 May 2049; pp. 3177–3181. [Google Scholar]
Figure 1. Research Roadmap: A, original dataset; B, original dataset with supervised data augmentation; C, original dataset with DCGAN augmentation; D, background-removed dataset; E, background-removed dataset with supervised data augmentation; and F, background-removed dataset with DCGAN augmentation.
Agriculture 12 01997 g001
Figure 2. Sample images of the three disease classes and the healthy class: (a) red rot, (b) ring spot, (c) rust, and (d) healthy.
Agriculture 12 01997 g002
Figure 3. DeepLabV3+ network block structure.
Agriculture 12 01997 g003
Figure 4. GAN network block structure.
Agriculture 12 01997 g004
Figure 5. G and D network block structure.
Agriculture 12 01997 g005
Figure 6. MobilenetV3-large network block structure.
Agriculture 12 01997 g006
Figure 7. DenseNet network block structure.
Agriculture 12 01997 g007
Figure 8. Image segmentation and labelling.
Agriculture 12 01997 g008
Figure 9. DeepLabV3+ network training loss.
Agriculture 12 01997 g009
Figure 10. Image segmentation results.
Agriculture 12 01997 g010
Figure 11. Confusion matrix of the four image recognition networks: (a) MobileNetV3-Large, (b) Alexnet, (c) Resnet, and (d) Densenet. (Explanations of A–F): A, original dataset; B, original dataset with supervised data augmentation; C, original dataset with DCGAN augmentation; D, background-removed dataset; E, background-removed dataset with supervised data augmentation; and F, background-removed dataset with DCGAN augmentation. 2. (Explanations of CF, HB, JK and XB): CF, red rot; HB, ring spot; JK, healthy; and XB, rust.
Agriculture 12 01997 g011aAgriculture 12 01997 g011b
Figure 12. Comparison of pictures of misclassified red rot and healthy sugarcane leaf.
Agriculture 12 01997 g012
Figure 13. Comparison of pictures of misclassified rust and ring spots.
Agriculture 12 01997 g013
Table 1. Number and use of datasets.
DatasetsClassesNumberUses
Part 1Sugarcane leaves
(without considering the disease type)
790Train DeepLabV3+.
Part 2Leaver of red rot 30Train for identification of classification models.
Leaver of ring spot30
Healthy leaves30
Leaver of rust30
Table 2. DeepLabV3+ network training phase hyperparameter setting.
StageHyperparameterValue
FreezingEpoch50
Batch size4
Learning rate5 × 10−4
UnfreezingEpoch50
Batch size4
Learning rate5 × 10−5
Table 3. Image segmentation confusion matrix.
Sugarcane (Ture)Background (Ture)
Sugarcane (Predicted)315,282,1532,369,606
Background (Predicted)3,089,848747,224,601
Table 4. The evaluation metric of image segmentation.
Evaluation MetricValue
IoU98.30%
DSC99.14%
PA99.50%
Precision99.25%
VOE0.86
Table 5. Example of supervised data augmentation.
Original90° Rotation180°
Rotation
270°
Rotation
Sp
Noise
Gaussian NoiseRandom NoiseBrightness IncreaseBrightness Decrease
Agriculture 12 01997 i001Agriculture 12 01997 i002Agriculture 12 01997 i003Agriculture 12 01997 i004Agriculture 12 01997 i005Agriculture 12 01997 i006Agriculture 12 01997 i007Agriculture 12 01997 i008Agriculture 12 01997 i009
Table 6. Display of DCGAN data augmentation results.
BackgroundClassOriginalGenerated
Removed by DeepLabV3+Red rotAgriculture 12 01997 i010Agriculture 12 01997 i011Agriculture 12 01997 i012Agriculture 12 01997 i013Agriculture 12 01997 i014Agriculture 12 01997 i015
Ring spotAgriculture 12 01997 i016Agriculture 12 01997 i017Agriculture 12 01997 i018Agriculture 12 01997 i019Agriculture 12 01997 i020Agriculture 12 01997 i021
RustAgriculture 12 01997 i022Agriculture 12 01997 i023Agriculture 12 01997 i024Agriculture 12 01997 i025Agriculture 12 01997 i026Agriculture 12 01997 i027
HealthyAgriculture 12 01997 i028Agriculture 12 01997 i029Agriculture 12 01997 i030Agriculture 12 01997 i031Agriculture 12 01997 i032Agriculture 12 01997 i033
Complex
background
Red rotAgriculture 12 01997 i034Agriculture 12 01997 i035Agriculture 12 01997 i036Agriculture 12 01997 i037Agriculture 12 01997 i038Agriculture 12 01997 i039
Ring spotAgriculture 12 01997 i040Agriculture 12 01997 i041Agriculture 12 01997 i042Agriculture 12 01997 i043Agriculture 12 01997 i044Agriculture 12 01997 i045
RustAgriculture 12 01997 i046Agriculture 12 01997 i047Agriculture 12 01997 i048Agriculture 12 01997 i049Agriculture 12 01997 i050Agriculture 12 01997 i051
HealthyAgriculture 12 01997 i052Agriculture 12 01997 i053Agriculture 12 01997 i054Agriculture 12 01997 i055Agriculture 12 01997 i056Agriculture 12 01997 i057
Table 7. Input datasets for the image recognition models.
SampleNumberDescription
TrainValTest
A16080200Original images
B1440720Supervised data augmentation for original images
C25601280DCGAN data augmentation for back original images
D16080Background-removed images
E1440720Supervised data augmentation for background-removed images
F25601280DCGAN data augmentation for group images
Table 8. Performance comparison of the networks trained by the six groups of samples.
ModelGroupAccuracyTraining Time/s
MobileNetV3-LargeA53.5%96.8
B58.0%792.5
C66.5%1423.3
D87.5%94.2
E91.5%793.7
F99.0%1476.1
AlexnetA44.5%87.3
B55.0%457.6
C59.0%1405.2
D86.0%86.4
E90.5%444.9
F96.5%1394.3
ResnetA43.0%192.3
B56.0%1632.2
C60.0%2831.5
D86.0%197.3
E92.0%1613.5
F97.5%2976.4
DensenetA42.0%175.1
B60.0%1622.4
C63.0%2521.3
D81.0%176.3
E93.0%1659.4
F98.5%2423.6
Table 9. Performance comparison of MobileNetV3-Large trained by the four groups of samples.
GroupClassPrecisionRecallF1-ScoreSpecificityAccuracy
ARed rot 0.470.620.530.6853.50%
Ring spot0.830.680.750.91
Healthy 0.480.580.530.72
Rust0.390.260.310.82
BRed rot 0.720.620.670.8858.00%
Ring spot0.510.940.660.60
Healthy 1.000.100.181.00
Rust0.560.660.610.76
CRed rot 0.740.700.720.8966.50%
Ring spot0.620.980.760.74
Healthy 0.730.760.740.87
Rust0.500.220.310.92
DRed rot 0.790.920.850.9187.50%
Ring spot0.950.860.900.99
Healthy 0.910.820.860.97
Rust0.870.900.880.95
ERed rot 0.950.840.890.9991.50%
Ring spot0.800.980.880.92
Healthy 0.961.000.980.99
Rust0.980.840.900.99
FRed rot 1.001.001.001.0099.00%
Ring spot0.961.000.980.99
Healthy 1.001.001.001.00
Rust1.000.960.981.00
Publisher’s Note: MDPI stays neutral with regard to jurisdictional claims in published maps and institutional affiliations.

