Article

Characterization of Polyphenols in a Sicilian Autochthonous White Grape Variety (PDO) for Monitoring Production Process and Shelf-Life of Wines

by
Mattia Rapa
*,
Vanessa Giannetti
and
Maurizio Boccacci Mariani
Department of Management, Sapienza University of Rome, 00161 Rome, Italy
*
Author to whom correspondence should be addressed.
Agriculture 2022, 12(11), 1888; https://doi.org/10.3390/agriculture12111888
Submission received: 10 October 2022 / Revised: 4 November 2022 / Accepted: 7 November 2022 / Published: 10 November 2022
(This article belongs to the Special Issue Agricultural Products Processing and Postharvest Storage)

Abstract

:
Sicilian wines have shown a growing expansion in the international market, and over 60% of the production of them is focused on quality products. Grillo is a white grape variety, and it is among the best-known variety, with a cultivated area of 6300 ha and with the vocation of being particularly predisposed to aging for years or even decades. This paper aimed to perform a physiochemical (SSC and pH) and polyphenolic characterization of Grillo wines that were produced by a selected winery in the years 2011–2021 using an optimized RP-HPLC-DAD method. The polyphenols fraction was assessed by means a semiquantitative analysis on which, statistical processing was carried out. The HCA and PCA highlighted the presence of three clusters in the samples. Cluster 1 was composed of the samples from the years 2011–2014, cluster 2 composed of the samples from 2015–2017, and cluster 3 composed of the samples from 2019–2021. Using an HSD Tukey test, it was possible to point out that some compounds were makers of specific clusters and therefore, specific vintages. This preliminary study showed that polyphenols are suitable markers that can be used to identify Grillo vintages, and they should be also related to the storage conditions or different production processes.

1. Introduction

Viticulture consists of the set of agronomic techniques that are used for the cultivation of the vine. From planting vines to their removal, viticulture embraces every aspect of the grape plant’s life. The cultivation of vineyards is one of the most important and essential phases of the wine making process [1,2,3]. The first evidence of Sicilian viticulture seems to date back to the 2nd millennium BC. Influenced by the various dominations that have occurred on the island, Sicilian viticulture is today characterized by a complexity of native cultivars [4]. Sicily, with 17.5% of the national production, is the Italian region with the largest wine-growing area. In recent decades, Sicilian wines have experienced a growing expansion in the international market [5]. Indeed, since the early 1990s, Sicilian wine producers have understood the need to increase the quality of their production to compete with the market challenges of the global market [6]. Over 60% of the production is focused on quality wines with 24 PDO (Protected Designation of Origin) and 7 PGI (Protected Geographical Indication) certifications. Among the best-known and autochthonous ones are Nero D’Avola, Frappato, Nerello, Grillo, Catarratto, Carricante, and Marsala [6].
The wide organoleptic variety of these wines—from the more alcoholic and full-bodied ones to the fresher, elegant, and fragrant ones—is due not only to the grape variety, but to the different pedoclimatic conditions of the Sicilian Island [7]. The Mediterranean climate, in fact, is characterized by hilly and coastal areas with mild winters and low rainfall and hot summers, and sometimes it is sultry and ventilated, while the mountainous and inland areas are affected by a continental climate, which is cold and rigid, especially on the Etna and Madonie mountains, which strongly determines the daily and seasonal temperature variations [8]. The characteristics and production of the different cultivars are also influenced by the differences in the composition of the soils of the different areas [9]. For example, the lava soils of Etna are optimal for the Carricante and Nerello vines, and the calcareous and clayey soils are optimal for the Nero d’Avola vines, while those of tuff give a sugary charge and a refined aroma to the white wines, in particular to the Grillo [9].
The Grillo is a white grape variety that is famous above all for its role in the Marsala fortified wines of the island [10]. It is still widely planted in western Sicily, with there being a cultivated area of 6300 ha, despite the fall in the trend of Marsala, and it is now most commonly used in a variety of still white wines, both varietal and blended types [11]. Grillo adapts well to the hot and dry Sicilian climate and shows adequate resistance to downy mildew. Its high sugar levels and the ease with which it oxidizes make it a good option for fortification. Grillo can produce wines with an alcohol content that reaches 15/16° vol. [12]. In recent years, as the focus has shifted from quantity to quality, the Sicilian producers of it, thanks to the improvement of viticultural and vinicultural techniques, have begun to revisit the Grillo wines. This has produced Grillo wines of a great organoleptic thickness, savoury, and fragrance that are more pleasant than the rather earthy styles that were previously available. Furthermore, Grillo has the vocation of being particularly predisposed to aging for years or even decades [13].
In this regard, the present study aimed to investigate the possibility of using the total content of polyphenols as an indicator of the shelf-life of Grillo wines.
In the scientific literature, there are some studies on the subject, for example Arena et al. (2021) showed that the phenolic content in Malvasia delle Lipari wine varies over time (6 months of monitoring) and with the storage temperature (30, 35, and 45 °C), and that this aspect was not influenced by the colour of the glass bottle [14]. Diaz-Maroto et al. (2020) showed that after 12 months of bottle storage, a significant loss of the phenolic compounds was observed in all of the analyzed samples [15]. The same trend was found by Castellanos et al. (2021), but they also highlighted that after 12 months of storage, no changes in the phenolic content were reported [16]. Therefore, the studies on the subject do not show a univocal trend of the phenolic content during storage, so there is a bibliographic gap in the variation of these compounds in white wines during the aging period.
In this context, our research aimed to perform a polyphenolic characterization of the Grillo wines that were produced by a selected winery in the years 2011–2021 using an optimized RP-HPLC-DAD method. The data that were obtained were then processed by a chemometric analysis. In addition, the soluble solids content (SSC) and pH were determined due to their importance as quality indices in winemaking. The SSC are mainly organic sugars, such as glucose, sucrose, and fructose, which affect the taste and transparency of the wine. The pH was used as the measure of its acidity, which is due to the inclusion of organic acids such as lactic acid, malic acid, and others. Furthermore, the pH is an important parameter of complicated biochemical changes during fermentation and winemaking (e.g., degradation of some nutrients or formation of by-products) [17,18,19,20,21].

2. Materials and Methods

2.1. Reagents and Standard Solutions

All reagents used were analytical grade. The acetonitrile, methanol, and formic acid were provided by Merck (Darmstadt, Germany). The water was obtained from a Milli-Q water purification system (Millipore, Bedford, MA, USA). The standards of gallic acid (r2 = 0.9981), p-hydroxybenzoic acid (r2 = 0.9995), and ferulic acid (r2 = 0.9999) were from Sigma-Aldrich (St. Louis, MO, USA). The standard stock solutions of polyphenols were prepared in methanol and stored at 4 °C in the dark.

2.2. Sampling

A total of eighteen Grillo white wines from a Sicilian winery, called “Cantina Cellaro S.C.A.”, located in Sambuca di Sicilia (Agrigento, Sicily), were analyzed. All of the samples reported that there was Grillo on the label. The samples were produced during the period of 2011–2021. For the same year of production, two bottles from different production batches were collected. No samples were included for the 2012 and 2018 vintages due to their different storage conditions. The samples were filtered through a 0.45 μm PTFE membrane filter (Merck, Darmstadt, Germany). The analyses were performed in triplicate immediately after we opened the bottle. Table 1 shows the alcohol content and the selling price of the analyzed samples.

2.3. HPLC Analysis

A Waters HPLC system (600 Waters, Milford, MA, USA), which was entirely assembled with PEEK tubing, was used for the chromatographic analysis. The HPLC system was equipped with a 20 μL injection loop and coupled to a Waters Photodiode Array Detector (2998 Waters, Milford, MA, USA) set at 280 nm. A reversed-phase Kinetex C18 column (250 × 4.6 mm i.d., 5 μm pore size) (Phenomenex, Torrance, CA, USA) was used. The mobile phase consisted of a 0.5% (v/v) solution of formic acid (eluent A) and acetonitrile (eluent B). The gradient elution was as follows: 90:10% (A:B) from 0 to 2 min, 85:15% for 13 min, 50:50% for 2 min, and 10:90% for 12 min, which was followed by the cleaning and balancing of the column [22,23,24,25,26,27,28]. The separation was achieved after 19 min with a flow rate of 1 mL/min. Data acquisition and processing was performed using the Empower 2 software. Some polyphenols were identified by comparing their retention times with those of the pure standards, and their quantification was carried out using the external standard method.

2.4. Physiochemical Analysis

The soluble solids content (SSC) was measured using an RS PRO portable refractometer (Milan, Italy) at 20 °C. The accuracy of the refractive index was ±0.01, and the °Brix range was 0–20. The pH was measured using a pH-meter (Hanna Instruments, Woonsocket, RI, USA) with an accuracy of 0.001.

2.5. Statistical Analysis

The HSD Tukey test and chemometric data analyses (PCA and CA) were performed using the JMP software (ver. 16.2 Pro, SAS Institute, Cary, NC, USA).

3. Results and Discussions

3.1. Physiochemical Parameters

The presence of phytochemicals in the grapes (such as mineral salts, organic acids, sugars, etc.), and therefore in the wine, deriving from the metabolism of the plants, is closely related to their health properties. Furthermore, these substances are also involved in the evaluation of food quality and safety. Their level in the final product is strictly influenced by the cultivars, environmental factors, cultural practices, and genetic aspects [21]. Zietsman et al. (2015) pointed out that large differences in the SSC in the wines should reflect the variations in the annual climate conditions [29]. Rouxinol et al. (2022) reported that the SSC and pH are important quality parameters that have a great impact on the wine’s quality and are usually used to select the right harvest date [17].
Table 2 shows the pH and SSC values that were measured in the analyzed samples.
As for the SSC, which is expressed in °Brix, there is not a great variability between the samples, but it is possible to highlight that the 2021 samples have a lower SSC value than the other vintages do. The only statistically significant difference was found between the 2013 and 2021 samples. The possible correlation of the evidenced difference with the climate conditions was explored. Table 3 shows the climate conditions in the years that were under review. Nevertheless, no significant difference was found with the recovered climate parameters (minimum, medium and maximum temperature, rainy days per year, and relative humidity), therefore, in this context, it is not possible to attribute the SSC difference to the climatic conditions.
The trend of the pH values also showed a slight variation over the years, going from a maximum of 3.36 in 2011 to a minimum of 3.15 in 2021. Additionally, in this case it is not possible to highlight a significant variability between the samples.

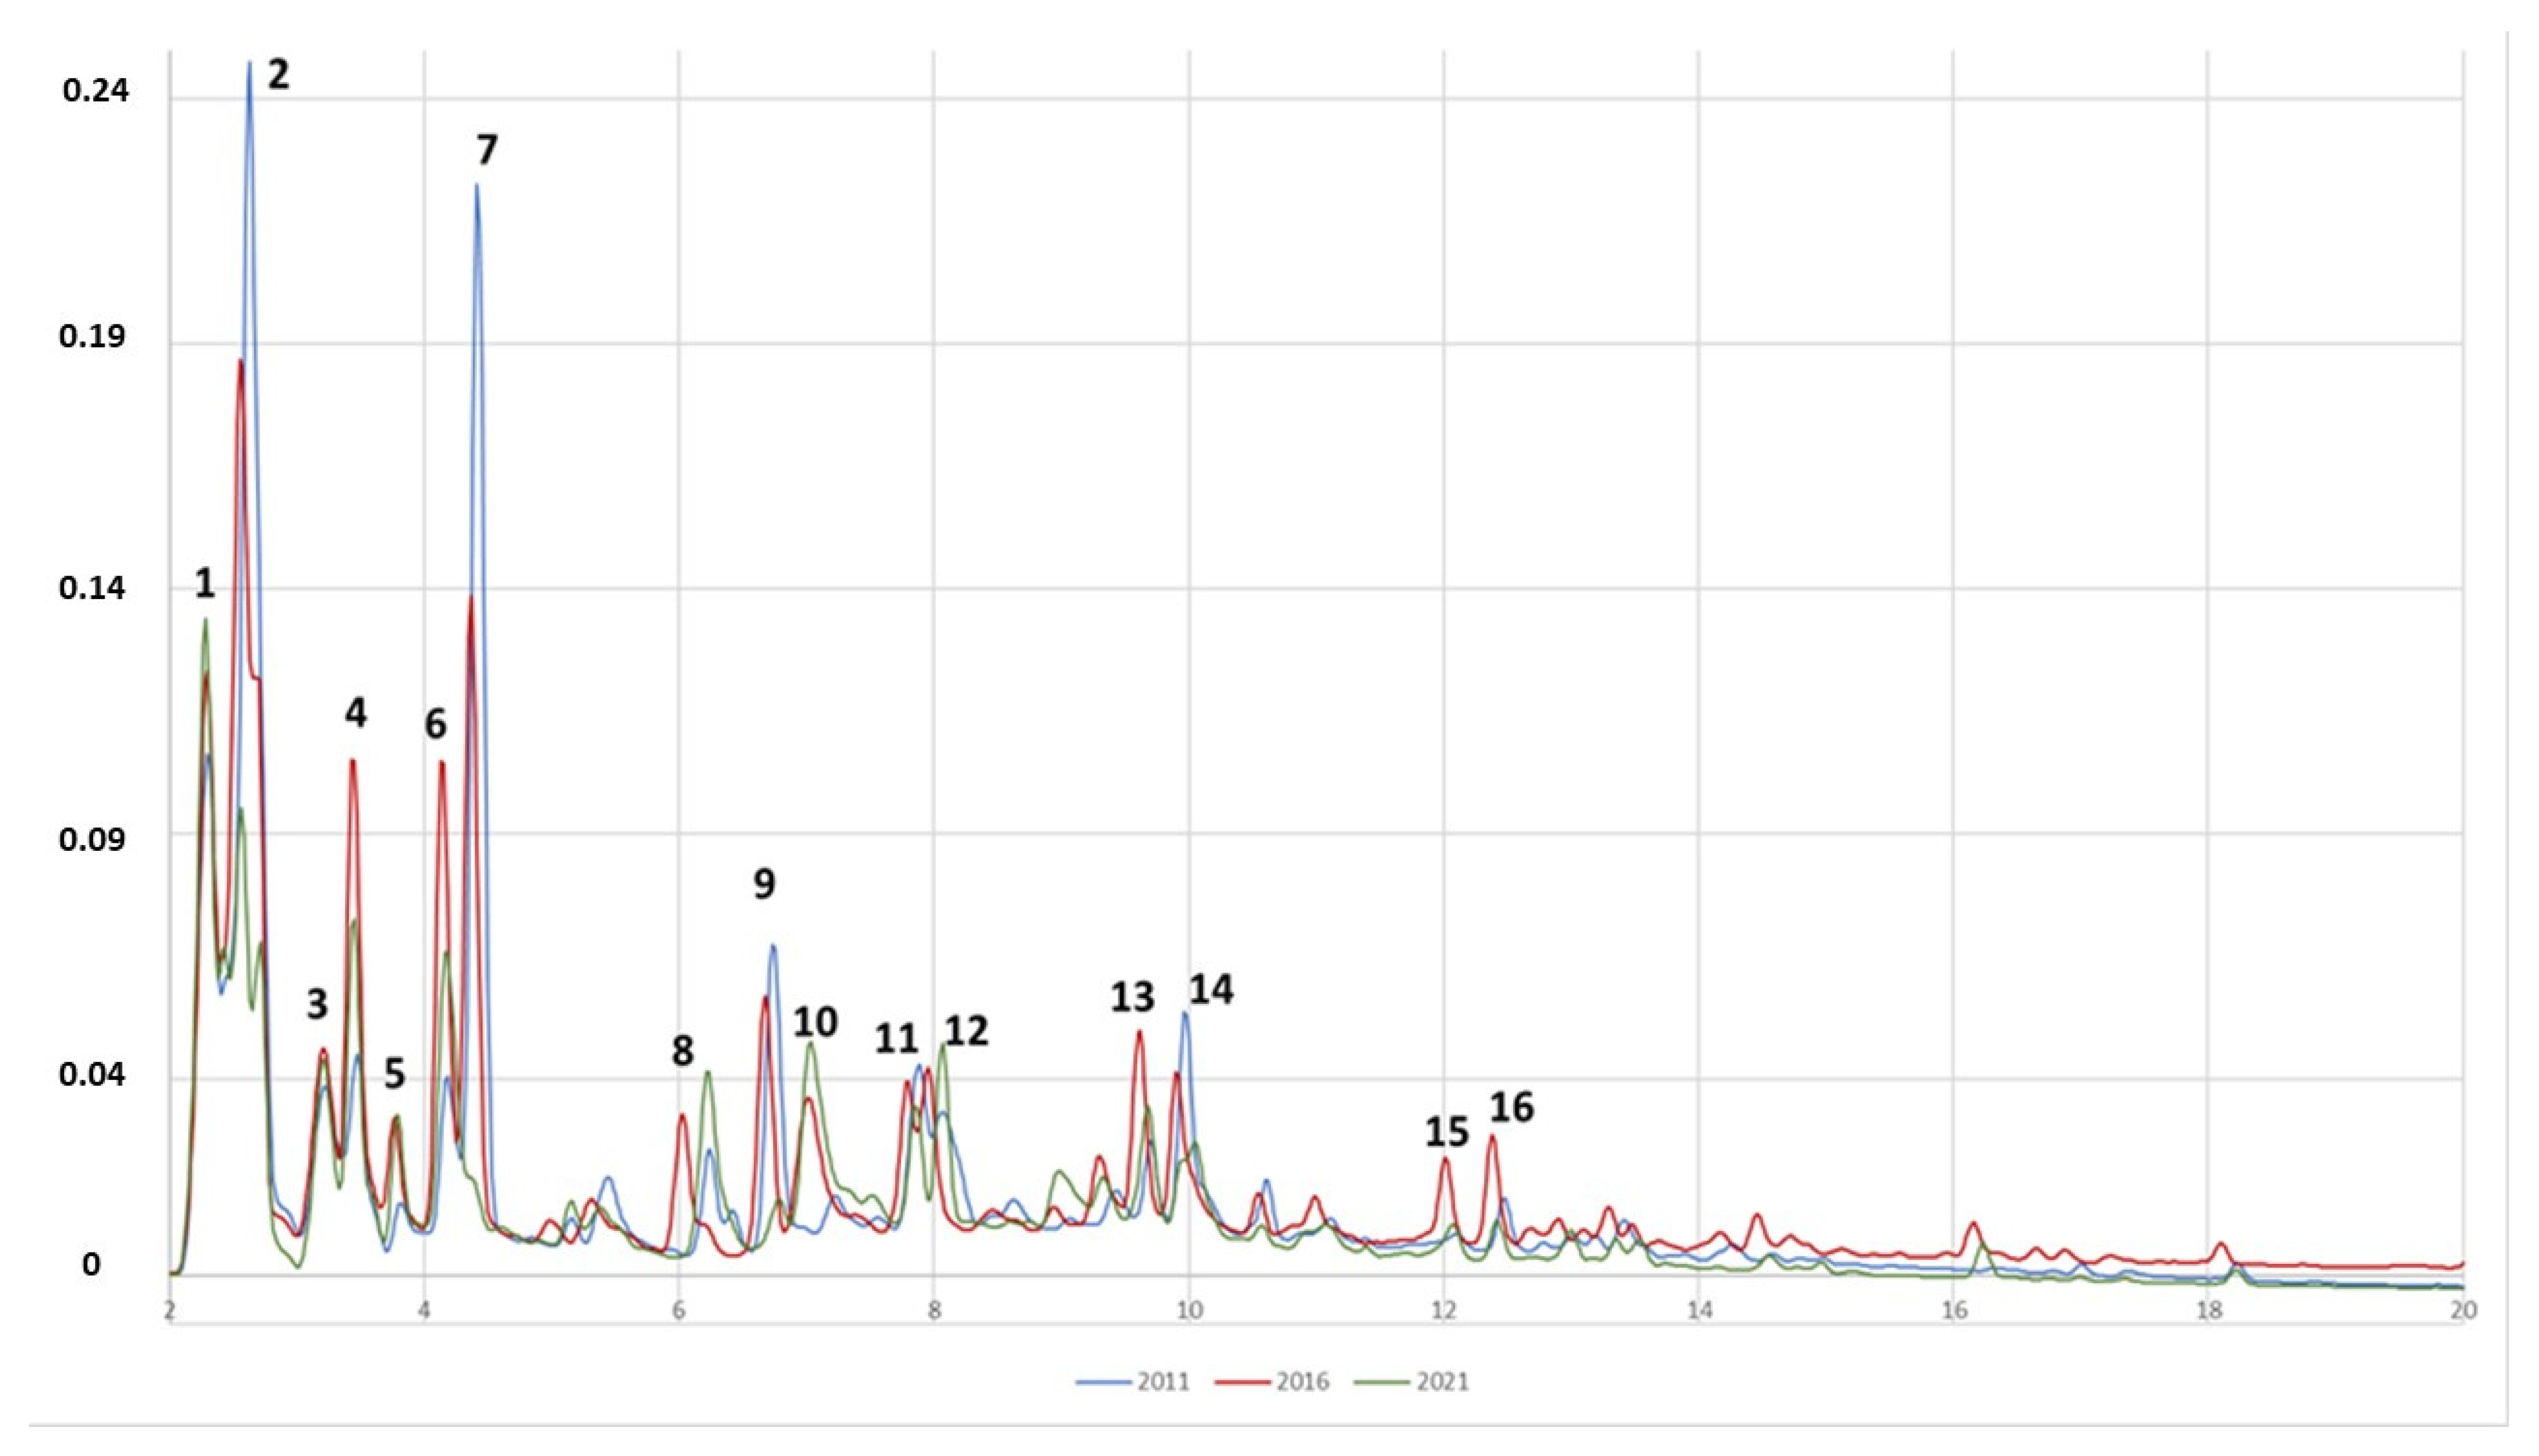
3.2. Chromatographic Results

The polyphenol contents in the wines are related to various factors, such as the grape varieties, the winemaking process, their storage, and their shelf-life. For this purpose, in the present study, the polyphenolic fractions of 18 samples of Grillo wines, which were produced from 2011 to 2021, were investigated. Two samples were analyzed for each vintage. To avoid a bias occurring, all of the samples came from the same vine (Grillo), were produced in the same area (Sambuca di Sicilia, Ag) by the same company (Cantine Cellaro), and were stored in the same storage warehouse.
A fast and reliable chromatographic method was optimized. The separation of the polyphenolic fraction was obtained within 19 min. No extraction step was required, and the samples were only filtered before the analysis. A comparison of the chromatographic profiles of three samples (2011, 2016, and 2021) is reported in Figure 1. Sixteen peaks, each one being attributable to a specific polyphenol, were identified and are numbered (1–16) in Figure 1.
A semi-quantitative analysis was performed using gallic acid, p-hydroxybenzoic acid, and ferulic acid as external reference standards. Gallic acid (r.t. 3.5 min) was used to quantify the compounds that were identified from peak one to peak seven (range 2–5 min). As we used a reverse phase method, these first eluted compounds are attributable to simple polyphenols. p-Hydroxybenzoic acid (r.t. 8.5 min) was used to quantify the peaks from point eight to point fourteen (range 5–11 min). The compounds that were eluted in this range could be phenolic acids or more complex polyphenols such as catechins, as can be seen from the reference literature. Ferulic acid was used to quantify peak 15 and peak 16 (range 11–19 min), which are the typical area of the anthocyanins, anthocyanidins, and stilbenes.
Table 4 shows the results of the semi-quantitative analysis, which is expressed as equivalent mg of gallic acid (GAE/L), p-hydroxybenzoic acid (PAE/L), and ferulic acid (FAE/L).
Some differences emerged from the evaluation of the chromatographic results. For example, in regard to the area of the simple polyphenols, peak two and peak seven showed a similar trend. Their values decreased over time (2011–2017), passing from a value of 75.25 mgGAE/L in peak two in the 2011 sample to 18.45 mgGAE/L in 2020; while for peak seven, this was from 41.55 mgGAE/L in 2011 to 0.23 mg GAE/L in 2021. An opposite trend occurred for peaks four and five, and in fact, their content tended to increase during the shelf-life (peak four: 10.40 mgGAE/L in 2011 and 27.45 mgGAE/L in 2020; peak five: 3.32 mgGAE/L in 2011 and 8.71 mgGAE/L in 2020). Peak six showed an even different trend, its content increased from 7.92 mgGAE/L in 2011 to 21.3 mgGAE/L in 2017, and then, it decreased to 9.62 mgGAE/L in 2020. For the remaining peaks, only peak eight—in the phenolic acids zone—showed a particular trend. Its content, in fact, decreased from 18.8 mgPAE/L in 2011 to 10.6 mgPAE/L in 2020.
Due to the variability of the values that were obtained in the wine of the same cultivar but from subsequent vintages and the different trends that were manifested by each single compound, it was not possible to give a univocal interpretation of the results. To this end, a statistical processing was carried out after the preliminary evaluation.

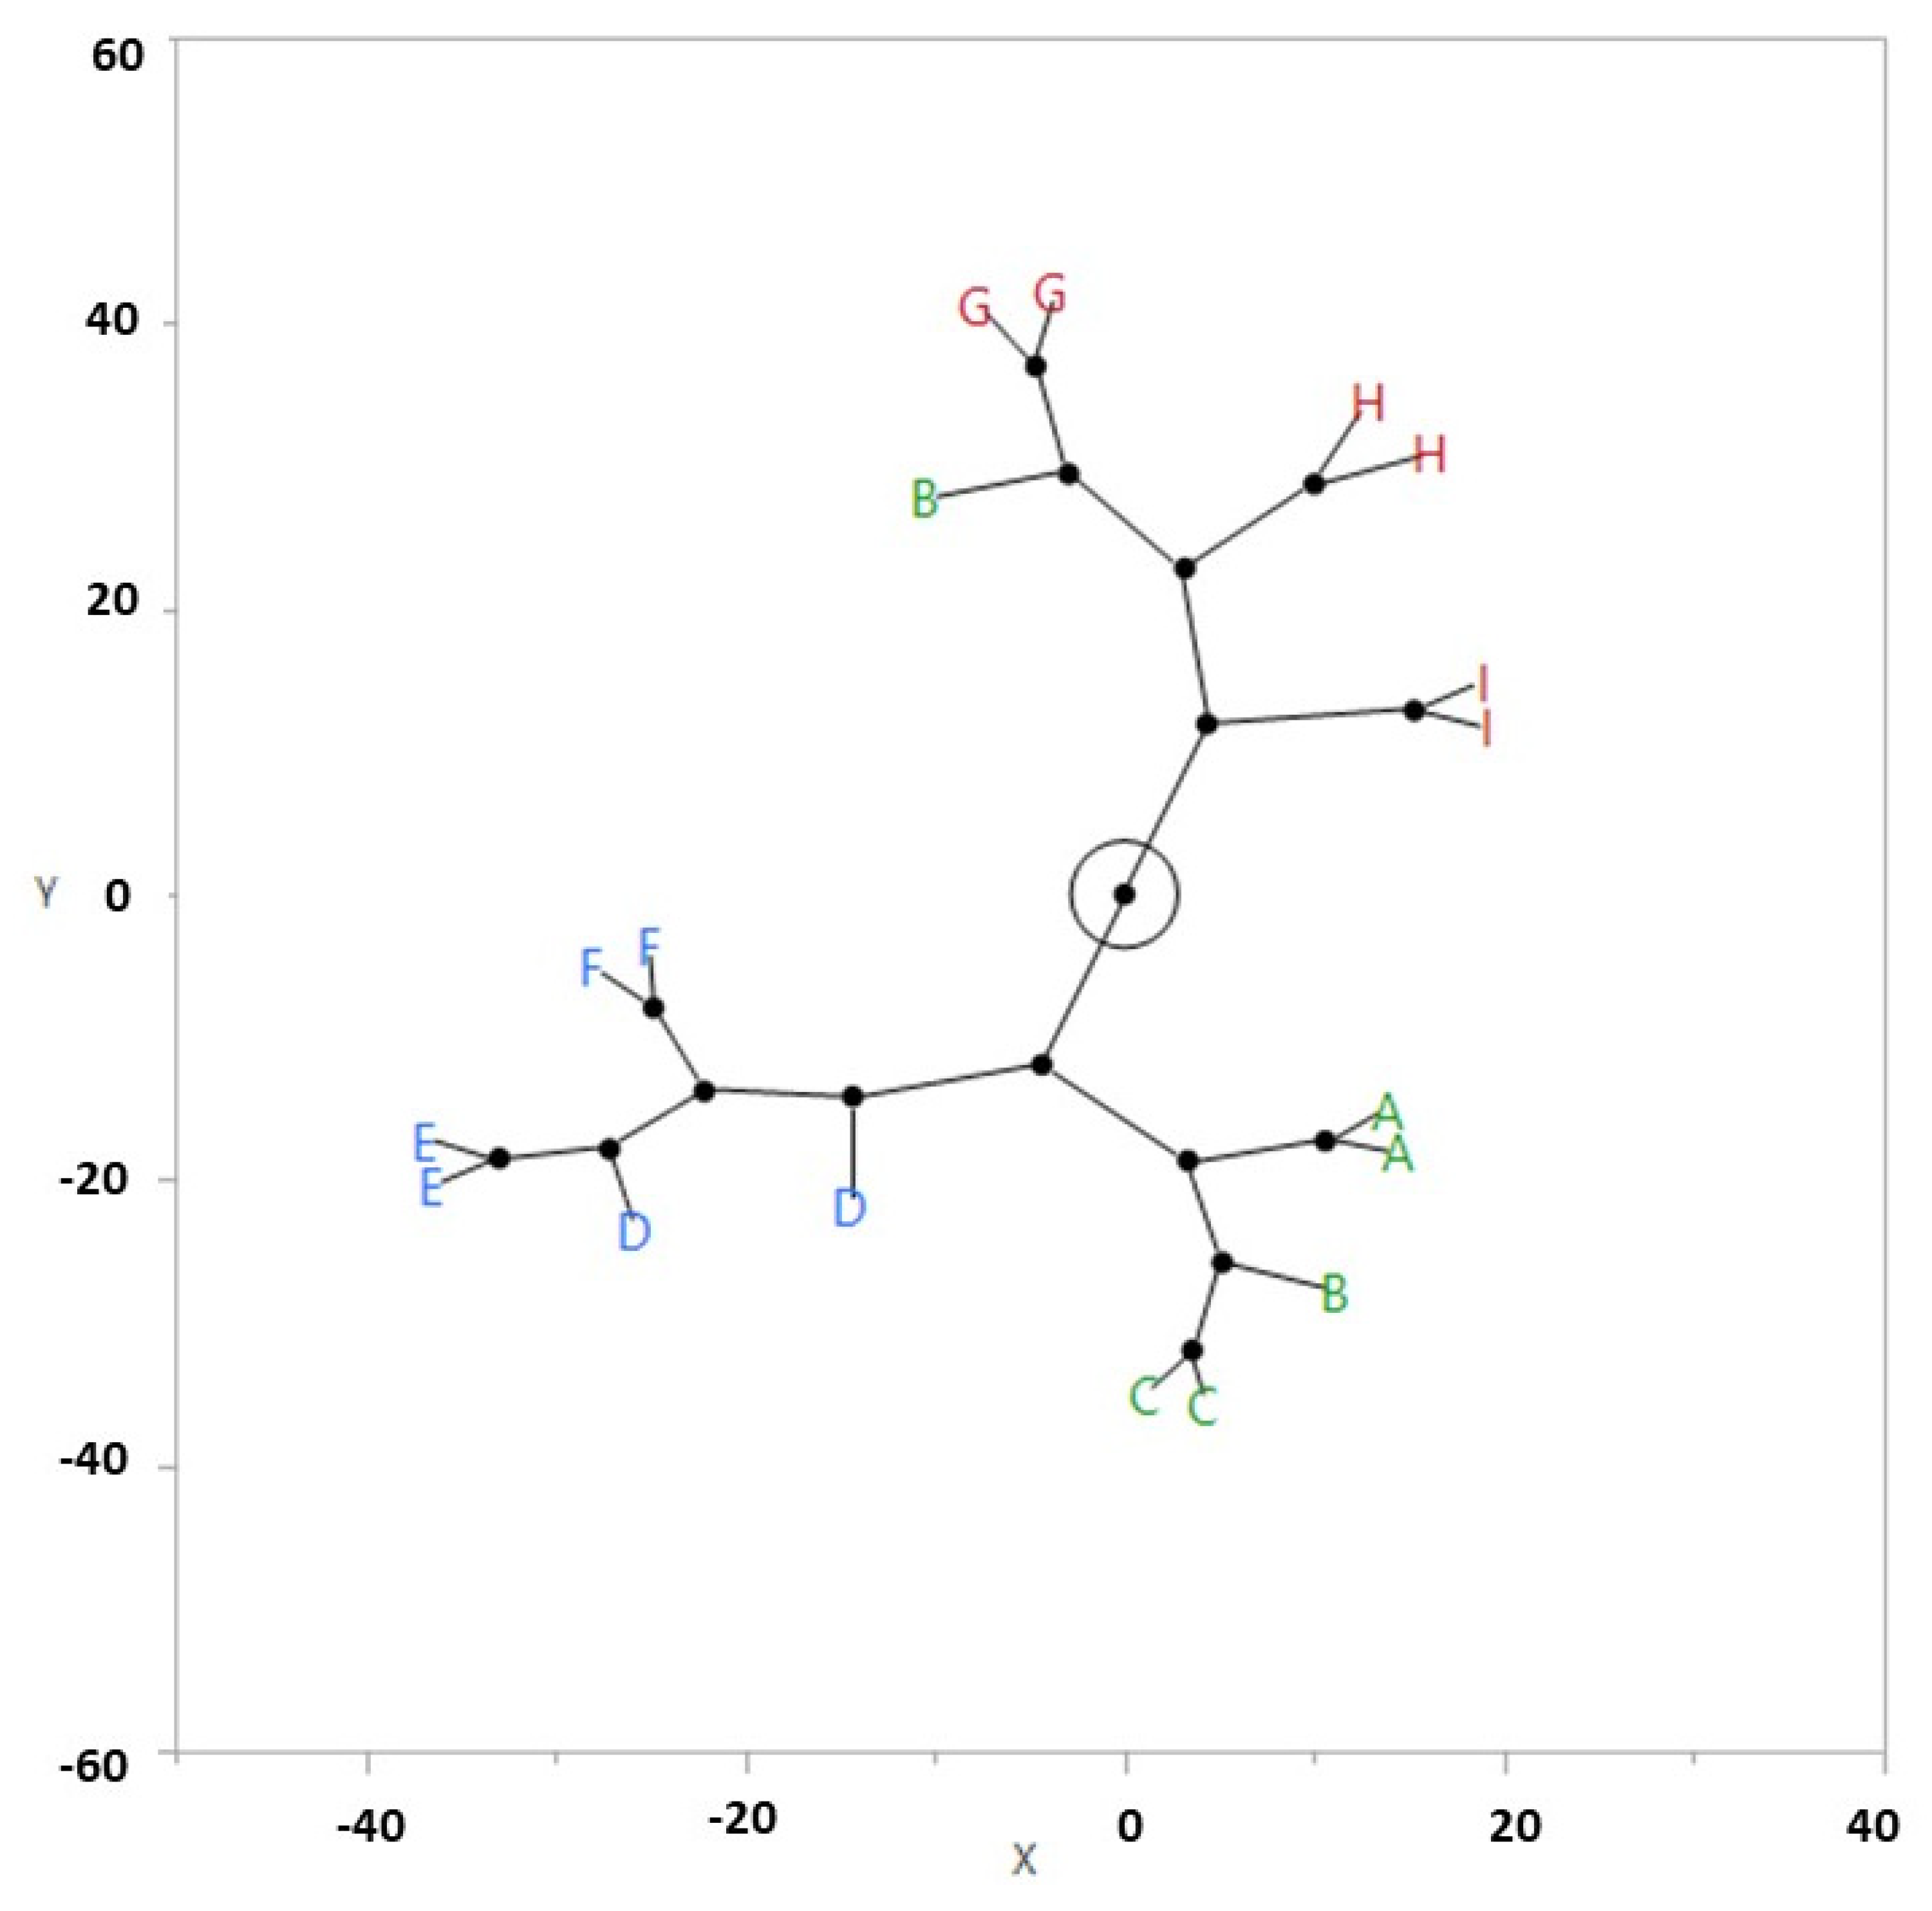
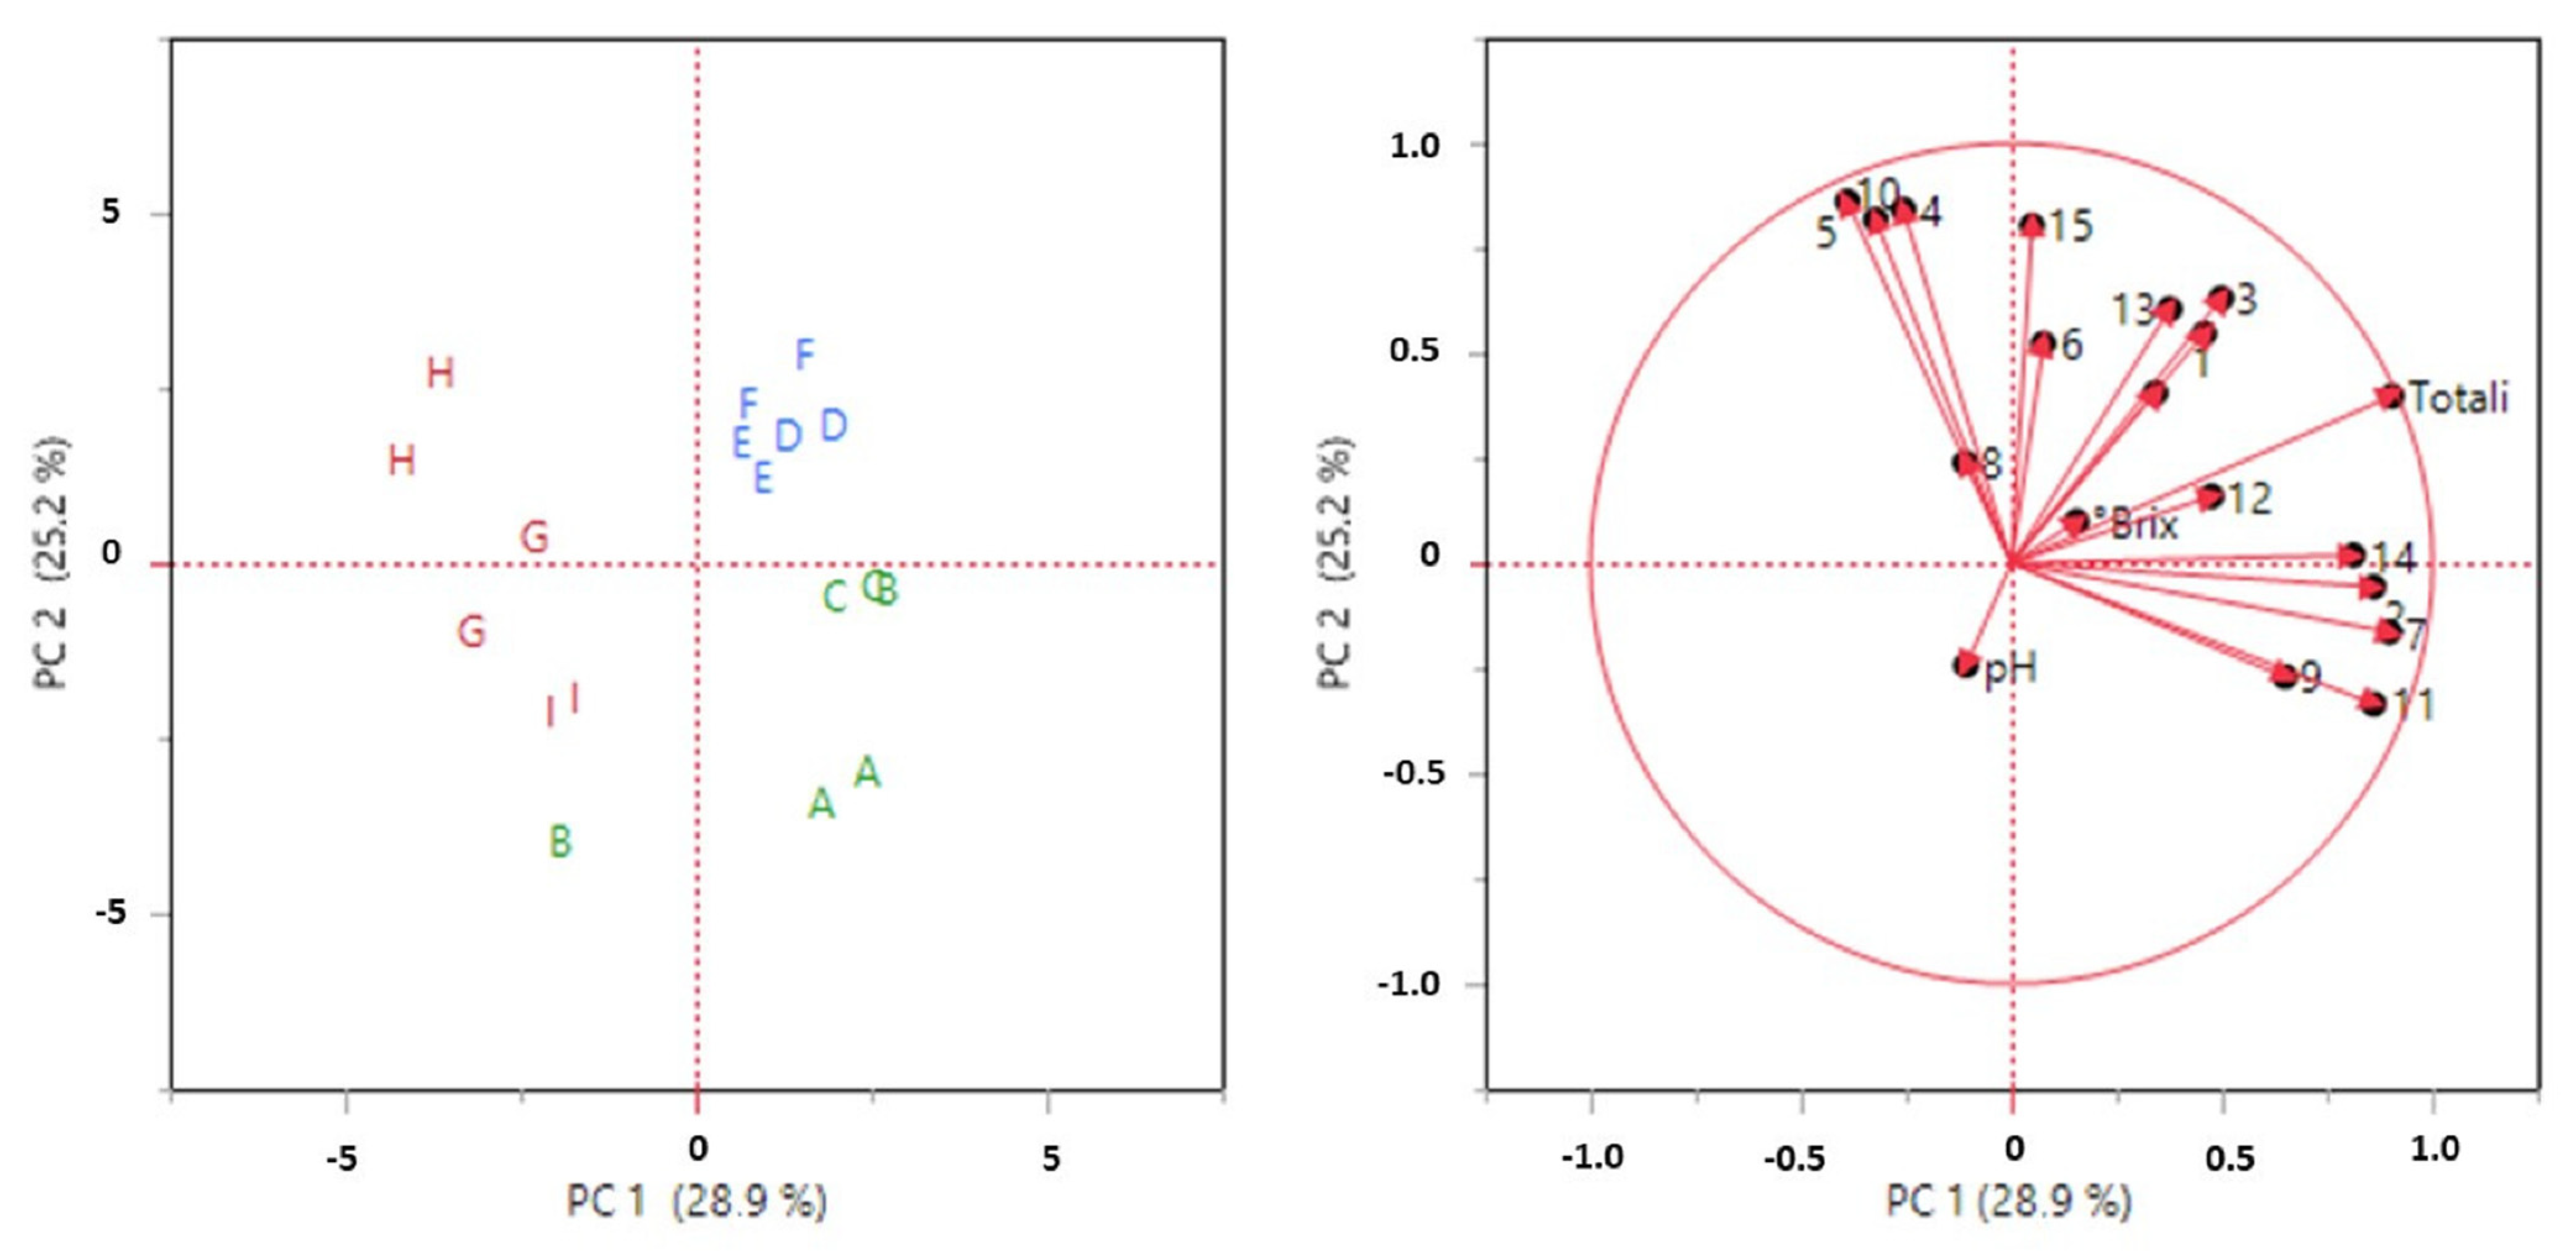
3.3. Chemometric Analysis

As previously reported, the physiochemical and chromatographic results showed some differentiations between the samples, however, they were not significant to reach an effective conclusion. Therefore, several chemometric tools were applied to the data matrix to improve the characterization and to highlight the possible categorizations. The first chemometric application was the Hierarchical Cluster Analysis (HCA). Figure 2 shows the resulting constellation diagram of the observed clusters. The samples appear to be classified into three main clusters which are distributed by their years of production. In fact, one cluster includes samples of the years 2011, 2013, and 2014, and the second one contains samples of the years 2015, 2016, and 2017, while the third one contains samples of the years 2019, 2020, and 2021. The only deviation was found for a sample that was produced in 2013 which differs from the composition trend of the other samples that were produced in the period of 2011–2014. This sample, in fact, showed a total content of polyphenols that was lower than that of the samples that were produced in a similar vintages, and it was included in the cluster of samples that were produced in the period of 2019–2021, which were characterized instead by a lower level of these compounds. The deviation of the 2013 sample which is highlighted by the HCA results could be related to inadequate storage conditions that influenced the polyphenol content.
The clustering analysis revealed that the dataset consisting of the physiochemical and polyphenol analysis results is suitable for a sample classification.
After the clustering analysis, a Principal Component Analysis (PCA) was performed to highlight the natural grouping of the samples. The autoscaling pre-treatment was performed on the dataset to exclude the variance that is related to the different units of measurement. The unsupervised PCA scores and loadings are plotted in Figure 3. The first two PCs explain 54.1% of the total variability. The PCA plots confirm the groupings that were noted earlier in the HCA. In fact, the samples from 2011 to 2014 are located in the lower right area, the samples from 2015 to 2017 are in the upper right area, while the samples from 2019 to 2021 are all in the left area of the score plot. Additionally, in this case, one sample belonging to the 2013 vintage was located in a different area from that of the 2011–2014 ones.
It can be noted that on PC1, it is possible to distinguish the 2019–2021 samples from the others, and the variable that most influenced this grouping were the compounds related to peaks 14, 2, and 7, while with PC2, it is possible to the separate the samples from 2011–2014 and from 2015–2017, and the compounds no. 15 and no. 6 affected this partition.
From the HCA and PCA, it was found that the samples could be grouped into three clusters without any supervision. The three highlighted clusters are characterized by the samples from the same production years, i.e., cluster 1: 2011–2014, cluster 2: 2015–2017, and cluster 3: 2019–2021. Based on these results, the mean and standard deviation of the physiochemical and polyphenol content were calculated according to the three clusters (Table 5).
An HSD Tukey test was performed to highlight the significant differences between the variables in the three clusters. It can be seen that the quantity of compound no. 2, which is attributable to a simple polyphenol, is significantly lower in the 2019–2021 samples than they it is in the 2011–2014 and 2015–2017 ones. The compounds that are related to the phenolic acids, i.e., compounds no. 4, no. 5, and no. 6, showed a significantly lower concentration in the samples from the period of 2011–2013. Compound no. 7 could be considered as a possible shelf-life marker; in fact, its concentration significantly decreases from cluster 1 (2011–2014) to cluster 3 (2019–2021).
As for the complex polyphenols, such as the flavonoids and stilbenes, only compound no. 15 showed a significantly higher content in the 2015–2017 samples. These compounds give the wine the typical red-brown colour, so their content in white wine is not relevant.
In general, there is also a significant decrease in the polyphenols content. Therefore, the total amount of polyphenols is significantly lower in the 2019–2021 samples.
Following an interview with the winery that supplied the samples, it emerged that in 2015, there was a change in the production process, i.e., during the bleaching phases, and together with bentonite, the use of active carbon was started. In 2019, however, bentonite was totally replaced by active carbon.
These changes in the production process took place precisely in the years that divided the clusters, 2015 and 2019, so the different polyphenol content could also be correlated to these variations.

4. Conclusions

This study aimed to perform a physiochemical (SSC and pH) and polyphenolic characterization of the Grillo wines that were produced by a selected winery in the years 2011–2021 using an optimized RP-HPLC-DAD method.
For the physiochemical parameters, the only statistically significant difference was found for the SSC between the 2013 and 2021 samples. The SSC content should be related to different climatic conditions, but it is not attributable to them in this case.
The polyphenolic fraction was evaluated by a semi-quantitative analysis using gallic acid (r.t. 2–5 min), p-hydroxybenzoic acid (r.t. 5–11 min), and ferulic acid (range 11–19 min) as the external reference standards. These standards were used to quantify the simple polyphenols, phenolic acids, or more complex polyphenols, and anthocyanins, anthocyanidins, and stilbenes, respectively. Due to the variability of the values that were obtained in the wine of the same cultivar but from subsequent vintages, different trends manifested in each single compound, and it was not possible to give a univocal interpretation of the results. To this end, a statistical processing was carried out after the preliminary evaluation.
The HCA and PCA highlighted the presence of three clusters of samples. One cluster includes the samples from the years 2011, 2013, and 2014, the second contains the samples from the years 2015, 2016, and 2017, while the third one the samples from 2019, 2020, and 2021. The means and standard deviation were recalculated based on this clustering, and the HSD Tukey test was applied to show the significant differences. It was possible to highlight how some compounds (no. 2, no. 4, no. 5, no. 6, no. 7, and no. 15) were makers of specific clusters and therefore, of specific vintages. Overall, the 2011–2014 and 2015–2017 vintages were richer in polyphenols (296.00 ± 46.10 mg/L and 333.00 ± 13.80 mg/L, respectively) when they were compared to the 2019–2021 ones (229.00 ± 15.90 mg/L).
This preliminary study showed that polyphenols are suitable markers that can be used to identify Grillo vintages. However, it is not possible to attribute the difference in the polyphenol content to a single event. This evidence, in fact, should be related to the real differences in the polyphenol content in the grapes or to the different opening times of the bottles.
Another variable to take into consideration, as indicated by the company, are the changes in the production process that took place in the years which divided the clusters, in 2015 and in 2019, so the different polyphenol content could also be correlated to these variations.

Author Contributions

Conceptualization, M.R., V.G. and M.B.M.; methodology M.R., V.G. and M.B.M.; software, M.R., V.G. and M.B.M.; validation, M.R., V.G. and M.B.M.; formal analysis, M.R., V.G. and M.B.M.; investigation, M.R., V.G. and M.B.M.; resources, M.R., V.G. and M.B.M.; data curation, M.R., V.G. and M.B.M.; writing—original draft preparation, M.R., V.G. and M.B.M.; writing—review and editing, M.R., V.G. and M.B.M.; visualization, M.R., V.G. and M.B.M.; supervision, M.R., V.G. and M.B.M.; project administration, M.R., V.G. and M.B.M.; funding acquisition, M.R., V.G. and M.B.M. All authors have read and agreed to the published version of the manuscript.

Funding

This research was funded by the Sapienza University of Rome, SEED PNR funds.

Acknowledgments

The authors warmly thank the company Cantina Cellaro S.C.A. for sample procurement and for sharing the information.

Conflicts of Interest

The authors declare no conflict of interest.

References

  1. Carrasco, D.; Zhou-Tsang, A.; Rodriguez-Izquierdo, A.; Ocete, R.; Revilla, M.A.; Arroyo-García, R. Coastal Wild Grapevine Accession (Vitis vinifera L. Ssp. Sylvestris) Shows Distinct Late and Early Transcriptome Changes under Salt Stress in Comparison to Commercial Rootstock Richter 110. Plants 2022, 11, 2688. [Google Scholar] [CrossRef] [PubMed]
  2. Alkan, A.; Abdullah, M.Ü.; Abdullah, H.O.; Assaf, M.; Zhou, H. A Smart Agricultural Application: Automated Detection of Diseases in Vine Leaves Using Hybrid Deep Learning. Turk. J. Agric. For. 2021, 45, 717–729. [Google Scholar] [CrossRef]
  3. Benjak, A.; Ercisli, S.; Vokurka, A.; Maletić, E.; Pejić, I. Erratum: Genetic Relationships among Grapevine Cultivars Native to Croatia, Greece and Turkey. Vitis J. Grapevine Res. 2005, 44, 73–77. [Google Scholar]
  4. Nesto, B.; di Savino, F. The World of Sicilian Wine; University of California Press: Berkeley, CA, USA, 2019. [Google Scholar]
  5. Tudisca, S.; di Trapani, A.M.; Donia, E.; Sgroi, F.; Testa, R. Entrepreneurial Strategies of Etna Wine Farms. Int. J. Entrep. Small Bus. 2014, 21, 155. [Google Scholar] [CrossRef]
  6. Bellia, C.; Pilato, M. Competitiveness of Wine Business within Green Economy: Sicilian Case. Qual—Access Success 2014, 15, 74–78. [Google Scholar]
  7. Lanfranchi, M.; Schimmenti, E.; Campolo, M.G.; Giannetto, C. The Willingness to Pay of Sicilian Consumers for a Wine Obtained with Sustainable Production Method: An Estimate through an Ordered Probit Sample-Selection Model. Wine Econ. Policy 2019, 8, 203–215. [Google Scholar] [CrossRef]
  8. Crescimanno, M.; Ficani, G.B.; Guccione, G. The Production and Marketing of Organic Wine in Sicily. Br. Food J. 2002, 104, 274–286. [Google Scholar] [CrossRef]
  9. Borsellino, V.; Varia, F.; Zinnanti, C.; Schimmenti, E. The Sicilian Cooperative System of Wine Production: The Strategic Choices and Performance Analyses of a Case Study. Int. J. Wine Bus. Res. 2020, 32, 391–421. [Google Scholar] [CrossRef]
  10. Fracassetti, D.; Stuknytė, M.; la Rosa, C.; Gabrielli, M.; de Noni, I.; Tirelli, A. Thiol Precursors in Catarratto Bianco Comune and Grillo Grapes and Effect of Clarification Conditions on the Release of Varietal Thiols in Wine. Aust. J. Grape Wine Res. 2018, 24, 125–133. [Google Scholar] [CrossRef]
  11. Corona, O.; Bambina, P.; de Filippi, D.; Cinquanta, L. Influence of Pre-Fermentative Addition of Aqueous Solution Tannins Extracted from Oak Wood (Quercus petraea) on the Composition of Grillo Wines. Eur. Food Res. Technol. 2021, 247, 1595–1608. [Google Scholar] [CrossRef]
  12. Nerva, L.; Moffa, L.; Giudice, G.; Giorgianni, A.; Tomasi, D.; Chitarra, W. Microscale Analysis of Soil Characteristics and Microbiomes Reveals Potential Impacts on Plants and Fruit: Vineyard as a Model Case Study. Plant Soil 2021, 462, 525–541. [Google Scholar] [CrossRef]
  13. Alfonzo, A.; Francesca, N.; Mercurio, V.; Prestianni, R.; Settanni, L.; Spanò, G.; Naselli, V.; Moschetti, G. Use of Grape Racemes from Grillo Cultivar to Increase the Acidity Level of Sparkling Base Wines Produced with Different Saccharomyces Cerevisiae Strains. Yeast 2020, 37, 475–486. [Google Scholar] [CrossRef]
  14. Arena, E.; Rizzo, V.; Licciardello, F.; Fallico, B.; Muratore, G. Effects of Light Exposure, Bottle Colour and Storage Temperature on the Quality of Malvasia Delle Lipari Sweet Wine. Foods 2021, 10, 1881. [Google Scholar] [CrossRef]
  15. Díaz-Maroto, M.C.; Viñas, M.L.; Marchante, L.; Alañón, M.E.; Díaz-Maroto, I.J.; Pérez-Coello, M.S. Evaluation of the Storage Conditions and Type of Cork Stopper on the Quality of Bottled White Wines. Molecules 2021, 26, 232. [Google Scholar] [CrossRef]
  16. Castellanos, E.R.; Jofre, V.P.; Fanzone, M.L.; Assof, M.V.; Catania, A.A.; Diaz-Sambueza, A.M.; Heredia, F.J.; Mercado, L.A. Effect of Different Closure Types and Storage Temperatures on the Color and Sensory Characteristics Development of Argentinian Torrontes Riojano White Wines Aged in Bottles. Food Control 2021, 130, 108343. [Google Scholar] [CrossRef]
  17. Rouxinol, M.I.; Martins, M.R.; Murta, G.C.; Barroso, J.M.; Rato, A.E. Quality Assessment of Red Wine Grapes through NIR Spectroscopy. Agronomy 2022, 12, 637. [Google Scholar] [CrossRef]
  18. Benelli, A.; Cevoli, C.; Ragni, L.; Fabbri, A. In-Field and Non-Destructive Monitoring of Grapes Maturity by Hyperspectral Imaging. Biosyst. Eng. 2021, 207, 59–67. [Google Scholar] [CrossRef]
  19. Zhang, X.; Zhang, T.G.; Mu, W.S.; Fu, Z.T.; Zhang, X.S. Prediction of Soluble Solids Content for Wine Grapes During Maturing Based on Visible and Near-Infrared Spectroscopy. Guang Pu Xue Yu Guang Pu Fen Xi Spectrosc. Spectr. Anal. 2021, 41, 229–235. [Google Scholar] [CrossRef]
  20. Ye, M.; Yue, T.; Yuan, Y.; Li, Z. Application of FT-NIR Spectroscopy to Apple Wine for Rapid Simultaneous Determination of Soluble Solids Content, PH, Total Acidity, and Total Ester Content. Food Bioproc. Tech. 2014, 7, 3055–3062. [Google Scholar] [CrossRef]
  21. Rapa, M.; Ciano, S.; Gobbi, L.; Ruggieri, R.; Vinci, G. Quality and Safety Evaluation of New Tomato Cultivars. Ital. J. Food Sci. 2021, 33, 35–45. [Google Scholar] [CrossRef]
  22. Buiarelli, F.; Bernardini, F.; di Filippo, P.; Riccardi, C.; Pomata, D.; Simonetti, G.; Risoluti, R. Extraction, Purification, and Determination by HPLC of Quercetin in Some Italian Wines. Food Anal. Methods 2018, 11, 3558–3562. [Google Scholar] [CrossRef]
  23. Porgali, E.; Büyüktuncel, E. Determination of Phenolic Composition and Antioxidant Capacity of Native Red Wines by High Performance Liquid Chromatography and Spectrophotometric Methods. Food Res. Int. 2012, 45, 145–154. [Google Scholar] [CrossRef]
  24. Kharadze, M.; Japaridze, I.; Kalandia, A.; Vanidze, M. Anthocyanins and Antioxidant Activity of Red Wines Made from Endemic Grape Varieties. Ann. Agrar. Sci. 2018, 16, 181–184. [Google Scholar] [CrossRef]
  25. Tuberoso, C.I.G.; Serreli, G.; Congiu, F.; Montoro, P.; Fenu, M.A. Characterization, Phenolic Profile, Nitrogen Compounds and Antioxidant Activity of Carignano Wines. J. Food Compos. Anal. 2017, 58, 60–68. [Google Scholar] [CrossRef]
  26. Ragusa, A.; Centonze, C.; Grasso, M.E.; Latronico, M.F.; Mastrangelo, P.F.; Sparascio, F.; Maffia, M. HPLC Analysis of Phenols in Negroamaro and Primitivo Red Wines from Salento. Foods 2019, 8, 45. [Google Scholar] [CrossRef] [Green Version]
  27. Bai, S.; Cui, C.; Liu, J.; Li, P.; Li, Q.; Bi, K. Quantification of Polyphenol Composition and Multiple Statistical Analyses of Biological Activity in Portuguese Red Wines. Eur. Food Res. Technol. 2018, 244, 2007–2017. [Google Scholar] [CrossRef]
  28. Pajović Šćepanović, R.; Wendelin, S.; Raičević, D.; Eder, R. Characterization of the Phenolic Profile of Commercial Montenegrin Red and White Wines. Eur. Food Res. Technol. 2019, 245, 2233–2245. [Google Scholar] [CrossRef]
  29. Zietsman, A.J.J.; Moore, J.P.; Fangel, J.U.; Willats, W.G.T.; Trygg, J.; Vivier, M.A. Following the Compositional Changes of Fresh Grape Skin Cell Walls during the Fermentation Process in the Presence and Absence of Maceration Enzymes. J. Agric. Food Chem. 2015, 63, 2798–2810. [Google Scholar] [CrossRef]
Figure 1. Chromatographic profiles of Grillo—2011 (blue), 2016 (red), and 2021 (green) wine samples.
Agriculture 12 01888 g001
Figure 2. Constellation diagram from HCA on physiochemical and chromatographic results. Green: 2011–2014, Blue: 2015–2017, Red: 2019–2021. A: 2011, B: 2013, C: 2014, D: 2015, E: 2016, F: 2017, G: 2019, H: 2020, I: 2021.
Agriculture 12 01888 g002
Figure 3. Score and loading plots by PCA on physiochemical and chromatographic results. Green: 2011–2014, Blue: 2015–2017, Red: 2019–2021. A: 2011, B: 2013, C: 2014, D: 2015, E: 2016, F: 2017, G: 2019, H: 2020, I: 2021.
Agriculture 12 01888 g003
Table 1. Sample details declared by the production company.
Production YearAlcohol ContentPrice
201112.5% vol7.70 EUR
201313% vol10.00 EUR
201413% vol9.90 EUR
201513% vol7.20 EUR
201613% vol10.20 EUR
201712% vol7.90 EUR
201912.5% vol6.80 EUR
202013% vol7.20 EUR
202112.5% vol9.95 EUR
Table 2. SSC and pH values for Grillo wine samples in the period of 2011–2021.
Sample
Vintage
SSC (°Brix)pH
20116.8 ± 0.1 a,b3.36 ± 0.3 a
20137.0 ± 0.3 a3.27 ± 0.1 a,b
20146.8 ± 0.1 a,b3.15 ± 0.1 d
20157.1 ± 0.1 a3.16 ± 0.3 c,d
20166.8 ± 0.3 a,b3.21 ± 0.1 b,c,d
20176.4 ± 0.1 a,b3.22 ± 0.3 b,c
20196.8 ± 0.3 a,b3.17 ± 0.1 c,d
20206.9 ± 0.1 a,b3.19 ± 0.3 b,c,d
20216.2 ± 0.1 b3.15 ± 0.1 c,d
a, b, c, d Results not linked by the same superscript letter are statistically different from the HSD Tukey test.
Table 3. Climatic conditions in Sambuca di Sicilia, expressed as an average in the years 2013 and 2021, as provided by the producer.
Parameters20132021
Minimum temperature15.9 °C15.8 °C
Medium temperature19.3 °C19.4 °C
Maximum temperature22.2 °C22.6 °C
Rainy days a year133121
Relative humidity77.0%77.3%
Table 4. Semi-quantitative results of the chromatographic analysis of Grillo wines, expressed as mgGAE/L (peaks 1–7), mgPAE/Kg (peaks 8–14), and mgFAE/Kg (peaks 15–16).
No. Peak 201120132014201520162017201920202021
125.30 ± 1.2723.60 ± 8.6331.25 ± 0.4930.00 ± 1.4125.90 ± 0.7129.90 ± 0.7119.45 ± 0.0729.55 ± 1.9126.50 ± 0.28
272.25 ± 1.9168.7 0± 21.4072.50 ± 0.1479.35 ± 3.7562.10 ± 0.9957.85 ± 4.3148.60 ± 0.0118.49 ± 22.225.20 ± 0.14
311.50 ± 0.7110.87 ± 2.8616.35 ± 0.6413.25 ± 0.4912.20 ± 0.0115.90 ± 0.4211.30 ± 1.7013.05 ± 0.789.36 ± 0.01
410.39 ± 0.5710.60 ± 3.5313.15 ± 0.3531.70 ± 1.4120.55 ± 0.3526.75 ± 0.0726.15 ± 0.2127.45 ± 2.0514.30 ± 0.14
53.32 ± 0.404.98 ± 1.755.61 ± 0.057.03 ± 0.356.89 ± 0.208.38 ± 0.538.00 ± 1.678.71 ± 0.536.02 ± 0.04
67.92 ± 0.036.77 ± 2.6511.70 ± 0.4214.90 ± 0.4218.55 ± 0.07121.30 ± 0.9913.25 ± 1.069.62 ± 0.1118.80 ± 1.27
741.55 ± 1.6335.50 ± 10.9040.80 ± 0.7129.40 ± 2.6927.35 ± 0.7826.40 ± 0.9913.00 ± 1.701.58 ± 0.490.23 ± 0.01
89.46 ± 0.497.71 ± 2.2512.80 ± 0.4212.05 ± 0.6415.85 ± 0.0716.90 ± 0.2814.25 ± 1.6310.52 ± 0.9520.65 ± 0.07
928.20 ± 1.1316.75 ± 5.1627.15 ± 0.4927.25 ± 1.0620.80 ± 0.1423.10 ± 1.1312.95 ± 3.187.10 ± 0.2532.55 ± 0.35
1010.11 ± 0.2614.20 ± 5.3716.50 ± 0.5719.60 ± 0.9926.70 ± 4.1026.25 ± 1.0620.00 ± 5.9439.80 ± 3.397.84 ± 0.27
1118.80 ± 0.7115.50 ± 4.5315.55 ± 0.4913.85 ± 1.0614.40 ± 0.7113.85 ± 0.7811.10 ± 0.9910.60 ± 0.0112.85 ± 0.07
1220.25 ± 0.9211.52 ± 3.3717.85 ± 0.6418.30 ± 0.2819.65 ± 0.2120.35 ± 1.7711.92 ± 3.3712.78 ± 14.9018.70 ± 3.96
1310.85 ± 0.2114.60 ± 4.3815.80 ± 0.8516.30 ± 0.7118.85 ± 0.2117.00 ± 0.578.56 ± 0.9015.40 ± 2.1215.00 ± 0.01
1426.3 0 ± 0.9921.10 ± 6.3624.10 ± 1.2724.75 ± 1.0625.45 ± 0.2129.30 ± 1.7021.40 ± 6.517.50 ± 0.1720.10 ± 0.28
151.34 ± 0.061.10 ± 0.381.22 ± 0.172.38 ± 0.082.36 ± 0.322.18 ± 0.362.05 ± 0.092.04 ± 0.100.57 ± 0.01
161.07 ± 0.062.53 ± 0.841.41 ± 0.131.80 ± 0.081.81 ± 0.051.66 ± 0.160.99 ± 0.021.76 ± 0.010.14 ± 0.02
Total298.63 ± 10.80266.05 ± 84.30323.74 ± 5.66341.91 ± 16.50319.42 ± 1.26337.08 ± 11.00242.97 ± 22.30215.97 ± 2.35228.81 ± 6.21
Table 5. Mean and standard deviation of the physiochemical and polyphenol content according to the three clusters, expressed as mgGAE/L (peak 1–7), mgPAE/L (peak 8–14), and mgFAE/L (peak 15–16).
Variables2011–20142015–20172019–2021
Peak 126.70 ± 5.31 a28.60 ± 2.23 a25.20 ± 4.71 a
Peak 271.20 ± 9.78 a66.40 ± 10.5 a30.80 ± 17.30 b
Peak 312.90 ± 3.00 a13.80 ± 1.73 a11.20 ± 1.85 a
Peak 411.40 ± 2.11 b26.30 ± 5.04 a22.60 ± 6.55 a
Peak 54.64 ± 1.33 b7.44 ± 0.80 a7.58 ± 1.47 a
Peak 68.80 ± 2.60 b18.30 ± 2.91 a13.90 ± 4.20 a
Peak 739.30 ± 5.75 a27.70 ± 1.91 b4.94 ± 6.32 c
Peak 89.99 ± 2.54 a14.90 ± 2.30 a,b15.10 ± 4.66 b
Peak 924.00 ± 6.14 a23.70 ± 3.01 a17.50 ± 12.00 a
Peak 1013.60 ± 3.77 a24.20 ± 4.05 a22.50 ± 14.70 a
Peak 1116.60 ± 2.67 a14.00 ± 0.726 a,b11.50 ± 1.15 b
Peak 1216.50 ± 4.33 a19.40 ± 1.23 a14.50 ± 7.78 a
Peak 1313.80 ± 3.05 a,b17.40 ± 1.25 a13.00 ± 3.59 b
Peak 1423.80 ± 3.75 a,b26.50 ± 2.37 a16.30 ± 7.46 b
Peak 151.22 ± 0.219 b2.31 ± 0.24 a1.55 ± 0.77 b
Peak 161.67 ± 0.783 a1.76 ± 0.11 a0.96 ± 0.72 a
Total296.00 ± 46.10 a333.00 ± 13.80 a229.00 ± 15.90 b
SSC (°Brix)6.87 ± 0.10 a6.77 ± 0.31 a6.63 ± 0.33 a
pH3.26 ± 0.09 a2.70 ± 1.24 a3.17 ± 0.01 a
a, b, c Values in the same row not linked by the same superscript letters are significantly different from the HSD Tukey test.
Publisher’s Note: MDPI stays neutral with regard to jurisdictional claims in published maps and institutional affiliations.

