Abstract
Critical levels (CL) of available potassium (K) in soils and leaves and maximum technical efficiency (MTE) doses are relevant information to define the best K fertilization strategies. The aim of this study was to determine reference values of K in leaves and soil, using Bayesian analysis, in order to maximize grape yield and must quality of ‘Chardonnay’ and ‘Pinot Noir’ grown in a subtropical climate. The vines were subjected to applications of 0, 20, 40, 60 and 80 kg K2O ha−1 year−1. The CL and MTE doses of K, in leaves and soils, were determined using Bayesian hierarchical models. The range of probability of the occurrence of CL in leaves was 15.8 to 18.9 g K kg−1 in ‘Chardonnay’ and 16.8 to 19.1 g K kg−1 in ‘Pinot Noir’ at flowering. Moreover, the range was 15.3 to 18.1 g K kg−1 in ‘Chardonnay’ and 16.1 to 18.2 g K kg−1 in ‘Pinot Noir’ at veraison. In the soil, the CL of available K for ‘Chardonnay’ was 27.4 mg K kg−1 and for ‘Pinot Noir’ it was 23.2 mg K kg−1. The increase of K in leaves and soil increased the TSS, while the TTA decreased in both cultivars after sufficiency rate. The MTE was estimated in ‘Pinot Noir’. The proposition of CL and/or MTE doses of K can help increase the efficiency of K fertilization in vineyards.
1. Introduction
Weathering of soil minerals has supported the nutrition of plants for many centuries worldwide, particularly through the release of potassium (K) [1]. However, weathering of primary minerals is not a permanent, endless source for crops, and it may limit long-term soil fertility in some production systems with a restricted input of K [1]. As a result of this, vineyard soils around the world often suffer from K deficiency. Thus, K fertilization is necessary. K is one of the important essential elements for vine growth and yield [2] and can therefore influence vine development and grape quality because it plays numerous roles in the physiological processes in plants [3,4,5]. Furthermore, being involved in the sugar transport to the fruits [6] and the excess K+ during ripening of the grape due to the increase of K+ in the berries leads to a decrease in the must acidity at harvest [7,8]. The excess K+ in the berries and, consequently, in the must, reduces the sugar levels, thus impairing the must fermentation [9].
The K rate to apply in vineyards can be defined taking into consideration soil available K content and values of cation exchange capacity (CECpH7.0), since it is assumed that the higher the soil CECpH7.0, the greater the K adsorption [10,11]. Soil K availability should be combined with plant nutritional status and need in order to establish the correct fertilization schedule for each cultivar. Furthermore, it must be considered that each vine cultivar may have different mechanisms of nutrient acquisition, such as: (1) pH value modification and exudation of organic acids in the rhizosphere, which can increase the solubility of K [12,13]; (2) morphological parameters of the root system, which determine, for example, the volume of soil explored, which is associated with the mechanisms of nutrient supply (root interception, mass flow and diffusion) [14,15,16] parameters related to nutrient absorption efficiency, such as maximum absorption speed (Vmax), minimum concentration (Cmin) and Michaelis–Menten constant (Km); (3) vegetative and productive characteristics [17]. All of these factors can interfere with the acquisition, absorption, accumulation and redistribution of K on grapevines.
Soil analyses are commonly used to assess soil fertility status in vineyards. Leaf analysis is often used as an effective approach to evaluate grapevine nutrient status [18,19]. When critical levels (CL) are above the optimal threshold, the probability of response to fertilization is low. When obtaining adequate K doses, maximum technical efficiency (MTE) of K doses can be achieved in different soils and environments cultivated with vines, which are still little known, especially in sandy soils. These variables can be obtained through Bayesian analysis. Bayesian analysis differs from the usual frequentist approach (e.g., use of p values or confidence intervals). Rather than focusing on the probability of different patterns in outcomes assuming specific treatment effects, Bayesian analysis relies on the use of prior information in combination with data from a study to calculate the probabilities of a treatment effect [20]. The standard statistical approach for describing processes with multiple components of variation uses mixed models of fixed and random effects. The fixed effects are quantities about which inference is to be made directly, whereas the random effects are quantities sampled from a population about which inference is desired. Typically, the variance components of the process represent the variances of these populations [21]. A Bayesian hierarchical model provides estimates of treatment effects at each level of the hierarchy, based on all the data included in the model. Because of the inclusion of a greater amount of information, these estimates are generally more accurate than if analyses were conducted on subgroups separately, thus increasing the power of statistical comparisons [20].
The establishment of correct K application doses trough the identification of CL values in leaves and soil and MTE doses of K could help farmers to rationalize the use of K fertilizers in vineyards, reducing the cost of the inputs and possibly increasing of grape yield and must quality [22,23,24,25,26]. Additionally, establishment of CL and/or MTE doses of K could help to reduce the K losses in vineyards, especially by surface runoff [27,28]. This can also potentiate surface water contamination [29]. Thus, it is possible to carry out a more sustainable viticulture.
Based on this, from a database of variables obtained in three crop seasons, with the effect of applying K fertilization in the vineyard since 2011, it is possible to propose K reference values for red and white cultivars, through Bayesian hierarchical models in relation to variables of grape yield and must quality. The aim of this study was to determine reference values of K in leaves and soil through Bayesian analysis in order to maximize productivity and must quality of ‘Chardonnay’ and ‘Pinot Noir’ vines grown in a subtropical climate.
2. Materials and Methods
2.1. Experimental Layout and Treatments
The study was carried out from 2016 to 2019 in Santana do Livramento (Latitude 30° 48′31″ S; Longitude 55°22′33″ W, with 208 m altitude) region of Campanha Gaúcha in the state of Rio Grande do Sul (RS), South Brazil. The soil is classified as Typic Hapludalf [30] and the region’s climate is classified as humid subtropical, type Cfa, according to the classification by Alvares et al. [31]. The average annual temperature is 18.4 °C and the average annual precipitation is 1467 mm, as shown in Figure 1. The trial was conducted on ‘Chardonnay’ (white) and ‘Pinot Noir’ (red) cultivars grafted on Paulsen 1103 rootstock. Vines, trained with a spreader system, were planted in 2011 at a distance of 1.0 m along the row and 2.5 m between the row (4000 vines ha−1). Both cultivars were subjected to K fertilization at a rate of 0, 20, 40, 60 and 80 kg K2O ha−1 year−1 (0, 16.6, 33.2, 49.8 and 66.4 kg K ha−1 year −1) supplied as KCl (60% K2O); the fertilizer was applied manually on the soil surface, in 0.5 m wide bands on the planting line (projection of the canopy of the vines), without incorporation. The experimental design was randomized blocks, with three replications, with each plot consisting of ten plants and only the eight central plants were used for data collection.
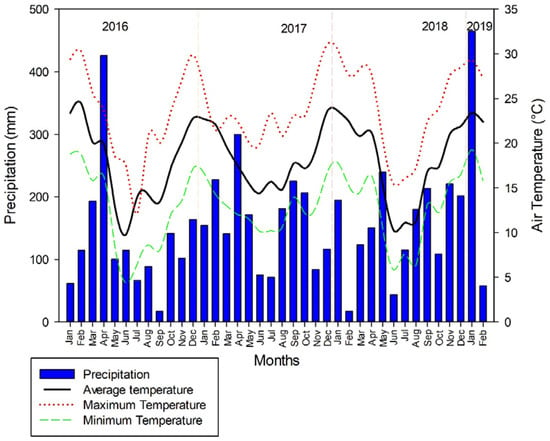
Figure 1.
Precipitation and average, minimum and maximum temperatures during the experiment (2016, 2017, 2018 and 2019), in Santana do Livramento, Rio Grande do Sul State, Brazil. Vertical dashed red lines separate the years of study evaluation.
2.2. Leaf Collection and K Analysis
In each vegetative season (2016/17, 2017/18 and 2018/19) leaves were collected, in the middle third of one-year-shoot, opposite the cluster, at flowering and veraison. The leaves were then dried in an oven with forced air circulation at 65 °C, until they were a constant weight, and they were ground at 2 mm (Willey mill, Marconi, MA048, São Paulo, Brazil). The samples were then subjected to a nitroperchloric acid digestion method [32], as follows: the samples (0.25 g) were transferred to 50 mL glass digestion tubes and treated with 4 mL of acid solution (HNO3:HClO4–3:1 v/v). Using a heating block digestion system, the samples were digested in three steps: (i) heating at 80 °C for 60 min (release of N oxides); (ii) heating at 120 °C for 30 min (moisture release); and (iii) heating at 180 °C until approximately 1 mL of the extract was left in the tubes. After digestion, the samples were cooled under laboratory conditions to room temperature (22 °C). After cooling, the samples were diluted with distilled water (extraction dilution). The total K was determined using a flame photometer (Digimed, BM-62, São Paulo, Brazil).
2.3. Grape Yield and Sampling
At harvest (January 2017, 2018, and 2019), clusters were counted and weighed using a digital scale (Walmur, Wa4434, Porto Alegre, Brazil) to determine grape yield. One-hundred berries from the upper, middle and lower thirds of the clusters were collected, weighted and used for chemical analysis.
2.4. Must Chemical Analysis
The collected berries were manually peeled, the pulp and seeds (must) were separated from the peel. Must total soluble solids (TSS) was determined with a digital refractometer (Reichert Technologies, Brix/RI-Chek, New York, NY, USA). Must pH was measured with a digital bench pH meter with automatic temperature control (Digimed, DM-22, São Paulo, Brazil). Total titratable acidity (TTA) was determined by titrating the must with NaOH 0.1N, and phenolphthalein (1%) as an indicator.
2.5. Soil Collection and K Analysis
After harvesting of the clusters (2016/17, 2017/18 and 2018/19 crop seasons), soil samples were collected at 0–10 cm and 0–20 cm of depth in the projection of the canopies using an auger. The available K was extracted by a double acid Mehlich-1 solution (HCl 0.05 mol L−1 + H2SO4 0.0125 mol L−1) [33] and K was determined using a flame photometer (Digimed, BM-62, São Paulo, Brazil).
2.6. Statistical Analysis
The “varComp” package [34] of the R statistical environment [35] was employed to carry out the variance of components analysis to measure the contribution of each variation source in the study (treatment—K dose, crop seasons, grapevine cultivars, interactions, and residues) to the total variation in the response variables. The mixed model was adjusted to test treatment significance (fixed and random effects) by taking into consideration the K doses, grape cultivars, and the interaction among them as fixed effect blocks and crop seasons were considered random effects. The K dose effect on the response variables was assessed through regression analysis.
Mathematical models were explored to find the best method able to describe the response variables of the grapevine to the K doses and K concentration in the leaves (collected during flowering and veraison), the grape yield and variables related to must chemical composition (TSS and TTA), obtained in regression analyzes.
To determine the K critical levels in the leaves and in the soil, Bayesian analysis of the data was performed using the Monte Carlo algorithm via Markov chains (MCMC) [36], generating a sequence of 20,000 samples, after the heating period (burn-in), according to normal distribution, for the posterior distribution of the K concentration. After this procedure, the density of frequency analysis for these variables was elaborated, assuming a 90% confidence interval for the determination of the boundary rates (lower and higher) and higher density.
In addition, a principal component analysis (PCA) was performed, combining all the response variables that were evaluated during the experiment using the FactoExtra package [37] of R software (version RStudio v1.3.959-1) [35]. PCA is performed according to a set of main components (PC1 and PC2), which are composed of a set of standardized, orthogonal linear combinations, which together explain the variance of the original data.
3. Results
3.1. Components of Variance
The analysis of the components of variance (Figure 2) evidenced that the crop season influenced most of the response variables, for example, a higher effect observed on the K concentration in the leaves (flowering and veraison), grape yield and must chemical variables (pH, TSS and TTA). The treatment (K application rate) affected the K concentration in the leaves by approximately 5% and the soil K concentration by 20%. In addition, the K doses were responsible for 10% of the variance in the grape yield and number of clusters. The cultivar explained, approximately 20% of the variation in the weight of 100 berries and 10% of the variation in the number of clusters and soil K. Furthermore, interaction (cultivar x treatment x crop season) explained 25% of the variation in the weight of 100 berries and approximately 10% of the variation in the grape yield and number of clusters.
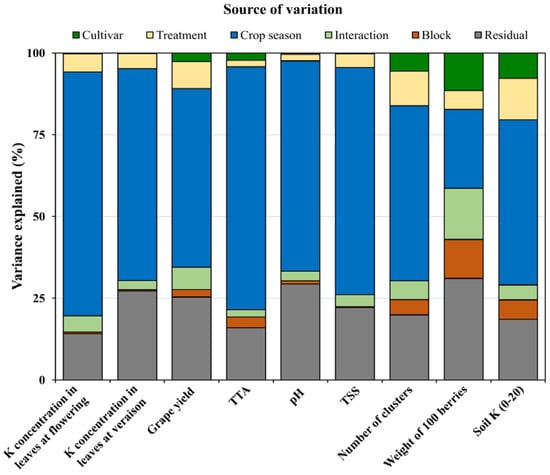
Figure 2.
Visual representation of variance components. The colors represent the source of variation (cultivar, K doses, crop season, interaction, block and residual). Response variables (plant tissue, grape yield, and must composition) are shown on the X-axis. The proportion explained by each source of variation for each response variable is observed on the Y-axis (percentage). Interaction = cultivar x treatment x crop season. TTA = Total Titratable Acidity; TSS = Total Soluble Solids.
3.2. K Critical Levels in Leaves
The CL of K in leaves at flowering in the cultivars ‘Chardonnay’ and ‘Pinot Noir’ were 17.4 g K kg−1 (Figure 3a) and 18.0 g K kg−1 (Figure 3b), respectively. The range of probability of occurrence of the CL for the K concentration in the leaves at flowering, based on the density of frequency of the value distributions, varied from 15.8 to 18.9 g K kg−1 for ‘Chardonnay’ and from 16.8 to 19.1 g K kg−1 for ‘Pinot Noir’ (Figure 3c). The range of distribution between critical differences in the K concentration between the cultivars varied from −6.19 to 6.26 g kg−1, and it was not different (it reached the dashed black line referring to the zero; Figure 3d). In the leaves collected at veraison, the CLs were 16.9 g K kg−1 (Figure 3e) for ‘Chardonnay’ and 17.3 g K kg−1 for ‘Pinot Noir’ (Figure 3f). The range of probability of occurrence of the CL for the K concentration in the leaves at veraison, based on the density of frequency of the values, varied from 15.3 to 18.1 g K kg−1 for ‘Chardonnay’ and from 16.1 to 18.2 g K kg−1 for ‘Pinot Noir’ (Figure 3g). As for the leaves at flowering, the range of distribution between the critical differences in the K concentration between the cultivars was not different (it reached the black dashed line referring to zero) and varied from −6.2 to 6.14 g kg−1, i.e., (Figure 3h).
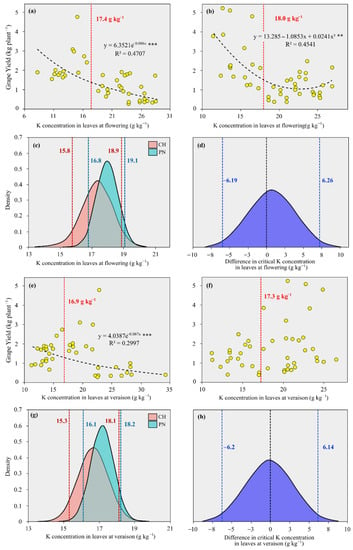
Figure 3.
The relation between relative grape yield and K concentration in leaves at flowering (a,b); and veraison (e,f) in 2016/17, 2017/18 and 2018/19, in ‘Chardonnay’ (CH, (a,e)) and ‘Pinot Noir’ (PN, (b,f)), soil fertilized with K. Frequency density of the critical K concentration in the leaves at flowering (c) and veraison (g). Difference in frequency density of the critical K concentration in the leaves at flowering (d) and veraison (h), between ‘Chardonnay’ and ‘Pinot Noir’. Vertical dashed red and blue lines represent, respectively, the range of probability of occurrence of the critical level of K, for the cultivars ‘Chardonnay’ and ‘Pinot Noir’ (a,g). Vertical dashed blue represent the distribution between the critical difference between cultivars, while the black dashed line refers to zero (d,h). Vertical dashed red line refers to the critical level value of K, respectively, at flowering for ‘Chardonnay’ and ‘Pinot Noir’ (a,b) and at veraison for ‘Chardonnay’ and ‘Pinot Noir’ (e,f). Dashed black line refers to the behavior of equation (a,b,e). “**” Significant at 1% (p < 0.01). “***” Significant at 0.1% (p < 0.001).
3.3. Relation between K Concentration in Leaves and Must Composition
The range of probability of occurrence of the CL allowed us to define relations between the K concentration in the leaves and the must composition (Figure 4 and Figure 5). In detail, in the ‘Chardonnay’ cultivar, the increase of K in the leaves promoted a linear increase in TSS, in both sampling times (Figure 4a,b) with a better relation at veraison than at flowering. The potassium concentration in leaves at flowering negatively affected TTA (Figure 4c), while no relation was found with the K concentration at veraison (Figure 4d).
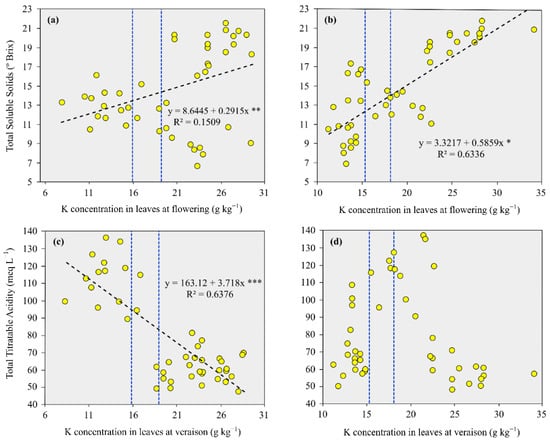
Figure 4.
The relationship between the total soluble solids (TSS) and the K concentration in the leaves (a,b) and between the total titratable acidity (TTA) and the K concentration in the leaves (c,d) at flowering and veraison, in 2016/17, 2017/18 and 2018/19, in the cultivar ‘Chardonnay’ submitted to soil-applied K fertilization. Vertical blue dotted lines represent the range of probability of occurrence (95% highest density interval) of the CL of K. Black dotted lines show the behavior of the equation (TSS and TTA variables). “*” Significant at 5% (p < 0.05). “**” Significant at 1% (p < 0.01). “***” Significant at 0.1% (p < 0.001).
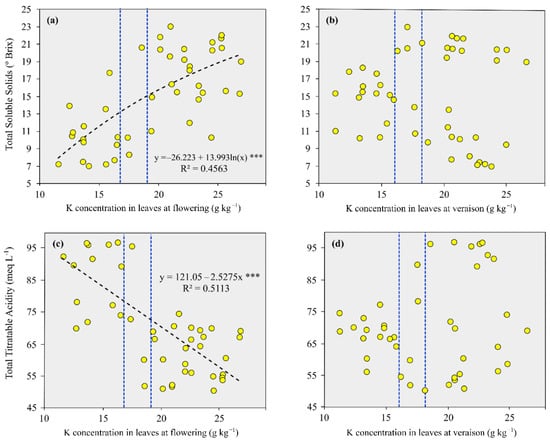
Figure 5.
The relationship between the total soluble solids (TSS) and the K concentration in leaves (a,b) and between the total titratable acidity (TTA) and the K concentration in the leaves (c,d) at flowering and veraison, in 2016/17, 2017/18 and 2018/19, in ‘Pinot Noir’ submitted to soil applied K fertilizations. Vertical blue dotted lines represent the range of probability of occurrence (95% highest density interval) of the CL of K. Black dotted lines show the behavior of the equation (TSS and TTA variables). “***” Significant at 0.1% (p < 0.001).
In ‘Pinot Noir’, a positive relationship between the K concentration in the leaves at flowering and TSS (Figure 5a) and a negative relationship with TTA (Figure 5c) were observed; while at veraison, no relations between the must parameter (TSS and TTA) and the K concentration in leaves were found (Figure 5b,d).
3.4. K Critical Levels in Soil
The CLs of K in the soil were obtained from exponential regressions, which presented the best significant adjustments among the evaluated models for both cultivars. The CL of K in the soil in the 0–10 cm layer was 41.4 and 44.9 mg K kg−1 for ‘Chardonnay’ and ‘Pinot Noir’, respectively (Figure 6a,b). The range of probability of occurrence of the CL of K, based on the density of frequency of the values distributions, was 33.0 to 48.7 mg K kg−1 for ‘Chardonnay’ and 35.1 to 54.2 mg K kg−1 for ‘Pinot Noir’ (Supplementary Material Figure S1a). The range of distribution between critical differences in the K content between the cultivars varied between −5.03 to 5.09 mg K kg−1 and was not different (it reached the black dashed line referring to zero) (Supplementary Material Figure S1b). The CL of K was 27.4 mg K kg−1 for ‘Chardonnay’ in the 0–20 cm layer (Figure 6c), while for ‘Pinot Noir’ it was 23.2 mg K kg−1 (Figure 6d). The range of probability of occurrence of the CL of K, based on the density of frequency of the values, varied from 21.0 to 33.1 mg K kg−1 for ‘Chardonnay’ and from 14.0 to 32.1 mg K kg−1 for ‘Pinot Noir’ (Supplementary Material Figure S1c). The amplitude of distribution between critical differences in the K concentration between the cultivars was not different and ranged from −6.67 to 3.91 mg K kg−1, i.e., (reaching the black dashed line referring to zero) (Supplementary Material Figure S1d).
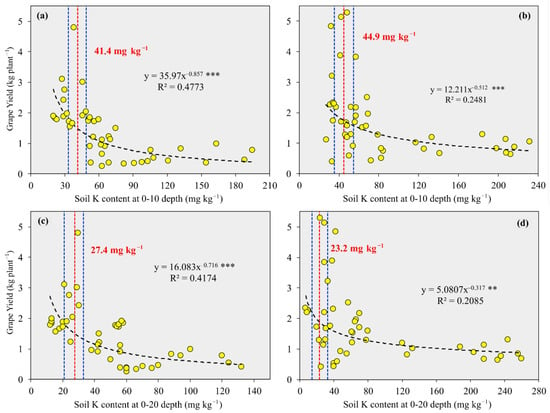
Figure 6.
Soil K critical content at 0–10 and 0–20 cm depth in ‘Chardonnay’ (a,c) and ‘Pinot Noir’ (b,d) cultivated in sandy soil and fertilized with K. Vertical blue dotted lines represent the range of probability of occurrence (95% highest density interval) of the CL of K. Vertical red dotted lines are the CL value of soil K content. The black dotted line is the behavior of the equation (grape yield variable). “**” Significant at 1% (p < 0.01). “***” Significant at 0.1% (p < 0.001).
3.5. Relationship between Soil K Content and Must Composition
From the range of probability of the occurrence of the CL (Figure 6), relations between the soil K content and the must composition of ‘Chardonnay’ were performed. The TTS was increased as a consequence of soil K content raise, regardless of the sampling depth (Figure 7a,c,e). For the ‘Pinot Noir’, the increase in soil available K induced an increase of TSS values up to the content of 150 mg K kg−1 in the 0–10 cm layer (Figure 7b). Meanwhile, in the 0–20 cm layers, the value was close to 200 mg K kg−1(Figure 7d). For both cultivars, the TTA of the must decreased as a consequence of soil K availability regardless of the sampling depth (Figure 8).
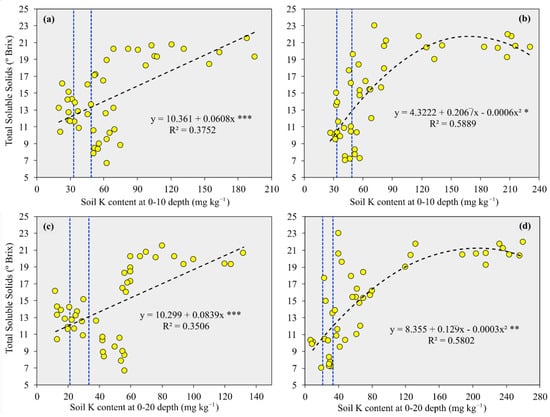
Figure 7.
The relationship between the soil K content and the total soluble solids (TTS), in the evaluated crops seasons, in ‘Chardonnay’ (a,c) and ‘Pinot Noir’ (b,d). Vertical blue dotted lines represent the range of probability of occurrence (95% highest density interval) of the CL of K. The black dotted line is the behavior of the equation (TSS variable). “*” Significant at 5% (p < 0.05). “**” Significant at 1% (p < 0.01). “***” Significant at 0.1% (p < 0.001).
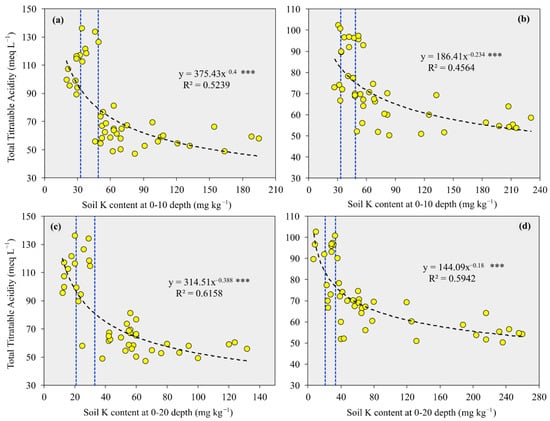
Figure 8.
The relationship between the soil K content and the total titratable acidity (TTA), in the evaluated crops seasons, in ‘Chardonnay’ (a,c) and ‘Pinot Noir’ (b,d). Vertical blue dotted lines represent the range of probability of occurrence (95% highest density interval) of the CL of K. The black dotted line is the behavior of the equation (TTA variable). “***” Significant at 0.1% (p < 0.001).
3.6. Maximum Technical Efficiency (MTE) Dose
Unlike for Chardonnay, in which it was not possible to obtain the MTE due to the linear response of grape yield to the increasing K application rate, (Figure 9a,c,e). In ‘Pinot Noir’, the MTE was 38.3 kg K2O ha−1 only in the 2017/18 crop season (Figure 9d). By pooling together all the crop seasons evaluated, it was not possible to calculate the MTE dose for both cultivars (Figure 9g,h).
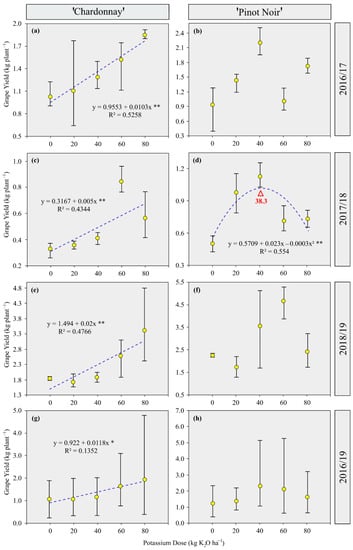
Figure 9.
Potassium maximum technical efficiency (MTE) doses in relation to the grape yield of ‘Chardonnay’ (a,c,e,g) and ‘Pinot Noir’ (b,d,f,h) in 2016/17, 2017/18, 2018/19 and in a compilation of the crop seasons submitted to the application of soil fertilized with K. The blue dotted line is the behavior of the equation. “*” Significant at 5% (p < 0.05). “**” Significant at 1% (p < 0.01).
3.7. Maximum Technical Efficiency (MTE) in Relation to Must Composition
When we related the K soil application rates to the must variables, we observed that the supply of 80 kg K2O ha−1 showed the best response in term of must TTS in 2016/17 for ‘Chardonnay’ (Figure 10a) and in 2018/19 for ‘Pinot Noir’ (Figure 10f). The MTE of TTA was of 45.7 kg K2O ha−1 for ‘Chardonnay’ in 2016/17 (Figure 11a). In ‘Pinot Noir’, the must TTA decreased as a consequences of K dose increase in 2016/17 and 2018/19 (Figure 11b,f). Meanwhile, in both cultivars, no relation was observed for all the crop seasons pooled together for TSS and TTA (Figure 10g,h and Figure 11g,h).
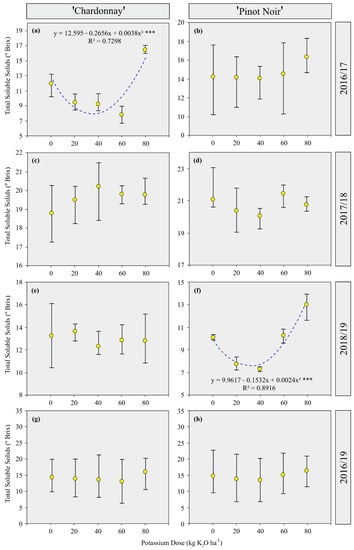
Figure 10.
Potassium maximum technical efficiency (MTE) doses in relation to the total soluble solids (TSS) of ‘Chardonnay’ (a,c,e,g) and ‘Pinot Noir’ (b,d,f,h), in 2016/17, 2017/18, 2018/19 and in a compilation of the crop seasons submitted to the application soil fertilized with K. The blue dotted line is the behavior of the equation. “***” Significant at 0.1% (p < 0.001).
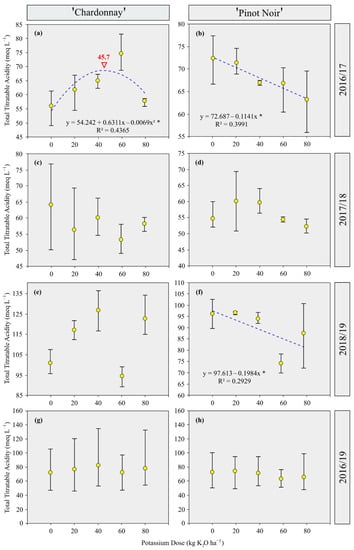
Figure 11.
Potassium maximum technical efficiency (MTE) doses in relation to the total titratable acidity (TTA) of ‘Chardonnay’ (a,c,e,g) and ‘Pinot Noir’ (b,d,f,h), in 2016/17, 2017/18, 2018/19 and in a compilation of the crop seasons submitted to the application soil fertilized with K. The blue dotted line is the behavior of the equation. “*” Significant at 5% (p < 0.05).
3.8. Principal Component Analysis
Principal component analysis (PCA) was performed by extracting only the first two components, since the sum of the principal components PC1 and PC2 explained 73.5% of the original data variability for ‘Chardonnay’ (Figure 12a) and 72.0% for ‘Pinot Noir’ (Figure 12b). The principal component 1 (PC1) of ‘Chardonnay’ explained 55.5% of the variability and allowed for the visualization of the behavior of the crop season effect in relation to the response variables (Figure 12a). In detail, the 2016/17 crop season accounted for 55.5% of PC1, while PC2 explained 18.0% of the data variability and was efficient in separating the behavior of the 2018/19 crop season, which was influenced by the TTA and grape yield variables (number of clusters, grape yield, weight of 100 berries). These results contrasted with the 2017/18 crop season, which was positioned to the left of the spatial distribution and was positively related to the TSS variables and the K concentrations in the leaves (veraison) and the in soil (0–10 and 0–20 cm). ‘Pinot Noir’s PC1 explained 56.1% of the data variability and, as for ‘Chardonnay’, it separated the behavior of the crop seasons. In the 2016/17 crop season, the highest doses (40, 60 and 80 kg K2O ha−1 year−1) were positioned to the right of the spatial distribution and were positively related to the K concentration in the leaves collected at flowering and the must pH. Principal component 2 explained 15.9% of the data variability and was efficient in separating the behavior of the 2018/19 crop season, which was positioned in the left of the spatial distribution and was influenced by the highest doses (40, 60 and 80 kg K2O ha−1 year−1), correlating with grape yield variables (weight of 100 berries, grape yield and number of clusters) and TTA. These results contrasted with the 2017/18 crop season, which was positioned to the right of the spatial distribution and was positively related to TSS and soil K content (0–10 and 0–20 cm layers).
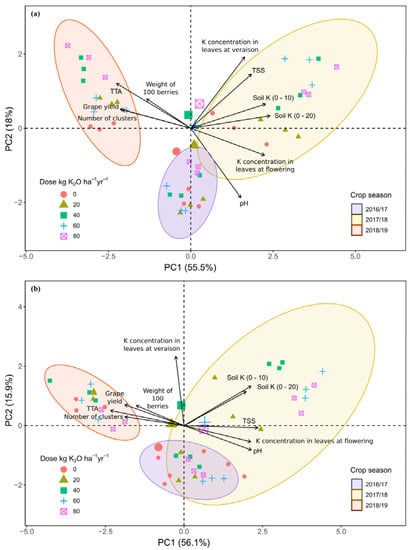
Figure 12.
The relationship between principal component 1 (PC1) and principal component 2 (PC2) for variable groups of soil (0–10 and 0–20 cm) and leaf K concentration during flowering and veraison, vine yield (number of clusters per plant, grape yield per plant and weight of 100 berries) and must chemicals parameters (SST, pH and TTA) detected in 2016/17, 2017/18 and 2018/19, in ‘Chardonnay’ (a) and ‘Pinot Noir’ (b) soil fertilized with K.
4. Discussion
The crop season was the variable that most influenced grape yield and must quality in both cultivars (Figure 2 and Figure 12). This was mainly due to climate variables such as temperature and solar radiation that both directly or indirectly affected growth, grape yield and grape must and even wine quality [38]. The high temperatures that occurred between veraison and harvest (November–January) may have contributed to the increase in the TSS values in the must in both cultivars, in relation to the leaf K concentration, especially in the leaves collected at flowering (Figure 4a and Figure 5a). The intense insolation of the study region contributes to the berries ripening and increase of sugars [39,40]. Furthermore, in warmer climates, such as the location of the present study, the accumulation of K+ ions increases during grape ripening, thus causing excessive neutralization of organic acids [40,41]. The reduction in TTA values may be caused by degradation of organic acid due to intense fruit respiration because of the high temperatures. Thus, the values of must acidity in warm climatic regions are usually low [7,42]. In addition, frequent precipitation can potentiate nutrient losses, such as K, especially by surface runoff [43,44], especially in places with frequent intense rainfall, as observed in the region of the present study.
The CLs established for K in leaves collected at flowering and veraison in relation to grape yield were similar between ‘Chardonnay’ and ‘Pinot Noir’. However, the CL values of K in the leaves collected at flowering and veraison were greater than 16.0 g K kg−1, which was established as adequate by the official fertilization recommendation for grapevines in the southern region of Brazil [11,45]. The CL values of K in the leaves were greater than 12 g K kg−1 which is considered as adequate by Rozane et al. [46], in a study carried out in Brazil. In addition, the CL values of K in the leaves collected at veraison were higher than the K concentrations proposed as adequate (0.50–1.0%) by [47,48], in Washington state, USA. Usually, recommendation guidelines report values of leaf nutrients [11,48] close to the results obtained in isolated studies. The CL of K in the leaves was higher at flowering than at veraison, probably because, in the first vegetative phase, intense cell division and elongation are observed with a consequent increase in leaf dry matter becoming a higher sink for nutrients, such as K ([9,49]. On the other hand, at veraison, part of the leaf-resident K could be redistributed easily to other annual organs with intense cell division and elongation, such as berries of grape clusters [50]. The K redistribution inside the plant happens easily because the K inside the plant is not in the form of K+ and is not linked to other compounds [51].
This contributes to explaining our results related to the behavior of the relationship between CLs of K in leaves and must variables. The K available in the soil that is assimilated by the draining organs such as leaves can cause K accumulation in the leaves and, consequently, this K can be a source of carbohydrates for other organs, such as grape bunches. Thus, K may be involved in the translocation of solutes in the berry through its roles in phloem loading and unloading [52]. Thus, K may play an important role in the accumulation of sugars, as K is essential for the biosynthesis and transport of sugars from the leaves to the grapes [39]. At veraison, the lack of relation with the must variables may be because the cell wall of the berry decreases its permeability due to ripening. Furthermore, a high soil K availability in not a parameter for a high K concentration in the vine leaves. This is considered a consequence of redistribution, i.e., internal K redistribution between leaves and other organs (root and stem) where K occupies a different metabolic role [23,53].
The CL of available soil K indicated that grape yield does not increase as a consequence of K availability enhancement. Critical level values of available K in the 0–10 and 0–20 cm layers for ‘Chardonnay’ and ‘Pinot Noir’ were lower than 41–60 mg K kg−1, which are actually the values suggested by the recommendation guidelines as adequate for soils with ≤7.5 cmolc kg−1 values of CECpH7.0 [11]. In addition, vine cultivars may have absorbed non-exchangeable forms of K, that are present in soils such as those in the present study.
The higher levels of available K and the CL in the 0–10 cm layer can be due to the fact that fertilizer applications were on the surface of the soil, which was not disturbed. In addition, K applied to soils tends to be adsorbed into functional groups of reactive soil particles [54,55], making the mobility of K in the soil profile very low. In addition, the roots of cover crops present in the vineyards can absorb K in the soil profile. Consequently, K can be incorporated into the shoots of plants, which will be deposited on the soil surface via decomposition of cover crops. This can contribute to maintaining the highest levels of available K in the surface layer.
On the other hand, the behavior of the relationship between the CL of K in the soil and variables of the must may be due to the content of available K in the soil which, when absorbed by the grapevines, increases the K in their storage organs, such as the bunches. Consequently, K can be incorporated into the berries [7]. The K+ in the berries can change the chemical variables of the must, increasing the sugar content and reducing the acidity, as already reported [56]. This response may be due to the growth pattern of grape berries which is described as a double sigmoidal curve with a rapid initial increase in size (due to cell division followed by cell expansion, together with rapid accumulation of organic acids), causing rapid accumulation of sugars [39]. Furthermore, after veraison, berries undergo major changes in chemical composition, including sugar accumulation and depletion of organic acids [39,57].
The vine yield increased with K doses in ‘Chardonnay’ in all the crop seasons indicating that this cultivar responds positively to the supply of K. However, ‘Pinot Noir’, in 2017/18 evidenced an MTE of 38.3 kg−1 K2O ha−1 close to the rate of K (40 kg K2O ha−1) which is normally recommended for wine grapevines (white and red) with a yield lower than 10 Mg ha−1 [11]. On the other hand, for this same productivity, when the K levels in the leaves are interpreted as normal, the recommended K dose is less than or equal to 10 kg K2O ha−1. Thus, the data from the present study show that a grapevine with no K deficiencies and a yield lower than 10 Mg ha−1 could receive higher K doses (40 kg K2O ha−1) than those recommended, with benefits in term of productivity. Furthermore, in the other crop seasons, there was no effect of fertilization on grape yield, which may be related to climatic variations.
The failure to obtain a standard dose for both cultivars for MTE related to must variables, may be due to climatic conditions such as high temperatures and drought stress that restrict grape yield. Finally, the chemical composition of the berries is altered by solar radiation and precipitation [58,59].
5. Conclusions
Both in flowering and in veraison, and even in soil, the distribution range between the critical differences in the K concentration between the cultivars was not statistically different, but it presented different CLs. Meanwhile, from the range of probability of occurrence of CLs of K in the leaves and soil, we observed that TSS values increased while TTA values decreased for both cultivars. MTE has been established in ‘Pinot Noir’ only and it was 38.3 kg−1 K2O ha−1.
Supplementary Materials
The following supporting information can be downloaded at: https://www.mdpi.com/article/10.3390/agriculture12111867/s1, Figure S1: density of frequency of the K critical content in the soil.
Author Contributions
Conceptualization, A.T., L.O.S., C.A.C. and G.B.; methodology, A.T., L.O.S. and G.B.; formal analysis, E.M.H.d.S. and R.A.S.; investigation, A.T., L.O.S., B.B.V., G.N.d.S., J.H. and F.N.d.O.; writing—original draft, A.T.; writing—review and editing, A.T., L.O.S., G.N.d.S., C.A.C., R.S., T.L.T., M.N.C., E.B., M.T. and G.B.; supervision and project administration, C.A.C. and G.B. All authors have read and agreed to the published version of the manuscript.
Funding
This study was supported by Conselho Nacional de Desenvolvimento Científico e Tecnológico (CNPq-423772/2018-0; CNPq-201975/2020-3), Fundação de Amparo à Pesquisa do Estado do Rio Grande do Sul (FAPERGS-21/2551-0002232-9; 21/2551-0000602-1), and Vinícola Família Salton.
Institutional Review Board Statement
Not applicable.
Data Availability Statement
The datasets generated during the current study are available from the corresponding author on reasonable request.
Acknowledgments
We thank all the staff and students responsible for the maintenance and data collection from this field trial. We would like to thank the Conselho Nacional de Desenvolvimento Científico e Tecnológico (CNPq), Fundação de Amparo à Pesquisa do Estado do Rio Grande do Sul (FAPERGS), and Vinícola Família Salton for the scholarship granted to the first author.
Conflicts of Interest
The authors declare no financial or other competing conflict of interest.
References
- Portela, E.; Monteiro, F.; Fonseca, M.; Abreu, M.M. Effect of Soil Mineralogy on Potassium Fixation in Soils Developed on Different Parent Material. Geoderma 2019, 343, 226–234. [Google Scholar] [CrossRef]
- Pushpavathi, Y.; Satisha, J.; Satisha, G.C.; Reddy, R.L. Influence of Potassium Fertilization on Yield, Petiole and Soil Nutrient Status of Table Grape Cv. Sharad Seedless. J. Plant Nutr. 2021, 45, 2218–2227. [Google Scholar] [CrossRef]
- Shabala, S.; Pottosin, I. Regulation of Potassium Transport in Plants under Hostile Conditions: Implications for Abiotic and Biotic Stress Tolerance. Physiol. Plant. 2014, 151, 257–279. [Google Scholar] [CrossRef] [PubMed]
- Ahmad, I.; Maathuis, F.J.M. Cellular and Tissue Distribution of Potassium: Physiological Relevance, Mechanisms and Regulation. J. Plant Physiol. 2014, 171, 708–714. [Google Scholar] [CrossRef]
- Callili, D.; da Silva, M.J.R.; Sánchez, C.A.P.C.; Basílio, L.S.P.; Macedo, B.M.D.P.; Teixeira, L.A.J.; Lima, G.P.P.; Tecchio, M.A. Rootstocks and Potassium Fertilization on Yield Performance and Quality of “Niagara Rosada” Grapevine under Subtropical Conditions. Aust. J. Crop Sci. 2022, 16, 293–300. [Google Scholar] [CrossRef]
- Coetzee, Z.A.; Walker, R.R.; Liao, S.; Barril, C.; Deloire, A.J.; Clarke, S.J.; Tyerman, S.D.; Rogiers, S.Y. Expression Patterns of Genes Encoding Sugar and Potassium Transport Proteins Are Simultaneously Upregulated or Downregulated When Carbon and Potassium Availability Is Modified in Shiraz (Vitis vinifera L.) Berries. Plant Cell Physiol. 2019, 60, 2331–2342. [Google Scholar] [CrossRef]
- Villette, J.; Cuéllar, T.; Verdeil, J.L.; Delrot, S.; Gaillard, I. Grapevine Potassium Nutrition and Fruit Quality in the Context of Climate Change. Front. Plant Sci. 2020, 11, 123. [Google Scholar] [CrossRef]
- Monder, H.; Maillard, M.; Chérel, I.; Zimmermann, S.D.; Paris, N.; Cuéllar, T.; Gaillard, I. Adjustment of K+ Fluxes and Grapevine Defense in the Face of Climate Change. Int. J. Mol. Sci. 2021, 22, 10398. [Google Scholar] [CrossRef]
- Ciotta, M.N.; Ceretta, C.A.; da Silva, L.O.S.; Ferreira, P.A.A.; Sautter, C.K.; da Rosa Couto, R.; Brunetto, G. Grape Yield, and Must Compounds of “Cabernet Sauvignon” Grapevine in Sandy Soil with Potassium Contents Increasing. Ciência Rural 2016, 46, 1376–1383. [Google Scholar] [CrossRef]
- Brunetto, G.; Comin, J.J.; Schmitt, D.E.; Guardini, R.; Mezzari, C.P.; Oliveira, B.S.; de Moraes, M.P.; Gatiboni, L.C.; Lovato, P.E.; Ceretta, C.A. Changes in Soil Acidity and Organic Carbon in a Sandy Typic Hapludalf after Medium-Term Pig-Slurry and Deep-Litter Application. Rev. Bras. Ciência Solo 2012, 36, 1620–1628. [Google Scholar] [CrossRef]
- CQFS-RS/SC (Comissão de Química e Fertilidade do Solo—RS/SC). Manual de Calagem e Adubação Para Os Estados Do Rio Grande Do Sul e de Santa Catarina; Silva, L.S., Gatiboni, L.C., Ibanor, A., Souza, R.O., Eds.; Sociedade Brasileira de Ciência do Solo -Núcleo Regional Sul: Viçosa, Brazil, 2016; ISBN 9788566301809. [Google Scholar]
- Ling, W.; Sun, R.; Gao, X.; Xu, R.; Li, H. Low-Molecular-Weight Organic Acids Enhance Desorption of Polycyclic Aromatic Hydrocarbons from Soil. Eur. J. Soil Sci. 2015, 66, 339–347. [Google Scholar] [CrossRef]
- Sivaram, A.K.; Logeshwaran, P.; Lockington, R.; Naidu, R.; Megharaj, M. Low Molecular Weight Organic Acids Enhance the High Molecular Weight Polycyclic Aromatic Hydrocarbons Degradation by Bacteria. Chemosphere 2019, 222, 132–140. [Google Scholar] [CrossRef] [PubMed]
- Comas, L.H.; Bauerle, T.L.; Eissenstat, D.M. Biological and Environmental Factors Controlling Root Dynamics and Function: Effects of Root Ageing and Soil Moisture. Aust. J. Grape Wine Res. 2010, 16, 131–137. [Google Scholar] [CrossRef]
- Griffiths, M.; York, L.M. Targeting Root Ion Uptake Kinetics to Increase Plant Productivity and Nutrient Use Efficiency. Plant Physiol. 2020, 182, 1854–1868. [Google Scholar] [CrossRef] [PubMed]
- Lynch, J.P.; Strock, C.F.; Schneider, H.M.; Sidhu, J.S.; Ajmera, I.; Galindo-Castañeda, T.; Klein, S.P.; Hanlon, M.T. Root Anatomy and Soil Resource Capture. In Plant Soil; Springer International Publishing: Berlin/Heidelberg, Germany, 2021; Volume 466, pp. 21–63. [Google Scholar] [CrossRef]
- Kulmann, M.S.d.S.; Sete, P.B.; de Paula, B.V.; Stefanello, L.O.; Schwalbert, R.; Schwalbert, R.A.; Arruda, W.S.; Sans, G.A.; Parcianello, C.F.; Nicoloso, F.T.; et al. Kinetic Parameters Govern of the Uptake of Nitrogen Forms in ‘Paulsen’ and ‘Magnolia’ Grapevine Rootstocks. Sci. Hortic. 2020, 264, 109174. [Google Scholar] [CrossRef]
- Arrobas, M.; Ferreira, I.Q.; Freitas, S.; Verdial, J.; Rodrigues, M.Â. Scientia Horticulturae Guidelines for Fertilizer Use in Vineyards Based on Nutrient Content of Grapevine Parts. Sci. Hortic. 2014, 172, 191–198. [Google Scholar] [CrossRef]
- Domagała-świątkiewicz, I.; Gąstoł, M.; Kiszka, A. Effect of Nitrogen and Potassium Fertilization on the Magnesium Content in Vineyard Soil, and in the Leaves and Berries of Bianca and Sibera Grapevine Cultivars. J. Elem. 2019, 24, 755–769. [Google Scholar] [CrossRef]
- McGlothlin, A.E.; Viele, K. Bayesian Hierarchical Models. JAMA J. Am. Med. Assoc. 2018, 320, 2365–2366. [Google Scholar] [CrossRef]
- Schmid, C.H.; Brown, E.N. Bayesian Hierarchical Models. Methods Enzymol. 2000, 321, 305–330. [Google Scholar] [CrossRef]
- Al-Moshileh, A.; Al-Rayes, D. Effect of Potassium Fertilization Regimes on Petiole Nutrient Contents, Yield and Fruit Quality of Table Seedless Grapes. In Proceedings of the IPI regional workshop on Potassium and Fertigation development in West Asia and North Africa, Rabat, Morocco, 24–28 November 2004. [Google Scholar]
- Marković, N.; Ličina, V.; Mladenović, S.A. Distribucija Kalija u Organima Vinove Loze Pri Različitim Dozama Kalijevih Gnojiva. In Proceedings of the 46th Croatian & 6th International Symposium on Agriculture, Opatija, Croatia, 14–18 February 2011; pp. 950–954. [Google Scholar]
- Ganeshamurthy, A.N.; Satisha, G.C.; Prakash, P. Potassium Nutrition on Yield and Quality of Fruit Crops with Special Emphasis on Banana and Grapes. Karnataka J. Agric. Sci. 2011, 24, 29–38. [Google Scholar]
- Ramos, M.C.; Romero, M.P. Potassium Uptake and Redistribution in Cabernet Sauvignon and Syrah Grape Tissues and Its Relationship with Grape Quality Parameters. J. Sci. Food Agric. 2016, 28, 303–325. [Google Scholar] [CrossRef]
- Pushpavathi, Y.; Satisha, J.; Satisha, G.C.; Shivashankara, K.S.; Reddy, M.L.; Sriram, S. Effect of Different Sources and Method of Potassium Application on Growth and Yield of Grapes Cv. Sharad Seedless (Vitis vinifera L.). Int. J. Chem. Stud. 2019, 7, 2640–2642. [Google Scholar]
- Chowaniak, M.; Klima, K.; Niemiec, M. Impact of Slope Gradient, Tillage System and Plant Cover on Soil Losses of Calcium and Magnesium. J. Elem. 2016, 21, 361–372. [Google Scholar] [CrossRef]
- Burg, P.; Masan, V.; Cizkova, A.; Visacki, V. Evaluation of Impact of Cover Materials on Reduction of Water Erosion of Soil in Vineyards. Eng. Rural Dev. 2018, 17, 658–664. [Google Scholar] [CrossRef]
- Della Chiesa, S.; Genova, G.; la Cecilia, D.; Niedrist, G. Phytoavailable Phosphorus (P2O5) and Potassium (K2O) in Topsoil for Apple Orchards and Vineyards, South Tyrol, Italy. J. Maps 2019, 15, 555–562. [Google Scholar] [CrossRef]
- Soil Survey Staff—NRCS/USDA Keys to Soil Taxonomy. Soil Conserv. Serv. 2014, 12, 372.
- Alvares, C.A.; Stape, J.L.; Sentelhas, P.C.; De Moraes Gonçalves, J.L.; Sparovek, G. Köppen’s Climate Classification Map for Brazil. Meteorol. Zeitschrift 2013, 22, 711–728. [Google Scholar] [CrossRef]
- Miller, R.O. Nitric-Perchloric Wet Acid Digestion in an Open Vessel. In Handbook of Reference Methods for Plant Analysis; Kalra, Y.P., Ed.; CRC Press: Washington, DC, USA, 1998; pp. 57–68. [Google Scholar]
- Mehlich, A. Determination of P, Ca, Mg, K, Na, NH4. Short Test Methods Used Soil Test. Div. 1953, 8, 16. [Google Scholar]
- Qu, L. Package VarComp: Variance Component Models. R Package Version 0.1-317. 2014, pp. 1–44. Available online: https://mran.microsoft.com/snapshot/2014-11-26/web/packages/varComp/varComp.pdf (accessed on 15 May 2020).
- R Core Team. R: A Language and Environment for Statistical Computing; R Foundation for Statistical Computing: Vienna, Austria, 2020. [Google Scholar]
- Gelman, A.; Hill, J. Data Analysis Using Regression and Multilevel Models. In Data Analysis Using Regression and Multilevel/Hierarchical Models; Cambridge University Press: Cambridge, UK, 2007; p. 651. [Google Scholar]
- Kassambara, A.; Mundt, F. Package ‘Factoextra’: Extract and Visualize the Results of Multivariate Data Analyses. CRAN-R Packag Version 1.0.7. 2020, p. 84. Available online: https://cran.r-project.org/web/packages/factoextra/readme/README.html (accessed on 15 May 2020).
- Mira de Orduña, R. Climate Change Associated Effects on Grape and Wine Quality and Production. Food Res. Int. 2010, 43, 1844–1855. [Google Scholar] [CrossRef]
- Mpelasoka, B.S.; Schachtman, D.P.; Treeby, M.T.; Thomas, M.R. A Review of Potassium Nutrition in Grapevines with Special Emphasis on Berry Accumulation. Aust. J. Grape Wine Res. 2003, 9, 154–168. [Google Scholar] [CrossRef]
- Rogiers, S.Y.; Coetzee, Z.A.; Walker, R.R.; Deloire, A.; Tyerman, S.D. Potassium in the Grape (Vitis vinifera L.) Berry: Transport and Function. Front. Plant Sci. 2017, 8, 1–19. [Google Scholar] [CrossRef] [PubMed]
- Nieves-Cordones, M.; Andrianteranagna, M.; Cuéllar, T.; Chérel, I.; Gibrat, R.; Boeglin, M.; Moreau, B.; Paris, N.; Verdeil, J.L.; Zimmermann, S.D.; et al. Characterization of the Grapevine Shaker K+ Channel VvK3.1 Supports Its Function in Massive Potassium Fluxes Necessary for Berry Potassium Loading and Pulvinus-Actuated Leaf Movements. New Phytol. 2019, 222, 286–300. [Google Scholar] [CrossRef] [PubMed]
- Bayo-Canha, A.; Costantini, L.; Fernández-Fernández, J.I.; Martínez-Cutillas, A.; Ruiz-García, L. QTLs Related to Berry Acidity Identified in a Wine Grapevine Population Grown in Warm Weather. Plant Mol. Biol. Rep. 2019, 37, 157–169. [Google Scholar] [CrossRef]
- Ramos, M.C.; Martínez-Casasnovas, J.A. Nutrient Losses from a Vineyard Soil in Northeastern Spain Caused by an Extraordinary Rainfall Event. Catena 2004, 55, 79–90. [Google Scholar] [CrossRef]
- Napoli, M.; Marta, A.D.; Zanchi, C.A.; Orlandini, S. Assessment of Soil and Nutrient Losses by Runoff under Different Soil Management Practices in an Italian Hilly Vineyard. Soil Tillage Res. 2017, 168, 71–80. [Google Scholar] [CrossRef]
- Ciotta, M.N.; Ceretta, C.A.; Krug, A.V.; Brunetto, G.; Nava, G. Grape (Vitis vinifera L.) Production and Soil Potassium Forms in Vineyard Subjected to Potassium Fertilization. Rev. Bras. Frutic. 2021, 43, 1–11. [Google Scholar] [CrossRef]
- Rozane, D.E.; de Paula, B.V.; de Melo, G.W.B.; Dos Santos, E.M.H.; Trentin, E.; Marchezan, C.; da Silva, L.O.S.; Tassinari, A.; Dotto, L.; de Oliveira, F.N.; et al. Compositional Nutrient Diagnosis (CND) Applied to Grapevines Grown in Subtropical Climate Region. Horticulturae 2020, 6, 56. [Google Scholar] [CrossRef]
- Davenport, J.R.; Horneck, D.A. Sampling Guide for Nutrient Assessment of Irrigated Vineyards in the Inland Pacific Northwest; Pacific Northwest Extension–PNW622; Washington State University: Prosser, WA, USA, 2011. [Google Scholar]
- Moyer, M.M.; Singer, S.D.; Davenport, J.R.; Hohesiel, G. Vineyard Nutrient Management in Washington State; Pullman: Washington, DC, USA, 2018. [Google Scholar]
- Baby, T.; Moroni, F.J.; Gascon-Aldana, P.; Moroni, N.C.; Holzapfel, B.P.; Schmidtke, L.M.; Walker, R.R.; Rogiers, S.Y. Characterising Leaf Petiole, Blade and Bunchstem Nutrient Concentration across Three Grapevine Cultivars. Aust. J. Grape Wine Res. 2021, 27, 442–452. [Google Scholar] [CrossRef]
- Yu, X.; Wang, B.; Zhang, C.; Xu, W.; He, J.; Zhu, L.; Wang, S. Effect of Root Restriction on Nitrogen Levels and Glutamine Synthetase Activity in “Kyoho” Grapevines. Sci. Hortic. 2012, 137, 156–163. [Google Scholar] [CrossRef]
- Wang, Y.; Chen, Y.F.; Wu, W.H. Potassium and Phosphorus Transport and Signaling in Plants. J. Integr. Plant Biol. 2021, 63, 34–52. [Google Scholar] [CrossRef]
- Lang, A. Turgor-Regulated Translocation. Plant Cell Environ. 1983, 6, 683–689. [Google Scholar]
- Ličina, V.; Jakovljević, M. The K/Mg Ratio in Grapevine Organs Growt on Diferent Soil Types. Zemljište Biljka 1997, 46, 178–182. [Google Scholar]
- Zörb, C.; Senbayram, M.; Peiter, E. Potassium in Agriculture—Status and Perspectives. J. Plant Physiol. 2014, 171, 656–669. [Google Scholar] [CrossRef]
- Montes, R.M.; Parent, L.É.; de Amorim, D.A.; Rozane, D.E.; Parent, S.É.; Natale, W.; Modesto, V.C. Nitrogen and Potassium Fertilization in a Guava Orchard Evaluated for Five Cycles: Effects on the Plant and on Production. Rev. Bras. Cienc. Solo 2016, 40, e0140532. [Google Scholar] [CrossRef]
- Martín, P.; Delgado, R.; González, M.R.; Gallegos, J.I. Colour of “tempranillo” Grapes as Affected by Different Nitrogen and Potassium Fertilization Rates. Acta Hortic. 2004, 652, 153–160. [Google Scholar] [CrossRef]
- Coombe, B. Research on Development and Ripening of the Grape Berry. Am. J. Enol. Vitic. 1992, 43, 101–110. [Google Scholar]
- Barnuud, N.N.; Zerihun, A.; Gibberd, M.; Bates, B. Berry Composition and Climate: Responses and Empirical Models. Int. J. Biometeorol. 2014, 58, 1207–1223. [Google Scholar] [CrossRef] [PubMed]
- Navrátilová, M.; Beranová, M.; Severová, L.; Šrédl, K.; Svoboda, R.; Abrhám, J. The Impact of Climate Change on the Sugar Content of Grapes and the Sustainability of Their Production in the Czech Republic. Sustainability 2021, 13, 222. [Google Scholar] [CrossRef]
Publisher’s Note: MDPI stays neutral with regard to jurisdictional claims in published maps and institutional affiliations. |
© 2022 by the authors. Licensee MDPI, Basel, Switzerland. This article is an open access article distributed under the terms and conditions of the Creative Commons Attribution (CC BY) license (https://creativecommons.org/licenses/by/4.0/).