Article

Optimal Nitrogen Rate Increases Water and Nitrogen Use Efficiencies of Maize under Fully Mulched Ridge–Furrow System on the Loess Plateau

1
State Key Laboratory of Aridland Crop Science, Gansu Agricultural University, Lanzhou 730070, China
2
College of Agronomy, Gansu Agricultural University, Lanzhou 730070, China
3
Institute of Molecular Biology and Biotechnology, The University of Lahore, Lahore 54660, Pakistan
4
College of Resources and Environment Science, Gansu Agricultural University, Lanzhou 730070, China
*
Author to whom correspondence should be addressed.
Agriculture 2022, 12(11), 1799; https://doi.org/10.3390/agriculture12111799
Submission received: 24 August 2022 / Revised: 22 October 2022 / Accepted: 26 October 2022 / Published: 29 October 2022
(This article belongs to the Section Crop Production)

Abstract

:
Increasing water and nitrogen use efficiencies (i.e., WUE and NUE) in dryland agroecosystems to maintain high agricultural output with lower environmental costs, such as minimal soil water depletion and nitrate-N residue, are key responsibilities to assure food security for a growing global population. The impact of N rate on soil water balance, soil nitrate N residue, grain yield, WUE, crop N recovery efficiency (REN), agronomic use efficiency of N fertilizer (AE), and net economic return were examined on maize production on the rainfed Loess Plateau during 2011–2018. Field treatments included four N application rates (N0, no N fertilizer applied; N100, 100 kg N ha−1; N200, 200 kg N ha−1; N300, 300 kg N ha−1). Results showed that compared with N0, grain yield increased by 56, 110, and 115% under N100, N200, and N300, respectively, with corresponding improvements in net economic return of 5497, 10,878, and 11,088 RMB ha−1 yr1, respectively; no significant difference was detected between N200 and N300. Compared to N0, N fertilization significantly increased WUE through improving photosynthetic WUE (i.e., transpiration efficiency), but there was no significant difference between N200 and N300. Compared to N100, the REN was gradually decreased as N rates increased, AE was not significantly changed under N200 and significantly decreased under N300 due to a decreased leaf photosynthetic NUE. Compared to original soil water storage at 0–300 cm soil depths, after seven years of continuous experiments, treatment of N0 enhanced soil water storage by 52 mm and treatment of N100 had no effect on soil water storage, but treatments of N200 and N300 depleted soil water storage by 73 and 109 mm, respectively. Our findings showed that 200 kg N ha−1 improves WUE and NUE with less environmental cost and should be regarded as the economically optimal N rate on the semiarid western Loess Plateau of China for sustainable maize production.

1. Introduction

Water and nitrogen (N) availability are of great importance for crop productivity in dryland. China has a large area of dryland in the northwest of the country accounting for approximately 56% of the nation’s total land area, of which a large part is situated on the Loess Plateau [1,2,3]. The southeast monsoon dominates the Chinese western Loess Plateau, with dry and cold winters and hot and humid summers [4,5,6,7]. Frequent drought is the primary factor causing agroecosystem vulnerability on the western Loess Plateau [4,5,6,7]. Limited and erratic precipitation are the major factors limiting agricultural productivity in this region [8,9,10]. Therefore, maximizing water use efficiency (WUE) is very important to improve crop yield [11,12,13]. How to improve crop water use efficiency is a hot issue, and scientists have conducted a lot of research on it. Some studies have shown that cultivars [14], tillage practices [2,13], fertilizer application [15,16], and mulching practices [4,8,17] affect crop WUE, which offers an opportunity to increase crop yield in semiarid regions through optimizing farming systems.
Plastic film mulching is a fairly frequent approach in rainfed agriculture in Northwest China [4,13,17]. Because the use of plastic films can boost land productivity by reducing climatic change, enhancing growth conditions, and extending the growing season, the double ridges and furrows mulched with plastic film systems (DRFM) are an effective technique for capturing and storing out-of-season water that has resulted in significant increases in yield and WUE due to its superior ability to collect rainwater [18,19]. Maize has become a dominating crop in dryland on the western Loess Plateau [8,20] as a result of broad application of the DRFM during the last decade [4,13,21]. However, in addition to increasing yield and WUE, maize production under DRFM is also associated with some environmental problems, of which soil water depletion and the formation of dried soil layers resulting from the intensive production of crops with high yielding under plastic mulching attract the most concern [12,13,20,21,22]; in the long run, it may be difficult to maintain high yield and WUE continuously. However, under DRFM, information on the depletion of soil water in response to maize yield level is scanty.
Chemical fertilization, especially N fertilizer, is an important way to increase crop yield [12]. Available crop N is always regulated by the amount of available water in the soil, so drought and nitrogen deficiency always occur simultaneously in drylands [23]. Another way to increase grain yield is to increase the application of N fertilizer. To achieve high grain yield, excessive N fertilizer has been widely applied in China, especially in the Loess Plateau [14,24]. According to reports, China’s excessive and inefficient use of chemical fertilizers—which has increased threefold in the last three decades, with crop N recovery efficiency averaging 32 percent compared to the world average of 55 percent—has contributed to the country’s current harmful state of environmental pollution, including greenhouse gas emissions [25,26,27] and ammonia volatilization [28,29]. However, the improvements in grain yield were not proportional to increases in N fertilizer input [14,30,31,32,33], thereby resulting in low nitrogen use efficiency (NUE) and economic return and excess nitrate residue [34,35,36]. However, how to apply nitrogen fertilizer to ensure high WUE and NUE with less environmental cost is the most concerning issue in the green production of maize. In this region, there are few systematic studies on the response of WUE, NUE, and soil water balance, and of nitrogen residue to the application amount of nitrogen fertilizer in maize under DRFM. Therefore, further research is needed to better understand how to manage the trade-offs between yield, WUE, economic return, soil water balance, and nitrogen residue for maize production in rainfed areas using a fully mulched ridge–furrow system in the rainfed Loess Plateau. It was hypothesized that (1) the high N rate increases maize grain yield, economic return, and WUE but depletes the soil water; and (2) the high N rate reduces NUE of maize and increases nitrate nitrogen residue.

2. Materials and Methods

2.1. Site Description

The field experiment was conducted at the Rainfed Agricultural Experimental Station of Gansu Agricultural University in Aning County, Dingxi city, Gansu Province, China (35°28′ N, 104°44′ E and elevation 1971 m) from October 2011 to October 2018. According to Chinese soil taxonomy, the soil is Huangmian, which is a Calcaric Cambisol (FAO 1990) [5,13]. At the experimental site, the long-term average annual precipitation is 390 mm. The yearly evaporation of the pan is 1531 mm. The average frost-free period is 140 days, with an annual cumulative temperature of 2239 °C, annual radiation of 5929 MJ m−2, and 2477 h of sunshine. Precipitation during the research period was presented in Table 1. The top 0−20 cm soil collected from the experimental site in April 2012 had 1.21 g cm−3 bulk density, 0.256 cm3 cm−3 field capacity, 0.085 cm3 cm−3 wilting point, 8.4 pH, 10.1 g kg−1 soil organic matter, 1.1 g kg−1 total nitrogen, 18 mg kg−1 available phosphorus, and 156 mg kg−1 available potassium.

2.2. Experimental Design

The experiment was set up as a randomized complete block design with three replicates and four N treatments: N0 (no N fertilizer applied), low N rate (N100, 100 kg N ha−1), medium N rate (N200, 200 kg N ha−1), and high N rate (N300, 300 kg N ha−1). The most prevalent farmer practice in the area is to apply 300 kg N ha−1 of nitrogen. For the seven growing seasons, the plots with varied N application rates were located in the same location. Each plot was 44.0 m2 (4.4 m × 10 m). Plastic mulching is arranged alternately by large ridges (10 cm high × 70 cm wide) and small (15 cm high × 40 cm wide) ridges, and all ridges and furrows were mulched with white plastic film (polyethylene film 0.01mm thick, made in Lanzhou Green Garden Corporation of China, Lanzhou) of 120 cm width. Each plot was planted with 8 rows of maize in total. Plastic mulching and planting operations were described in detail in previous study [13].
Nitrogen fertilizer was applied as urea (46% N). Maize (cv. Xianyu 335) was planted under DRFM. Following the application of plastic film over the soil surface, holes (diameter 1.5 cm) were drilled in furrows every 100 cm with a handheld equipment to aid in the collection of rainfall from ridges. Late April was the time for tillage, ridging, and mulching. The fertilization method and the planting density are based on the local conventional fertilization and density for maize production in the area. All treatments received 150 kg P2O5 ha−1 as calcium superphosphate (containing 14% P2O5).All calcium superphosphate and one-half of the total N fertilizer rate was equally dispersed on the soil surface prior to constructing ridges and covering them with plastic film; the remaining one-half of the total N fertilizer rate was applied in holes within the plastic film at the six-leaf collar (V6). The spacing of maize in the row was 35 cm with a target plant density of 52,500 plants ha−1; maize was sown in early May and harvested in early October. This experiment was conducted with a continuous corn-cropping system. During harvest, all maize residue was removed from plots, and the soil was covered with plastic film until soil preparation the following spring. During the trial, there were no diseases or pests that affected the crops. The growth of maize in the 2017 growing season was hampered by hail damage during the 10-leaf collar stage.

2.3. Sampling and Measurements

2.3.1. Precipitation and Drought Index

An automatic weather station at the experimental site was used to collect daily precipitation data. According to the phases of maize growth in each year, annual and in-crop rainfall were measured and reported (Table 1). The drought index (DI) for precipitation was developed using the following equation to examine variance and status in yearly precipitation across the seven growing seasons:
D I = ( P M ) / σ
where p is annual precipitation in each year, M is the average annual precipitation, and σ is the standard deviation for annual rainfall. The DI classed years as wet (DI > 0.5), normal (−0.5 ≤ DI ≤ 0.5), and dry (DI < −0.5).

2.3.2. Soil Water Content

Soil water content of each plot was measured in October 2011 (i.e., initial value) and at sowing and maize physiological maturity (R6) every year from the 0–5, 5–10, 10–30, 30–50, 50–80, 80–110, 110–140, 140–170, and 170–200 cm soil depth layers. Soil water content at 0–30 cm depth was measured by oven-drying method [13], and the soil water content from 30–200 cm depth was measured using with a Trime-Pico IPH (Precise Soil Moisture Measurement, IMKO Micromodul technik GmbH, Ettlingen, Germany). The soil moisture in each plot was measured only once for each measurement. Soil water storage and soil water balance were calculated according to previous studies [6,7,12]. The soil water storage (SWC) and soil water balance (△SWC) were calculated as:
S W C = ( S D × R × W i ) × 100
S W C = S W C p S W C h
where SWC, SD, R, and Wi are soil water storage (mm), soil depth (m), soil bulk density (g cm−3), and soil water content at different depths (%), respectively. △SWC, SWCp, and SWCh are the soil water balance (i.e., the change of soil water storage within the soil profile), soil water storage in October 2011, and soil water storage at harvest in October 2018.

2.3.3. Soil Nitrate Nitrogen Measurement

To determine soil nitrate N residue, three soil cores were obtained at random within each plot in April of the first study year (2012) and October 2018. Soil samples were taken from the 0–5, 5–10, 10–30, 30–50, 50–80, 80–110, and 110–140 cm soil depths in each plot using an auger (4.5 cm inner diameter). Soil samples were air-dried, powdered, and sieved at 2.0 mm intervals. A FIAstar 5000 Analyzer (FOSS Tecator, Höganäs, Sweden) was used to determine soil nitrate N concentration and subsequently calculate soil nitrate N residue. Soil nitrate N residue (SNR) was calculated as:
S N C = ( S D × R × S N )   /   10
S N R = S N C p S N C h
where SNC, SD, R, and SN are soil nitrate N content (mg kg−1), soil depth (m), soil bulk density (g cm−3), and soil nitrate N concentration at different depths (mg kg−1), respectively. The SNR, SNCp, and SNCh are soil nitrate N residue (kg ha−1), soil nitrate N content in April 2012, and soil nitrate N content at harvest in October 2018.

2.3.4. Leaf Area Index and Photosynthetic Measurements

For the leaf area, five plants were tagged every plot, and leaf area was measured at the 6-leaf collar stage (V6), 10-leaf collar stage (V10), silking stage (R1), and milking (R3) in 2014−2016. The width (W, m) and maximum length (L, m) of each leaf were measured by a ruler. Then, leaf area index (LAI, m2 m−2) was calculated based on the equations as follows [14,37]:
L A I = i = 1 n ( L i × W i × 0.75 D )
where n is the total numbers of leaves for each plant, 0.75 is the leaf area coefficient of maize, D is the area occupied by each plant (m2 plant−1).
Using a LI-6400 portable photosynthesis equipment (LI-COR Inc., Lincoln, NE, USA) at the V6, V10, R1, and R3 stages in 2017 and 2018, photosynthetic parameters, including net photosynthetic rates and transpiration rate, were measured from the highest fully expanded leaf before silking and ear leaf after silking. At the same time, three ear leaves per plot were sampled at R1 to determine leaf dry weight, N concentration, and leaf N content (mol N m−2). Photosynthetic-WUE (i.e., transpiration efficiency; μmol CO2 mmol−1 H2O) was calculated by dividing net photosynthetic rate by transpiration rate [38]. Photosynthetic-NUE (μmol CO2 mol−1 N s−1) was calculated by dividing net photosynthetic rate divided by N content per unit leaf area (mol N m−2) [39].

2.3.5. Yield

At physiological maturity, maize was harvested manually from an area of 13.2 m2 (6 m × 2.2 m) per plot in the undisturbed central area. All treatments have the same density, so the harvested plants are the same in each treatment; grain yield and aboveground biomass yield were measured after air drying. In addition, ten plants were randomly selected to investigate the number of grains per ear, grains per row, and rows.

2.3.6. Water and Nitrogen Use Efficiency, Economic Return

Harvest index (HI) and WUE were calculated as:
H I = G Y B Y
W U E b = B Y E T
W U E g = G Y E T
where GY is grain yield (kg ha−1), BY is biomass yield (kg ha−1), WUEb is water use efficiency for biomass (kg mm−1 ha−1), WUEg is water use efficiency for grain yield (kg mm−1 ha−1), and ET is evapotranspiration and is calculated by the formula of soil water balance equation in farmland [5,12,13]. As the groundwater table remained at a depth of about 16−40 m below the surface, upward flow into the root zone was negligible, and drainage out of the root zone was not considered. Soil water balance was calculated by the difference in soil water storage between initial value from the beginning of the experiment (i.e., October 2011) and the end of the experiment (October 2018) [13].
ET = SWCs + RgSWCh
where SWCs is the soil water storage at sowing (mm), Rg is the seasonal rainfall (mm), SWCh is the soil water storage at harvest (mm).
In 2015 and 2016, three plants from every plot were sampled at physiological maturity; the aboveground biomass was separated into vegetative components and grain for determining aboveground N accumulation, nitrogen harvest index (NHI), crop nitrogen recovery efficiency (REN), and agronomic use efficiency of nitrogen fertilizer (AE). Plant N content was determined by Kjeldahl method. Agronomic use efficiency of N fertilizer (AEN) is defined as the increase in maize grain yield per unit of fertilizer N applied and was calculated as [14,40,41,42,43]:
A E = Y n Y 0 N x
where Yn and Y0 are grain yields in the fertilized plot and in the non-N-applied plot (kg ha−1), respectively, and Nx is the amount of N fertilizer applied (kg N ha−1).
Crop N recovery efficiency (REN) from application of N fertilizer was calculated using the following Equation
R E N ( % ) = 100 × N x N 0 N x
where Nx is the N uptake from the fertilized plot (kg ha−1), N0 is the N uptake from the non-N-applied plot (kg ha−1).
The difference between economic return from products (such as grain yield and pasture) and production costs from agricultural inputs (such as labor, materials, and machinery) was used to calculate the net economic return [13,40].

2.4. Data Analysis

The MIXED SAS program was used to perform statistical analysis using a p value of 0.05 (SAS Institute, Inc., Cary, NC, USA). All dependent variables were subjected to an analysis of variance. The effects of N rate and their interaction were treated as fixed effects, whereas replication, year, and its interactions were treated as random effects. Fisher’s protected least-significant-difference test was used to assess differences between means. For generating the maize yield response curve to the rate of N application, the quadratic or linear plateau models was used to regression analysis to identify the best-fit curve.

3. Results

3.1. Weather Condition

For the seven experimental years, annual rainfall ranged from 335 mm in 2015 to 472 mm in 2018, and the rainfall during the growing season ranged from 233 mm in 2016 to 423 mm in 2013 (Table 1). Compared with the long-term average of 389 mm (1970–2011), the annual rainfall in 2014 (389 mm) and 2017 (361 mm) were in similarity, but it was wetter in 2012 (433 mm), 2013 (466 mm), and 2018 (472 mm) and drier in 2015 (335 mm) and 2016 (319 mm). The seasonal rainfall was parallel to the annual rainfall pattern.

3.2. Soil Water Balance

Soil water content, soil water balance, soil nitrate N content, and the amount of nitrate nitrogen residue were significantly affected by N rates (Figure 1 and Figure 2). Soil layers between 0–50 cm contributed to an increase in soil water content (Figure 1). Increased N application rates resulted in a decrease in soil water content. Compared to soil water content in April 2012 (i.e., initial value), over the seven growing seasons, soil water storage was not significantly different under N100, but N0 significantly increased soil water replenishment by 52.1 mm and treatments of N200 and N300 significantly depleted soil water storage by 72.9 and 109.2 mm, respectively. Soil layers from 50–210 cm showed the greatest change in soil water content. In the 0–50 cm soil layers, the change in soil water was 12.5, 1.7, −11.9, and −11.1 mm for N0, N100, N200, and N300, respectively; in the 50–210 cm soil layers, the change was 35.2, 7.3, −35.4, and −60.1 mm; in the 210–300 cm soil layers, the change was 4.4, −9.5, −25.5, and −38.0 mm, respectively. Over the seven growing seasons, compared to soil water storage under N0, soil water storage decreased by 52.5, 125.0, and 161.3 mm under N0, N100, N200, and N300, respectively.

3.3. Soil Nitrate Nitrogen Residue

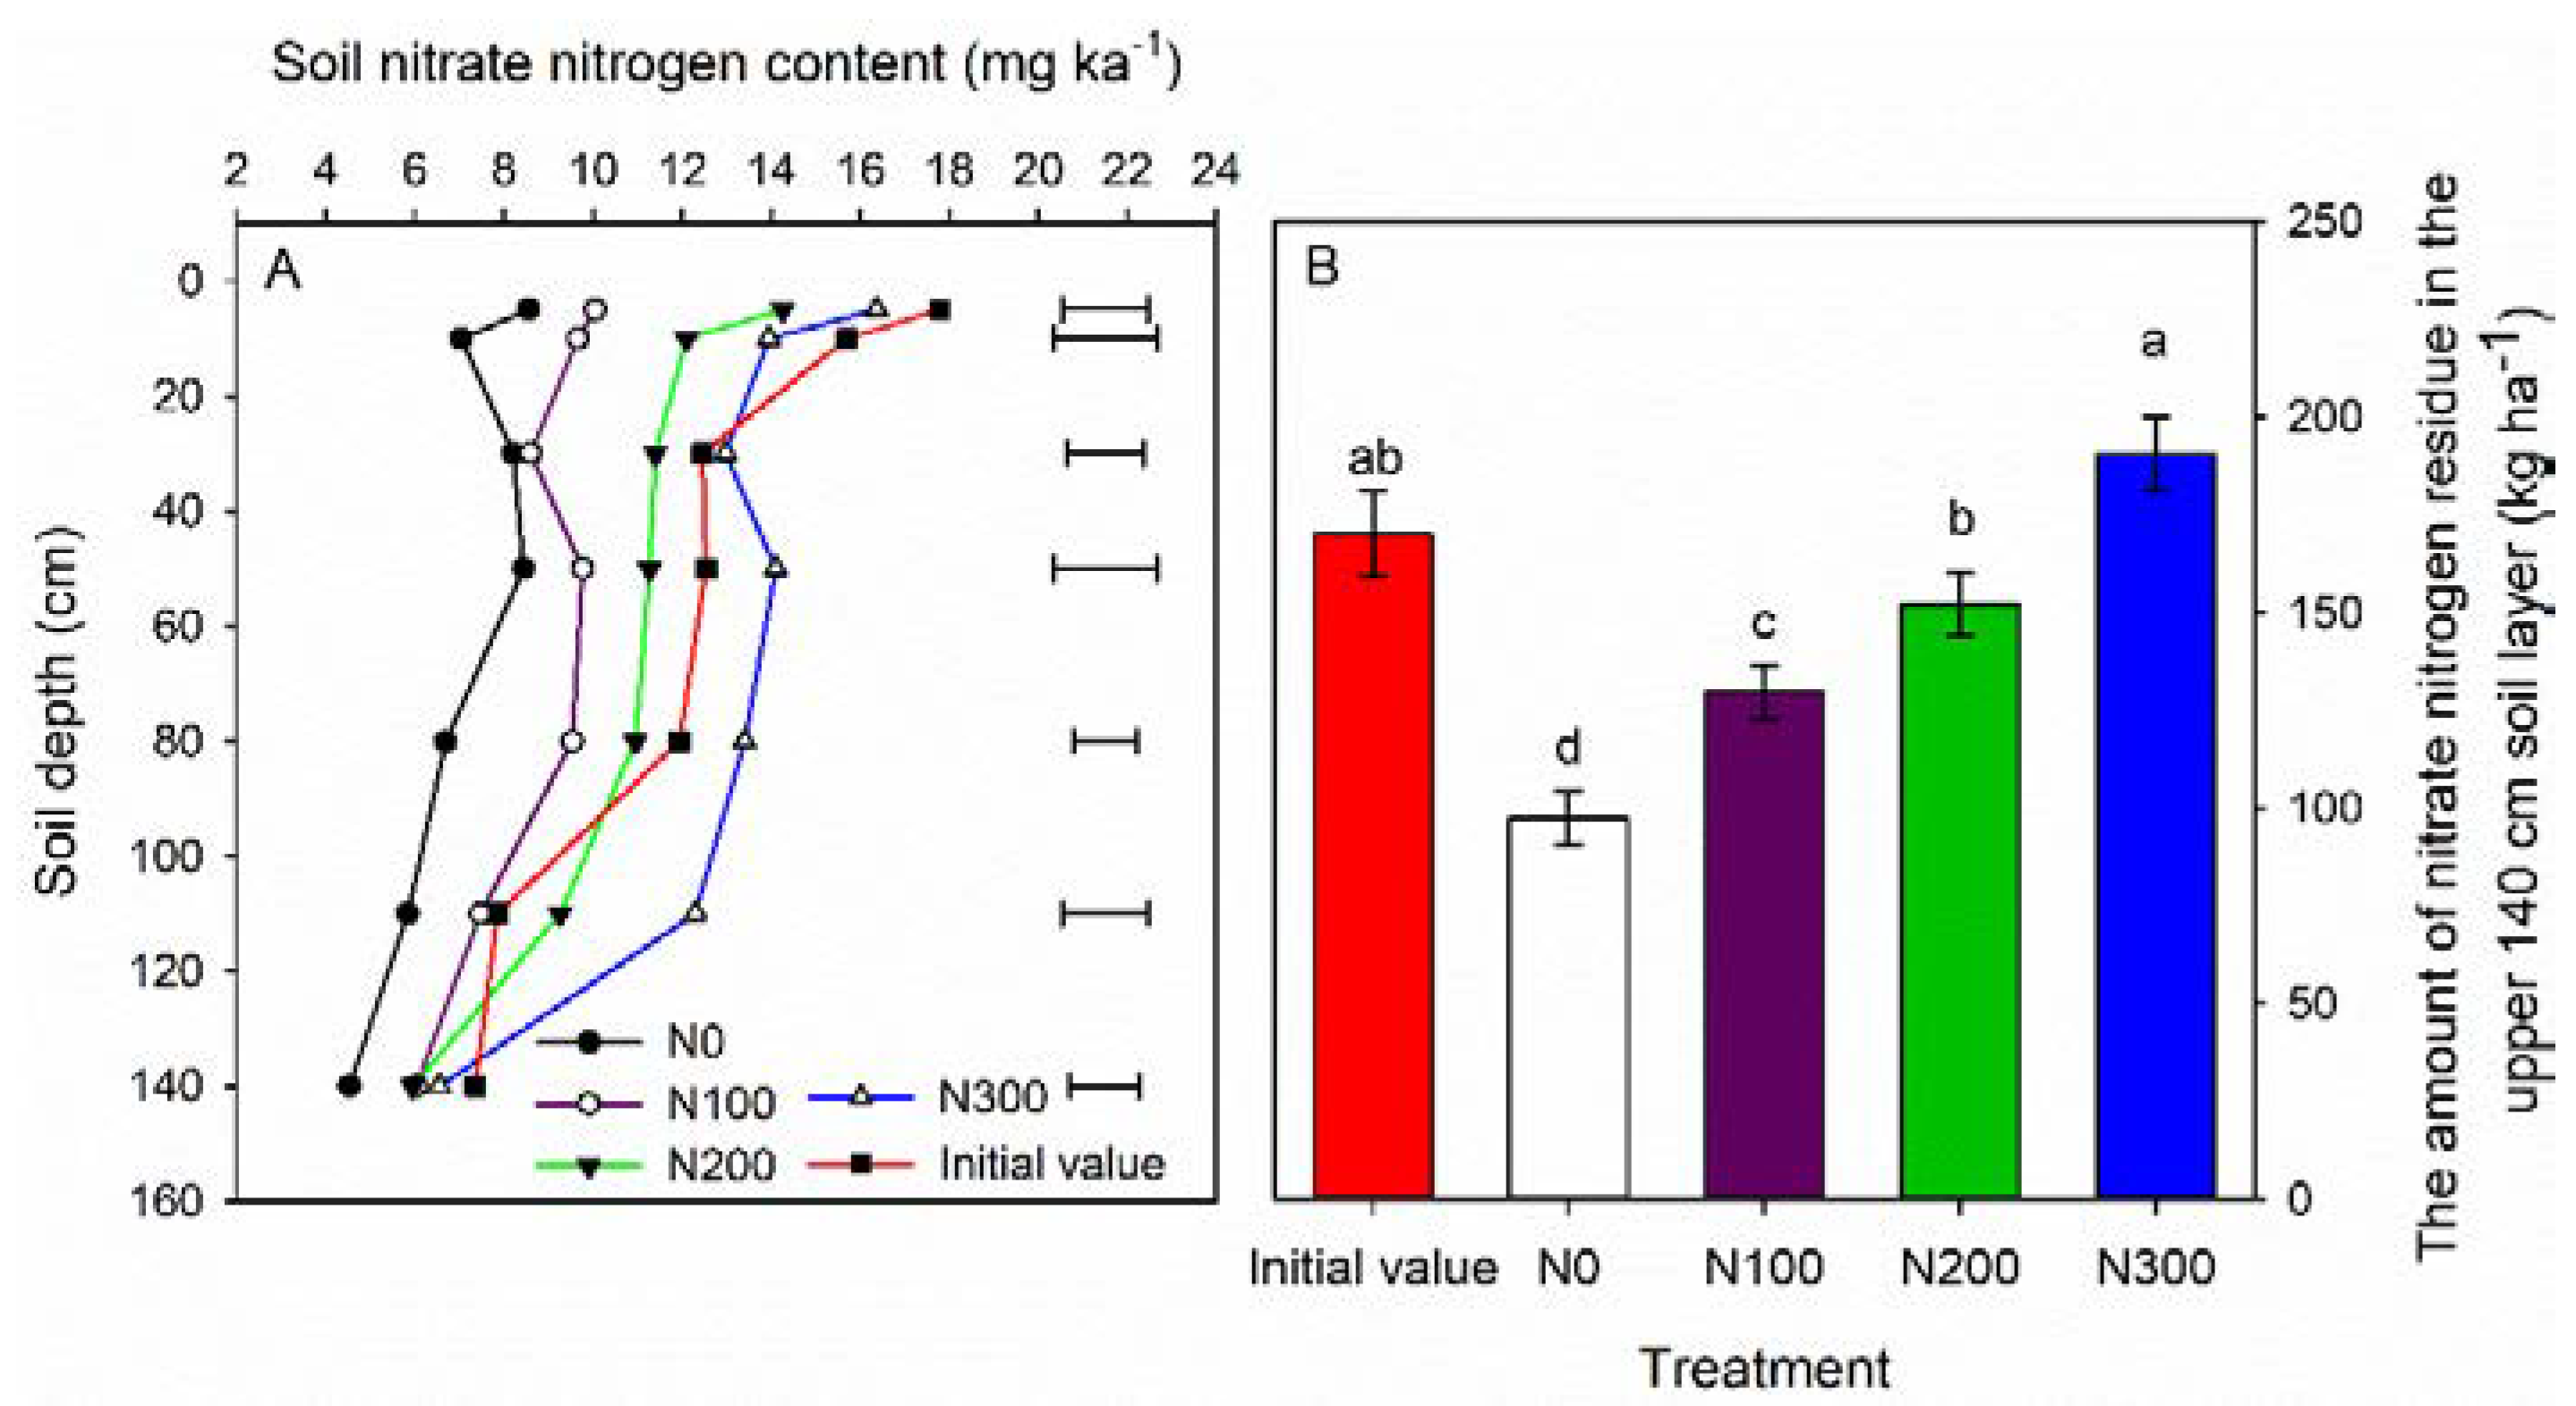
Soil nitrate N content decreased with soil depth (Figure 2). Soil nitrate N concentration increased with increasing N application rate. Over the seven growing seasons, N0 and N100 significantly decreased soil nitrate N by 72.6 and 40.4 kg ha−1, respectively, compared to the initial value in April 2012, while soil nitrate N in October 2018 decreased slightly by 18.1 kg ha−1 under N200 and increased slightly by 20.2 kg ha−1 under N300, respectively, when compared to the initial value. After seven years of experiment (October 2018), Compared to N0, N100, N200, and N300 increased soil nitrate N by 32.2, 54.5, and 92.8 kg ha−1, respectively.

3.4. Leaf Area Index, Net Photosynthetic Rate, and Water Use Efficiency at the Leaf Level

N fertilization significantly increased the leaf area index at the 10-leaf collar, silking, and milk stages of maize in all years [34]; the highest and lowest leaf area index were found under N300 and N0 at all stages of development, respectively. On average, leaf area index in N fertilization treatments was 41% higher than that of the non-N fertilization. The photosynthetic rate increased first and then decreased with the growth stage, but water use efficiency at the leaf level increased gradually (Figure 3). In 2017, N300 significantly increased the net photosynthetic rate at all three growth stages compared with the other treatments (i.e., N100, N200, and N300). However, N200 increased the net photosynthetic rate only at the 6-leaf collar stage of corn and the milk phase of maize, and N100 increased the net photosynthetic rate only at the 6-leaf collar phase of maize and the 10-leaf collar phase of maize in 2018. Overall, N fertilization significantly increased the water use efficiency at the leaf level. In both 2017 and 2018, the N0, N200 and N300 treatments significantly increased leaf-level water use efficiency at all three stages, but the N100 treatment increased leaf-level water use efficiency only at the six-leaf collar stage of maize.

3.5. Nitrogen Uptake Leaf Nitrogen Concentration, NHI, REN, and PNUE

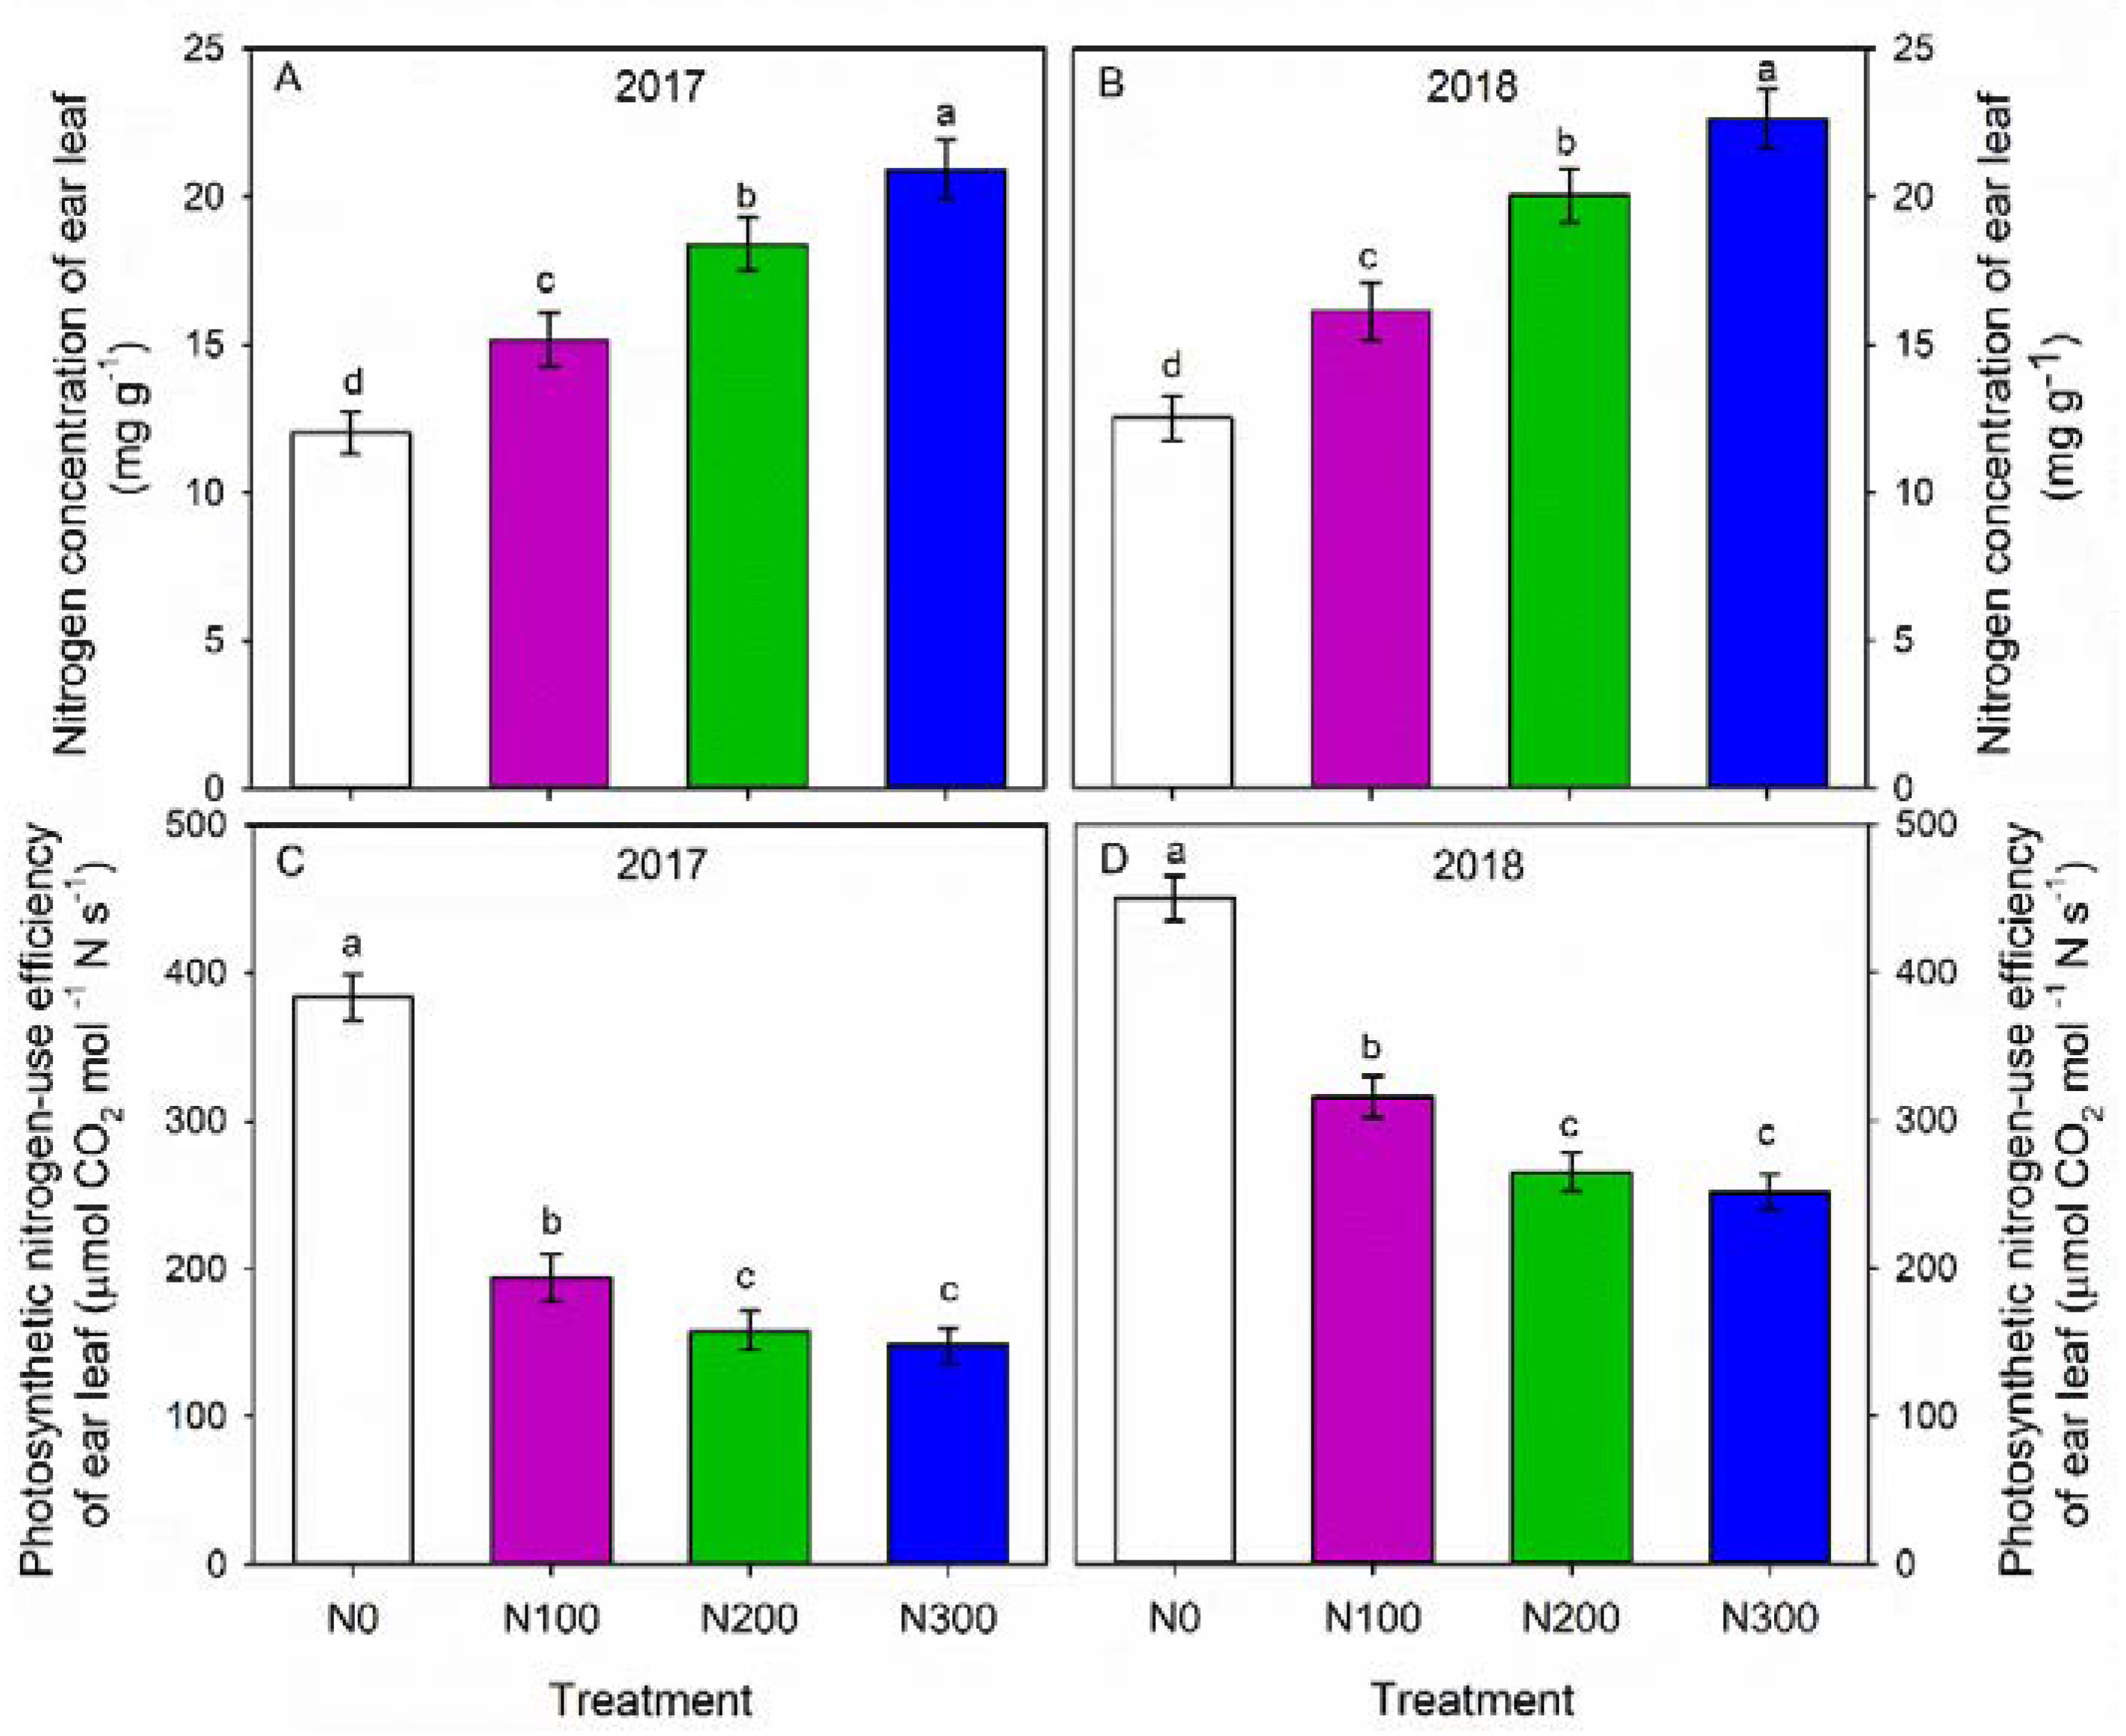
Averaged across the two growing seasons, total aboveground N accumulation ranged from 41.3 to 127.4 kg ha−1 and varied with N rate. Compared to N0, the N100, N200, and N300 treatments significantly increased vegetative components’ N content by 16.6, 23.5, and 34.8 kg ha−1 and grain N content by 80, 141, and 186%, respectively. Total aboveground N accumulation was increased by 93, 151, and 208% under treatments of N100, N200, and N300, respectively, compared to N0. Nitrogen harvest index was also significantly affected by N rates, the greatest N harvest index was found under N0, followed by N200, N100, and N300. With the increasing rate of nitrogen fertilization, the crop N recovery efficiency (REN) declined significantly (Table 2). Furthermore, nitrogen concentration of the ear leaf was also significantly affected by N rates; the greatest nitrogen concentration of the ear leaf was found under N300, followed by N200, N100, and N0. However, with the increasing rate of nitrogen fertilization, the photosynthetic nitrogen use efficiency of the ear leaf (PNUE) declined significantly (Figure 4).

3.6. Biomass Accumulation and Grain Yield

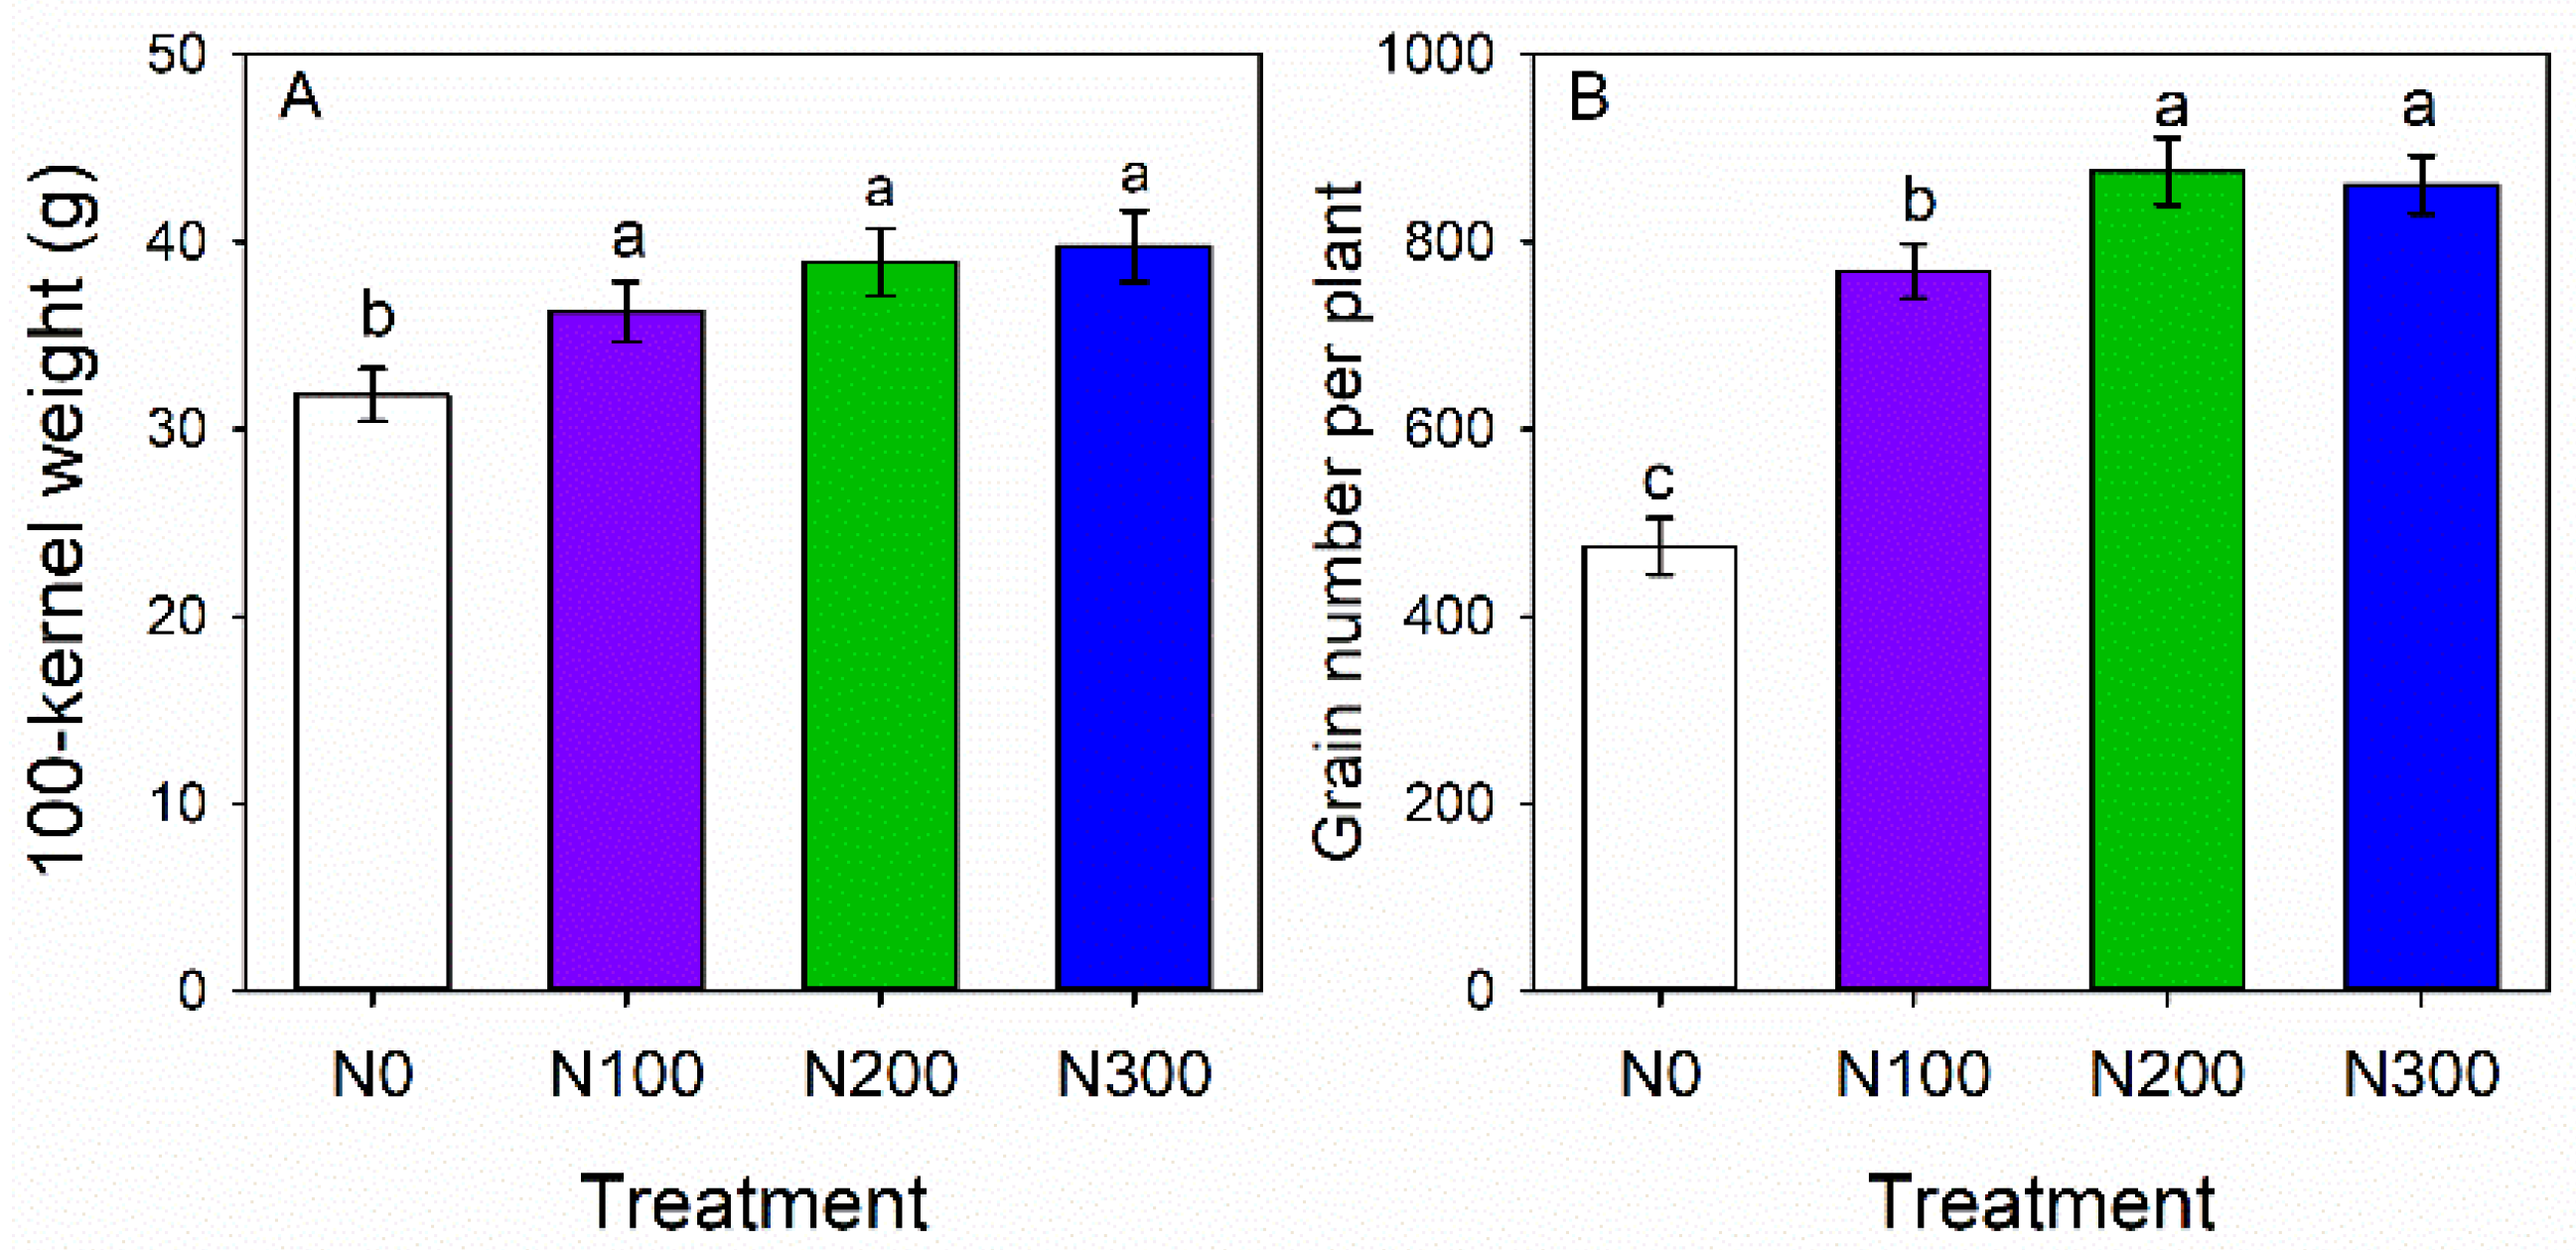
Nitrogen fertilization significantly increased 100-kernel weight and grain number per plant (Figure 5). The increase in 100-kernel weight was not significantly different among N100, N200, and N300. Grain number per plant in N200 was significantly greater than in N100 but was not different than N300.
Biomass accumulation and grain yield varied with N rate (Table 3). On average, biomass accumulation ranged from 9892 to 20,715 kg ha−1, grain yield ranged from 3497 to 7523 kg ha−1. Compared to N0, biomass accumulation was significantly increased by 52, 104, and 109% under treatments of N100, N200, and N300, respectively. Grain yield under treatments of N100, N200, and N300 was significantly greater by 56, 110, and 115% than that in N0, respectively. Harvest index was only significantly increased under N200.
Biomass accumulation, grain yield, and harvest index were significantly affected by N rates and growing seasons (Figure 6 and Table 3). Regardless of N rates, biomass accumulation ranged from 6678 to 23,569 kg ha−1 and grain yield ranged from 2067 to 8506 kg ha−1. Biomass accumulation and grain yield were parallel to the annual rainfall pattern, except for 2017 (rare hail damage). In dry years, on average compared to N0, treatments of N100, N200, and N300 significantly increased biomass accumulation by 40, 88, and 119% and grain yield by 39, 100, and 118%, respectively; in normal years, biomass accumulation under treatments of N100, N200, and N300 was significantly greater by 53, 101, and 110% than under N0, respectively; grain yield was significantly higher by 51, 120, and 128% than under N0, respectively; in wet years, on average, compared to N0, biomass accumulation was significantly increased by 56, 117, and 109% on average under N100, N200, and N300, respectively; grain yield was increased by 67, 132, and 134%, respectively (data not shown). In particular, the increase in grain yield was not significant when the N fertilizer rate exceeded 200 kg N ha−1 (Figure 6 and Table 3).

3.7. Evapotranspiration and Water Use Efficiency

Evapotranspiration and WUE were significantly affected by N rates (Table 4). Increase in the application of N dosage improved evapotranspiration, WUEb, and WUEg. Over the seven growing seasons, ET was increased by 8 (p > 0.05), 18, and 23 mm (p < 0.05) under N100, N200, and N300 compared to N0, respectively. WUEb was increased by 49, 93, and 95 percent at N100, N200, and N300, respectively, compared to N0; WUEg was significantly increased by 52, 99, and 101 percent at N100, N200, and N300, respectively, compared to N0.
Evapotranspiration and WUE were also significantly affected by growing seasons (Table 4). Regardless of N rates, ET ranged from 238 to 428 mm for the experimental years, WUEb ranged from 21.3 to 67.5 kg ha−1 mm−1, and WUEg ranged from 6.6 to 25.5 kg ha−1 mm−1. WUEb was highest in the 2014 and 2015 seasons, followed by the 2018, 2012, 2016, and 2013 seasons, and was lowest in 2017. However, the highest WUEg was found in the 2014 and 2015 seasons, followed by the 2012, 2016, 2013, and 2018 seasons, and was lowest in 2017 season.

3.8. Agronomic Use Efficiency of N Fertilizer and Economic Return

Agronomic use efficiency of N fertilizer varied with by N rates (Table 4). On average, AE ranged from 19.5 to 13.4 kg grain kg−1 N and decreased as the N rate increased. Agronomic use efficiency of N fertilizer also varied by growing season (Table 4). Agronomic use efficiency of N fertilizer was not parallel to the annual rainfall pattern. Regardless of N rates, on average, the greatest AE was found in 2012 and 2018 seasons, followed by 2013–2016, and it was lowest in 2017. In dry years, AE was 13.2, 16.7, and 13.2 kg grain kg−1 N; in normal years, AE was 21.4, 25.4, and 18.1 kg grain kg−1 N; in wet years, AE was 25.9, 25.5, and 17.2 kg grain kg−1 N (data not shown).
N rates and growing seasons had a significant effect on revenue, net economic return, and revenue-to-production cost ratios (Table 5). Revenue increased with N application rate and ranged from 10,831 to 22,961 CNY ha−1 yr−1. The N application rate increased the net economic return, which ranged from −18 to 11070 CNY ha−1 yr−1. Similarly, the higher N application rate, the higher revenue-to-production costs. With each growing season, revenue, net economic return, and the revenue-to-production cost changed (Table 5). Regardless of N rates, on average, revenue ranged from 26,050 to 6900 CNY ha−1 yr−1 for the experimental years, and net economic return ranged from −4471 to 14,679 CNY ha−1 yr−1. The year with the highest revenue, net economic return, and revenue-to-production cost ratio was 2012, followed by 2014, 2018, 2015, 2013, and 2016, and the year with the lowest income, net economic return, and revenue-to-production cost ratio was 2017. Treatments with N100, N200, and N300 increased net economic return by 61, 124, and 119 percent in rainy years, 52, 110, and 119 percent in normal years, and 40, 94, and 118 percent in dry years, respectively, when compared with N0 (data not shown). In particular, the increase in net economic return was not significant when the N fertilizer rate exceeded 200 kg N ha−1 (Figure 6 and Table 5).

4. Discussion

Overall, this result shows that a negative value of annual soil water balance is generated under high yield with high N rate, resulting in the depletion of soil water in the deep soil layer, which approves our hypothesis, consistent with the previous study [22], mainly because high biomass accumulation and leaf area increased water demand for maize growth and subsequently enhanced water uptake from the soil profile. It is likely because the increased N fertilization increased crop root growth in the subsoil [12], which could be beneficial in environments susceptible to late-season or terminal drought because roots in deeper layers of the soil profile can extract water available below ground at great depth [12,44,45], which increases soil water uptake in deep soil layers and improves ET [12,15]. Consistent with previous studies, long-term medium and high N application rates decreased soil water in deep soil layers [12,13,15]. However, our results do not agree with another study [4], mainly because their study was conducted with low planting density (47,500 plants ha−1); the variance could be due to different planting densities and different methods of calculating soil water balance. Under low planting densities, soil water use would be lower than that under high planting densities. In addition, since most rainfall in this region occurs from July to September, as a result, soil moisture is usually higher at harvest time than at sowing. Therefore, the calculation of soil water balance based on the difference of soil water storage at the time of sowing and harvesting may not reflect the actual soil water depletion. Therefore, the application rate of 100 kg N ha−1 may be beneficial to maintain soil water balance on the semiarid western Loess Plateau.
Photosynthesis is the basis of plant growth, and improving photosynthesis can contribute toward greater biomass accumulation [46]. While photosynthesis also acclimates to the growth, the degree of acclimation is generally greater when the N supply is low and can disappear when the N supply is adequate [47]. Photosynthetic NUE is an important tool to improve the inherent variation in photosynthetic capacity, which increases if more leaf N content is allocated to Rubisco [48]. Increasing N supply to a crop drives the production of a greater canopy growth (i.e., leaf area index) with the potential for higher light interception and photosynthesis [29,49,50], leading to increased production of dry matter [12,14,51,52,53]. However, when application of N fertilizer exceeds the demand of crop N (I.e., 200–300 kg N ha−1), it results in higher soil nitrate-N residue at harvest and less maize N recovery efficiency and agronomic use efficiency of N fertilizer, consistent with previous studies [14,26,54,55]. It is speculated that the reason for the decrease in NUE by high N application is that N in plants is divided into three types, such as photosynthetic N, structural N, and reserve N. High N fertilization significantly increases leaf reserve N content [50] although it also increases leaf photosynthetic N; however, under high N fertilization, the increase in net photosynthetic rate was much less than the increase in leaf N content, thus resulting in significantly decreased leaf photosynthetic NUE, thereby reducing the NUE (i.e., AE).
ET was not significantly increased in this study when N fertilization exceeded 100 kg ha−1, which is consistent with previous studies [12,14,15], mainly because the large canopy development induced aboveground shading [56], resulting in decreased canopy temperature and transpiration rate (date not shown); wheat has shown similar responses [38]. Due to the substantial increase in grain number per plant and 100-kernel weight, high biomass buildup under N supply maximized grain production [12,15]. Under the suitable N fertilizer application rate (i.e.,100–200 kg N ha−1), the increase in yield is far greater than the increase in ET; therefore, 100–200 kg N ha−1 efficiently promoted WUE [12,14,57,58]; notably, the increase in net photosynthetic rate was greater than the increase in transpiration rate under N fertilization treatments, resulting in increased water use efficiency at the leaf level. Similar responses have been reported for wheat [12,38,59]. However, 300 kg N ha−1 did not constantly increase yield compared to 200 kg N ha−1; in contrast, 300 kg N ha−1 applying reduced HI. Therefore, WUE under 300 kg N ha−1 was similar with 200 kg N ha−1. These results suggest that high N rate is not very efficient in producing high grain yield and WUE. Similar responses have been reported for wheat [12] and maize [14,15].
In this study, greater agronomic use efficiency of N fertilizer was observed in our study compared to the other study by Qiang et al. [14]. This gap could be due to changes in soil management, as some studies were conducted on the southeastern Loess Plateau without mulching in a rather humid environment (i.e., 550 mm annual precipitation) [14]. This finding shows that mulching with plastic films in a semiarid environment can significantly improve NUE. However, since the growth rates of yield and N fertilizer are different for N200 and N300 treatments, increased nitrogen application (i.e., 300 kg N ha−1) consequently decreased NUE, which is consistent with the findings of other studies [14,26]. Our results further show that at a plant density of 52,500 plants per ha, the amount of N fertilizer less than 200 kg ha−1 may be beneficial to maintain high nitrogen use efficiency on the semiarid western Loess Plateau.
Although N fertilization increased the cost of production for agricultural inputs, the increase in revenue due to higher yields was greater than the cost of production; hence, N fertilization increased the net economic return for maize and the ratio of revenue to cost of production (R/P). The net economic return for maize cultivation in this study ranged from 10,831 to 22,961 RMB ha per year, which is consistent with the results of previous studies in this region using plastic film mulching [13] and without plastic film mulching in northeastern China [60]. Due to low yields and revenues, not applying N fertilizer resulted in the lowest net economic returns. Due to identical yield levels, 300 kg N ha−1 did not significantly increase net economic returns compared to 200 kg N ha−1. Based on the trade-off between yield, economic return, and water and nitrogen use of maize with a fully mulched ridge–furrow system on the semiarid western Loess Plateau, this result indicates that the amount of nitrogen applied should not be higher than 200 kg N ha−1 in this region.

5. Conclusions

Our research shows that high N fertilization (300 kg N ha−1) depleted soil water in deep soil layers, resulting in lower NUE due to lower photosynthetic nitrogen use efficiency of leaves. However, N fertilization of 100–200 kg N ha−1 increased grain yield, WUE, and net economic return and reduced soil nitrogen residues; thus, applying 200 kg N ha−1 is the economically optimal solution to achieve trade-offs among yield, WUE, economic profitability, soil water balance, and nitrogen residues in maize cultivation under fully mulched ridge–furrow cropland on the semiarid western Loess Plateau of China.

Author Contributions

Conceptualization, L.L.; methodology, J.X. and L.W.; software, J.X. and L.W.; validation, J.X., L.W., Z.L. and S.K.F.; formal analysis, Z.L. and H.M.; investigation, J.X. and L.W.; resources, S.K.F. and S.A.; data curation, J.X. and L.W.; writing—original draft preparation, J.X., L.W., L.L. and H.M.; writing—review and editing, J.X., L.W., L.L., S.K.F., S.A. and H.M.; visualization, J.X. and L.W.; supervision, J.X., L.W. and L.L.; project administration, J.X., L.W. and L.L.; funding acquisition, J.X., L.W. and L.L. All authors have read and agreed to the published version of the manuscript.

Funding

This work was supported by the National Key R&D Program of China (Grant No. 2021YFD1900700), the Major Science and Technology Project of Gansu Province (Grant No. 20ZD7NA007), the Fund for Young Postgraduate Supervisors of Gansu Agricultural University (Grant No. GAU-QDFC-2020-03), and the Central Government guides Special funds for Local Science and Technology Development (Grant No. ZCYD-2020-1-2).

Institutional Review Board Statement

Not applicable.

Informed Consent Statement

Not applicable.

Data Availability Statement

Not applicable.

Conflicts of Interest

The authors declare no conflict of interest.

References

  1. Deng, X.P.; Shan, L.; Zhang, H.; Turner, N.C. Improving agricultural water use efficiency in arid and semiarid areas of China. Agric. Water Manag. 2006, 80, 23–40. [Google Scholar] [CrossRef]
  2. Huang, G.; Chen, W.; Li, F. Rainfed Farming Systems in the Loess Plateau of China. In Rainfed Farming Systems; Tow, P., Cooper, I., Partridge, I., Birch, C., Eds.; Springer: Dordrecht, The Netherlands, 2011; pp. 643–669. [Google Scholar]
  3. Yang, X.Y.; Li, P.R.; Zhang, S.L.; Sun, B.H.; Chen, X.P. Long-term-fertilization effects on soil organic carbon, physical properties, and wheat yield of a loess soil. J. Plant Nutr. Soil Sc. 2011, 174, 775–784. [Google Scholar] [CrossRef]
  4. Li, F.M.; Li, X.G.; Javaid, M.M.; Ashraf, M.; Zhang, F. Ridge-furrow plastic film mulching farming for sustainable dryland agriculture on the Chinese loess plateau. Agron. J. 2020, 112, 3284–3294. [Google Scholar] [CrossRef]
  5. Peng, Z.; Wang, L.; Xie, J.; Li, L.; Coulter, J.A.; Zhang, R.; Luo, Z.; Cai, L.; Carberry, P.; Whitbread, A. Conservation tillage increases yield and precipitation use efficiency of wheat on the semi-arid Loess Plateau of China. Agric. Water Manag. 2020, 231, 106024. [Google Scholar] [CrossRef]
  6. Peng, Z.L.; Wang, L.L.; Xie, J.H.; Li, L.L.; Coulter, J.A.; Zhang, R.Z.; Luo, Z.Z.; Kholova, J.; Choudhary, S. Conservation tillage increases water use efficiency of spring wheat by optimizing water transfer in a semi-arid environment. Agronomy 2019, 9, 583. [Google Scholar] [CrossRef] [Green Version]
  7. Wang, L.L.; Xie, J.H.; Luo, Z.Z.; Niu, Y.N.; Coulter, J.A.; Zhang, R.Z.; Li, L.L. Forage yield, water use efficiency, and soil fertility response to alfalfa growing age in the semiarid Loess Plateau of China. Agric. Water Manag. 2021, 243, 106415. [Google Scholar] [CrossRef]
  8. Gan, Y.T.; Siddique, K.H.M.; Turner, N.C.; Li, X.G.; Niu, J.Y.; Yang, C.; Liu, L.P.; Chai, Q. Ridge-furrow mulching systems—An innovative technique for boosting crop productivity in semiarid rain-fed environments. Adv. Agron. 2013, 118, 429–476. [Google Scholar]
  9. Siddique, K.H.M.; Regan, K.L.; Tennant, D.; Thomson, B.D. Water use and water use efficiency of cool season grain legumes in low rainfall Mediterranean-type environments. Eur. J. Agron. 2001, 15, 267–280. [Google Scholar] [CrossRef]
  10. Turner, N.C.; Li, F.M.; Xiong, Y.C.; Siddique, K.H.M. Agricultural ecosystem management in dry areas: Challenges and solutions. Plant Soil 2011, 347, 1. [Google Scholar] [CrossRef] [Green Version]
  11. Li, Y.S.; Wu, L.H.; Zhao, L.M.; Lu, X.H.; Fan, Q.L.; Zhang, F.S. Influence of continuous plastic film mulching on yield, water use efficiency and soil properties of rice fields under non-flooding condition. Soil Till. Res. 2007, 93, 370–378. [Google Scholar] [CrossRef]
  12. Wang, L.L.; Palta, J.A.; Chen, W.; Chen, Y.L.; Deng, X.P. Nitrogen fertilization improved water-use efficiency of winter wheat through increasing water use during vegetative rather than grain filling. Agric. Water Manag. 2018, 197, 41–53. [Google Scholar] [CrossRef]
  13. Xie, J.H.; Wang, L.L.; Li, L.L.; Coulter, J.A.; Chai, Q.; Zhang, R.Z.; Luo, Z.Z.; Carberry, P.; Rao, K.P.C. Subsoiling increases grain yield, water use efficiency, and economic return of maize under a fully mulched ridge-furrow system in a semiarid environment in China. Soil Till. Res. 2020, 199, 104584. [Google Scholar] [CrossRef]
  14. Qiang, S.C.; Zhang, Y.; Fan, J.L.; Zhang, F.C.; Xiang, Y.Z.; Yan, S.C.; Wu, Y. Maize yield, rainwater and nitrogen use efficiency as affected by maize genotypes and nitrogen rates on the Loess Plateau of China. Agric. Water Manag. 2019, 213, 996–1003. [Google Scholar] [CrossRef]
  15. Kim, S.; Dale, B.E. Energy and greenhouse gas profiles of polyhydroxybutyrates derived from corn grain: A life cycle perspective. Environ. Sci. Technol. 2008, 42, 7690–7695. [Google Scholar] [CrossRef] [PubMed]
  16. Li, T.; Liu, J.L.; Wang, S.J.; Zhang, Y.; Zhan, A.; Li, S.Q. Maize yield response to nitrogen rate and plant density under film mulching. Agron. J. 2018, 110, 996–1007. [Google Scholar] [CrossRef] [Green Version]
  17. Yu, Y.Y.; Turner, N.C.; Gong, Y.H.; Li, F.M.; Fang, C.; Ge, L.J.; Ye, J.S. Benefits and limitations to straw-and plastic-film mulch on maize yield and water use efficiency: A meta-analysis across hydrothermal gradients. Eur. J. Agron. 2018, 99, 138–147. [Google Scholar] [CrossRef]
  18. Zhang, X.D.; Kamran, M.; Xue, X.K.; Zhao, J.; Cai, T.; Jia, Z.K.; Zhang, P.; Han, Q.F. Ridge-furrow mulching system drives the efficient utilization of key production resources and the improvement of maize productivity in the Loess Plateau of China. Soil Till. Res. 2019, 190, 10–21. [Google Scholar] [CrossRef]
  19. Zhou, L.M.; Li, F.M.; Jin, S.L.; Song, Y.J. How two ridges and the furrow mulched with plastic film affect soil water, soil temperature and yield of maize on the semiarid Loess Plateau of China. Field Crop. Res. 2009, 113, 41–47. [Google Scholar] [CrossRef]
  20. Zhang, S.L.; Sadras, V.; Chen, X.P.; Zhang, F.S. Water use efficiency of dryland maize in the Loess Plateau of China in response to crop management. Field Crop. Res. 2014, 163, 55–63. [Google Scholar] [CrossRef]
  21. Liu, C.A.; Jin, S.L.; Zhou, L.M.; Jia, Y.; Li, F.M.; Xiong, Y.C.; Li, X.G. Effects of plastic film mulch and tillage on maize productivity and soil parameters. Eur. J. Agron. 2009, 31, 241–249. [Google Scholar] [CrossRef]
  22. Wang, L.; Zechariah, E.; Fudjoe, S.K.; Li, L.; Xie, J.; Luo, Z.; Cai, L.; Khan, S.; Xu, W.; Chen, Y. Continuous maize cultivation with high nitrogen fertilizers associated with the formation of dried soil layers in the semiarid farmland on the Loess Plateau. J. Hydrol. 2022, 613, 128324. [Google Scholar] [CrossRef]
  23. Plett, D.C.; Ranathunge, K.; Melino, V.J.; Kuya, N.; Uga, Y.; Kronzucker, H.J. The intersection of nitrogen nutrition and water use in plants: New paths toward improved crop productivity. J. Exp. Bot. 2020, 71, 4452–4468. [Google Scholar] [CrossRef] [PubMed]
  24. Dai, J.; Wang, Z.H.; Li, F.C.; He, G.; Wang, S.; Li, Q.; Cao, H.B.; Luo, L.C.; Zan, Y.L.; Meng, X.Y. Optimizing nitrogen input by balancing winter wheat yield and residual nitrate-N in soil in a long-term dryland field experiment in the Loess Plateau of China. Field Crop. Res. 2015, 181, 32–41. [Google Scholar] [CrossRef]
  25. Chen, X.P.; Cui, Z.L.; Vitousek, P.M.; Cassman, K.G.; Matson, P.A.; Bai, J.S.; Meng, Q.F.; Hou, P.; Yue, S.C.; Römheld, V. Integrated soil–crop system management for food security. Proc. Natl. Acad. Sci. USA 2011, 108, 6399–6404. [Google Scholar] [CrossRef] [Green Version]
  26. Cui, Z.L.; Chen, X.P.; Zhang, F.S. Current nitrogen management status and measures to improve the intensive wheat–maize system in China. Ambio 2010, 39, 376–384. [Google Scholar] [CrossRef] [Green Version]
  27. Ju, X.T.; Xing, G.X.; Chen, X.P.; Zhang, S.L.; Zhang, L.J.; Liu, X.J.; Cui, Z.L.; Yin, B.; Christie, P.; Zhu, Z.L.; et al. Reducing environmental risk by improving N management in intensive Chinese agricultural systems. Proc. Natl. Acad. Sci. USA 2009, 106, 3041–3046. [Google Scholar] [CrossRef] [Green Version]
  28. Abdo, A.I.; Shi, D.P.; Li, J.; Yang, T.; Wang, X.F.; Li, H.T.; Abdel-Hamed, E.M.W.; Merwad, A.R.M.A.; Wang, L.Q. Ammonia emission from staple crops in China as response to mitigation strategies and agronomic conditions: Meta-analytic study. J. Clean. Prod. 2020, 279, 123835. [Google Scholar] [CrossRef]
  29. Huang, J.; Xu, C.C.; Ridoutt, B.G.; Wang, X.C.; Ren, P.A. Nitrogen and phosphorus losses and eutrophication potential associated with fertilizer application to cropland in China. J. Clean. Prod. 2017, 159, 171–179. [Google Scholar] [CrossRef]
  30. Hawkesford, M.J. Reducing the reliance on nitrogen fertilizer for wheat production. J. Cereal Sci. 2014, 59, 276–283. [Google Scholar] [CrossRef] [Green Version]
  31. Wang, L.L.; Li, Q.; Coulter, J.A.; Xie, J.H.; Luo, Z.Z.; Zhang, R.Z.; Deng, X.P.; Li, L.L. Winter wheat yield and water use efficiency response to organic fertilization in northern China: A meta-analysis. Agric. Water Manag. 2020, 229, 105934. [Google Scholar] [CrossRef]
  32. Lamptey, S.; Li, L.; Xie, J.; Zhang, R.; Yeboah, S.; Antille, D.L. Photosynthetic response of maize to nitrogen fertilization in the semiarid western loess plateau of China. Crop. Sci. 2017, 57, 2739–2752. [Google Scholar] [CrossRef]
  33. Yue, K.; Li, L.; Xie, J.; Fudjoe, S.K.; Zhang, R.; Luo, Z.; Anwar, S. Nitrogen supply affects grain yield by regulating antioxidant enzyme activity and photosynthetic capacity of maize plant in the loess plateau. Agronomy 2021, 11, 1094. [Google Scholar] [CrossRef]
  34. Guo, L.; Jin, Y.L.; Xiao, Y.; Tan, L.; Tian, X.P.; Ding, Y.Q.; He, K.Z.; Du, A.P.; Li, J.M.; Yi, Z.L. Energy-efficient and environmentally friendly production of starch-rich duckweed biomass using nitrogen-limited cultivation. J. Clean. Prod. 2020, 251, 119726. [Google Scholar] [CrossRef]
  35. Liu, J.L.; Bu, L.D.; Zhu, L.; Luo, S.S.; Chen, X.P.; Li, S.Q. Optimizing plant density and plastic film mulch to increase maize productivity and water-use efficiency in semiarid areas. Agron. J. 2014, 106, 1138–1146. [Google Scholar] [CrossRef]
  36. Li, X.Y.; Gong, J.D.; Gao, Q.Z.; Li, F.R. Incorporation of ridges and furrow method of rainfall harvesting with mulching for crop production under semiarid conditions. Agric. Water Manag. 2001, 50, 173–183. [Google Scholar] [CrossRef]
  37. Yue, K.; Li, L.; Xie, J.; Wang, L.; Liu, Y.; Anwar, S. Tillage and nitrogen supply affects maize yield by regulating photosynthetic capacity, hormonal changes and grain filling in the Loess Plateau. Soil Till. Res. 2022, 218, 105317. [Google Scholar] [CrossRef]
  38. Wang, L.L.; Wang, S.W.; Chen, W.; Li, H.B.; Deng, X.P. Physiological mechanisms contributing to increased water-use efficiency in winter wheat under organic fertilization. PLoS ONE 2017, 12, e0180205. [Google Scholar] [CrossRef] [Green Version]
  39. Friesen, P.C.; Cattani, D.J. Nitrogen use efficiency and productivity of first year switchgrass and big bluestem from low to high soil nitrogen. Biomass Bioenerg. 2017, 107, 317–325. [Google Scholar] [CrossRef]
  40. Metwally, T.; Gewaily, E.; Naeem, S. Nitrogen response curve and nitrogen use efficiency of egyptian hybrid rice. J. Agric. Res. 2011, 37, 73–84. [Google Scholar]
  41. Vanlauwe, B.; Kihara, J.; Chivenge, P.; Pypers, P.; Coe, R.; Six, J. Agronomic use efficiency of N fertilizer in maize-based systems in sub-Saharan Africa within the context of integrated soil fertility management. Plant Soil 2011, 339, 35–50. [Google Scholar] [CrossRef]
  42. Zhang, F.S.; Wang, J.Q.; Zhang, W.F.; Cui, Z.L.; Ma, W.Q.; Chen, X.P.; Jiang, R.F. Nutrient use efficiencies of major cereal crops in China and measures for improvement. Acta Pedologica Sinica 2008, 45, 915–924. [Google Scholar]
  43. Wang, L.L.; Coulter, J.A.; Li, L.L.; Luo, Z.Z.; Chen, Y.L.; Deng, X.P.; Xie, J.H. Plastic mulching reduces nitrogen footprint of food crops in China: A meta-analysis. Sci. Total Environ. 2020, 748, 141479. [Google Scholar] [CrossRef] [PubMed]
  44. Kirkegaard, J.A.; Lilley, J.M.; Howe, G.N.; Graham, J.M. Impact of subsoil water use on wheat yield. Aust. J. Agric. Res. 2007, 58, 303–315. [Google Scholar] [CrossRef]
  45. Palta, J.A.; Chen, X.; Milroy, S.P.; Rebetzke, G.J.; Dreccer, M.F.; Watt, M. Large root systems: Are they useful in adapting wheat to dry environments? Funct. Plant Biol. 2011, 38, 347–354. [Google Scholar] [CrossRef] [PubMed] [Green Version]
  46. Evans, J.R. Improving photosynthesis. Plant physiol. 2013, 162, 1780–1793. [Google Scholar] [CrossRef] [Green Version]
  47. Zhang, S.; Dang, Q.L. Effects of carbon dioxide concentration and nutrition on photosynthetic functions of white birch seedlings. Tree Physiol. 2006, 26, 1457–1467. [Google Scholar] [CrossRef] [Green Version]
  48. Khan, M.I.R.; Iqbal, N.; Masood, A.; Per, T.S.; Khan, N.A. Salicylic acid alleviates adverse effects of heat stress on photosynthesis through changes in proline production and ethylene formation. Plant Signal. Behav. 2013, 8, e26374. [Google Scholar] [CrossRef] [Green Version]
  49. Hirel, B.; Le Gouis, J.; Ney, B.; Gallais, A. The challenge of improving nitrogen use efficiency in crop plants: Towards a more central role for genetic variability and quantitative genetics within integrated approaches. J. Exp. Bot. 2007, 58, 2369–2387. [Google Scholar] [CrossRef]
  50. Pask, A.J.D.; Sylvester-Bradley, R.; Jamieson, P.D.; Foulkes, M.J. Quantifying how winter wheat crops accumulate and use nitrogen reserves during growth. Field Crop. Res. 2012, 126, 104–118. [Google Scholar] [CrossRef]
  51. Dordas, C.A.; Sioulas, C. Dry matter and nitrogen accumulation, partitioning, and retranslocation in safflower (Carthamus tinctorius L.) as affected by nitrogen fertilization. Field Crop. Res. 2009, 110, 35–43. [Google Scholar] [CrossRef]
  52. Ercoli, L.; Lulli, L.; Mariotti, M.; Masoni, A.; Arduini, I. Post-anthesis dry matter and nitrogen dynamics in durum wheat as affected by nitrogen supply and soil water availability. Eur. J. Agron. 2008, 28, 138–147. [Google Scholar] [CrossRef]
  53. Olesen, J.E.; Petersen, B.M.; Berntsen, J.; Hansen, S.; Jamieson, P.D.; Thomsen, A.G. Comparison of methods for simulating effects of nitrogen on green area index and dry matter growth in winter wheat. Field Crop. Res. 2002, 74, 131–149. [Google Scholar] [CrossRef]
  54. Cambouris, A.N.; Zebarth, B.J.; Nolin, M.C.; Laverdière, M.R. Apparent fertilizer nitrogen recovery and residual soil nitrate under continuous potato cropping: Effect of N fertilization rate and timing. Can. J. Soil Sci. 2008, 88, 813–825. [Google Scholar] [CrossRef]
  55. Gao, Y.J.; Li, Y.; Zhang, J.C.; Liu, W.G.; Dang, Z.P.; Cao, W.X.; Qiang, Q. Effects of mulch, N fertilizer, and plant density on wheat yield, wheat nitrogen uptake, and residual soil nitrate in a dryland area of China. Nutr. Cycl. Agroecosys. 2009, 85, 109–121. [Google Scholar] [CrossRef]
  56. Wang, L.L.; Coulter, J.A.; Palta, J.A.; Xie, J.H.; Luo, Z.Z.; Li, L.L.; Carberry, P.; Li, Q.; Deng, X.P. Mulching-induced changes in tuber yield and nitrogen use efficiency in potato in China: A meta-analysis. Agronomy 2019, 9, 793. [Google Scholar] [CrossRef] [Green Version]
  57. Ashraf, U.; Salim, M.N.; Sher, A.; Sabir, S.U.R.; Khan, A.; Pan, S.G.; Tang, X.R. Maize growth, yield formation and water-nitrogen usage in response to varied irrigation and nitrogen supply under semi-arid climate. Turk. J. Field Crop. 2016, 21, 88–96. [Google Scholar] [CrossRef]
  58. Keulen, H.V.; Goudriaan, J.; Seligman, N. Modelling the effects of nitrogen on canopy development and crop growth. In Plant Canopies: Their Growth, Form and Function; Russell, G., Marshall, B., Jarvis, P.G., Eds.; Cambridge University Press: Cambridge, UK, 1989; pp. 83–104. [Google Scholar]
  59. Yan, W.M.; Zhong, Y.Q.W.; Liu, W.Z.; Shangguan, Z.P. Asymmetric response of ecosystem carbon components and soil water consumption to nitrogen fertilization in farmland. Agr. Ecosyst. Environ. 2021, 305, 107166. [Google Scholar] [CrossRef]
  60. Sun, T.; Li, Z.Z. Alfalfa-corn rotation and row placement affects yield, water use, and economic returns in Northeast China. Field Crop. Res. 2019, 241, 107558. [Google Scholar] [CrossRef]
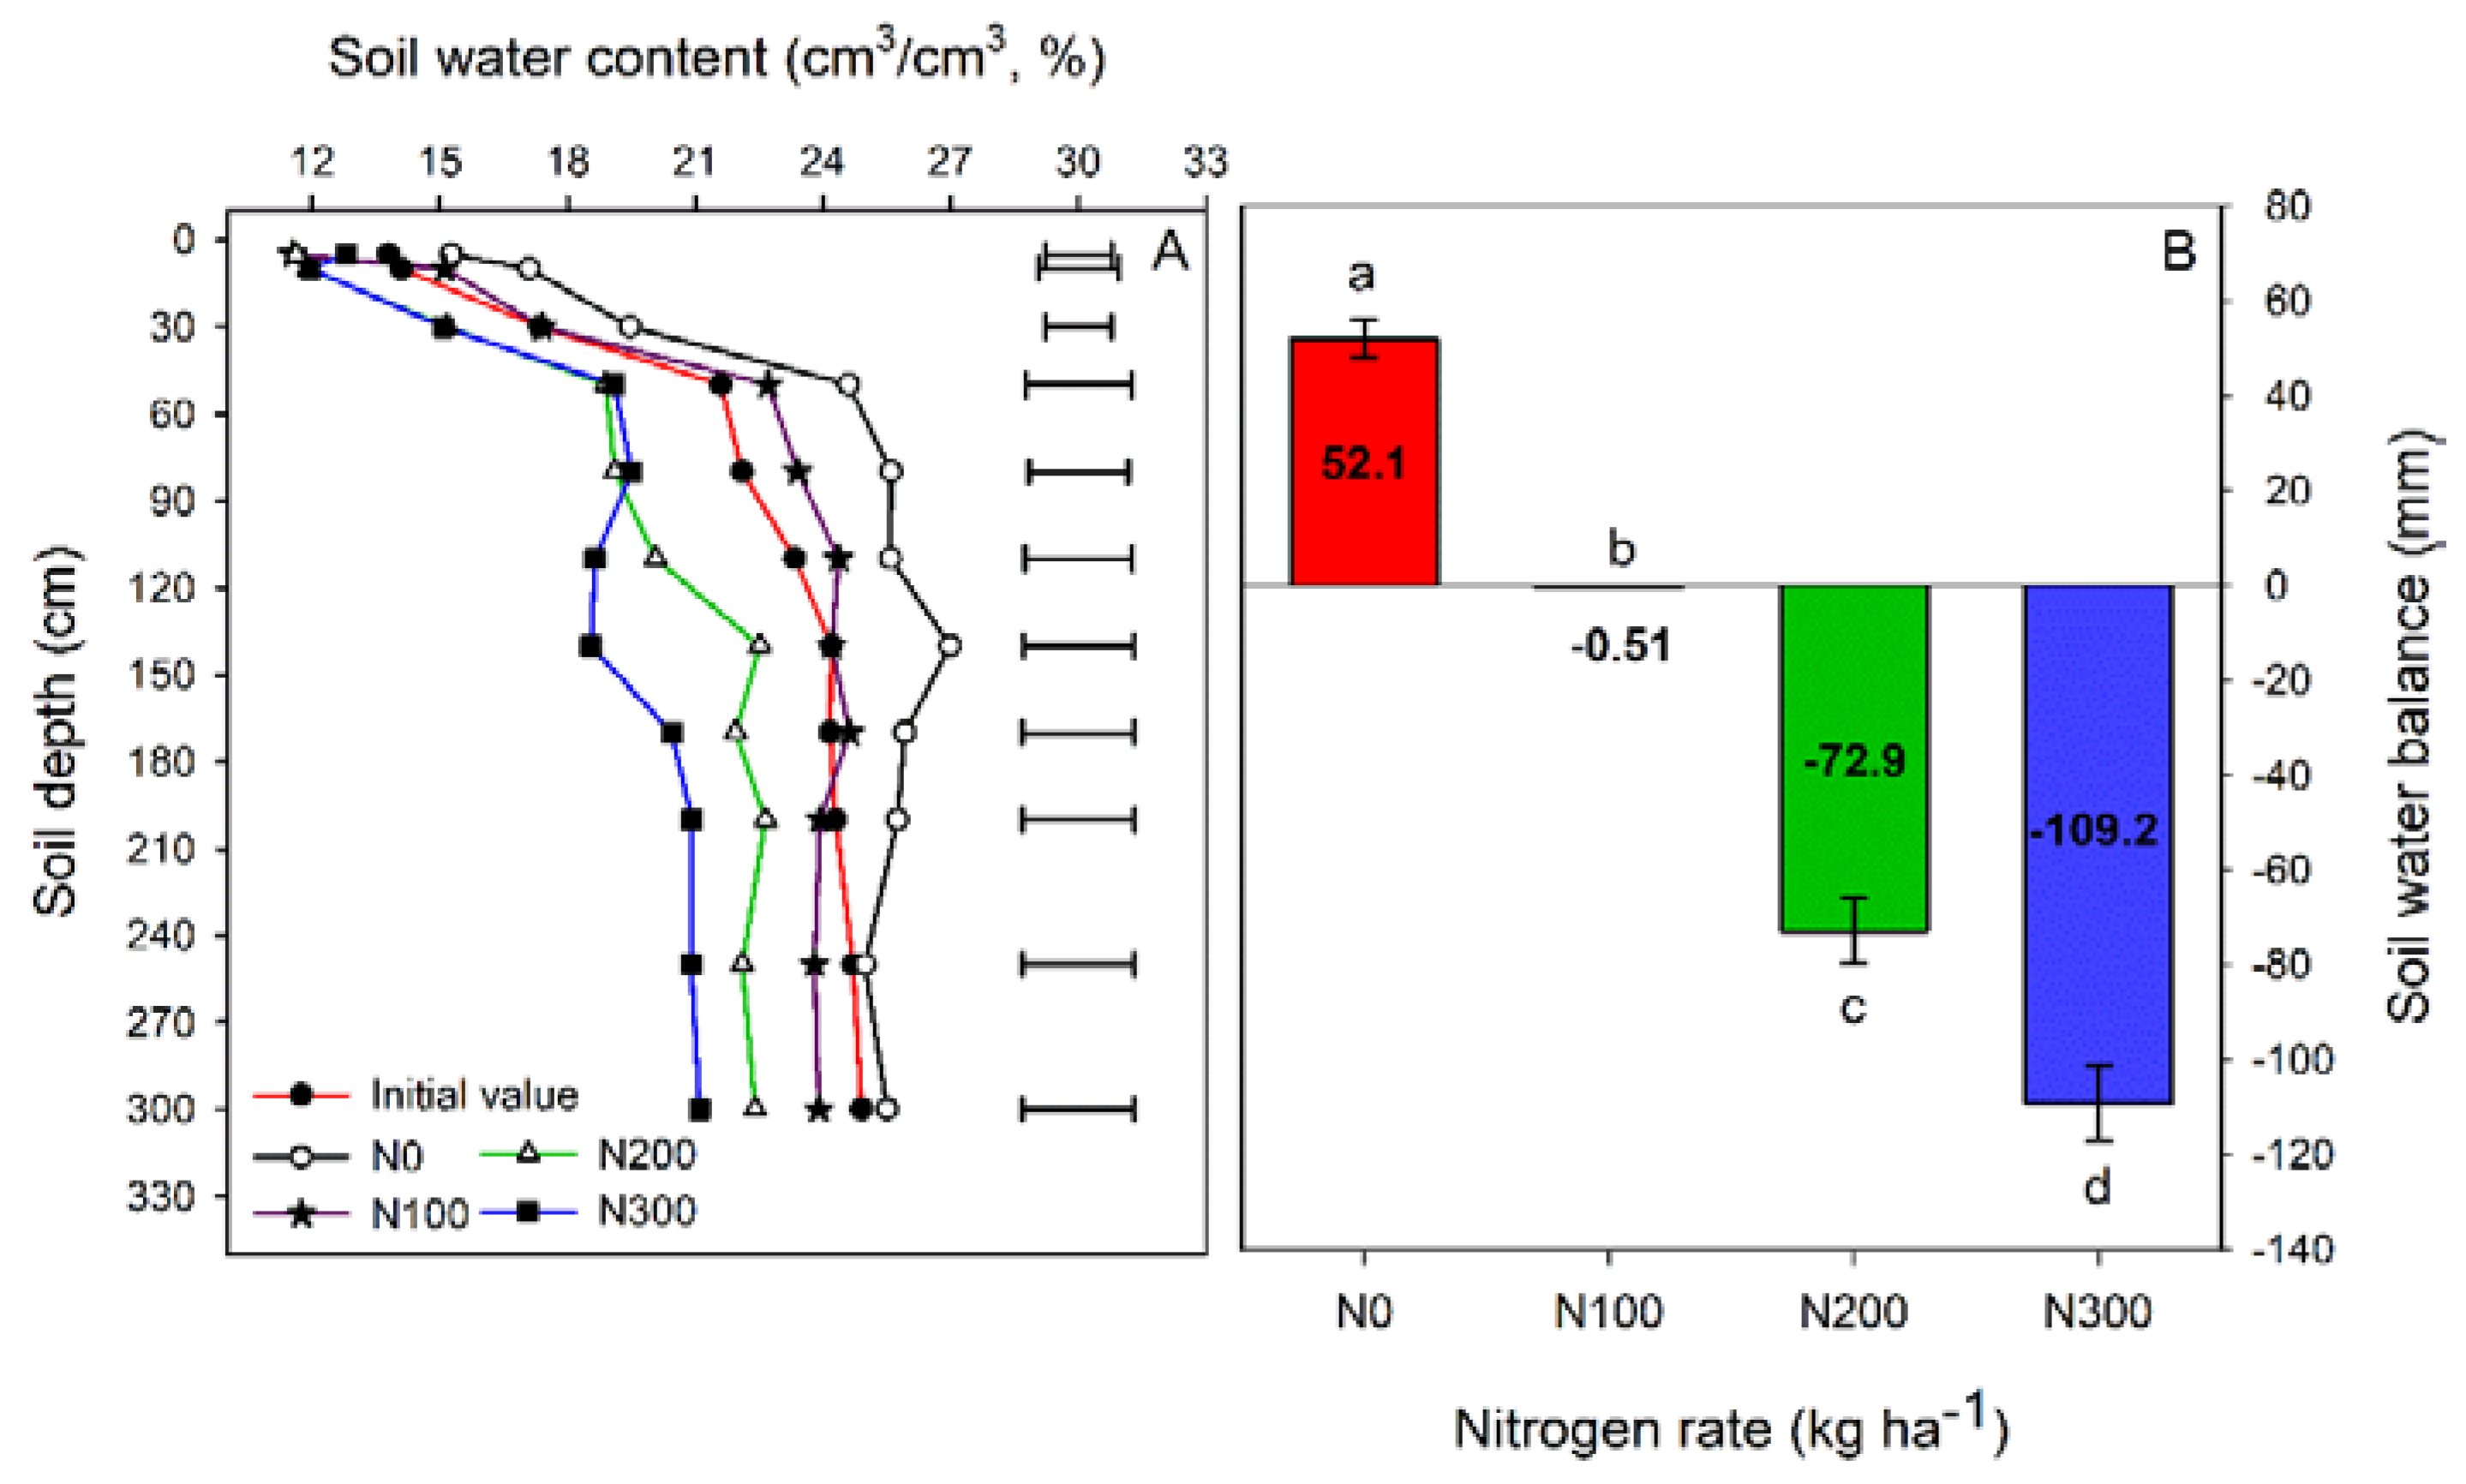
Figure 1. Effects of four rates of N application on volumetric soil water content in October 2011 (i.e., initial value) and October 2018 (A) and soil water balance (B) in the 0–300 cm soil depths from October 2011 to October 2018. Horizontal bars denote Fisher’s protected least significant difference at p ≤ 0.05. Vertical bars indicate standard deviations of the means; bars with different letters indicate significant difference between treatments (p ≤ 0.05).
Agriculture 12 01799 g001
Figure 2. Effects of four rates of N application on the soil nitrate N content (mg kg−1) (A) and the amount of nitrate nitrogen residue (kg ha−1) (B) in the upper 140 cm soil layer in April 2012 (i.e., initial value) and October 2018. Horizontal bars denote Fisher’s protected least significant difference at p ≤ 0.05. Vertical bars indicate standard deviations of the means; bars with different letters indicate significantly different (p ≤ 0.05).
Agriculture 12 01799 g002
Figure 3. Net photosynthetic rate (A,B) and water use efficiency at the leaf level (C,D) in different growth stages in 2017 and 2018. Vertical bars denote Fisher’s protected least significant difference at p ≤ 0.05. V6, V10, and R3 indicate the 6-leaf collar stage of maize, the 10-leaf collar stage of maize, and the milk stage of maize, respectively.
Agriculture 12 01799 g003
Figure 4. Nitrogen concentration (A,B) and photosynthetic nitrogen use efficiency of the ear leaf (C,D) in 2017 and 2018. Error bars indicate standard deviations of the means. Within a year for a given dependent variable, different letters indicate treatment means that are significantly different (p ≤ 0.05). The nitrogen × year interaction was not statistically significant for nitrogen concentration and photosynthetic nitrogen use efficiency of the ear leaf.
Agriculture 12 01799 g004
Figure 5. Average 100-kernel weight (A) and grain number per plant (B) as affected by nitrogen rate in 2012−2016. Error bars indicate standard deviations of the means. For a given dependent variable, different letters indicate treatment means that are significantly different (p ≤ 0.05). The nitrogen × year interaction was not statistically significant for 100-kernel weight, grain number per plant, and grain yield per plant.
Agriculture 12 01799 g005
Figure 6. Average grain yield (A) and net economic return (B) as functions of N application rate. The data of grain yield and net economic return were the average value of the 7-year experiment.
Agriculture 12 01799 g006
Table 1. Precipitation for the experimental years at the research site.
YearsAnnual Rainfall (mm)In Crop Rainfall (mm)Drought Index (DI)Condition
20124334100.65wet
20134664231.06wet
20143892850.00normal
2015335278−0.79dry
2016319233−1.03dry
2017361309−0.41normal
20184723771.22wet
Mean (1970–2011)389332
Note: Years are classified as ‘dry’, ‘normal’ and ‘wet’ based on the drought index (DI) values for annual precipitation, i.e., DI < −0.5, −0.5 ≤ DI ≤ 0.5, and DI > 0.5, respectively.
Table 2. Average aboveground nitrogen (N) accumulation at physiological maturity, N harvest index (NHI), and crop N recovery efficiency (REN) of maize under four N application rates in 2015–2016.
N RateTotal Aboveground N Accumulation (kg ha−1)NHIREN
Vegetative Components N ContentGrain N ContentSum%%
N013.7 d27.6 d41.3 d67 a
N10030.3 c49.6 c79.9 c62 b38.6 a
N20037.2 b66.5 b103.7 b64 b31.2 b
N30048.5 a78.9 a127.4 a62 b28.7 c
Note: N0, no nitrogen fertilizer applied; N100, 100 kg N ha−1; N200, 200 kg N ha−1; N300, 300 kg N ha−1. Within a column, means followed by different letters are significantly different (p ≤ 0.05). The nitrogen × year interaction was not statistically significant for vegetative components’ N content, grain N content, total aboveground N accumulation, NHI, and REN.
Table 3. Effects of four rates of nitrogen (N) application and growing seasons on biomass accumulation, grain yield, and harvest index of maize.
TreatmentBiomass Accumulation (kg ha−1)Grain Yield (kg ha−1)Harvest Index (%)
N rate cN09892 c3497 c34 b
N10015,079 b5449 b36 ab
N20020,177 a7356 a38 a
N30020,715 a7523 a36 ab
Year201223,569 a8506 a37 b
201315,751 d7334 b47 a
201419,547 bc7390 b37 b
201518,140 c6883 c38 b
20169307 e4151 e44 a
20176678 f2067 f33 c
201822,270 ab5363 d23 d
Year (Y) *********
Nitrogen rate (N) *****
Y × N ***
Note: N0, no nitrogen fertilizer applied; N100, 100 kg N ha−1; N200, 200 kg N ha−1; N300, 300 kg N ha−1. Within a column, means followed by different letters are significantly different (p ≤ 0.05); the data by year are across all N rates, including N0. *, significant at the 0.05 level of probability; **, significant at the 0.01 level of probability; ***, significant at the 0.001 level of probability.
Table 4. Effects of four rates of nitrogen (N) application and growing seasons on evapotranspiration (ET), water use efficiency of grain yield (WUEg) and biomass yield (WUEb), and agronomic use efficiency of N fertilizer (AE) of maize.
TreatmentETWUEbWUEgAE
mmkg ha−1 mm−1kg grain kg−1 N
N rateN0323 b30.6 c10.8 c
N100331 ab45.6 b16.5 b19.5 a
N200341 a59.1 a21.6 a19.3 a
N300346 a59.8 a21.7 a13.4 b
Year2012415 a56.8 a20.5 b25.9 a
2013428 a36.8 b17.1 c19.0 b
2014290 d67.5 a25.5 a21.7 b
2015283 e64.2 a24.4 a18.9 b
2016238 f39.2 b17.5 c9.9 c
2017314 c21.3 c6.6 e2.9 d
2018382 b58.4 a14.1 d23.7 ab
Year (Y) *********
N rate (N) ns***
Y × N ns***
Note: N0, no nitrogen fertilizer applied; N100, 100 kg N ha−1; N200, 200 kg N ha−1; N300, 300 kg N ha−1. Within a column, means followed by different letters are significantly different (p ≤ 0.05); the data by year are across all N rates, including N0. *, significant at the 0.05 level of probability; **, significant at the 0.01 level of probability; ***, significant at the 0.001 level of probability; ns, not significant.
Table 5. Effects of four rates of nitrogen (N) application and growing seasons on production cost, revenue, net economic return, and ratio of revenue-to-production cost (R/P) of maize.
TreatmentProduction Cost CNY ha−1 yr−1Revenue CNY ha−1 yr−1Net Economic Return CNY ha−1 yr−1R/P
N rateN010,84910,831 c−18 c1.00 c
N10011,19716,676 b5479 b1.49 b
N20011,54422,405 a10,860 a1.94 a
N30011,89222,961 a11,070 a1.93 a
Year201211,37126,050 a14,679 a2.29 a
201311,37119,718 b8347 c1.73 b
201411,37122,074 b10,703 b1.94 b
201511,37120,520 b9149 bc1.80 b
201611,37111,395 c24 d1.00 c
201711,3716900 d−4471 e0.61 d
201811,37120,870 b9499 b1.84 b
Year (Y)********
N rate (N)***
Y × N***
Note: N0, no nitrogen fertilizer applied; N100, 100 kg N ha−1; N200, 200 kg N ha−1; N300, 300 kg N ha−1. CNY: ChineseYuan (1 USD = 6.2 CNY). Within a column, means followed by different letters are significantly different (p ≤ 0.05); the data by year are across all N rates, including N0. *, significant at the 0.05 level of probability; **, significant at the 0.01 level of probability; ***, significant at the 0.001 level of probability.
Publisher’s Note: MDPI stays neutral with regard to jurisdictional claims in published maps and institutional affiliations.