Review

Codling Moth Monitoring with Camera-Equipped Automated Traps: A Review

Department of IT Systems and Networks, Faculty of Informatics, University of Debrecen, 4032 Debrecen, Hungary
Agriculture 2022, 12(10), 1721; https://doi.org/10.3390/agriculture12101721
Submission received: 14 September 2022 / Revised: 11 October 2022 / Accepted: 17 October 2022 / Published: 19 October 2022
(This article belongs to the Special Issue Hardware and Software Support for Insect Pest Management)

Abstract

:
The codling moth (Cydia pomonella) is probably the most harmful pest in apple and pear orchards. The crop loss due to the high harmfulness of the insect can be extremely expensive; therefore, sophisticated pest management is necessary to protect the crop. The conventional monitoring approach for insect swarming has been based on traps that are periodically checked by human operators. However, this workflow can be automatized. To achieve this goal, a dedicated image capture device and an accurate insect counter algorithm are necessary which make online insect swarm prediction possible. From the hardware side, more camera-equipped embedded systems have been designed to remotely capture and upload pest trap images. From the software side, with the aid of machine vision and machine learning methods, traditional (manual) identification and counting can be solved by algorithm. With the appropriate combination of the hardware and software components, spraying can be accurately scheduled, and the crop-defending cost will be significantly reduced. Although automatic traps have been developed for more pest species and there are a large number of papers which investigate insect detection, a limited number of articles focus on the C. pomonella. The aim of this paper is to review the state of the art of C. pomonella monitoring with camera-equipped traps. The paper presents the advantages and disadvantages of automated traps’ hardware and software components and examines their practical applicability.

1. Introduction

The apple is one of the most important fruits in the world due to its versatile use [1]. Moreover, it is easy to grow, store, and transport. Its most harmful pest is the codling moth [2]. It is a small insect which can damage the whole orchard within some days. Apple growers need to handle this problem worldwide because international trade and tourism has led to the global spread of this pest [3]. This type of pest originally comes from Central Asia, but it has spread throughout Europe, North America, South Africa, Australia, and China [4]. In New Zealand, they appeared over 150 years ago [5], while a new invasion site was found in 2006 in northeastern China and considered as one of the most harmful fruit pests [6]. Currently, one of the main control strategies against the codling moth is to track the pest population and apply insecticides at the time of the insect invasion [7]. In apple orchards, approximately 70% of insecticide treatments have been applied against codling moth [1]. In practice, pheromone-based traps are used to estimate the codling moth population in a given area [8]. Inside the trap, the pheromone substance is placed on a sticky paper. Generally, the sticky paper is a colored or transparent cardboard with a sticky glue layer. The pheromone attracts males to the trap and when the pest enters the trap, it remains stuck on the sticky paper. Sticky papers are then periodically changed and inspected by an expert who count the number of insects found on them. For example, Figure 1 shows some sticky papers with captured codling moths.
In most countries, the codling moth monitoring is conducted from April to October, but it depends on the climate conditions [9]. Timely data about the number of insects and their species in the traps can aid in better pest management. The insect count gives an estimate for pest population, and helps farmers in determining the emergence period, the right amount of pesticide to use, and the effectiveness of the pest treatment [10].
Manual insect monitoring requires a substantial amount of manpower. Manually counting pests on a sticky paper is a very slow, tedious, and expensive process, especially when the area is large. In addition, it requires a skilled person capable of distinguishing insect species [11]. Those reasons indicate well why automating the identification and counting process would be very helpful. Moreover, the traditional pest counting does not give immediate feedback; therefore, pest population monitoring has a very low temporal resolution. However, the temporal resolution is very important in the case of the codling moth because if the information on the number of pests cannot be obtained in time, it is impossible to take immediate action [12].
Due to the above reasons, researchers and the industry moved towards smart solutions. In the last decade, the advances of miniaturized sensor technology, microcontrollers, and telecommunication engineering allowed the development of automated insect monitoring traps. Against manual counting, automated traps improve the temporal resolution of pest population monitoring to better guide crop protection. Those traps can be seen as embedded systems which are designed for a pre-defined task and consist of a hardware and a software part. Embedded systems have been widely used in agriculture recently, and they allow remote surveillance with the use of RBG (Red, Green, Blue) cameras [13]. Similar camera-equipped devices can effectively help the Integrated Pest Management (IPM) where the goal is to reduce insect pest population below the economic injury level. Most of the IPM systems are connected to wireless networks for monitoring orchards. Some of them provide online services, while others provide off-line services to help in the decision-making process [10]. Pest monitoring from a distant location opens the opportunity for continuously measuring insect population dynamics. The goal would be the execution of more precise treatments and to coordinate the interventions. It mainly means that the spraying needs to be performed only at the right time when the pest population is higher than a critical level. Such a forecast not only has economic (saving money) but also significant environmental effects (less spraying, less amount of insecticide, etc.) because farmers can apply insecticides at scheduled times to defend crops [14].
Beyond the hardware part, image processing, deep learning, and edge computing technologies also need to be adopted to automatize the insect counting process. Due to the current development of machine vision and learning technologies, deep object detector algorithms can be used to solve object detection problems with promising performance, not just in computer science but also in agriculture [15]. This is not surprising, because insect counting can be seen as a special object detection problem, thus the one or two-staged Convolutional Neural Network (CNN)-based object detectors can be used effectively [16,17].
However, due to the multiple poses, texture and size difference between insects attached to sticky paper, the development of automatic insect counting methods is quite challenging. Those issues are clearly visible on Figure 1. Since moths are cached in different poses, the insect counter model needs to be rotation invariant. To handle size differences (e.g., fully open wings, half open wings, closed wings), features generated by the model need to be scale invariant. Finally, the texture difference of cached insects (e.g., insects have different texture on its back and belly) can be fixed with generalized color descriptors.

2. Materials and Methods

The efficiency of pest monitoring systems depends on both, the accuracy of the chosen pest counting method and the electrical circuit inside the trap. In the market, some commercially automated pest management systems are already available that support farmers to remotely monitor pest population in their orchards, such as Trapview (EFOS d.o.o., Hrusevje, Slovenia), iSCOUT (Stiching iScout, Bilthoven, Utrecht, The Netherlands), and the Z-Trap (Spensa Technologies Inc., West Lafayette, IN, USA) smart traps [18]. A sample image about those three commercial traps can be seen on Figure 2. Beyond commercial traps, some research groups have also proposed prototype systems to pest monitoring and counting in past years.
The development of insect counting algorithms runs on two lines. In the first one, the original or a modified version of the well-known deep object detectors such as YOLO and Faster R-CNN are used for insect counting. In the second one, segmentation and classification are separated from each other. In the articles dealing with C. pomonella, the second one is the popular approach.
This paper covers an in-depth review on the automatic detection and monitoring of codling moth with camera-equipped traps. The following sections present the available commercial and prototype (from the literature) automated traps and insect counting techniques that can currently be used in apple orchards to monitor the population of C. pomonella. This review is based on several research papers, earlier reviews, online resources, and own experiences.

3. Results

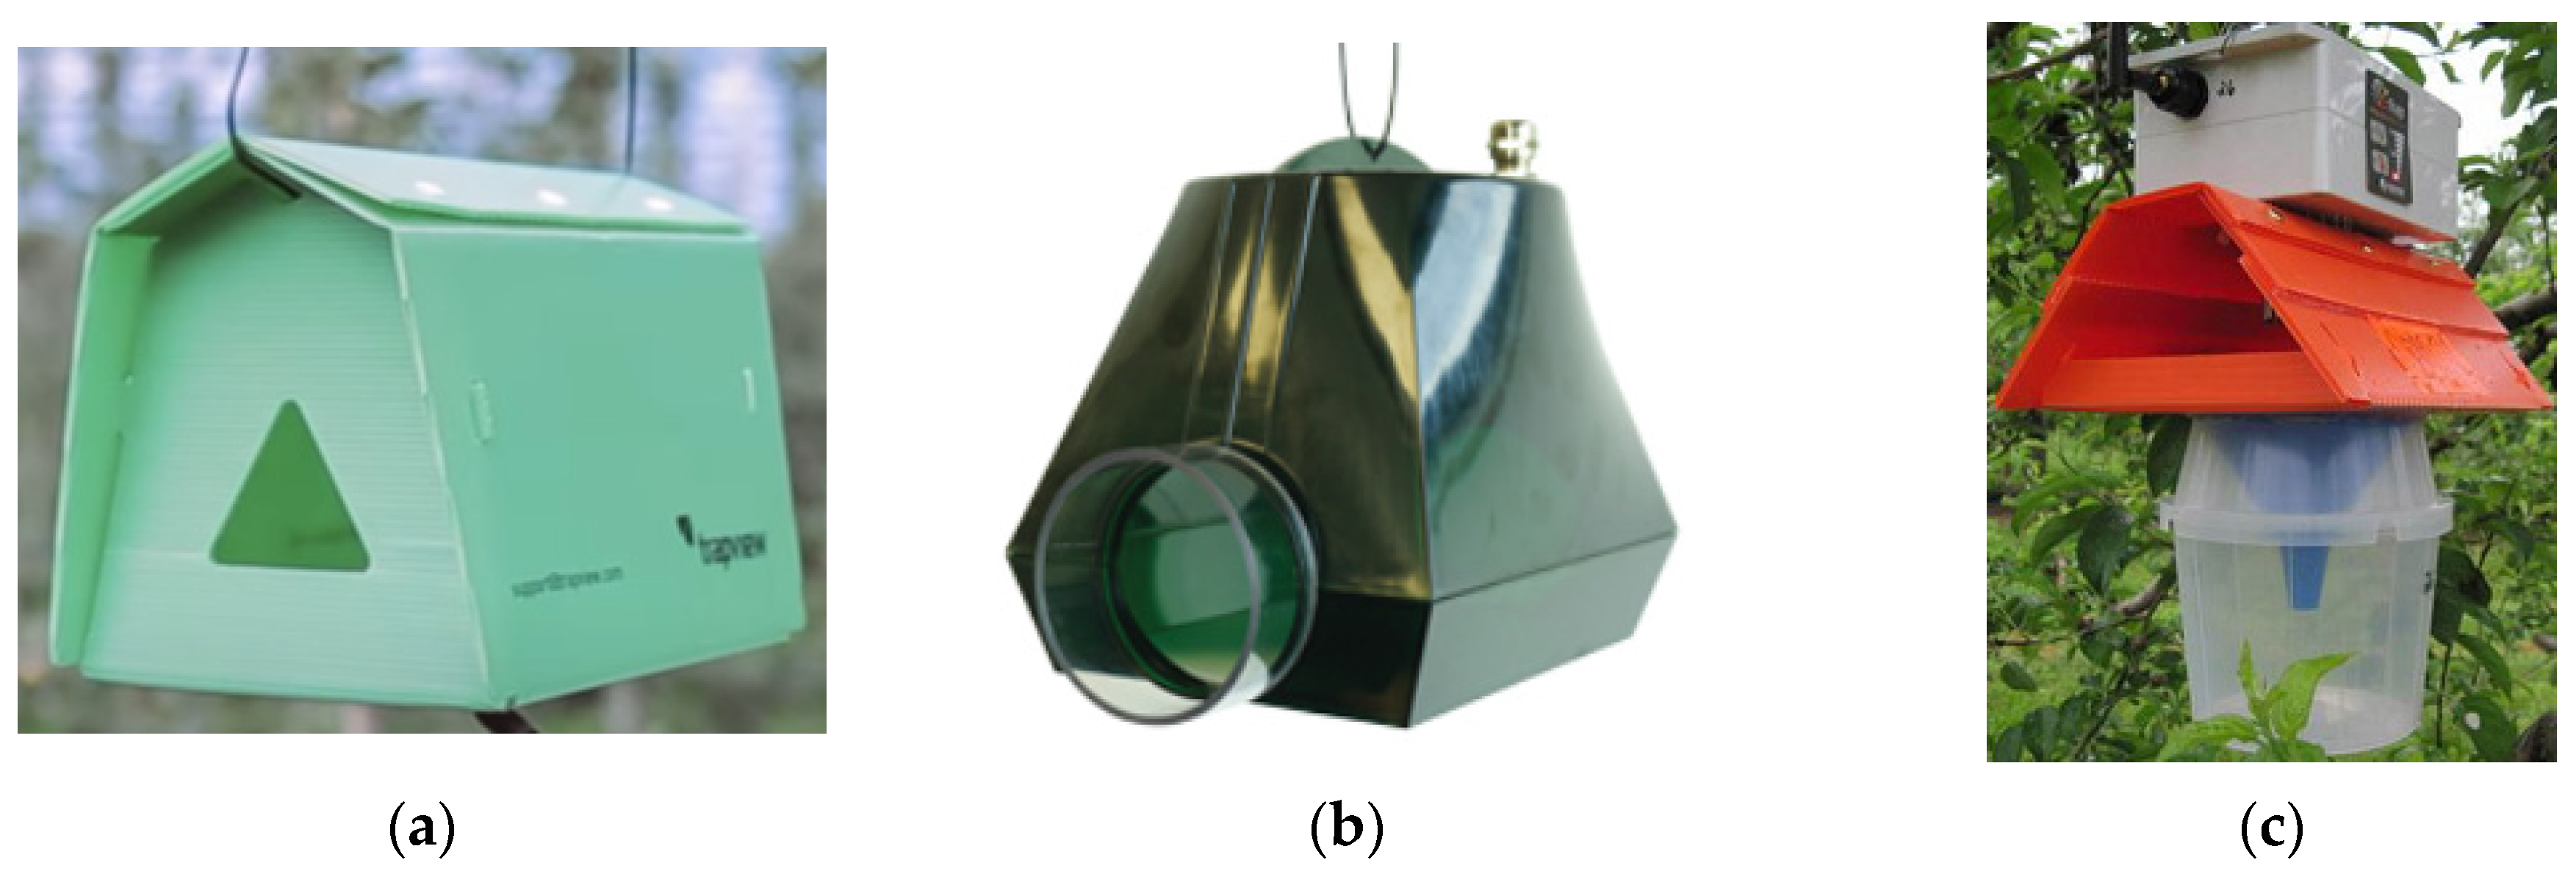
3.1. Commercial Camera-Equipped Traps

Out of the commercial traps, probably the most popular is the Trapview pest management system which came on to the market in 2013 [19]. The standard system is powered by two lithium-ion batteries (with 3.7 V voltage and 2.2 Ah capacity) and a 4 W solar panel. The trap contains four 5 MP (megapixel) cameras to capture images of the sticky paper. At the time of the evaluation, images were concatenated into a single picture on the screen. The system allows a maximum of three pictures per day and requires 100–200 MB of storage per month. Each trap uses a GPRS module for wireless communication to create connection with the cloud server while a GPS module provides information on the location of the trap for mapping purposes.
The iSCOUT high-resolution camera system is designed to different insect types including the codling moth. The trap is equipped with a 10 MP camera which provides high quality images about the sticky plate. Captured images are sent via LTE network toward the server side where an AI-based software analyzes them. Its power supply is provided by a 6 V rechargeable lead acid battery which has a 12 Ah capacity.
The Z-Trap is another insect trapping device but against the Trapview, it automatically detects the number of insects captured by the trap and sends the data wirelessly to the grower’s mobile phone or web interface. The Z-Trap has been developed at the Purdue University and later was commercialized in the Purdue Research Park by Spensa Technologies Inc. [20]. It is powered by a lithium phosphate battery which can operate the trap for as long as 6 months under common monitoring conditions. However, many growers are not satisfied by the cost and scalability of commercial traps. Schrader et al. [21] mentioned that commercial remote monitoring traps are adopted hesitantly by growers because they are expensive (approximately USD 1375/ha) and are used at a low trap density (1 trap every 4 ha while the recommended would be 1 trap/ha).

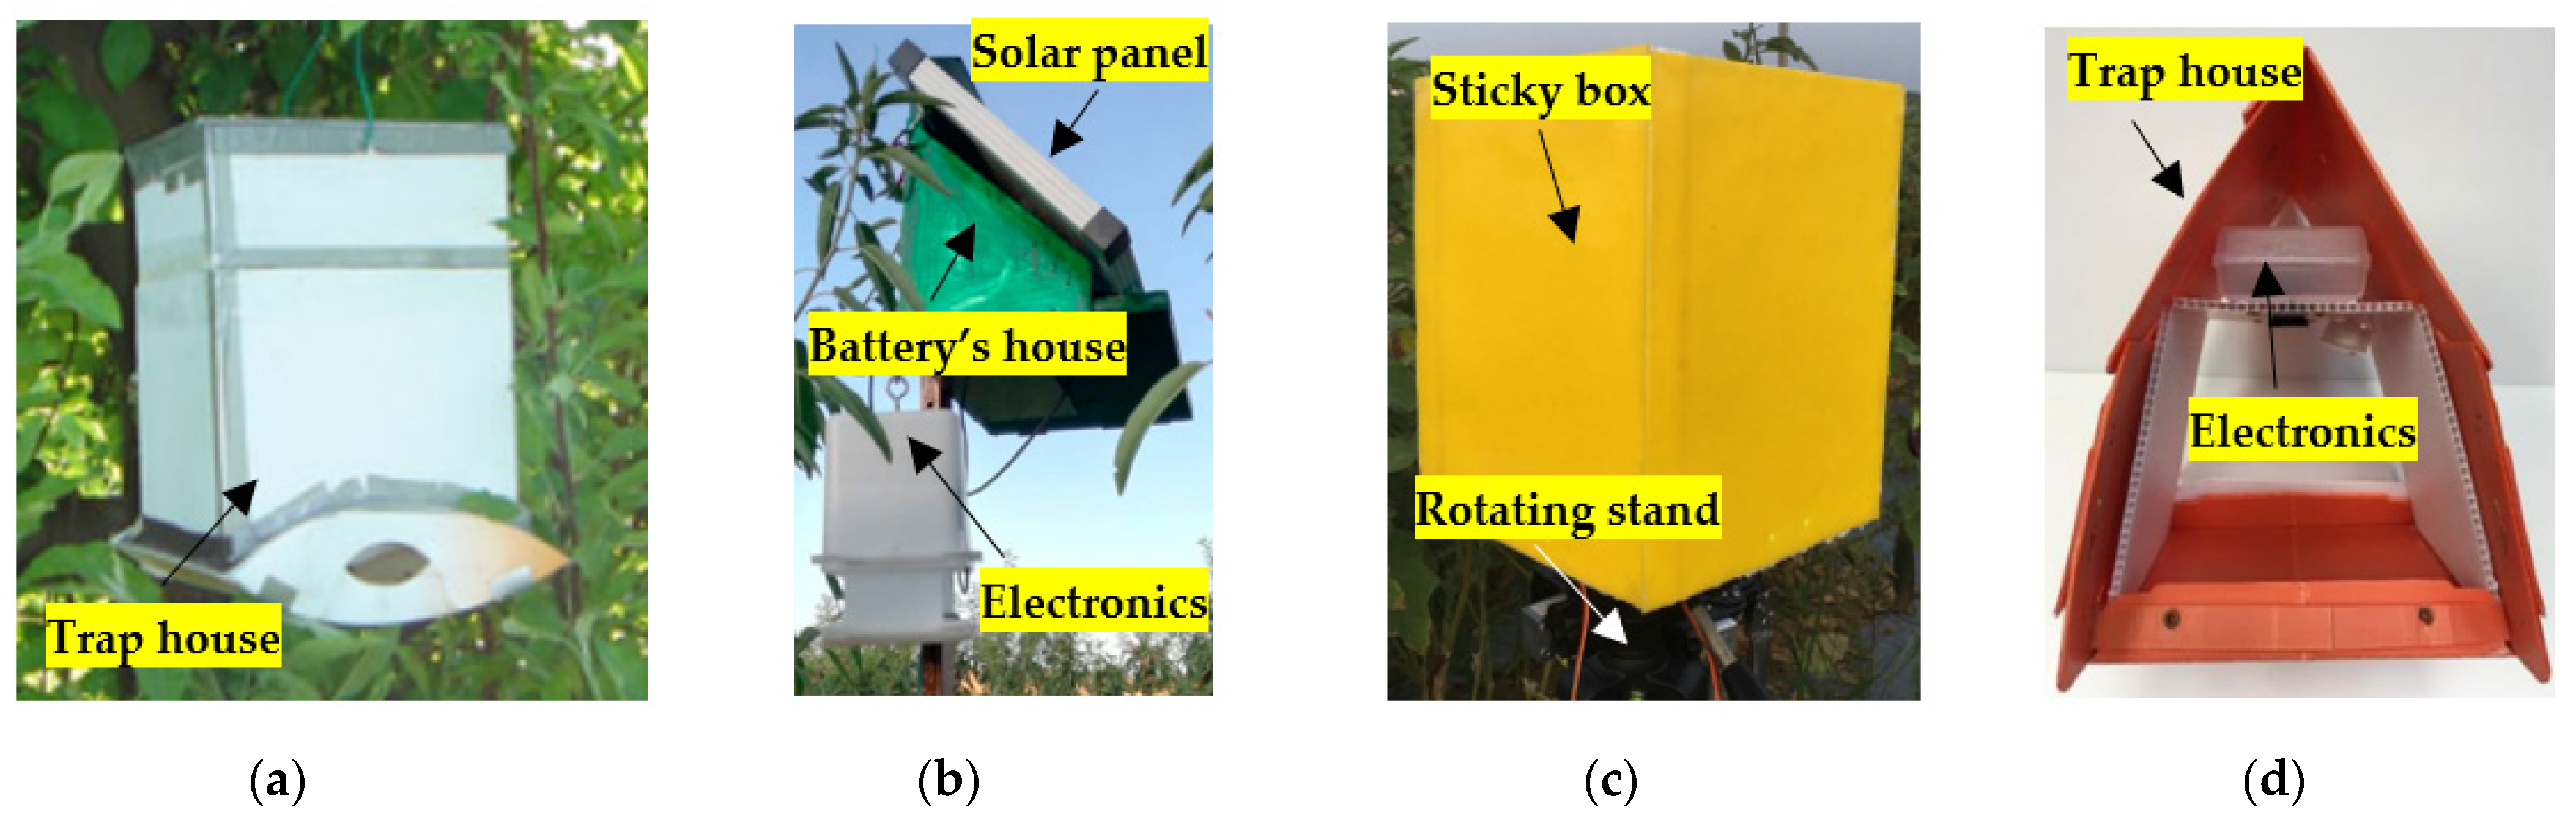
3.2. Earlier Prototype Traps

An early prototype trap has been proposed by Guarnieri et al. [22] where the controller unit inside the trap is a S60 (3rd edition) smartphone which has an integrated camera of 3 MP and its operating system is Symbian (Symbian, ver.9.0, Symbian Ltd., London, UK). They claimed that the 3 MP camera resolution is higher than the minimum resolution (>2 MP) to recognize the morphological characteristics of the codling moth. The phone is extended with an external power management unit consisting of an MSP430F2013 microcontroller, an ultralow power switch, a TPS7333 voltage regulator, and 4 rechargeable lithium batteries of 4800 mAh. In this system, the captured images are sent via GPRS network to the server where the visual evaluation takes place.
A few years later, the advantages of integrated circuit technology boosted the automated trap design. In 2019, Brunelli et al. [23] developed a trap where the central unit was a Raspberry Pi which is extended with a camera for image capture and an Intel Movidius Neural Compute Stick to run the moth counting method. The wireless communication is guaranteed by a LoRa modem. According to the authors’ measurements, the active time-period of their trap is approximately 62 s and a 9 Ah battery is enough to sustain the trap for more than one year.
In 2020, Segalla et al. [24] also wrote about an automated trap which is very similar to the trap proposed by Brunelli et al. [23]. The two articles show high similarity. For example, the central unit is a Raspberry Pi 3 extended with a Movidius computing stick and the insect counting takes place inside the trap with a VGG16-based deep neural network model in both cases. However, there are differences as well. Since the Intel Movidius Neural Compute Stick is rather power demanding, the authors of [24] measured the energy consumption of the Raspberry Pi 3 and 4 devices with and without the accelerator stick. They found that the Raspberry Pi 3 with the accelerator stick requires the least amount of energy to run the moth counter software. According to their measurement, the active state (program execution) is more than 50 s. Their visual illustration about the power consumption shows more than 400 mA avg. power consumption in the active state. The authors measured 10.73 mA avg. power consumption/cycle. So, the predicted number of cycles is 169 with the used 1820 mAh single cell LiPo battery. In addition, their prototype also includes a solar energy harvester and a Pi-Juice-Hat which is responsible for the power management.
In the same year, Brunelli et al. [25] designed another low-power trap where the central unit is a GAP8 SoC (System on Chip). They claimed that the power consumption of the board is 30 uW in deep sleep mode, thus it may operate without any maintenance for years. Their camera unit is grey scale with low resolution (244 × 324 pixels) to minimize the image processing time. The image processing is placed into the trap and the result is sent via LoRa protocol toward the receiving side.
In the next year, several new automated traps were created. Perez-Aparicio et al. [26] made a relatively large trap from polypropylene food containers. The power supply is provided by a 12 V, 7 Ah lead-acid battery which is charged from a 20 W solar panel. Due to the weight of the power supply unit (~7.5 kg), it is held by a steel bar. The electronic part of their trap consists of a Raspberry Pi Zero, an 8 MP infrared camera, and infrared LED for night vision. In this trap type, the obtained images are stored on the Pi’s microSD card and the user need to download them for processing. Their estimated trap price was EUR 150. Hadi et al. [27] proposed a sticky box which is made of four polystyrene plates. For image capture, a Raspberry Pi camera is used which can be rotated by servo motors. Inside the box, a Raspberry Pi 3 Model B+ and an Arduino board are placed. The primary task of the Raspberry Pi is the image capturing and saving while the Arduino board is responsible for the motor movement and external sensor handling such as the rain sensor. In their initial setting, the main components of the circuit are glued into a plastic box and some of them are in a breadboard. The authors mentioned that the power source is a 12 V 7.2 A rechargeable battery, but the power consumption is not detailed. In the prototype trap of Preti et al. [12] the central unit was a low-power ESP32 microcontroller with integrated WIFI and Bluetooth modules. The camera is a 5 MP Omnivision OV5648 with a 2592 × 1944 max resolution. The power sources are two lithium rechargeable graphene batteries connected in series. These batteries can supply 3500 mA as maximum current at 7.2 V. During active mode, the electronic board requires 300 mA of current. The batteries are charged with two photovoltaic modules (12 V, 2 W). The communication module is a SIM800 which is responsible for image transmission toward the Java-based server. The estimated production cost of one prototype trap in total EUR 375.

3.3. Current Prototype Traps

Since there was not generally any accepted guideline to the automated trap’s circuit design, circuit development continued in 2022. Schrader et al. [21] considered the cost and operating time as the two main criterion. They presented the development of a plug-in imaging system for pheromone delta traps used in pest population monitoring. The plug-in can be connected to the top of a delta trap, and it captures images about the sticky plate. Here, the central unit is an Arducam IoTai ESP32 development board that is equipped with an OV2640 imager that provides 2 MP image resolution. The captured images are stored on the on-board microSD card in 320 × 240 pixel resolution. The circuit is powered by a 350 mAh, 3.7 V lithium polymer ion battery. The developers stated that the operating time of the trap is approximately 2 weeks if it captures images at daily intervals. The system’s building cost is about USD 33 per unit. However, this circuit does not allow automated operation because images must be collected manually. Finally, the latest trap has been proposed by Suto [28]. In this article a detailed description can be found about a plug-in which is dedicated to the Raspberry Pi devices, especially to the Zero W and W 2. In the center of the board, a fixed-focus, Raspberry Pi v2 camera is located. The circuit incorporates a SIM7600E-H and an EMB-LR1276S module for communication via mobile network and LoRa wide area network. Since, the Raspberry single board computers have no sleep mode, the author developed a particular on/off timing circuit that integrates an RTC, an RC oscillator and an 8-bit shift register. This trap is designed to on-board image evaluation, and it has been tested with a deep object detector method. The test results showed that its average power consumption is 2.4 W (with LTE information transmission) during the active state (400 s) while in the inactive state it is only 22 mW. According to the author’s estimation, the lifetime of the trap would be less than 80 days with a 11 Ah battery. In order for the operation time of the trap to be longer, a solar charger also has been placed on the plug-in board where the charging controller is a LT3652 IC (integrated circuit) from the Linear Technology Corporation.
A summary about the key features of traps can be found in Table 1. The Z-trap has been omitted from the table due to insufficient information. In addition, an illustration of some prototype traps can be seen on Figure 3.

3.4. Databases and Data Generation

A significant barrier of the codling moth counting algorithm development is the lack of public trap images. In the earlier papers, the main goal was the insect pest classification where the image typically contains a single insect. As an example, Xie et al. [29] tested their two-phases insect classifier method on the images of 24 insect species with approximately 60 images per class. Although the authors shared their images with the community, this was not common because most scientists worked on their own unpublic images [30,31]. A review from 2017 also mentioned the lack of a freely available (and quite extensive) reference dataset [32]. In the following year, Kalamatianos et al. [33] presented a dataset with images of McPhail trap’s contents. It was the DIRT (Dacus Image Recognition Toolkit). Most images depict olive fruit fly, collected in Corfu, Greece. The images are obtained with smart phone and tablets; therefore, they are not standardized. The original (filtered) dataset contained 202 pictures which have been cut into four slices.
Later, Xie et al. [34] extended their dataset to 4500 images obtained about pests of corn, soybean, wheat, and canola. Since the authors made the images available for the researcher community, other researchers also used them as a data source [35,36]. Although public datasets have already been available, due to the rise in deep machine learning algorithms, the number of images inside them did not seem enough. To overcome this issue, Wu et al. [37] created the IP102 freely available database for pest classification. In the paper, they gave a review of the used databases in previous works and claimed that earlier public datasets do not contain enough samples for the efficient training of deep learning algorithms. The IP102 contains more than 75,000 images of 102 insect species but only a fraction (approximately 19,000) of the images have been annotated. The dataset has a hierarchical structure where insects that mainly affect a specific agricultural product are grouped into the same upper-level category. In the same year, the Kaggle community published another freely available large-scale database. It is called the Fieldguide Challenge: Moths & Butterflies. It contains 530,000 images of 5419 pest species. The weakness of this database is the lack of species name (classes are identified by ID without name).
Unfortunately, the earlier mentioned databases do not contain images of C. pomonella. Moreover, on those images, only one insect can be seen. For illustration, Figure 4 shows sample images from the Fieldguide Challenge dataset. Obviously, the difference between those images and trap images (see Figure 1) is substantial because trap images can be more different insect species captured in different poses while database images contain only one clearly visible insect which fills the image. To handle this problem, Suto [38] proposed a particular idea. He generated a binary dataset from the Fieldguide Challenge database (only 25 classes) where insects on the “positive” images were visually similar to the codling moth. Thereafter, the binary dataset has been used to train a deep moth counter model.
Probably, the lack of public trap images attracted the attention of some researchers because a public database appeared in 2021 [39]. Its name is Moth Classification and Counting and contains more than 2000 images. Its images were captured with a light trap and the codling moth does not belong to the investigated insect species.

3.5. Evaluation Metrics

An interesting question is how can the accuracy of an insect counting method be measured? In 2016, Ding and Taylor [40] observed that there is no standard protocol for the evaluation of insect counting algorithms because this is a relatively new field of computer vision. Therefore, they adopted metrics from the pedestrian detection problem with some minor modifications. Their evaluation is based on the statistics of misdetections, correct detections, and false positives. In this context, the misdetection refers to a labelled region which has not been detected by the algorithm while the false positive refers a bounding box (region of interest) proposed by the algorithm which does not correspond to any ground truth region. To determine if a proposed bounding box correct or not, the Intersection-over-Minimum (IoMin) heuristic has been used (1):
I o M i n ( b p , b t ) = a r e a ( b p b t ) min ( a r e a ( b p ) ,   a r e a ( b t ) )
where bt is the ground truth bounding box and bp is the bounding box proposed by the algorithm. They supposed that a specific ground truth bounding box is correctly detected if there is at least one bp such that IoMin(bp, bt) > 0.5. When multiple proposed boxes satisfy the condition, the one with the highest probability had been chosen. After this condition is applied on all ground truth boxes, unmatched boxes are considered as false positives. One of their performance metrics was the area under the precision–recall curve where the precision (2) and recall (3) with threshold value k   ϵ   K can be calculated with the following formulas:
p ( k ) = #   t r u e   p o s i t i v e   d e t e c t i o n s t o t a l   n u m b e r   o f   d e t e c t i o n s
r ( k ) = #   t r u e   p o s i t i v e   d e t e c t i o n s t o t a l   n u m b e r   o f   g r o u n d   t r u t h   b o x e s
The above-mentioned area under the precision–recall curve is also called as AP (average precision) (4). This metric along with its averaged version for all classes (mAP) were widely adopted by other researchers as quantitative object level metrics [13,16,41]. Both can be given in percentage and fractional forms. However, other researchers used the Intersection-over-Union (IoU) (5) to determine the correctness of a proposed bounding box instead of the IoMin. Even though the most common IoU threshold is 0.5, this is not fulfilled in all cases. For example, in the work of Sun et al. [42], the proposed box is considered as a true positive if the IoU value exceeds the 0.75 threshold value; in other cases, the box is false positive.
A P = k = 1 K p ( k ) Δ r ( k )
I o U ( b p , b t ) = a r e a ( b p b t ) a r e a ( b p   b t )
Beyond AP and mAP, some other metrics also have been introduced to better describe the counting method’s performance. In the paper by Zhong et al. [43], the accuracy was defined as the ratio of the correctly detected objects and the total number of detections. Rustia et al. [44] tested the moth counter algorithm on testing images with a resolution of 3280 × 2464 where the detection accuracy was calculated from the predicted moth count by the algorithm and the manual count by an entomologist. This accuracy can be described as the relative absolute difference of manual count and automatic count in percentage (6). In (6), Ca denotes the predicted number of insects while Cm is the number of manually counted insects.
a c c = ( 1 C a C m C m ) × 100
Suto [38] introduced two additional metrics. One was to measure the accuracy of the object proposal (segmentation) algorithm (7) where N is the number of test images and Mi is the number of ground truth boxes on the i’th image. To measure the performance of the insect-counting method, he introduced a loss function (8) where cp is the number of predicted boxes, and cr is the number of ground truth boxes.
a c c s = 1 N i = 1 N 1 M i j = 1 M i max ( I o U ( b p i , l , b t i , j ) )
l ( c p , c r ) = 1 N i = 1 N | c i p c i r | c i r + 1

3.6. Insect Counting Methods

Insect classification has a wide literature background. Inside it, the evolution of image classifier models is clearly visible. Most models can be categorized into two classes, namely feature extraction-based and deep learning-based. In feature-based models, the model’s performance mainly depends on the type of extracted features. In some cases, just a subset of features feed the classifier those which have been selected by a feature selector algorithm [35]. The used features in previous works have a wide range. Deng et al. [45] extracted SIFT-HMAX (combination of Scale Invariant Feature Transform and None-negative Sparce Coding) and Local Configuration Patterns from insect images. Yalcin [46] used local binary patterns, elliptic Fourier descriptors, Hu moments, and radial distance functions as features.
Later, researchers turned toward deep learning methods [47,48,49]. Deep learning brought some great breakthroughs in different machine learning problems such as image classification and object detection [50,51]. It is a branch of machine learning where a significant part of models are CNNs. In CNNs, feature extraction automatically takes place in the so-called convolutional layers, thus hand-crafted feature extraction is not necessary [52]. CNN merges multi-layer neural network with digital filtering where the input data are convolved with a set of small filters. Based on a different approach, the filtering process can be seen as a hierarchical feature extraction [53]. This is the reason why the layer volumes are called as feature maps. The usage of deep models further improved the insect classification accuracy.
Against insect pest classification, insect counting is much more challenging. To count the number of insects on an image, it is not enough to classify the pest, but it is also necessary to localize all of them on the image. In this case, the image processing requires a further segmentation phase to separate insects from each other before the identification step. In most cases, images have high resolution in the insect classification papers, sometimes obtained in the laboratory environment. In contrast to “laboratory images”, the quality of automated trap images is relatively low, due to the trap’s circuit constraints. Furthermore, their quality is affected by several other factors such as illumination conditions, trap movement, insect movement, appearance of other objects (e.g., leaves, glue), and wrecked insects. This is further complicated by the fact that the sticky paper may catch not just the target insect but also other non-target insects. Those factors make most of the earlier developed insect classifier methods impractical where images were of high quality and finely segmented. Therefore, image counting is a more complex problem, and the literature is sparse because the main research trend is the identification [54].
The conventional pest detection chain is similar to the general object detection chain and consists of three stages: segmentation, feature extraction, and classification. Today, some deep object detectors incorporate all those steps into one model while in other cases, segmentation or even feature extraction are separated from the classification stage. In the literature, several segmentation algorithms can be found such as thresholding-based, clustering-based, contour-based, or region-based algorithms. However, Bakkay et al. [55] established that the conventional segmentation techniques cannot take into consideration difficulties such as touching insects. Their idea was to combine region and contour-based segmentation to keep the details and separate touching insects. They proposed an automated segmentation method which gives back candidate image regions for insect detection. Although this segmentation technique can be combined with any other classifier model and it is faster than a sliding-window based segmentation, its precision rate was only 0.77 according to the authors’ tests.
Due to the complexity of the task, insect counting methods shifted toward deep object detectors rather early. In 2018, Sun et al. [42] used a modified RetinaNet object detector to detect and count Red Turpentine Beetle pests in a cylinder-shaped pheromone trap. On their own dataset, the proposed RetinaNet model achieved 75.1% AP with 0.75 IoU threshold value. They tried to measure the decision time of the lightweight RetinaNet model on two single board computers. On the Raspberry Pi 3B, the model could not run due to the limited computational resources. On the Nvidia Jetson TX2, the average decision time was 0.711 s.
In the same year, Zhong et al. [43] developed a pest counting method where the YOLO object detector was used as an object proposal (segmentation) and the object classifier was an SVM (Support Vector Machine). Their reason for this unusual model pairing was the relatively small dataset that was available for them. Since six pest species have been investigated in their paper, six SVM have been constructed according to the one-vs all classification strategy. On their test images, the complete model accuracy (correctly detected objects per total number of detected objects) was 92.5%. The decision time of this detector chain was 5 min on a Raspberry Pi 2 model B.
In 2020, some additional studies have been published where the goal was the insect counting on trap images. Rustia et al. [44] developed a pest counting algorithm to their sticky paper trap which was designed for greenhouses. The target pests were the whiteflies, thrips, flies, and aphids. In their algorithm, the sticky paper images with resolution of 3280 × 2464 went through an RGB-to-LUV color transformation where the 85–120 V channel interval has been used for binary thresholding. The next step was a selective blob detection where small (16 × 16 pixel) and large (128 × 128 pixel) blobs are filtered out. Then the RGB pixels of the cropped blobs in vectorized form (feature vector) were the input of an SVM classifier. The authors noted that the raw RGB pixels form a better feature vector than color, shape, and morphological features according to their current results and previous study [56]. In the test phase, their method achieved 93% average temporal accuracy (6). Although the performance of the algorithm is quite good, it cannot identify insects by categories.
Hong et al. [16] tested the speed and accuracy of seven deep learning-based object detectors including Retinanet, SSD, and Faster R-CNN on pheromone trap images. Their target moth types were the H. assulta, S. litura, and S. exigua. Beyond the trap images, the authors added 168 photos to their dataset to increase the number and type of negative samples in the “unknown” class. It is also worth noting that those images are not remote sensing smart trap images. At the end, the total number of images was 1142. Not surprisingly, their investigation showed that the Faster R-CNN model had the highest mAP (90.25%) and the longest decision time. On the other hand, the SSD detector was the fastest, but its mAP was the smallest (76.86%). In the work of Qing et al. [13], the target insects were the S. inferens, C. suppressalis, C. medinalis, S. furcifera and N. lugens. In their counting method, the image went through more image enhancement steps before segmentation: background removal, morphological operations, and noise (small hole) removal. The segmentation algorithm is based on erosion and heavy thresholding where several threshold conditions have been used to split the possible touching insects. For the identification of small and large insects, different deep classifiers (VGG16, GoogleNet, ResNet-x, etc.) have been used. Here, the results showed that the ResNet-x models achieve the highest mAP value which is near 90%.
Due to the wide range of pest insects and image capture devices, the research continued. Mamdouh and Khattab [17] applied a slightly modified YOLOv4 object detector model for counting the number of olive fruit flies. As an information source, they used the DIRT dataset and the Leeds butterfly dataset as negative samples. Since the McPhail liquid trap has a yellow color, they applied yellow color normalization on trap images. At the end, their test results showed 96.68% mAP. Rong et al. [57] modified the Faster R-CNN architecture to count aphids and leaf miner flies on images (3456 × 4608 pixels) that are captured with handheld mobile devices. Their approach produced 80.2% mAP on the test images.
Although the above-mentioned studies are focused on insect counting; none of them deal with the C. pomonella pest. In addition, the images were obtained by hand in many cases and not with a smart trap. For illustration, Figure 5 depicts yellow stick paper and liquid trap pictures obtained by hand. Similar images have been used in [17,43,44,57].
Since the target insect and the image capturing circumstances are different, those methods cannot be adopted directly to codling moth counting. We found only a few relevant articles where the target insect was the C. pomonella and trap images were used. In 2016, Ding and Taylor [40] proposed a deep learning-based detection pipeline for codling moth counting in trap images obtained inside the field. They applied sliding-window for image segmentation and a convolutional neural network as image region classifier. In the segmentation phase, a sliding window passes through multiple scales of the image where all window regions are transferred to the classifier. The classifier output is a probability value which indicates that a particular region contains moths or not. To eliminate the overlapping between windows, the non-maximum suppression (NMS) has been used. It retains only those windows whose probability is locally maximal. Out of the remaining windows (or bounding boxes), only those boxes are kept which have higher probability than a pre-defined threshold value. At the end, the number of remaining boxes can be used as a moth count estimate. Their method achieved 93.1% AP value on 40 trap images with 640 × 480 resolution.
In the paper of Brunelli et al. [23], before segmentation the input image is pre-processed. The pre-processing stage consists of grey scale conversion, smoothing, and edge extraction. The segmentation is based on the OpenCV’s blob detector. Thereafter, image regions are classified with the VGG16 model. This approached brought 94.38% precision and 92.6% recall rates. Segella et al. [24] also applied the VGG16 and compared its classification efficiency with the LeNet model. In their tests, the LeNet model showed higher performance than the VGG16. In this paper the segmentation process is not detailed.
In the work of Preti. et al. [12], the image analysis takes place in Java programming environment with the usage of three Java libraries. Namely, MorphoLibJ, DeepLearning4J, and ImageJ1. However, in the current version of their algorithm, it overestimates 1.5–3-fold the real captures count.
The last study was published in the same year [38]. In this work, the author also developed a three-phase insect counter pipeline similar to Ding and Taylor’s [40], but in this case, the segmentation was performed with the Selective Search algorithm. In addition, instead of the NMS, the soft-NMS algorithm was implemented because the soft-NMS with the right parameters can handle better touching insects. The author’s tests showed that the Selective Search object proposal produced 82% recognizer accuracy (7) on 30 test images while the insect counting algorithm had a 0.164 loss value (8).
A summary about the key properties of the insect counting methods can be found in Table 2. Only those methods are listed in the table where the target insect is the C. pomonella.

4. Discussion

4.1. Discussion on Camera-Equipped Traps

In Section 3.1, Section 3.2, Section 3.3, more prototype and commercial traps were investigated for monitoring codling moth. Not surprisingly, we have much more information about the published prototype traps than about commercial traps. Nonetheless, independently of the trap type, the basic concept is similar. All of them consist of a trap house which includes integrated electronics (controller unit, camera, communication module, etc.) battery and a sticky plate. However, according to the collected information about the hardware background of automated traps, different design principles can be observed. First is the question of the controller unit. One part of devices uses single board computer as the controller unit while other parts rely on microcontrollers. In the case of the single board computers, the Raspberry Pi “family” members are the most popular. Even though the Raspberry Pi devices have several benefits, choosing the right controller unit is not a trivial decision because different microcontrollers and single-board computes have different advantages and disadvantages. The Raspberry Pi devices are excellent in terms of processing power, connectivity, and storage space, but microcontrollers use a fraction of the energy that a Raspberry Pi may use [58]. Moreover, Raspberry devices do not have programmable sleep mode, real-time clock, and analog capabilities. For better illustration, Table 3 shows a comparison between the Raspberry Pi Zero W, ESP32-Cam board, and the Arduino Uno microcontroller board.
Despite the weaknesses of the single board computers, our opinion is that those devices will be the dominant in smart traps due to the computational capacity and software support. They make it possible for the high-level, Python programming due to the operating system. Therefore, deep object detectors can be easily ported. Although there are some microcontroller boards such as the ESP32 that supports the adaptation of deep artificial neural network models due to the Tensorfow Lite library [54], the restricted development environment and computational resources do not allow the adaptation of the widely used deep detectors. Finally, the weaknesses of single board computers can be eliminated by external circuit.
It is also visible that smart traps have a different level of automatization. Based on the automatization, traps can be categorized into two classes: fully or semi-automatic. In a fully automatic trap, the software is equipped with an insect counting method, while semi-automatic traps are based on remote insect identification and counting. In the first case, the insect counting takes place inside the trap. In the latter case, the trap captures image about the cached insects and sends it toward the server via wireless communication or just saves them in the background storage (SD card). In this case, the insect counter can be a human expert or a dedicated software on the server side. Both of those approaches have advantages and disadvantages. Putting the intelligence to the traps reduces the communication costs and latencies. In this case, only the evaluation results need to be transmitted toward the server side instead of the whole image. It limits the message size to a few bytes. Since the information package is small, delivery of packages is easily feasible on the cost-efficient LoRa radio channel. Against the LTE or other mobile network technologies, communication via the LoRa network also enlarge the battery life.
On the other hand, local data processing has a significant impact on battery management. Battery management is a critical point of all IoT applications. Some researchers observed that, in most IoT applications, the largest battery drain occurs when information is being transmitted over the wireless network [18,54]. However, if the insect counting is performed locally, the power consumption of information transmission is not as important as the runtime of the insect counter algorithm because the insect counter method multiplies the active state time of the trap. Due to the limited computational resources, it can be a huge increase. A good example that points out the differences between the computational power of controller units can be found in [42] where the runtime of the same object detector was 0.51 s on an Nvidia Jetson TX2 while on a Raspberry Pi 3B it was 24.82 s. Related to the battery management, another important factor is the number of images obtained per day. To minimize the power consumption, the controller software sends the device into sleep or standby mode after the active period. In most cases, the automated trap is in active state just once a day [21,22]. However, multiple shots per day have also been reported for experimental prototypes [12,27]. Obviously, multiple active states reduce the battery lifetime because it significantly increases the average power consumption of the trap. Therefore, if it is not justified, one image per day is enough for moth population forecast.
Finally, several automated traps have been designed for a particular research work but for series production, its cost is another key factor. The estimated costs are shown in Table 1. However, it is important to highlight that those prices depend on more factors such as the distributor, quantity, and year of manufacture. Here, it is not easy to compare costs because in some cases only the cost of particular trap components is given. For example, while in the paper of Preti et al. [12] the cost covers trap chassis, controller unit, batteries, solar panel, assembly cost and additional components, the estimated cost in [21] is only for the controller unit and the battery. Therefore, direct comparison is not recommended because it would lead to false conclusions.

4.2. Discussion on Moth Counting Methods

The rise of deep learning algorithms is clearly visible not just in object detection but also in insect counting [51]. Year by year, more agricultural scientists employ new techniques from deep learning for land mapping, crop classification, biotic/abiotic stress monitoring, and yield prediction [59,60]. This tendency is also observable in Section 3.6 where the insect counting methods have been presented. Most of them are based on deep learning-based object detectors. To better illustrate the relative advantages and disadvantages of those methods, their main characteristics have been summarized in Table 4.
None of the presented methods achieved a perfect result. One of the main reasons for this can be tracked back to the insufficient amount of data. For researchers, a rather limited number of trap images is available. It can cause problems at the time of model training even with data augmentation because a deep model requires a significant amount of data to optimize its parameters (weights and biases). If there is not enough training data, the different appearance of the target object cannot be completely covered. The insects falling into a trap may vary greatly in size, pose, and orientation. The same insect could have different wing poses, levels of occlusion, and decay conditions over time (see Figure 1). Another reason for the misclassification is the touching insects. This means that two or more touching insects are detected as one or remain undetected (Figure 6b). As an example, in the study by Hong et al. [16], moths with torn wings were detected as incorrect insect species while two touching insects were detected as one object. Moreover, some insects such as the C. pomonella show large intra-class variance. A sample image can be seen on Figure 6a where next to the C. pomonella, Light Brown Apple moth is also visible.
Only a little information is available about the software background of commercial traps. There is such a commercial system where the accuracy of the predicted insect count needs to be validated by a human operator. For example, Trapview trap automatically processes the high-resolution image and provides an estimated count of the captured insect species. However, manual confirmation is also a part of the customer service [18]. Cirjak et al. [1] claimed that the Trapview standard model had a problem with detecting other objects than the target insect while Preti et al. [61] observed that the system incorrectly detects morphologically similar insects. The original Z-Trap system is also not perfect. Although the predicted number of insects and the real number of insects are highly correlated, the prediction is not 100% accurate [20].
Taking into consideration only those methods where the target insect was the C. pomonella, it can be established that a generally acceptable moth counting method does not exist. Our observations show that, beyond the lack of data, another problem relies on the segmentation. Based on the findings of Bakkay et al. [55], conventional segmentation techniques are not efficient enough. Threshold-based segmentation algorithms are efficient only when the image does not contain a large amount of noise or other objects. The problem is the same with contour-based algorithms. The more sophisticated segmentation techniques such as Selective Search bring higher efficiency, but they also cannot handle well the touching insect problem. However, it must also be mentioned that the pest invasion prediction can tolerate at most a 20% deviation between the real and predicted number of insects.

5. Conclusions

Due to economic importance, the number of automated insect monitoring systems is continuously increasing and could completely replace the conventional monitoring approach. To optimize the insect monitoring process, both industry and academia fields are moving toward smart solutions, including automated traps. The detection and classification of insect pests with automated traps brings a major breakthrough to integrated pest management. This advanced insect monitoring direction can be exploited for pest invasion detection and survey which will help farmers to schedule orchard spraying. The automated traps can reduce staff costs due to a lower control of traps on the field but the sticky paper changing stays manual.
Taking into consideration the achievements in the field of hardware background, we can conclude that remote monitoring can be realized using some of the available automated traps. The integrated electronics inside them covers all necessary functionality for the automatic operation such as long-range wireless connection, sufficient power supply (with solar charger), and appropriate image resolution. Consequently, it can be said that the hardware background is given.
From the software side, the uncertainty is significantly greater. Despite the great achievements in insect classification, the algorithm-aided insect counting is not solved yet. Today, methods that use deep object detectors and classifiers are the most studied ones, because those techniques have already been applied effectively in many fields of science, including agriculture. The current tendency shows that deep models will offer solutions for the fully automatized insect counting but are currently not completely reliable. It can be traced back to more reasons, one of them is the lack of sufficient amounts of data. Another reason is the small size of insects. They occupy only a small region of the trap image and the object detector algorithm (e.g., YOLO) cannot localize them well. Finally, the touching insects (see Figure 6b) look like one object where cached moths will not be counted correctly.
Even though insect counting methods are not yet perfect, they can indicate the sudden increase in cached insects (even if the values are not completely accurate) and the spraying should be started when the insect pest population reaches a critical level. This event can be indicated by some earlier proposed traps and insect counting methods.
The efficient pairing of the hardware and software components will help reduce the environmental footprint while saving cost and time.

Funding

This work has been supported by the eKÖZIG Regionális Informatikai Szolgáltató Központ Zrt thanks to the project No. 2020-1.1.2-PIACI-KFI-2021-00249. Project No. 2020-1.1.2-PIACI-KFI-2021-00249 has been implemented with the support provided by the Ministry of Innovation and Technology of Hungary from the National Research, Development and Innovation Fund, financed under the 2020-1.1.2-PIACI KFI funding scheme.

Acknowledgments

The authors would like to thank the Eközig company for the technical background provided.

Conflicts of Interest

The authors declare no conflict of interest.

References

  1. Cirjak, D.; Miklecic, I.; Lemic, D.; Kos, T.; Zivkovic, P.I. Automatic pest monitoring systems in apple production under changing climate conditions. Horticulturae 2022, 8, 520. [Google Scholar] [CrossRef]
  2. Witzgall, P.; Stelinski, L.; Gut, L.; Thomas, D. Codling moth management and chemical ecology. Annu. Rev. Entomol. 2008, 53, 503–522. [Google Scholar] [CrossRef] [PubMed] [Green Version]
  3. Son, A.R.; Suh, S.J.; Park, Y.M. Notes on insects captured in codling moth (Lepidoptera: Tortricidae) surveillance traps in South Korea over the last eight years. Bull. OEPP/EPPO 2018, 48, 578–582. [Google Scholar] [CrossRef]
  4. Jiang, D.; Chen, S.; Hao, M.; Fu, J.; Ding, F. Mapping the potential global codling moth (Cydia pomonella L.) distribution based on a machine learning method. Sci. Rep. 2018, 8, 13093. [Google Scholar] [CrossRef]
  5. Horner, R.M.; Lo, P.L.; Rogers, D.J.; Walker, J.T.S.; Suckling, D.M. Combined effect of mating disruption, insecticides, and the sterile insect technique on Cydia pomonella in New Zealand. Insects 2020, 11, 837. [Google Scholar] [CrossRef]
  6. Men, Q.L.; Chen, M.H.; Zhang, Y.L.; Feng, J.N. Genetic structure and diversity of a newly invasive species, the codling moth, Cydia pomonella (L.) (Lepidoptera: Tortricidae) in China. Biol. Invasions 2013, 15, 447–458. [Google Scholar] [CrossRef]
  7. Beers, E.H.; Horton, D.R.; Miliczky, E. Pesticides used against Cydia pomonella disrupt biological control of secondary pests of apple. Biol. Control 2016, 102, 35–43. [Google Scholar] [CrossRef] [Green Version]
  8. Hoye, T.T.; Arje, J.; Bjerge, K.; Hansen, O.L.P.; Iosifidis, A.; Leese, F.; Mann, H.M.R.; Meissner, K.; Melvad, C.; Raitoharju, J. Deep learning and computer vision will transform entomology. Proc. Natl. Acad. Sci. USA 2020, 118, e2002545117. [Google Scholar] [CrossRef]
  9. Higbee, B.S.; Calkins, C.O.; Temple, C.A. Overwintering of codling moth (Lepidoptera: Tortricidae) larvae in apple harvest bins and subsequent moth emergence. J. Econ. Entomol. 2001, 94, 1511–1517. [Google Scholar] [CrossRef]
  10. Lima, M.C.F.; Leandro, M.E.D.A.; Valero, C.; Coronel, L.C.P.; Bazzo, C.O.G. Automatic detection and monitoring of insect pests—A review. Agriculture 2020, 10, 161. [Google Scholar] [CrossRef]
  11. Muppala, C.; Guruviah, V. Machine vision detection of pests, diseases and weeds: A review. J. Phytol. 2019, 12, 9–19. [Google Scholar] [CrossRef] [Green Version]
  12. Preti, M.; Moretti, C.; Scarton, G.; Giannotta, G.; Angeli, S. Developing a smart trap prototype equipped with camera for tortricid pests remote monitoring. Bull. Insectol. 2021, 74, 147–160. [Google Scholar]
  13. Qing, Y.A.; Jin, F.E.; Jian, T.A.; Xu, W.G.; Zhu, X.H.; Yang, B.J.; Jun, L.Ü.; Xie, Y.Z.; Bo, Y.A.; Wu, S.Z.; et al. Development of an automatic monitoring system for rice light-trap pests based on machine vison. J. Integr. Agric. 2020, 19, 2500–2513. [Google Scholar]
  14. Tetila, E.C.; Machado, B.B.; Astolfi, G.; Belete, N.A.S.; Amori, W.P.; Roel, A.R.; Pistori, H. Detection and classification of soybean pests using deep learning with UAV images. Comput. Electron. Agric. 2020, 179, 105836. [Google Scholar] [CrossRef]
  15. Kamilaris, A.; Prenafeata-Boldú, F.X. Deep learning in agriculture: A survey. Comput. Electron. Agric. 2018, 147, 70–90. [Google Scholar] [CrossRef] [Green Version]
  16. Hong, S.J.; Kim, S.Y.; Kim, E.; Lee, C.H.; Lee, J.S.; Lee, D.S.; Bang, J.; Kim, G. Moth detection from pheromone trap images using deep learning object detectors. Agriculture 2020, 10, 170. [Google Scholar] [CrossRef]
  17. Mamdouh, N.; Khattab, A. YOLO-based deep learning framework for olive fruit fly detection and counting. IEEE Access 2021, 9, 84252–84262. [Google Scholar] [CrossRef]
  18. Preti, M.; Verheggen, F.; Angeli, S. Insect pest monitoring with camera-equipped traps: Strengths and limitations. J. Pest Sci. 2021, 94, 203–217. [Google Scholar] [CrossRef]
  19. Parsons, R.; Ross, R.; Robert, K. A survey on wireless sensor network technologies in pest management applications. SN Appl. Sci. 2020, 2, 28. [Google Scholar] [CrossRef] [Green Version]
  20. Lounghlin, D. Developments in the world of insect detection. Int. Pest Control 2013, 55, 88–90. [Google Scholar]
  21. Schrader, M.J.; Smytheman, P.; Beers, E.H.; Khot, L.R. An open-source low-cost imaging system plug-in for pheromone traps aiding remote insect pest population monitoring in fruit crops. Machines 2022, 10, 52. [Google Scholar] [CrossRef]
  22. Guarnieri, A.; Maini, S.; Molari, G.; Rondelli, V. Automatic trap for moth detection in integrated pest management. Bull. Insectology 2011, 64, 247–251. [Google Scholar]
  23. Brunelli, D.; Albanese, A.; d’Acundo, D.; Nardello, M. Energy neutral machine learning based IoT device for pest detection in precision agriculture. IEEE Internet Things Mag. 2019, 2, 10–13. [Google Scholar] [CrossRef]
  24. Segella, A.; Fiacco, G.; Tramarin, L.; Nardello, M.; Brunelli, D. Neural networks for pest detection in precision agriculture. In Proceedings of the 2020 IEEE International Workshop on Metrology for Agriculture and Forestry, Trento, Italy, 4–6 November 2020; pp. 7–12. [Google Scholar]
  25. Brunelli, D.; Polonelli, T.; Benini, L. Ultra-low energy pest detection for smart agriculture. In Proceedings of the 2020 IEEE Sensors, Rotterdam, The Netherlands, 25–28 October 2020; pp. 1–4. [Google Scholar]
  26. Perez-Aparicio, A.; Llorens, J.; Rosello-Polo, J.R.; Marti, J.; Gemeno, C. A cheap electronic sensor automated trap for monitoring the flight activity period of moths. Eur. J. Entomol. 2021, 118, 315–321. [Google Scholar] [CrossRef]
  27. Hadi, M.K.; Kassim, M.S.M.; Wayayok, A. Development of an automated multidirectional pest sampling detection system using motorized sticky traps. IEEE Access 2021, 9, 67391–67404. [Google Scholar] [CrossRef]
  28. Suto, J. A novel plug-in board for remote insect monitoring. Agriculture 2022, in press. [Google Scholar]
  29. Xie, C.; Zhang, J.; Rui, L.; Li, J.; Hong, P.; Xia, J.; Chen, P. Automatic classification for field crop insects via multiple-task sparse representation and multiple-kernel learning. Comput. Electron. Agric. 2015, 119, 123–132. [Google Scholar] [CrossRef]
  30. Wang, J.; Lin, C.; Ji, L.; Liang, A. A new automatic identification system of insect images at the order level. Knowl. Based Syst. 2012, 33, 102–110. [Google Scholar] [CrossRef]
  31. Wen, C.; Guyer, D. Image-based orchard insect automated identification and classification method. Comput. Electron. Agric. 2012, 89, 110–115. [Google Scholar] [CrossRef]
  32. Martineau, M.; Conte, D.; Raveaux, R.; Arnault, I.; Munier, D.; Venturini, G. A survey on image-based insect classification. Pattern Recognit. 2017, 65, 273–284. [Google Scholar] [CrossRef] [Green Version]
  33. Kalamatianos, R.; Karydis, I.; Doukakis, D.; Avlonitis, M. DIRT: The Dacus image recognition toolkit. J. Imaging 2018, 4, 129. [Google Scholar] [CrossRef] [Green Version]
  34. Xie, C.; Wang, R.; Zhang, J.; Chen, P.; Dong, W.; Li, R.; Chen, T.; Chen, H. Multi-level learning features for automatic classification of field crop pests. Comput. Electron. Agric. 2018, 152, 233–241. [Google Scholar] [CrossRef]
  35. Kasinathan, T.; Uyyala, S.R. Machine learning ensemble with image processing for pest identification and classification in field crops. Neural Comput. Appl. 2021, 33, 7491–7504. [Google Scholar] [CrossRef]
  36. Thenmonzi, K.; Reddy, U.S. Crop pest classification based on deep convolutional neural network and transfer learning. Comput. Electron. Agric. 2019, 164, 104906. [Google Scholar] [CrossRef]
  37. Wu, X.; Zhang, C.; Lai, Y.K.; Cheng, M.M.; Yang, J. IP102: A large scale benchmark dataset for insect pest recognition. In Proceedings of the IEEE/CVF Conference on Computer Vision and Pattern Recognition, Long Beach, CA, USA, 15–20 June 2019; pp. 8787–8796. [Google Scholar]
  38. Suto, J. Embedded system -based sticky paper trap with deep learning-based insect-counting algorithm. Electronics 2021, 10, 1754. [Google Scholar] [CrossRef]
  39. Bjerge, K.; Nielsen, J.B.; Sepstrup, M.V.; Helsing-Nielsen, F.; Hoye, T.T. An automated light trap to monitor moth (Lepidoptera) using computer vision-based tracking and deep learning. Sensors 2021, 21, 343. [Google Scholar] [CrossRef]
  40. Ding, W.; Taylor, G. Automatic moth detection from trap images for pest management. Comput. Electron. Agric. 2016, 123, 17–28. [Google Scholar] [CrossRef] [Green Version]
  41. Chen, Y.S.; Hsu, C.S.; Lo, C.L. An entire-and-partial feature transfer learning approach for detecting the frequency of pest occurrence. IEEE Access 2020, 8, 92490–92502. [Google Scholar] [CrossRef]
  42. Sun, Y.; Liu, X.; Yuan, M.; Ren, L.; Wang, J.; Chen, Z. Automatic in-trap pest detection using deep learning for pheromone-based Dendroctonus valens monitoring. Biosyst. Eng. 2018, 176, 140–150. [Google Scholar] [CrossRef]
  43. Zhong, Y.; Gao, J.; Lei, Q.; Zhou, Y. A vision-based counting and recognition system for flying insects in intelligent agriculture. Sensors 2018, 18, 1489. [Google Scholar] [CrossRef] [Green Version]
  44. Rustia, D.J.A.; Lin, C.E.; Chung, J.Y.; Zhuang, Y.J.; Hsu, J.C.; Lin, T.T. Application of image and environmental sensor network for automated greenhouse insect pest monitoring. J. Asia Pac. Entomol. 2020, 23, 17–28. [Google Scholar] [CrossRef]
  45. Deng, L.; Wang, Y.; Han, Z.; Yu, R. Research on insect pest image detection and recognition based on bio-inspired method. Biosyst. Eng. 2018, 169, 139–148. [Google Scholar] [CrossRef]
  46. Yalcin, H. Vision Based Automatic Inspection of Insects in Pheromone Traps. In Proceedings of the 2015 Fourth International Conference on Agro-Geoinformatics, Turkey, Istanbul, 20–24 July 2015; pp. 333–338. [Google Scholar]
  47. Dawei, W.; Limiao, D.; Jiangong, N.; Jiyue, G.; Hongfei, Z.; Zhongzhi, H. Recognition pest by image-based transfer learning. J. Sci. Food Agric. 2019, 99, 4524–4531. [Google Scholar] [CrossRef] [PubMed]
  48. Nanni, L.; Maguolo, G.; Pancino, F. Insect pest image detection and recognition based on bio-inspired methods. Ecol. Inform. 2020, 57, 101089. [Google Scholar] [CrossRef] [Green Version]
  49. Xia, D.; Chen, P.; Wang, B.; Zhang, J.; Xie, C. Insect detection and classification based on an improved convolutional neural network. Sensors 2018, 18, 4169. [Google Scholar] [CrossRef] [PubMed]
  50. Simonyan, K.; Zisserman, A. Very deep convolutional networks for large-scale image recognition. In Proceedings of the 5th International Conference on Learning Representations, San Diego, CA, USA, 7–9 May 2015; pp. 1–14. [Google Scholar]
  51. Zhao, Z.Q.; Zheng, P.; Xu, S.; Wu, X. Object detection with deep learning: A review. IEEE Trans. Neural Netw. Learn. Syst. 2019, 30, 3212–3232. [Google Scholar] [CrossRef] [PubMed] [Green Version]
  52. Arel, I.; Rose, D.C.; Karnowski, T.P. Deep machine learning—A new frontier in artificial intelligence research. IEEE Comput. Intell. Mag. 2010, 5, 13–18. [Google Scholar] [CrossRef]
  53. Suto, J.; Oniga, S. Efficiency investigation from shallow to deep neural network techniques in human activity recognition. Cogn. Syst. Res. 2019, 54, 37–49. [Google Scholar] [CrossRef]
  54. Saradopoulos, I.; Potamitis, I.; Ntalampiras, S.; Konstantaras, A.I. Edge computing for vision-based, urban-insects traps in the context of smart cities. Sensors 2022, 22, 2006. [Google Scholar] [CrossRef] [PubMed]
  55. Bakkay, M.C.; Chambon, S.; Rashwan, H.A.; Lubat, C.; Barsotti, S. Automatic detection of individual and touching moths from trap images by combining contour-based and region-based segmentation. IET Comput. Vis. 2018, 12, 138–145. [Google Scholar] [CrossRef] [Green Version]
  56. Rustia, D.J.A.; Lin, C.E.; Chung, J.Y.; Lin, T.T. An object classifier using support vector machines for real-time insect pest counting. In Proceedings of the 2017 Conference on BioMechatronics and Agricultural Machinery Engineering, Taipei, Taiwan, 20–22 September 2017; pp. 275–278. [Google Scholar]
  57. Rong, M.; Wang, Z.; Ban, B.; Gou, X. Pest identification and counting of yellow plate in field based on improved Mask R-CNN. Discret. Dyn. Nat. Soc. 2022, 2022, 1913577. [Google Scholar] [CrossRef]
  58. Jolles, J.W. Broad scale applications of the Raspberry Pi: A Review and guide for biologist. Methods Ecol. Evol. 2021, 12, 1562–1579. [Google Scholar] [CrossRef]
  59. Wang, D.; Cao, W.; Zhang, F.; Li, Z.; Xu, S.; Wu, X. A review of deep learning in multiscale agricultural sensing. Remote Sens. 2022, 14, 559. [Google Scholar] [CrossRef]
  60. Alibabaei, K.; Gaspar, P.D.; Lima, T.M.; Campos, R.M.; Girao, I.; Monteiro, J.; Lopes, C.M. A review of the challenges of using deep learning algorithms to supply decision-making in agricultural activities. Remote Sens. 2022, 14, 638. [Google Scholar] [CrossRef]
  61. Preti, M.; Favaro, R.; Knight, A.L.; Angeli, S. Remote monitoring of Cydia pomonella adults among an assemblage of nontargets in sex pheromone-kairomone-baited smart traps. Pest Manag. Sci. 2020, 77, 4084–4090. [Google Scholar] [CrossRef]
Figure 1. Sticky papers with captured moths (a,b), and without moth (c).
Agriculture 12 01721 g001
Figure 2. Commercial traps: (a) TrapView; (b) iSCOUT; (c) Z-Trap.
Agriculture 12 01721 g002
Figure 3. Prototype traps: (a) [22,23,24,25]; (b) [26]; (c) [27]; (d) [21].
Agriculture 12 01721 g003
Figure 4. Six sample images of the Fieldguide Challenge dataset with dimensions.
Agriculture 12 01721 g004
Figure 5. Trap images: (a) yellow sticky paper image; (b) liquid trap image.
Agriculture 12 01721 g005
Figure 6. (a) Trap image with C. pomonella and Light Brown Apple moth (red boxes); (b) undetected touching insects.
Agriculture 12 01721 g006
Table 1. Key features of automated traps. Empty cell means that the information is not available.
Trap TypeControllable UnitBattery
Capacity
Power
Consumption
Solar ChargerCameraCommunicationInsect
Counting
Cost/
Unit
Trapview-2 × 2.2 Ah-Yes4 × 5 MPMobile networkServer side-
iSCOUT-12 Ah-Yes10 MPMobile networkServer side-
[12]ESP 323.5 Ah1.5 W (active state)Yes5 MPMobile networkServer sideEUR 375
[21]Arducam
IoTai
0.35 Ah-No2 MPNot usedNot appliedUSD 33
[22]S60 phone4 × 4.8 Ah-No3 MPMobile networkNot applied-
[23]Pi 3 + Movidius stick9 Ah-No8 MPLoRaIn-trap-
[24]Pi 3 + Movidius stick1.8 Ah0.054 W
(average)
Yes-LoRaIn-trap-
[25]GAP8 SoC-30 uW (sleep mode)No>1 MPLoRaIn-trap-
[26]Pi Zero W7 Ah-Yes8 MPNot usedNot appliedEUR 150
[27]Pi 3 + Arduino Uno7.2 A-No8 MPNot usedNot appliedUSD 500
[28]Pi Zero11 Ah2.4 W (active state)
2 2 mW
(inactive state)
Yes8 MPLoRA/mobile networkIn-trapUSD 75
Table 2. C. pomonella counting methods. Empty cell means that the information is not available.
ArticleSegmentationClassifierImage ResolutionPerformance
[40]Sliding-windowCNN640 × 48093.1 AP
[23]OpenCV’s blob detectorVGG16-94.38% (2)
92.6% (3)
[24]-LeNet-97.6% (2)
100% (3)
[12]-CNN2592 × 1944>20% (2)
[38]Selective SearchCNNvarious0.164 (8)
Table 3. Main features of Raspberry Pi Zero W, ESP32-Cam, and Arduino Uno.
SpecificationRaspberry Pi Zero WESP32-CamArduino Uno
TypeSingle-board computerMicrocontrollerMicrocontroller
Operating systemRaspberry Pi OSFreeRTOSNone
Processor32-bit32-bit8-bit
Memory512 MB520 KB32 Kb
Clock frequency1 GHz160 MHz16 MHz
TypeSingle-board computerMicrocontrollerMicrocontroller
Operating systemRaspberry Pi OSFreeRTOSNone
Camera portYesYesNo
Input voltage5 V5 V7–12 V
IO pins40 (PWR, GND, digital)16 (PWR, GND, digital, analogue)20 (PWR, GND, digital, analogue)
Background storageMicroSD card (up to 1 TB)MicroSD card (up to 4 GB)Flash memory (32 KB)
Power consumption (in idle state)750 mW~900 mW<250 mW
Sleep modeNoYesYes
Table 4. Main characteristics of insect counting methods.
ArticleYearMethodInsect(s)Decision timePerformance
[40]2016Sliding-window + CNNCodling mothsHigh93.1 AP
[23]2018RetinaNetRed Turpentine BeetleMedium0.751 AP
[43]2018YOLO + SVMBee, fly, fruit fly, etc.High93.99% (3)
[44]2020Blob detector + SVMWhiteflies, thrips, flies, and aphidsLow<96% (6)
[16]2020Faster RCNNS. liture, H. assulta, S. exiguaMedium90.25 AP
[13]2020Segmentation + CNNS. inferens, C. suppressalis, C. medinalisMedium88.9 mAP
[17]2021Modified YOLOOlive fruit flyMedium96.69 mAP
[57]2022Mask R-CNNAphids, leaf miner flies, grasshoppersMedium80.2 mAP
[38]2022Selective search + CNNCodling mothHigh0.164 (8)
Publisher’s Note: MDPI stays neutral with regard to jurisdictional claims in published maps and institutional affiliations.

