Article

Soil Microbial Community Driven by Soil Moisture and Nitrogen in Milk Vetch (Astragalus sinicus L.)–Rapeseed (Brassica napus L.) Intercropping

Research Center on Ecological Sciences, Jiangxi Agricultural University/Key Laboratory of Crop Physiology, Ecology and Genetic Breeding, Ministry of Education, Nanchang 330045, China
*
Authors to whom correspondence should be addressed.
Agriculture 2022, 12(10), 1538; https://doi.org/10.3390/agriculture12101538
Submission received: 27 July 2022 / Revised: 16 September 2022 / Accepted: 21 September 2022 / Published: 24 September 2022
(This article belongs to the Section Agricultural Soils)

Abstract

:
The soil microbial community is not only driven by plant composition but is also disturbed by the soil environment. Intercropping affects the soil microenvironment through plant interaction, but the understanding of the relationship between soil microbial community and environment in intercropping is still weak. In this study, milk vetch intercropping with rapeseed was used to explore the interaction between soil microorganisms and environment. The results showed that the soil moisture content of intercropping was higher than that of monoculture during the reproductive period of rapeseed growth (flowering and podding stages). The contents of soil total nitrogen and alkali-hydrolyzable nitrogen in intercropping were higher than those in monoculture. The dominant soil microbial communities in intercropping were the same as in monoculture and included Chloroflexi, Proteobacteria, Actinobacteria, Acidobacteria, Firmicutes, Gemmatimonates and Bacteroidetes. However, intercropping increased the Shannon index and decreased the Simpson’s index of the soil microbial community. The changes in the soil microbial community were mainly related to soil temperature, moisture, pH, total nitrogen, alkali-hydrolyzable nitrogen and available potassium. Moreover, there was a negative correlation between soil moisture and microorganisms and a positive correlation between nitrogen and microorganisms. Thus, milk vetch–rapeseed intercropping could not only improve soil nitrogen content, but also change soil microbial community diversity. In dryland red soil, the effect of milk vetch–rapeseed intercropping on soil moisture and nitrogen was the key factor contributing to the changes in the soil microbial community. When planting rapeseed in the future, we could consider the application of intercropping with milk vetch, which can contribute to regulating the soil nitrogen pool and improving microbial diversity.

1. Introduction

Soil microorganisms, as an important medium for maintaining ecosystem function [1], directly affect soil carbon (C), the nitrogen (N) cycle and nutrient transformation [2,3]. The structure and functional diversity of soil microbial communities are not only driven by crop diversity, but also disturbed by the soil environment [4]. For example, intercropping brassica plants decreased soil bacterial abundance and increased fungal abundance in the wheat rhizosphere [5], while intercropping cowpea improved the diversity of bacteria and fungi, and increased the number of beneficial microorganisms in maize rhizosphere soil [6]. Soil temperature affects microbial respiration [7] by increasing the supply of respiratory substrates, because temperature rises significantly increased the dissolved soil organic carbon [8] and litter decomposition rate [9]. Soil moisture not only directly controls microbial activities, but also influences the substrates and energy substances that soil microorganisms require for respiration by controlling the availability and mobility of soluble organic matter [7,10]. Therefore, exploring the effect of the soil environment and crop diversity on microorganisms is conducive to maintaining the stability of ecosystem functions [1].
Intercropping impacts the soil environment and microorganisms [11,12] due to the “plant–microorganism–environment” interaction [13]. Intercropping indirectly changes plant residues and root exudates by increasing biodiversity, thus increasing soil enzyme activity and microbial community functional diversity [14,15,16]. Conversely, changes in soil microorganisms and enzyme activities can also influence the soil environment, resulting in increased crop yield and quality [17]. For example, millet–mung bean intercropping effectively improved the activities of soil catalase, urease and sucrase, and increased the number of soil microorganisms and soil fertility, thus increasing millet yield [18]. Intercropping cowpea changed the community structure of maize rhizosphere microorganisms and improved the diversity of bacteria and fungi, thus increasing the number of beneficial microorganisms in rhizosphere soil, reducing the number of potentially pathogenic bacteria and other harmful microorganisms, and strengthening the disease resistance of maize [6]. In an intercropping system, microorganisms are the key members of SOM decomposition and transformation [19], which can transform nutrients that are not easily absorbed by crops into nutrients that are easily absorbed [20,21]. For example, rhizobia convert atmospheric nitrogen into NH4+ and/or NO3 [22,23,24,25]. Therefore, it is of great significance for agricultural sustainability that the effects of the soil environment on microorganisms during intercropping be explored.
At present, Gramineae–Leguminosae intercropping is the most important intercropping system, including corn–peanut [26], corn–cowpea [27], cereal–legume [28], etc. Gramineae–Leguminosae intercropping can improve farmland productivity by complementary utilization of environmental resources [29] and by changing the structural characteristics of the rhizosphere soil microbial community [26]. In addition to Gramineae–Leguminosae intercropping, the potential of Legume–Brassica intercropping system in improving farmland productivity and microbial diversity has also attracted more attention [30]. It was found that intercropping with milk vetch (Astragalus sinicus L.) could promote the growth of rapeseed (Brassica napus L.) and improve crop yield [30,31]. Moreover, Legumes play an important role in these intercropping systems due to biological nitrogen fixation, which can increase the source and absorption of nitrogen by adjacent plants [32,33].
In Gramineae–Leguminosae intercropping, temporal and spatial differences in crop nutrition and moisture absorption reduce competition for resources between crops [29]; flavonoids secreted by legumes induce the expression of rhizobium nodulation genes, recognized synthesize plant nodulation factors [34,35], and recruit more nitrogen-fixing bacteria [36], so as to change the microbial community structure and affect plant–mycorrhizal interactions [33,37]. For example, maize–peanut intercropping improved the abundance of microorganisms related to nitrogen fixation in rhizosphere soil (Rhizobium hainanense, Rhizobium leguminosarum and Frankia, etc.) [26], increased legume nitrogen fixation and promoted crop growth. However, in focusing on the influence of biotic factors (biological nitrogen fixation) on soil microorganisms in the intercropping system, the importance of abiotic factors (soil hydrothermal and nutrients) is often overlooked, especially in the Legume–Brassica intercropping system.
Although changes in the soil microbial community of the rapeseed rhizosphere were found in the milk vetch–rapeseed intercropping [38], how milk vetch–rapeseed intercropping changes the soil microbial community is not clear, and its effects on the soil environment are rarely reported. Thus, in order to further reveal how milk vetch–rapeseed intercropping changes the microbial community by affecting the soil environment, we hypothesized that: (1) milk vetch–rapeseed intercropping increases soil moisture content because of the cover crop; (2) milk vetch–rapeseed intercropping has higher soil nitrogen content due to biological nitrogen fixation of leguminous crops; (3) soil microorganisms will be affected by soil nitrogen and moisture in milk vetch–rapeseed intercropping. Then, monoculture milk vetch, monoculture rapeseed and milk vetch–rapeseed intercropping were set up to explore how milk vetch–rapeseed intercropping affects soil microorganisms.

2. Materials and Methods

2.1. Site Description

The experiment was conducted in the Science and Technology Park of Jiangxi Agricultural University (28°46′ N, 115°55′ E), Nanchang, Jiangxi Province, China. The soil was typical dryland red soil. The average annual sunshine is 1559.9 h; the average annual total sunshine radiation is 102.55 kJ·cm2; the frost-free period is about 269 days; the average annual rainfall is 1658.9 mm; the average annual temperature is 16.5 °C; and the active accumulated temperature ≥ 10 °C is 5521 °C. The soil pH was 4.75 and the organic matter content was 23.17 g·kg1; total nitrogen content was 1.29 g·kg1, total phosphorus content 0.92 g·kg1, total potassium content 11.14 g·kg1, alkali-hydrolyzable nitrogen content 99.98 mg·kg1, available phosphorus content 5.01 mg·kg1, and available potassium content 118.44 mg·kg1.

2.2. Experimental Design

A field experiment was set up in October 2019. The crops were rapeseed (variety: Yangguang 131) and milk vetch (variety: Yujiang Daye). Three crop systems were set up: I. monoculture rapeseed (R): hole sowing in wide and narrow row, with plant spacing of 20 cm, wide row spacing of 80 cm and narrow row spacing of 20 cm, 10 rows in each plot and 10 plants in each row; II. monoculture milk vetch (A): drill sowing, and the sowing amount was 45 kg·hm−2 (24 drills per plot, 2.8 g per drill); III. Intercropping (AR): milk vetch intercropping with rapeseed, rapeseed sowing was the same as monoculture, milk vetch was sown in wide row of rapeseed, and the sowing amount was 45 kg·hm−2 (14 drills per plot, 4.8 g per drill). Each treatment was set with 6 repetitions, arranged in random blocks, and the plot size was 3.0 m × 5.0 m. The first year (2019–2020): rapeseed and milk vetch were sown on 15 October 2019, the milk vetch was turned over and returned to the field during the full flowering period, and the rapeseed was harvested on 24 April 2020; The second year (2020–2021): rapeseed and milk vetch were sown on 25 October 2020, the milk vetch was turned over and returned to the field during the full flowering period, and the rapeseed was harvested on 5 May 2021. Stanley 17–17–17 ternary compound fertilizer (N 180 kg·hm−2, P2O5 180 kg·hm−2 and K2O 180 kg·hm−2) was applied once a year before sowing.

2.3. Sampling

From 25 October 2020 to 5 May 2021, soil temperature, moisture, nutrients and soil microbial community diversity were measured. Soil samples (0–10 cm) were collected at the seedling, stem elongation, flowering, podding and maturation stages of rapeseed. Five sampling points in each plot were collected and crushed, then mixed well, wrapped in sterile plastic bags and brought back to the laboratory. Each sample was divided into two parts. From one part, plant roots, debris and small stone particles was immediately removed and stored in the −80 °C refrigerator for soil microbial community diversity; the other part was naturally dried and screened for soil nutrients.

2.4. Soil Physico-Chemical Analysis

The soil temperature and moisture at the 10 cm soil depth were measured by using the soil temperature and moisture rapid measuring instrument (Vicometer WKT-M1, Taizhou, China): three original values were measured in each plot. The dried soil was ground into 1mm-sized particles, which were then used to measure nutrients. The pH value [39] of the soil was measured by pH meter. Soil total carbon [40] was determined by the burning method, and soil total nitrogen [41] was analyzed and determined by Automatic Kjeldahl Nitrogen Meter. Total phosphorus [42] was determined by NaOH melting molybdenum antimony anti-colorimetry. Total potassium [42] was determined by NaOH melting atomic spectrophotometry. Soil alkali-hydrolyzable nitrogen [43] was determined by the alkali-hydrolyzable diffusion method. Soil available phosphorus [44] was determined by the Black method (HCl-NH4F). Soil available potassium [45] was extracted with neutral 1 mol/L ammonium acetate solution and determined by flame photometer.

2.5. Soil Microbial Community

The processes for measuring the soil microbial community included DNA extraction, PCR amplification, fluorescence quantification and upper machine sequencing (Shanghai Majorbio Company, Shanghai, China). The specific steps were as follows: (1) DNA extraction: microbial DNA was extracted by rapid extraction method, the primer was 338F_806R (bacterial 16SrRNA) [46]. After completion of genomic DNA extraction, 1% agarose gel electrophoresis was utilized to detect the extracted genomic DNA. (2) PCR amplification: sequencing regions were as specified, and specific primers with barcodes were synthesized. PCR was performed using TransGen AP221-02 (Beijing, China): TransStart Fastpfu DNA Polymerase, PCR machine: ABI GeneAmp®9700 (USA). Three replicates of each sample were pooled and the PCR products from the same sample were examined by 2% agarose gel electrophoresis; the PCR products were recovered by gel cutting using the AxyPrep DNA Gel Recovery Kit (Axygen Inc., Waltham, MA, USA), Tris HCl elution, detected by 2% agarose electrophoresis. (3) Fluorescence quantification: referring to the electrophoresis preliminary quantification results, the PCR products were stained with QquantiFluor™-ST (USA); assay quantification was performed with the st blue fluorescence quantitation system (Promega Corporation, Madison, WI, USA), after which each sample was pooled in the corresponding ratio according to the sequencing quantity requirement. (4) Miseq Library Construction: Illumina official adapter sequences were added to the outside end of the target region by PCR. The PCR products were gel recovered using a gel recovery kit, Tris HCl buffer elution and 2% agarose electrophoresis detection. Denaturation with sodium hydroxide, produced single–stranded DNA fragments. (5) Miseq sequencing: one end of the DNA fragment was complementary to the primer base and immobilized on the chip; PCR synthesis was performed using DNA fragments as templates and fixed base sequences on the chip as primers; the target DNA fragments to be tested were synthesized on the chip. After denaturation and annealing, the other end of the DNA fragment on the chip, randomly complementary to another primer nearby, was also fixed to form a “bridge”; PCR amplification resulted in DNA clusters. DNA amplicons were linearized to single strands. Modified DNA polymerases and dNTPs with 4 fluorescent labels were added to synthesize only one base per cycle. The reaction plate surface was scanned with a laser, and the nucleotide species that went up polymerized by the first round of the reaction for each template sequence were read. Chemical cleavage of the “fluoro group” and “terminator group” restored 3′ end stickiness, continuing polymerization of the second nucleotide. The fluorescence signal collected in each round was counted against the sequence of the template DNA fragment.

2.6. Statistical Analysis

Statistical analyses were carried out using SPSS software (IBM SPSS Statistics 25). A two-way repeated ANOVA was used to analyze the soil temperature and moisture of the crops (levels: rapeseed, milk vetch, and intercropping), the growth stage (stages: seedling, stem elongation, flowering, podding and maturation), and their interaction. If the interaction was significant (p < 0.05), pairwise comparisons with post hoc tests were performed using Duncan’s test. Soil nutrients were analyzed by one-way ANOVA with the crops (levels: rapeseed, milk vetch, and intercropping), and plots were made using origin 64 bit 2018 software. Soil microbial diversity was analyzed by Student’s t-test, differences between groups were tested by Kruskal–Wallis test; RDA figure and correlation heatmap figure were plotted using R software (version 3.3.1), and their correlation coefficient types were Spearman.

3. Results

3.1. Soil Temperature

A two-way repeated ANOVA was used to analyze soil temperature. The results showed that, crop, growth stage and their interaction significantly affected soil temperature (Figure 1). Soil temperature increased gradually from seedling to maturation stage. Soil temperature in monoculture milk vetch was higher than that in monoculture rapeseed and intercropping at the seedling and flowering stages, and it was also higher in monoculture milk vetch and intercropping than in monoculture rapeseed at the podding stage.

3.2. Soil Moisture

Soil moisture increased before the flowering stage, and decreased after the flowering stage (Figure 2). Crop had no significant effect on soil moisture, but growth stage and their interaction did have a significant effect on it. Soil moisture was higher in monoculture rapeseed than in monoculture milk vetch and intercropping at the stem elongation stage.

3.3. Soil Nutrients

The changes in soil pH value, total phosphorus and available phosphorus are small from the seeding to maturation stages (Figure 3). The contents of total carbon and total phosphorus at maturation stage were higher than those at the seedling stage, and the contents of alkali-hydrolyzable nitrogen and available potassium at the maturation stage were lower than those at the seedling stage. The total nitrogen content at the maturation stage was higher than that at the seedling stage in intercropping, and at the maturation stage, it was lower than that at the seedling stage in monoculture. Moreover, the total nitrogen content in intercropping and monoculture milk vetch was higher than that in monoculture rapeseed, and the alkali-hydrolyzable nitrogen content in intercropping was higher than that in monoculture rapeseed.

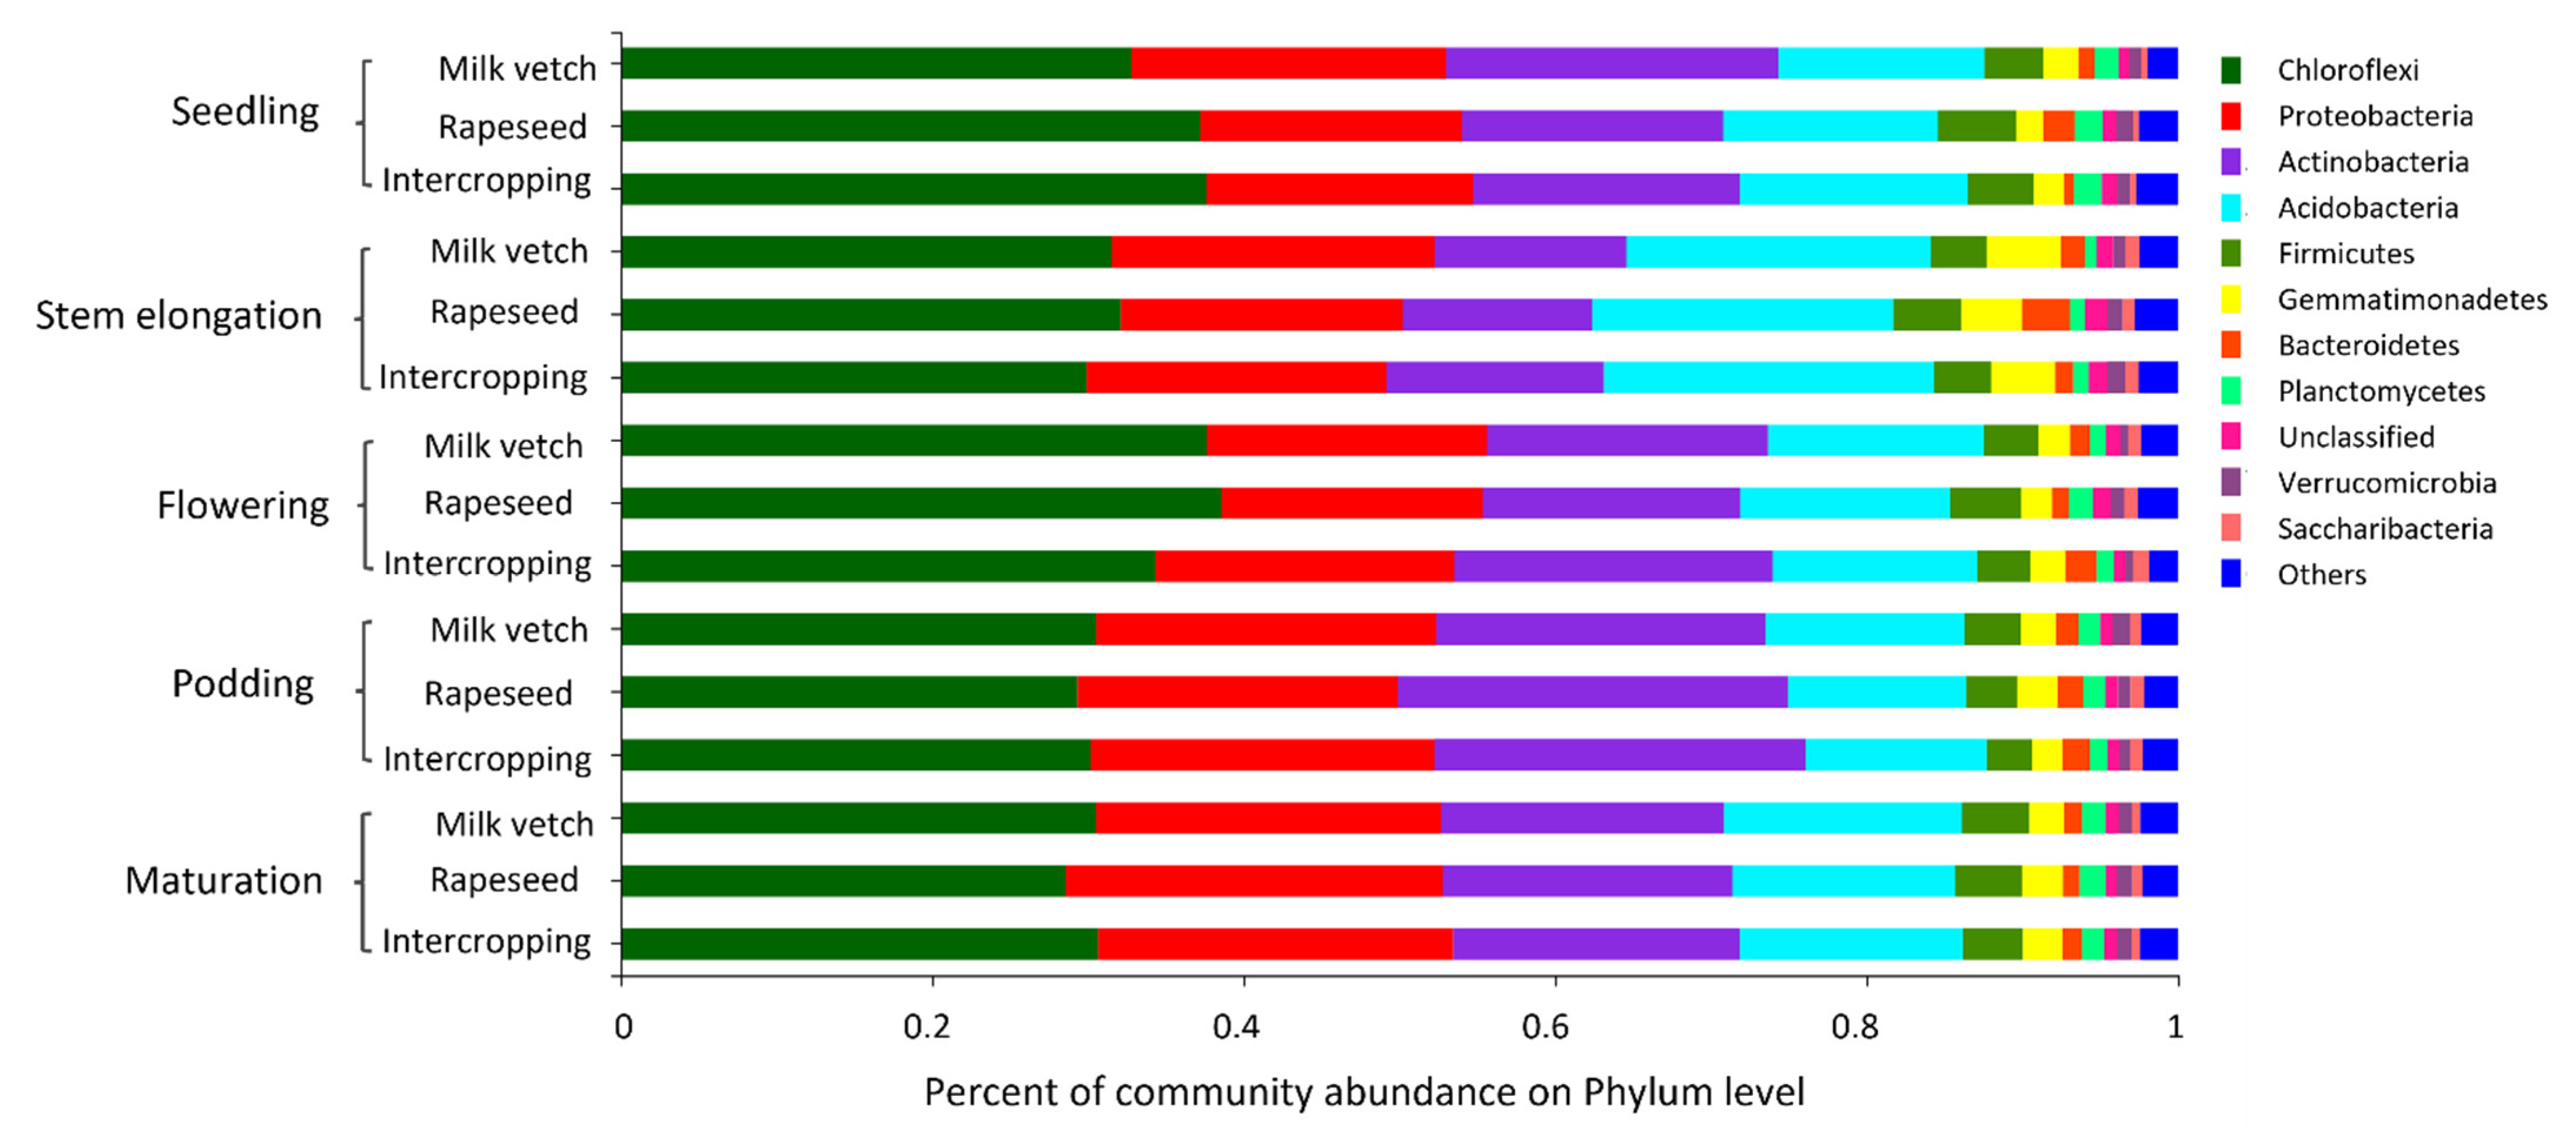
3.4. Soil Microbial Community Abundance

The analysis of soil microbial community abundance at phylum level found that Chloroflex, Proteobacteria, Actinobacteria, Acidobacteria, Firmicutes, Gemmatimonates and Bacteroidetes were the dominant phyla (Figure 4). Chloroflex, Proteobacteria, Actinobacteria, Acidobacteria, Firmicutes, Gemmatimonades, Bacteroidetes and Plantomycetes showed significant differences between growth stages. Only Proteobacteria in monoculture rapeseed and intercropping was lower than that in monoculture milk vetch (Figure 5).

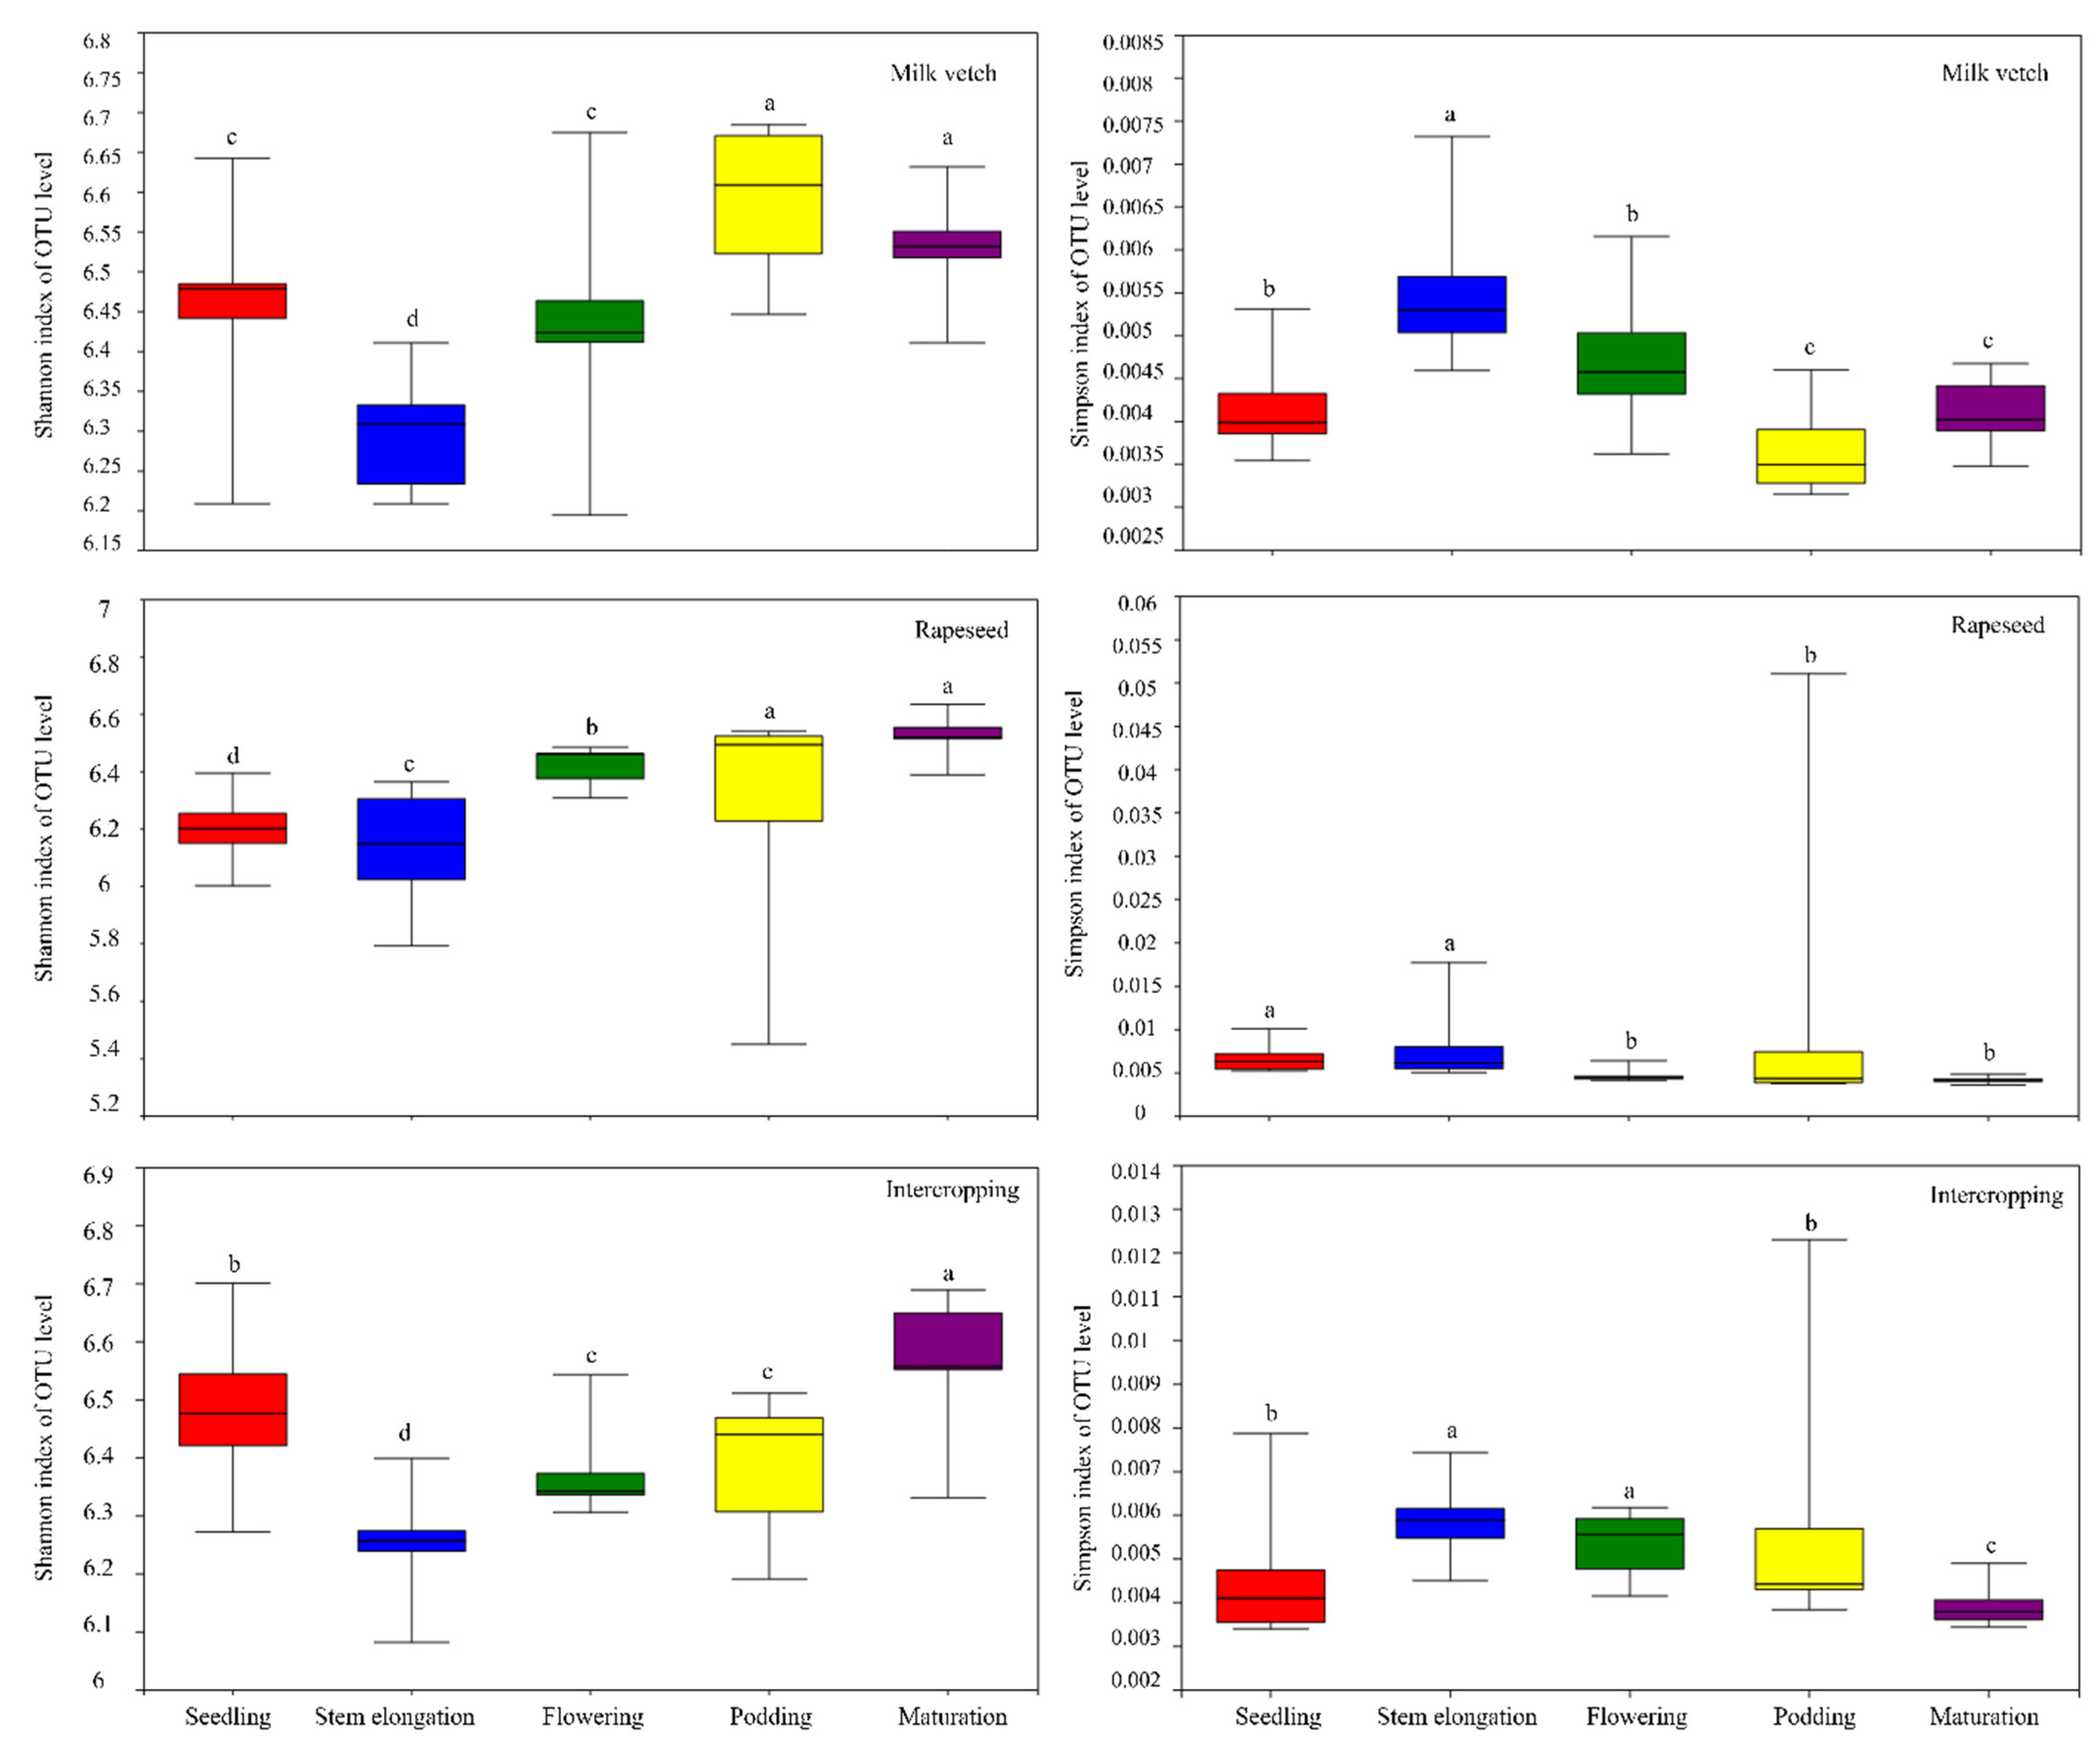
3.5. Soil Microbial Community Diversity

Soil microbial community diversity was significantly different between growth stages (Figure 6). In monoculture milk vetch and intercropping after the seedling stage, the Shannon index gradually increased, and the Simpson index gradually decreased from the early stages to the later stages. The Shannon index was higher at the maturation stage than at the stem elongation, flowering and podding stages in intercropping. The Simpson index was lower at the maturation stage than at the stem elongation and flowering stages in intercropping. The Shannon index was higher at the maturation stage than at the seedling stage in monoculture rapeseed, whereas the Simpson index at the maturation stage was significantly lower than that at the seedling stage in monoculture rapeseed. In monoculture milk vetch, the Shannon indices at the seedling, podding and maturation stages were significantly higher than those at the stem elongation stage, indicating that the Simpson index results were opposite to those of the Shannon index.

3.6. Correlation between Soil Microorganisms and Environmental Factors

The redundancy analysis (RDA) showed (Figure 7) that soil microorganisms are not separated obviously between planting patterns, but they are separated obviously between growth stages. Soil temperature was negatively correlated with microorganisms at the stem elongation stage, and positively correlated with microorganisms at the seedling, flowering, podding and maturation stages. Soil moisture was negatively correlated with microorganisms at the seedling and maturation stages, and it was positively correlated with microorganisms at the stem elongation, flowering and podding stages. Moreover, soil temperature was negatively correlated with soil moisture, pH value, available potassium, available phosphorus, total potassium, alkali-hydrolyzable nitrogen and total nitrogen, and positively correlated with total carbon and total phosphorus (Figure 7).
The correlation heatmap of soil microorganisms and environmental factors at the phylum level showed that (Figure 8) soil pH, soil temperature, soil moisture, total nitrogen, alkali-hydrolyzable nitrogen and available potassium have significant effects on soil microorganisms. Soil moisture was negatively correlated with Firmicutes, Nitrospirae, Verrucomicrobia, Proteobacteria, Chlamydiae, Actinobacteria, Armimondetes, Plantomycetes and so on. Soil temperature was positively correlated with Deinococcus and Chlamydiae, and negatively correlated with Acidobacteria and Chloroflexi. Soil pH was positively correlated with Bacteroides, Gemmatimonadetes and Latescibacteria. Total nitrogen was positively correlated with Firmicutes, Chlamydiae, Actinobacteria, Armimondetes and Plantomycetes. Alkali-hydrolyzable nitrogen was positively correlated with Firmicutes and Acidobacteria. Available potassium was positively correlated with Acidobacteria, Gemmatimonadetes and Nitrospirae.

4. Discussion

The soil moisture content was decreased due to the competition in legume-cereal intercropping [47]. In addition, intercropping is beneficial for increasing the photosynthetic source (leaf area index and leaf area duration) and promoting the movement of photosynthetic compounds from vegetative organs to grain, thereby enhancing water use efficiency (WUE) by increasing yield [48]. However, if intercropping with cover crop, there was a double cover on the soil due to the complementary niche of the crops, reducing soil moisture evaporation, and increasing soil water content [49,50,51]. Intercropping with milk vetch affected soil temperature and moisture at different growth stages (Figure 1 and Figure 2). The soil moisture content in intercropping was lower than that in monoculture in the early stages (seedling and stem elongating stages), which was mainly because the water absorption capacity of the two crops in the intercropping system was stronger than that in the monocropping system. However, compared with monoculture, the soil moisture content increased and the temperature decreased in intercropping at the middle and late stages (flowering and podding stages). Previous studies had shown that intercropping can enhance the soil moisture-holding capacity and reduce the soil temperature in a high temperature period [49,52]. There was also a double cover on the soil due to the complementary niche of the crops in this intercropping system [50], reducing soil moisture evaporation [38]. Soil temperature was negatively correlated with soil moisture (Figure 7), so it decreased with the increase in soil moisture content. Therefore, milk vetch–rapeseed intercropping improves soil moisture content mainly through niche-complementary advantages, but this improvement is only significant at the rapid growth stage of rapeseed. Based on these results, the advantage of intercropping between milk vetch and rapeseed may only exist during the reproductive period of crop growth.
Intercropping with legumes will increase biological nitrogen fixation, and the competitive advantage of cereals will further promote the nitrogen fixation of legumes [22,33,53,54,55]. This study found that intercropping increased the soil nitrogen content (soil total nitrogen and alkali-hydrolyzable nitrogen) (Figure 3). First, the interspecific competition promotes nitrogen fixation and nitrogen transfer [53,54]. Root competition in intercropping reduced crop absorption of soil and fertilizer nitrogen [52] and increased biological nitrogen fixation [54], by improving the nodulation of legumes. Moreover, the intercropping system also increased the nitrogen source and utilization efficiency of non-legume plants [53,54] through nitrogen fixation and nitrogen transfer [22,53]. Therefore, the strong competitiveness of rapeseed [56] promoted the biological nitrogen fixation of milk vetch [57], providing nitrogen fertilizer for crops, which reduced the crop absorption and utilization of soil nitrogen. Second, rhizobium nodulation and nitrogen fixation were driven by the root exudates of the intercrop. Legume root exudates (such as flavonoids) can stimulate the expression of nodulation genes in rhizobium bacteria [58,59], thus promoting biological nitrogen fixation. Therefore, rapeseed intercropping with milk vetch may promote biological nitrogen fixation may through change the root exudates characteristics [58]. In brief, nitrogen fixation and nitrogen transfer are co-driven by interspecific competition and root root-exudate characteristics in rapeseed–milk vetch intercropping, thereby increasing the soil nitrogen content.
Normally, the dominant microorganisms in the same type of soil in the same area are mostly identical [60,61]. That is why, in our study, the dominant phyla were Chloroflex, Proteobacteria, Actinobacteria, Acidobacteria, Firmicutes, Gemmatimonates and Bacteroidetes, in both intercropping and monoculture (Figure 4). Intercropping will have a certain impact on the soil environment due to differences in crop coverage [50], residues [62] and root exudates [63]; these factors change the characteristics of the microorganisms [64], but this change is limited, and generally only leads to significant changes in some extremely sensitive microbial communities [65,66]. In addition, general studies have shown that intercropping can change the soil microbial community structure and functional activity by changing the input of fresh organic matter [67,68]. At the same time, the competition or complementation of intercropping on resources has a greater impact on the soil abiotic environment [29,69], so it becomes another important factor affecting soil microorganisms. In our study, the correlation analysis showed that environmental factors (such as soil temperature, moisture, total nitrogen and alkali-hydrolyzable nitrogen) affected microorganisms (Figure 7). Soil moisture had a negative effect on microorganisms (Chloroflex, Firmicutes, Nitrospirae, Verrucomicrobia, Proteobacteria, Chlamydiae, Actinobacteria, Armimondetes, Plantomycetes, etc.). Total nitrogen and alkali-hydrolyzable nitrogen mainly positively affected microorganisms (Firmicutes, Chloroflex, etc.) (Figure 8). The soil moisture content in intercropping was 6.7% and 7% higher than that in monoculture milk vetch and rapeseed, respectively, at the flowering stage (Figure 2). The microbial diversity in intercropping was higher than that in monoculture (Figure 6). It means that there was a strong interaction between the soil environment and soil microorganisms [13]. Previous studies had shown that soil moisture not only directly controls microbial activities, but also influences the substrates and energy substances available to soil microorganisms for respiration by controlling the availability and mobility of soluble organic matter [7,10]. The availability of N to plants is generally limited, resulting in strong competition between microorganisms and plants in terrestrial ecosystems [70]. Intercropping with milk vetch improved the soil moisture-holding capacity at the flowering stage, promoted crop absorption of nitrogen and was conducive to crop growth [31], and thus inhibited microorganisms, such as Chloroflexi, Acidobacteria, Firmicutes, by strengthening plant competition. These results imply that soil microorganisms were mainly affected by soil moisture and nitrogen in milk vetch and rapeseed intercropping, and they also verify our hypotheses.

5. Conclusions

In this study, the water use efficiency of milk vetch was higher than that of rapeseed at the stem elongating stage. Intercropping with milk vetch increased the contents of soil total nitrogen and alkali-hydrolyzable nitrogen, improved the soil microbial Shannon index, and decreased the soil microbial Simpson index. Moreover, the results imply that soil microorganisms were mainly affected by soil moisture and nitrogen in milk vetch–rapeseed intercropping. This partly makes up for the lack of research on the interaction between the soil environment and microorganisms during intercropping. However, in addition to soil temperature, moisture, and nutrients, plant metabolite changes in intercropping also regulate microbial activities. Further research is needed to reveal the effect mechanism of metabolites on microorganisms in intercropping. In addition, when planting rapeseed in the future, we could consider the application of intercropping with milk vetch, which contributes to regulating the soil nitrogen pool and improving microbial diversity.

Author Contributions

Z.L., S.L., N.L. and Q.Z. conducted the experiment and collected field data; Q.Z. and Z.L. performed the statistical analysis; Z.L. wrote the paper; G.H. and Q.Z. reviewed, edited, and finalized the paper. All authors have read and agreed to the published version of the manuscript.

Funding

This research was funded by National Natural Science Foundation of China, grant number 31901476, and Jiangxi Provincial Natural Science Foundation, grant number 20202ACBL215002.

Institutional Review Board Statement

Not applicable.

Informed Consent Statement

Informed consent was obtained from all subjects involved in the study.

Acknowledgments

The authors thank Yajun Wang, Qiliang Hu, Xiaofeng Chen, and Huiyu Huang for help during experimental and laboratory work.

Conflicts of Interest

The authors declare no conflict of interest.

References

  1. Pablo, G.P.; Vandegehuchte, M.L.; Shaw, E.A.; Marie, D. Are there links between responses of soil microbes and ecosystem functioning to elevated CO2, N deposition and warming? A global perspective. Glob. Chang. Biol. 2020, 21, 1590–6000. [Google Scholar] [CrossRef]
  2. Kumar, A.; Padhy, S.R.J.; Das, R.R. Elucidating relationship between nitrous oxide emission and functional soil microbes from tropical lowland rice soil exposed to elevated CO2: A path modelling approach. Agric. Ecosyst. Environ. 2021, 308, 107268. [Google Scholar] [CrossRef]
  3. Li, C.P.; Shi, W.C.; Wu, D. Biocontrol of potato common scab by Brevibacillus laterosporus BL12 is related to the reduction of pathogen and changes in soil bacterial community. Biol. Control 2021, 153, 104496. [Google Scholar] [CrossRef]
  4. A’Bear, A.D.; Jones, T.H.; Kandeler, E.; Boddy, L. Interactive effffects of temperature and soil moisture on fungal-mediated wood decomposition and extracellular enzyme activity. Soil Biol. Biochem. 2014, 70, 151–158. [Google Scholar] [CrossRef]
  5. Wang, D.M.; Marschner, P.; Solaiman, Z.; Rengel, Z. Growth, P uptake and rhizosphere properties of intercropped wheat and chickpea in soil amended with iron phosphate or phytate. Soil Biol. Biochem. 2006, 39, 249–256. [Google Scholar] [CrossRef]
  6. Ricardo, S.S.; Luis, A.P.L.N.; Jadson, E.L.A.; Ademir, S.F.A. Maize rhizosphere soil stimulates greater soil microbial biomass and enzyme activity leading to subsequent enhancement of cowpea growth. Environ. Sustain. 2019, 2, 89–94. [Google Scholar] [CrossRef]
  7. Bao, X.; Zhu, X.; Chang, X.; Wang, S.; Xu, B.; Luo, C. Effects of Soil Temperature and Moisture on Soil Respiration on the Tibetan Plateau. PLoS ONE 2016, 11, e0165212. [Google Scholar] [CrossRef]
  8. Luo, C.Y.; Xu, G.P.; Wang, Y.F.; Wang, S.P.; Lin, X.W.; Hu, Y.G. Effects of grazing and experimental warming on DOC concentrations in the soil solution on the Qinghai-Tibet plateau. Soil Biol. Biochem. 2009, 41, 2493–2500. [Google Scholar] [CrossRef]
  9. Luo, C.Y.; Xu, G.P.; Chao, Z.G.; Wang, S.P.; Lin, X.W.; Hu, Y.G. Effect of warming and grazing on litter mass loss and temperature sensitivity of litter and dung mass loss on the Tibetan plateau. Glob. Chang. Biol. 2010, 16, 1606–1617. [Google Scholar] [CrossRef]
  10. Curtin, D.; Beare, M.H.; Hernandez-Ramirez, G. Temperature and moisture effects on microbial biomass and soil organic matter mineralization. Soil Sci. Soc. Am. J. 2012, 76, 2055–2067. [Google Scholar] [CrossRef]
  11. Rivest, D.; Cogliastro, A.; Bradley, R.L.; Olivier, A. Intercropping hybrid poplar with soybean increases soil microbial biomass, mineral N supply and tree growth. Agrofor. Syst. 2010, 80, 33–40. [Google Scholar] [CrossRef]
  12. Li, X.P.; Mu, Y.H.; Cheng, Y.B.; Liu, X.G.; Nian, H. Effects of intercropping sugarcane and soybean on growth, rhizosphere soil microbes, nitrogen and phosphorus availability. Acta Physiol. Plant 2013, 35, 1113–1119. [Google Scholar] [CrossRef]
  13. Garbeva, P.; Van, V.J.; Van, E.J. Microbial diversity in soil: Selection of microbial populations by plant and soil type and implications for disease suppressiveness. Annu. Rev. Phytopathol. 2004, 42, 243–270. [Google Scholar] [CrossRef]
  14. Song, Y.N.; Zhang, F.S.; Marschner, P. Effect of intercropping on crop yield and chemical and microbiological properties in rhizosphere of wheat (Triticum aestivum L.), maize (Zea mays L.), and faba bean (Vicia faba L.). Biol. Fertil. Soils 2007, 43, 565–574. [Google Scholar] [CrossRef]
  15. Salles, J.F.; Van Veen, J.A.; van Elsas, J.D. Multivariate analyses of Burkholderia species in soil: Effect of crop and land use history. Appl. Environ. Microb. 2004, 70, 4012–4020. [Google Scholar] [CrossRef] [PubMed]
  16. Zhang, X.C.; Wang, H.L.; Yu, X.F.; Hou, H.Z.; Fang, Y.J.; Ma, Y.F. The Study on the Effect of Potato and Beans Intercropping with Whole Field Plastics Mulching and Ridge-Furrow Planting on Soil Thermal-Moisture Status and Crop Yield on Semi-Arid Area. Sci. Agric. Sin. 2016, 49, 468–481. [Google Scholar]
  17. Xu, S.; Liu, X.W.; Cui, D.J.; Du, H.Y.; Zhao, Y.H. Effect of different fertilization treatments on cotton growth, soil microbes and enzyme activity in Saline field. J. Soil Water Conserv. 2015, 29, 316–332. [Google Scholar]
  18. Gong, X.W.; Liu, C.J.; Li, J.; Luo, Y.; Yang, Q.H.; Zhang, W.L.; Yang, P.; Feng, B.L. Responses of rhizosphere soil properties, enzyme activities and microbial diversity to intercropping patterns on the Loess Plateau of China. Soil Tillage Res. 2019, 195, 104355. [Google Scholar] [CrossRef]
  19. Veen, J.A.V.; Kuikman, P.J. Soil structural aspects of decomposition of organic matter by micro-organisms. Biogeochemistry 1990, 11, 213–233. [Google Scholar] [CrossRef]
  20. Blagodatskaya, E.; Kuzyakov, Y. Mechanisms of real and apparent priming effects and their dependence on soil microbial biomass and community structure: Critical review. Biol. Fertil. Soils 2008, 45, 115–131. [Google Scholar] [CrossRef]
  21. Xue, Y.; Xia, H.; Christie, P.; Zhang, Z.; Li, L.; Tang, C.X. Crop acquisition of phosphorus, iron and zinc from soil in cereal/legume intercropping systems: A critical review. Ann. Bot. 2016, 117, 363–377. [Google Scholar] [CrossRef]
  22. Jensen, E.S. Grain yield, symbiotic N2 fixation and interspecifific competition for inorganic N in pea-barley intercrops. Plant Soil 1996, 182, 25–38. [Google Scholar] [CrossRef]
  23. Bais, H.P.; Weir, T.L.; Perry, L.G.; Gilroy, S.; Vivanco, J.M. The role of root exudates in rhizosphere interactions with plants and other organisms. Annu. Rev. Plant Biol. 2006, 57, 233–266. [Google Scholar] [CrossRef] [PubMed]
  24. Mulder, L.; Hogg, B.; Bersoult, A.; Cullimore, J.V. Integration of signalling pathways in the establishment of the legume-rhizobia symbiosis. Physiol. Plant 2005, 123, 207–218. [Google Scholar] [CrossRef]
  25. Guo, F.; Wang, M.; Si, T.; Wang, Y.F.; Zhao, H.J.; Zhang, X.J.; Yu, X.N. Maize-peanut intercropping led to an optimization of soil from the perspective of soil microorganism. Arch. Agron. Soil Sci. 2021, 67, 1986–1999. [Google Scholar] [CrossRef]
  26. Chen, J.; Arafat, Y.; Wu, L.K.; Xiao, Z.G.; Li, Q.S. Shifts in soil microbial community, soil enzymes and crop yield under peanut/maize intercropping with reduced nitrogen levels. Appl. Soil Ecol. 2018, 124, 327–334. [Google Scholar] [CrossRef]
  27. Dube, E.D.N.; Madanzi, T.; Kapenzi, A.; Masvaya, E. Root length density in maize/cowpea intercropping under a basin tillage system in a semi-arid area of Zimbabwe. Am. J. Plant Sci. 2014, 5, 1499–1507. [Google Scholar] [CrossRef]
  28. Pelzer, E.; Hombert, N.; Jeuffroy, M.H.; Makowski, D. Meta-analysis of the effect of nitrogen fertilization on annual cereal–legume intercrop production. Agron. J. 2014, 106, 1775–1786. [Google Scholar] [CrossRef]
  29. Trail, P.; Abaye, O.; Thomason, W.E.; Thompson, T.L.; Gueye, F.; Diedhiou, I.; Diatta, M.B.; Faye, A. Evaluating intercropping (living cover) and mulching (desiccated cover) practices for increasing millet yields in Senegal. Agron. J. 2016, 108, 1742–1752. [Google Scholar] [CrossRef]
  30. Xiang, Y.C.; Guan, C.Y.; Huang, H. Effects of Intercropping on Accumulation of Cd and Pb in Oilseed Rapeseed. J. Soil Water Conserv. 2010, 24, 50–55. [Google Scholar]
  31. Zhou, Q.; Wang, L.C.; Ma, S.M. Influences of rapeseed intercropping with Chinese milk vetch and straw mulching on productive benefits in dryland of Southwest China. Acta Agron. Sin. 2018, 44, 431–441. [Google Scholar] [CrossRef]
  32. Dubach, M.; Russelle, M.P. Forage legume roots and nodules and their role in nitrogen transfer. Agron. J. 1994, 86, 259–266. [Google Scholar] [CrossRef]
  33. Temperton, V.M.; Mwangi, P.N.; Scherer-Lorenzen, M.; Schmid, B.; Buchmann , N. Positive interactions between nitrogen-fixing legumes and four different neighbouring species in a biodiversity experiment. Oecologia 2007, 151, 190–205. [Google Scholar] [CrossRef]
  34. Guo, Z.Y.; Kong, C.H.; Wang, J.G.; Wang, Y.F. Rhizosphere isoflavones (daidzein and genistein) levels and their relation to the microbial community structure of mono-cropped soybean soil in field and controlled conditions. Soil Biol. Biochem. 2011, 43, 2257–2264. [Google Scholar] [CrossRef]
  35. Li, B.; Li, Y.Y.; Wu, H.M.; Zhang, F.F.; Li, C.J.; Li, X.X.; Lambers, H.; Li, L. Root exudates drive interspecific facilitation by enhancing nodulation and N2 fixation. Proc. Natl. Acad. Sci. USA 2016, 113, 6496–6501. [Google Scholar] [CrossRef] [PubMed]
  36. Moreau, D.; Bardgett, R.D.; Finlay, R.D.; Jones, D.L.; Philippot, L. A plant perspective on nitrogen cycling in the rhizosphere. Funct. Ecol. 2019, 33, 540–552. [Google Scholar] [CrossRef]
  37. Maj, D.; Wielbo, J.; Marek-Kozaczuk, M.; Skorupska, A. Response to flavonoids as a factor influencing competitiveness and symbiotic activity of Rhizobium leguminosarum. Microbiol. Res. 2010, 165, 50–60. [Google Scholar] [CrossRef] [PubMed]
  38. Zhou, Q.; Chen, J.; Xing, Y.; Wang, L.C. Influence of intercropping Chinese milk vetch on the soil microbial community in rhizosphere of rapeseed. Plant Soil 2019, 440, 85–96. [Google Scholar] [CrossRef]
  39. Bi, X.; Ren, L.; Gong, M.; He, Y.S.; Wang, L.; Ma, Z.D. Transfer of cadmium and lead from soil to mangoes in an uncontaminated area, Hainan Island, China. Geoderma 2010, 155, 115–120. [Google Scholar] [CrossRef]
  40. Fei, K.; Deng, L.Z.; Zhang, L.P.; Sun, T.Y.; Wu, Y.H. Lateral transport of soil total carbon with slope runoff and interflow: Effects of rainstorm characteristics under simulated rainfall. Catena 2019, 179, 39–48. [Google Scholar] [CrossRef]
  41. Wang, X.; Xiang, Z.; Li, C.; Zhu, J.; Wu, J.; Zhang, M.J. Optimization of the Method for Determination of Total Nitrogen in Soil by Automatic Kjeldahl Apparatus. J. Shandong Agric. Univ. (Nat. Sci. Ed.) 2020, 51, 438–440. [Google Scholar]
  42. Zheng, Y.K.; Fu, W.D.; Zhu, R.C.; Hu, Z.B.; Chen, G. Determination of total phosphorus in soil and sludge by an effective headspace gas chromatographic method. RSC Adv. 2019, 9, 40961–40965. [Google Scholar] [CrossRef] [PubMed]
  43. Chen, B.L.; Yang, H.K.; Song, W.C.; Liu, C.Y.; Xu, J. Effect of N fertilization rate on soil alkali-hydrolyzable N, subtending leaf N concentration, fiber yield, and quality of cotton. Crop J. 2016, 4, 323–330. [Google Scholar] [CrossRef]
  44. Fu, M.M.; Huang, B.; Jia, M.M.; Hu, W.Y.; Sun, W.X. Effect of intensive greenhouse vegetable cultivation on selenium availability in soil. Pedosphere 2015, 25, 343–350. [Google Scholar] [CrossRef]
  45. Kwon, H.Y.; Hudson, R.; Mulvaney, R. Characterization of the organic nitrogen fraction determined by the Illinois soil nitrogen test. Soil Sci. Soc. Am. J. 2009, 73, 1033–1043. [Google Scholar] [CrossRef]
  46. Xu, N.; Tan, G.; Wang, H.; Gai, X.P. Effect of biochar additions to soil on nitrogen leaching, microbial biomass and bacterial community structure. Eur. J. Soil Biol. 2016, 74, 1–8. [Google Scholar] [CrossRef]
  47. Nassab, A.D.; Amon, T.; Kaul, H.P. Competition and yield in intercrops of maize and sunflower for biogas. Ind. Crops Prod. 2011, 34, 1203–1211. [Google Scholar] [CrossRef]
  48. Yin, W.; Chen, G.P.; Feng, F.X.; Guo, Y.; Hu, F.L. Straw retention combined with plastic mulching improves compensation of intercropped maize in arid environment. Field Crops Res. 2017, 204, 42–51. [Google Scholar] [CrossRef]
  49. Tang, W.G.; Xiao, X.P.; Tang, H.M.; Yang, G.L. Effects of Different Planting Patterns on Water Use of Soil and Crops Annual Productivity in Southern Hilly Dryland. Sci. Agric. Sin. 2014, 47, 3606–3617. [Google Scholar]
  50. Zhao, B.Q.; Zhang, F.S.; Li, Z.J. Vertical distribution and its change of root quantity & activity of crops in the “winter wheat early spring maize/summer maize” cropping system: II. The vertical distribution and its changes of root quantity & activity of the early spring inter-plant. Acta Agron. Sin. 2001, 27, 974–980. [Google Scholar]
  51. Shili-Touzi, I.; Tourdonnet, S.D.; Launay, M.; Dore, T. Does intercropping winter wheat (Triticum aestivum) with red fescue (Festuca rubra) as a cover crop improve agronomic and environmental performance? A modeling approach. Field Crops Res. 2010, 116, 218–229. [Google Scholar] [CrossRef]
  52. Ouyang, Y.; Reeve, J.R.; Norton, J.M. Soil enzyme activities and abundance of microbial functional genes involved in nitrogen transformations in an organic farming system. Biol. Fertil. Soils 2018, 54, 437–450. [Google Scholar] [CrossRef]
  53. Giller, K.E.; Ormesher, J.; Awah, F.M. Nitrogen transfer from phaseolus bean to intercropped maize measured using 15N-enrichment and 15N-isotope dilution methods. Soil Biol. Biochem. 1991, 23, 339–346. [Google Scholar] [CrossRef]
  54. Xiao, Y.; Li, L.; Zhang, F.S. Effect of root contact on interspecifific competition and N transfer between wheat and fababean using direct and indirect 15N techniques. Plant Soil 2004, 262, 45–54. [Google Scholar] [CrossRef]
  55. Hauggaard-Nielsen, H.; Ambus, P.; Jensen, E.S. The comparison of nitrogen use and leaching in sole cropped versus intercropped pea and barley. Nutr. Cycl. Agroecosyst. 2003, 65, 289–300. [Google Scholar] [CrossRef]
  56. Wang, Y.J.; Wang, T.Q.; Hou, Z.J.; Wang, T.Q.; Zhou, Q. Responses of root exudates to intercropping of Chinese milk vetch with rapeeed. Chin. J. Appl. Ecol. 2021, 32, 1783–1790. [Google Scholar] [CrossRef]
  57. Chen, C.P.; Cheng, C.H.; Huang, Y.H.; Chen, C.T.; Lai, C.M. Converting leguminous green manure into biochar: Changes in chemical composition and C and N mineralization. Geoderma 2014, 232, 581–588. [Google Scholar] [CrossRef]
  58. Hassan, S.; Mathesius, U. The role of flavonoids in root-rhizosphere signalling: Opportunities and challenges for improving plant–microbe interactions. J. Exp. Bot. 2012, 63, 3429–3444. [Google Scholar] [CrossRef]
  59. Begum, A.A.; Leibovitch, S.; Migner, P.; Zhang, F. Specific flavonoids induced nod gene expression and pre-activated nod genes of Rhizobium leguminosarum increased pea (Pisum sativum L.) and lentil (Lens culinaris L.) nodulation in controlled growth chamber environments. J. Exp. Bot. 2001, 52, 1537–1543. [Google Scholar] [CrossRef]
  60. Shu, X.Y.; He, J.; Zhou, Z.H. Organic amendments enhance soil microbial diversity, microbial functionality and crop yields: A meta-analysis. Sci. Total Environ. 2022, 829, 154627. [Google Scholar] [CrossRef]
  61. Bargaza, A.; Noyceb, G.L.; Fulthorpe, R.; Carlssona, G.; Furze, J.R. Species interactions enhance root allocation, microbial diversity and P acquisition in intercropped wheat and soybean under P deficiency. Appl. Soil Ecol. 2017, 120, 179–188. [Google Scholar] [CrossRef]
  62. Morshedi, A.; Akbari, F.; Dahmardeh, M.; Ghanbari, A.; Khoramdel, S. The Influences of Tillage System and Plant Residue on Nitrogen Uptake and Use Efficiency in Corn and Bean Intercropping Systems. J. Crops Improv. 2018, 20, 785–799. (In Persian) [Google Scholar] [CrossRef]
  63. Hua, C.P.; Wang, Y.J.; Xie, Z.K.; Guo, Z.H.; Zhang, Y.B.; Qiu, Y.; Wang, L. Effects of intercropping on rhizosphere soil microorganisms and root exudates of Lanzhou lily (Lilium davidii var. unicolor). Sci. Cold Arid. Reg. 2018, 10, 0159–0168. [Google Scholar] [CrossRef]
  64. Corey, D.; Broeckling, A.; Broz, M.K.; Manter, D.K.; Vivanco, J.M. Root Exudates Regulate Soil Fungal Community Composition and Diversity. Appl. Environ. Microb. 2008, 74, 738–744. [Google Scholar]
  65. Neal, A.L.; Ahmad, S.; Gordon-Weeks, R.; Ton, J. Benzoxazinoids in root exudates of maize attract Pseudomonas putida to the rhizosphere. PLoS ONE 2012, 7, e35498. [Google Scholar] [CrossRef]
  66. Abdel-Lateif, K.; Bogusz, D.; Hocher, V. The role of flavonoids in the establishment of plant roots endosymbioses with arbuscular mycorrhiza fungi, Rhizobia, and Frankia bacteria. Plant Signal. Behav. 2012, 7, 636–641. [Google Scholar] [CrossRef]
  67. Fontainea, S.; Mariottib, A.; Abbadie, L. The priming effect of organic matter: A question of microbial competition? Soil Biol. Biochem. 2003, 35, 837–843. [Google Scholar] [CrossRef]
  68. Cong, W.F.; Hoffland, E.; Li, L.; Janssen, B.H.; Werf, W. Intercropping affects the rate of decomposition of soil organic matter and root litter. Plant Soil 2015, 391, 399–411. [Google Scholar] [CrossRef]
  69. Duchene, O.; Vian, J.F.; Celette, F. Intercropping with legume for agroecological cropping systems: Complementarity and facilitation processes and the importance of soil microorganisms. A review. Agric. Ecosyst. Environ. 2017, 240, 148–161. [Google Scholar] [CrossRef]
  70. Vitousek, P.M.; Howarth, R.W. Nitrogen limitation on land and in the sea: How can it occur? Biogeochemistry 1991, 13, 87–115. [Google Scholar] [CrossRef]
Figure 1. Changes in soil temperature during rapeseed growth stages. Crop represents crop planting patterns (Milk vetch, Rapeseed, Intercropping), Growth stage represents crop growth stages (seeding, stem elongating, flowering, podding, maturation), and Crop*Growth stage represents the interaction between planting pattern and growth stage. Milk vetch represents monoculture milk vetch; Rapeseed represents monoculture rapeseed; Intercropping represents milk vetch intercropping with rapeseed (the same below). Letters represent the significant differences (p < 0.05) between crops at each growth stage.
Agriculture 12 01538 g001
Figure 2. Changes in soil moisture during rapeseed growth stages. Crop represents crop planting patterns (Milk vetch, Rapeseed, Intercropping), Growth stage represents crop growth stages (seeding, stem elongating, flowering, podding, maturation), and Crop*Growth stage represents the interaction between planting pattern and growth stage. Letters represent the significant differences (p < 0.05) between crops at each growth stage.
Agriculture 12 01538 g002
Figure 3. Content difference in soil nutrients between maturation and seedling stage. The difference in soil nutrients between maturation and seedling stage was used to represent the changes in soil nutrients with crop growth, which were analyzed by one-way ANOVA with the crops (levels: rapeseed, milk vetch, and intercropping). The visual results are displayed by box plot. The top and bottom horizontal lines of the box in the figure are the maximum and minimum values of the sample data, respectively; the upper and lower limits of the box are the upper and lower quartiles of the data, respectively; the horizontal line in the box is the median; and the small box is the mean value. Letters represent the significant differences (p < 0.05) of soil nutrients changes between different planting patterns.
Agriculture 12 01538 g003
Figure 4. Percentage of soil microbial community abundance at phylum level.
Agriculture 12 01538 g004
Figure 5. The differences between groups of microbial community abundance. S, E, F, P and M represent seedling, stem elongation, flowering, podding and maturation stages, respectively; A, R and AR represent monoculture milk vetch, monoculture rapeseed, and milk vetch intercropping with rapeseed, respectively. * indicates p < 0.05, ** indicates p < 0.01, *** indicates p < 0.001.
Agriculture 12 01538 g005
Figure 6. Shannon index and Simpson index of soil microorganisms. The top and bottom horizontal lines of the box in the figure are the maximum and minimum values of the sample data, respectively; the upper and lower limits of the box are the upper and lower quartiles of the data, respectively; the horizontal line in the box is the median. Letters represent the significant differences (p < 0.05, p < 0.01) of Shannon and Simpson index between crop growth stages.
Agriculture 12 01538 g006
Figure 7. Redundancy analysis (RDA) of soil microorganisms and environmental factors. Points with different colors or shapes in the figure represent different sample groups. The red arrow represents the environmental factor, and the length of the arrows represent the influence degree (Interpretation amount) of the environmental factor on microorganisms; The angle between the arrows represents positive and negative correlations (acute angle: positive correlation; obtuse angle: negative correlation; right angle: no correlation). SM represents soil moisture; ST represents soil temperature; pH represents soil pH value; TP represents total phosphorus; TN represents total nitrogen; TC represents total carbon; AN represents alkali-hydrolyzed nitrogen; TK represents total potassium; AP represents available phosphorus; AK represents available potassium.
Agriculture 12 01538 g007
Figure 8. Heatmap of correlation between soil microorganisms and environmental factors at phylum level. Different colors in the figure represent different correlations between environmental factors and microorganisms; red represents positive correlation, blue represents negative correlation. * represents p < 0.05, ** represents p < 0.01, *** represents p < 0.001. SM represents soil moisture; ST represents soil temperature; pH represents soil pH value; TP represents total phosphorus; TN represents total nitrogen; TC represents total carbon; AN represents alkali-hydrolyzed nitrogen; TK represents total potassium; AP represents available phosphorus; AK represents available potassium.
Agriculture 12 01538 g008
Publisher’s Note: MDPI stays neutral with regard to jurisdictional claims in published maps and institutional affiliations.

