Article

The Influence of Residue Mixing on the Decomposition of Pepper Root Residues

1
Key Laboratory of Biology and Genetic Improvement of Horticultural Crops (Northeast Region), Ministry of Agriculture and Rural Affairs, Northeast Agricultural University, Harbin 150030, China
2
Department of Horticulture, Northeast Agricultural University, Harbin 150030, China
*
Author to whom correspondence should be addressed.
Agriculture 2022, 12(1), 84; https://doi.org/10.3390/agriculture12010084
Submission received: 15 November 2021 / Revised: 16 December 2021 / Accepted: 4 January 2022 / Published: 10 January 2022

Abstract

:
(1) Background: Residue degradation plays a very important role in terrestrial ecosystems and residue mixing is the main factor affecting the degradation rates. However, in the agricultural systems, the effect of residue mixing on the degradation of pepper residues and the microbial community in pepper root residues is not clear. (2) Methods: In this study, we added different residues into soil by using double-layered nylon litterbags in culture bottles. The treatments including pepper root (P: Capsicum annuum L.), soybean [S: Glycine max (L.) Merr.] and maize (M: Zea mays L.) residue, as well as mixtures of soybean + pepper (SP), maize + pepper (MP), maize + soybean + pepper (MSP) mixtures. Litterbags were harvested after 7, 14, 28, and 56 days, respectively. Mass loss and nitrogen and phosphorus contents in pepper residue were quantified and bacterial and fungal community levels in pepper residues were analyzed using quantitative PCR and high throughput amplicon sequencing; (3) Results: The study showed that the mass loss and fungal community abundance of pepper root residue in mixtures were higher than P, except day 7. The phosphorus contents in MSP-P and MP-P were significantly lower than that for P at day 28 and day 56. Illumina MiSeq sequencing showed that the presence of maize residue significantly altered the microbial community composition of pepper root pepper. Day 56. (4) Conclusions: Our results suggest that residue mixing changed the microbial community abundance in pepper residue and promoted the degradation of pepper residues compared to pepper residue decomposition alone, especially for mixtures with soybean.

1. Introduction

Pepper (Capsicum annuum L.) is one of the main crops facilities vegetables, which occupies the largest annual stable planting area (>21,000 km2) in China [1]. In agriculture, negative plant-soil feedback caused by consecutive planting of a single crop or its related species in the same field, results in reduced crop yield and quality, which is known as “soil sickness” [2]. With the development of the commercial production of pepper, the soil sickness of pepper is becoming more and more common, which can seriously restrict pepper yields. The long-term existence of crop residues as secreted toxins that inhibit crop growth, a phenomenon known as autotoxicity, is one of the main causes of soil sickness [3]. Therefore, accelerating the degradation of crop residues is helpful in alleviating the continuous cropping obstacles and maintaining the sustainable development of agriculture. The plant residues were added to continuous cropping soil can improve soil microbial environment and promote plant growth by changing the diversity and composition of underground plant residues and the interactions between plant residues [4]. For example, litter decomposition replenishes pools of essential mineral nutrients, especially nitrogen and phosphorus, for net primary production [5]. It has also been shown in numerous studies that soil respiration is stronger with the addition of residue and weaker with the removal of residue [6,7], while total nitrogen and the C:N ratio also increased with increased litter inputs [7]. Studies have shown that residues from crops such as mungbean, wheat, corn, and straw can maintain the soil quality and fertility as organic amendments [8], and mixing poplar leaf litter with soybean and maize residues promoted decomposition nitrogen release [4].
Residue degradation is the key to the nutrient cycling and energy flow in the whole ecosystem, while the degradation rate can regulate atmospheric carbon emission, soil organic matter composition and nutrient availability [9]. However, residue from individual plant species usually decompose in the presence of other species. When different litter species degrade together, the decomposition rate is usually not equal to the arithmetic mean values calculated from the average of their component species decomposing alone (i.e., the expected value is different from the observed value) [10]. On the one hand, nutrient leaching and microbial nutrient transfer play important roles in stimulating the decomposition of low-quality litter species; if the decomposition rate of the mixture is faster than expected, this is regarded as a synergistic mixing effect [11]; On the other hand, if the decomposition rate of the mixture is slower than expected, resulting in an antagonistic effect, these phenomena are collectively regarded as having a non-additive effect [11].
Residue quality is one of the factors affecting the degradation rate. Low-quality residues with high C:N ratios, and high structural (e.g., lignin and cellulose) and recalcitrant compounds (e.g., tannins and polyphenols) decompose more slowly than high-quality residues [12]. Study have shown that nitrogen and phosphorus has been shown to have influence the decomposition of litter, especially during early stages of decomposition [13]. Mass loss and nitrogen kinetics have been reported in many studies as being related to decomposition, and micro-nutrients may also be important factors controlling the degradation rate, such as magnesium (Mg), calcium (Ca), and sodium (Na) [14]. For example, Silver and Miya has reported that there was strong positive correlation between the decomposition and calcium (Ca) content for many types of root litter [15].
In addition to the influence of residue mixing and quality on residue degradation, microbial decomposers also affect residue degradation [16]. Microorganisms that colonize residue material can largely trigger and mediate the decomposition process [17]. The diversity of the microbial community seriously influences the degradation rate of residues, especially the bacterial community. In the early phases of residue degradation, the bacterial community plays a leading role [18,19]. Orlova reported that at the beginning of decomposition, easily available organic compounds of straw are quickly consumed by copiotrophs, representatives of the Pseudomonas genus [20]. Many studies have demonstrated that fungi are able to secrete enzymes that catalyze the turnover of complex macromolecules such as cellulose, hemi-cellulose and lignin, therefore they are very important in the degradation process [21], such as fungi of the genus Fusarium [22]. With the decrease of labile components in residue and the increase of lignin concentration, the later degradation process of residue is mainly dominated by fungal community [23]. Moreover, time variation is crucial to litter decay because the relative importance of the drivers controlling decomposition may change over time [24].
In the present study, we estimated the effect of residue mixing on mass loss and nitrogen and phosphorus contents in pepper residue under laboratory condition. Microbial community abundance and composition in pepper residue during degradation were analyzed using quantitative PCR and Illumina MiSeq sequencing, respectively. In addition, the effects of residue mixing on the growth of pepper seedlings were observed through greenhouse pots experiment. The purpose of this study was to explore the influence of residue mixing on the decomposition rate of pepper residue in continuous cropping soils. Under given climatic conditions, We hypothesized that residue mixing would improve decomposition rate of pepper residue by altering the microbial community and nitrogen and phosphorus contents.

2. Materials and Methods

2.1. Experiment Site and Collection of Residues

The experimental soil samples were collected from the top soil layer (0–15 cm) of the pepper continuous cropping in the experimental station at Northeast Agricultural University of Harbin, China (45°41′ N, 126°37′ E), with the following values: the soil organic matter, 81.94 g kg−1; soil available phosphorus, 2 mg kg−1; soil ammonium nitrogen, 12.15 mg kg−1; soil nitrate nitrogen, 41.19 mg kg−1; pH (1:5, w/v), 7.43; EC (1:5, w/v), 0.19.
We collected pepper root residue (P: Capsicum annuum L.), soybean residue [S: Glycine max (L.) Merr.] and maize residue (M: Zea mays L.) samples during autumn 2017. All aboveground biomass samples of mature maize and soybean crops were cut into pieces measuring 1~2 cm in length. Fresh roots (≤2 mm diameter) of pepper were washed to remove the soil particles, oven-dried at 80 °C to constant weight, and cut into small pieces (≤1 cm length). Parts of the dry residue samples were ground, and digested with sulfuric acid to measure the nutrient concentrations. Total nitrogen and phosphorous were measured with an interval flow analyzer according to the manufacturer’s instructions (San++, SKALAR, Breda, Netherlands). Calcium (Ca) contents were measured using EDTA titration method [25], while the total phenol contents were measured using 2 mg ground residue samples following the Folin- Ciocalteu method [26]. The initial N, P, Ca, and phenol contents of soybean, maize measured using same methods (Table 1). We randomly collected soil samples from continuous cropping land used to grow pepper, which were sieved to 2 mm, while visible roots residues >2 mm were removed.

2.2. Experimental Design

2.2.1. Incubation Experiment Design

The residues from the three plant types were put into double-layer nylon litterbags (6 × 9 cm) with 250 μm mesh on the outside and 1000 μm mesh on the inside. The 1.5 g residue samples of pepper, maize, and soybean were buried in 150 g of soil using mesh bags in incubation bottles. In addition, a 1.5 g mixed sample of the residue (i.e., 0.5 g pepper + 0.5 g soybean + 0.5 g maize) was added to 150 g of soil using mesh bags. Under dark conditions, soil and residue samples were incubated for 56 days at 25 °C and the humidity was maintained at 60% of the maximum water holding capacity in the field by adding distilled water [27]. We set up the incubation experiment for 6 treatments (P, S, M, SP, MP, MSP), with 8 replicates for each treatment and 4 sampling times, while a total of 192 incubation bottles (6 treatments × 8 replicates × 4 times) were used in this study. Residue litterbags were sampled at 7, 14, 28, and 56 days, respectively. Parts of these sampled residues were used to measure mass loss and the total nitrogen and phosphorus contents, while the other parts were stored at −80 °C for DNA extraction.

2.2.2. Greenhouse Experiment Design

The collected residues of the three species were washed, oven dried at 80 °C to constant weight, grounded and sieved to 2 mm. The pepper residue was mixed with other crop residues (i.e., P, SP, MP, MSP). A 3 g subsample of root material from each treatment was mixed with approximately 300 g soil which was sieved to 2 mm, then visible roots residues d > 2 mm remove in a pot (8 × 8 cm). In addition, 3 g residue mixtures of the species (i.e., 1 g pepper + 1 g soybean + 1 g maize) were added to 300 g of soil. Soil and residue samples were incubated for 15 days at 28 °C, while the soil moisture was maintained at 60% water holding capacity by adding distilled water. After incubation, pepper seedlings were planted in pots and kept in a greenhouse (day and night temperature of 28 and 20 ℃, relative humidity range of 60–80%, 16 h light/8 h dark cycle) [28]. The experiment involved 4 treatments, with 3 replicates for each treatment and 3 pots for each replicate. The pepper seedlings were harvested 45 days after planting and the whole biomass and the lengths of the main roots of pepper seedling were measured.

2.2.3. Litterbags Sampling and Respiration Measurement

At each sampling time, we carefully removed the litterbags from the incubation bottles, removed the soil particles, and washed the residues with distilled water in a sieve with a 0.2 mm mesh to ensure that all residues were retained [29]. Residues after washing were oven-dried at 80 ℃ to a constant weight to determine the mass loss, then grounded and sieved (0.3 mm), after which 0.1 g of the residue was weighed for digestion and then measured in a flow analyzer (San++, SKALAR, Breda, Netherlands) to determine the nitrogen and phosphorous content of pepper root residue. During the decompositionperiod, vials containing 11.25 mL 1.0 M NaOH were placed into the incubation bottles to trap CO2 [30]. The concentration of CO2 was calculated according to the titrated content of hydrochloric acid and the content of NaOH solution reacting with CO2. The CO2 emission levels changed once a day for the first four days, once every 2–3 days for the next ten days, and then once a week thereafter [31]. We performed a measurement every time the liquid changed. Soil CO2 respiration was measured at 2, 4,7, 10, 13, 20, 27, 34, 48, and 55 days of the incubation.

2.2.4. Residues DNA Extraction

Residue DNA was extracted from 0.25 g of residue with the Power Soil DNA Isolation Kit (MO BIO Laboratories, Carlsbad, CA, USA) according to the manufacturer’s instructions [32]. Each composite residue sample was extracted in triplicate, and the extracted DNA solutions were pooled as described previously [33].

2.2.5. Quantitative PCR Analysis

The community abundance of bacteria and fungi in the residue were determined by qPCR. F338/R806 and FITS1/RITS2 primer sets were used to amplify bacteria and fungi, respectively. In the real-time PCR assay, the bacterial reaction system contained 9 μL Real SYBR Mixture (TianGen, Beijing, China), 0.2 μL each of upstream primer and downstream primer, 8.1 μL ddH2O, and 2.5 μL residue DNA. The amplified PCR reaction conditions were as follows: 94 °C for 3 min, 94 °C for 45 s, 67.4 °C for 45 s, 72 °C for 45 s, cycled 32 times. The fungal reaction system was similar to that of bacteria. The reaction conditions were as follows: 94 °C for 5 min, 94 °C for 1 min, 58 °C for 1 min, 72 °C for 1 min, cycled 24 times. The standard curve was constructed with a series of plasmids diluted 10 times. By comparing the threshold of each sample with the standard curve, the community abundance of bacteria and fungi in the residues were calculated.

2.2.6. High-Throughput Amplicon Sequencing

High-throughput sequencing was used to profile the diversity and composition of bacteria and fungi communities in pepper root residue. Primer sets of F338/R806 and F ITS1/RITS2 were used to amplify V3-V4 regions of the bacterial 16S rRNA gene and the ITS1 regions of the fungal rRNA gene, respectively [34]. Both the forward and reverse primers also had a 6-bp barcode unique to each sample, which was used to permit multiplexing of samples [34]. Bacteria were determined by PCR using a TransGen AP221 kit and Trans Start Fastpfu DNA Polymerase. The 20 μL reaction system included the 5 × 4 μL Fast Pfu Buffer, 2 µL (2.5 mmol·L−1) MdNTP, 0.8 μL each of upstream primer and downstream primer, 0.4 µL Fast Pfu Polymerase, and 10 ng template DNA, supplemented with ddH2O to 20 µL. The fungi were determined by PCR using a TransGen AP221 kit and TaKaRa rTaq DNA Polymerase. The 20 μL reaction system included 10 μL 2 × buffer, 2 µL (2.5 mmol·L−1) dNTP, 0.8 μL each of upstream primer and downstream primer each, respectively, 0.2 µL rTaq Polymerase, and 10 ng template DNA, supplemented with ddH2O to 20 µL. The reaction conditions were as follows: 95 °C for 3 min, 95 °C for 30 s, 55 °C for 30 s, 72 °C for 10 min. [35]. The mixture was then paired-end sequenced (2 × 300) on an Illumina Miseq platform at Majorbio Bio-Pharm Technology Co., Ltd., Shanghai, China [35]. Each composite residue sample was independently amplified in triplicate, PCR reactions were pooled and purified, and then the purified amplicons were quantified as described previously [34].
Raw sequence reads were de-multiplexed and quality-filtered using QIIME [36]. Chimaeras were screened and removed using USEARCH with the UCHIME algorithm [37]. Sequences with ≥ 97% similarity were assigned to the same operational taxonomic unit (OTU) using UPARSE with an agglomerative clustering algorithm [37]. The sequence data were deposited in the Sequence Read Archive at NCBI under accession numbers PRJNA688357.

2.2.7. Statistical Analysis

The mass loss (%) of the residue sample was calculated as the difference between the initial weight and the remaining weight at each sampling date. The data were statistically analysed using SPSS and the significance level was p < 0.05. Standard errors of the treatment means were calculated from one-way analysis of variance (ANOVA). Multiple comparisons among means of mass loss and nitrogen and phosphorus content of different treatments were performed using Tukey’s honestly significant difference (HSD) test. The Shannon index of the samples were generated using QIIME [36]. For the analysis of bacterial and fungal community β-diversity, a taxonomy-based Bray-Curtis distance test was used.

3. Results

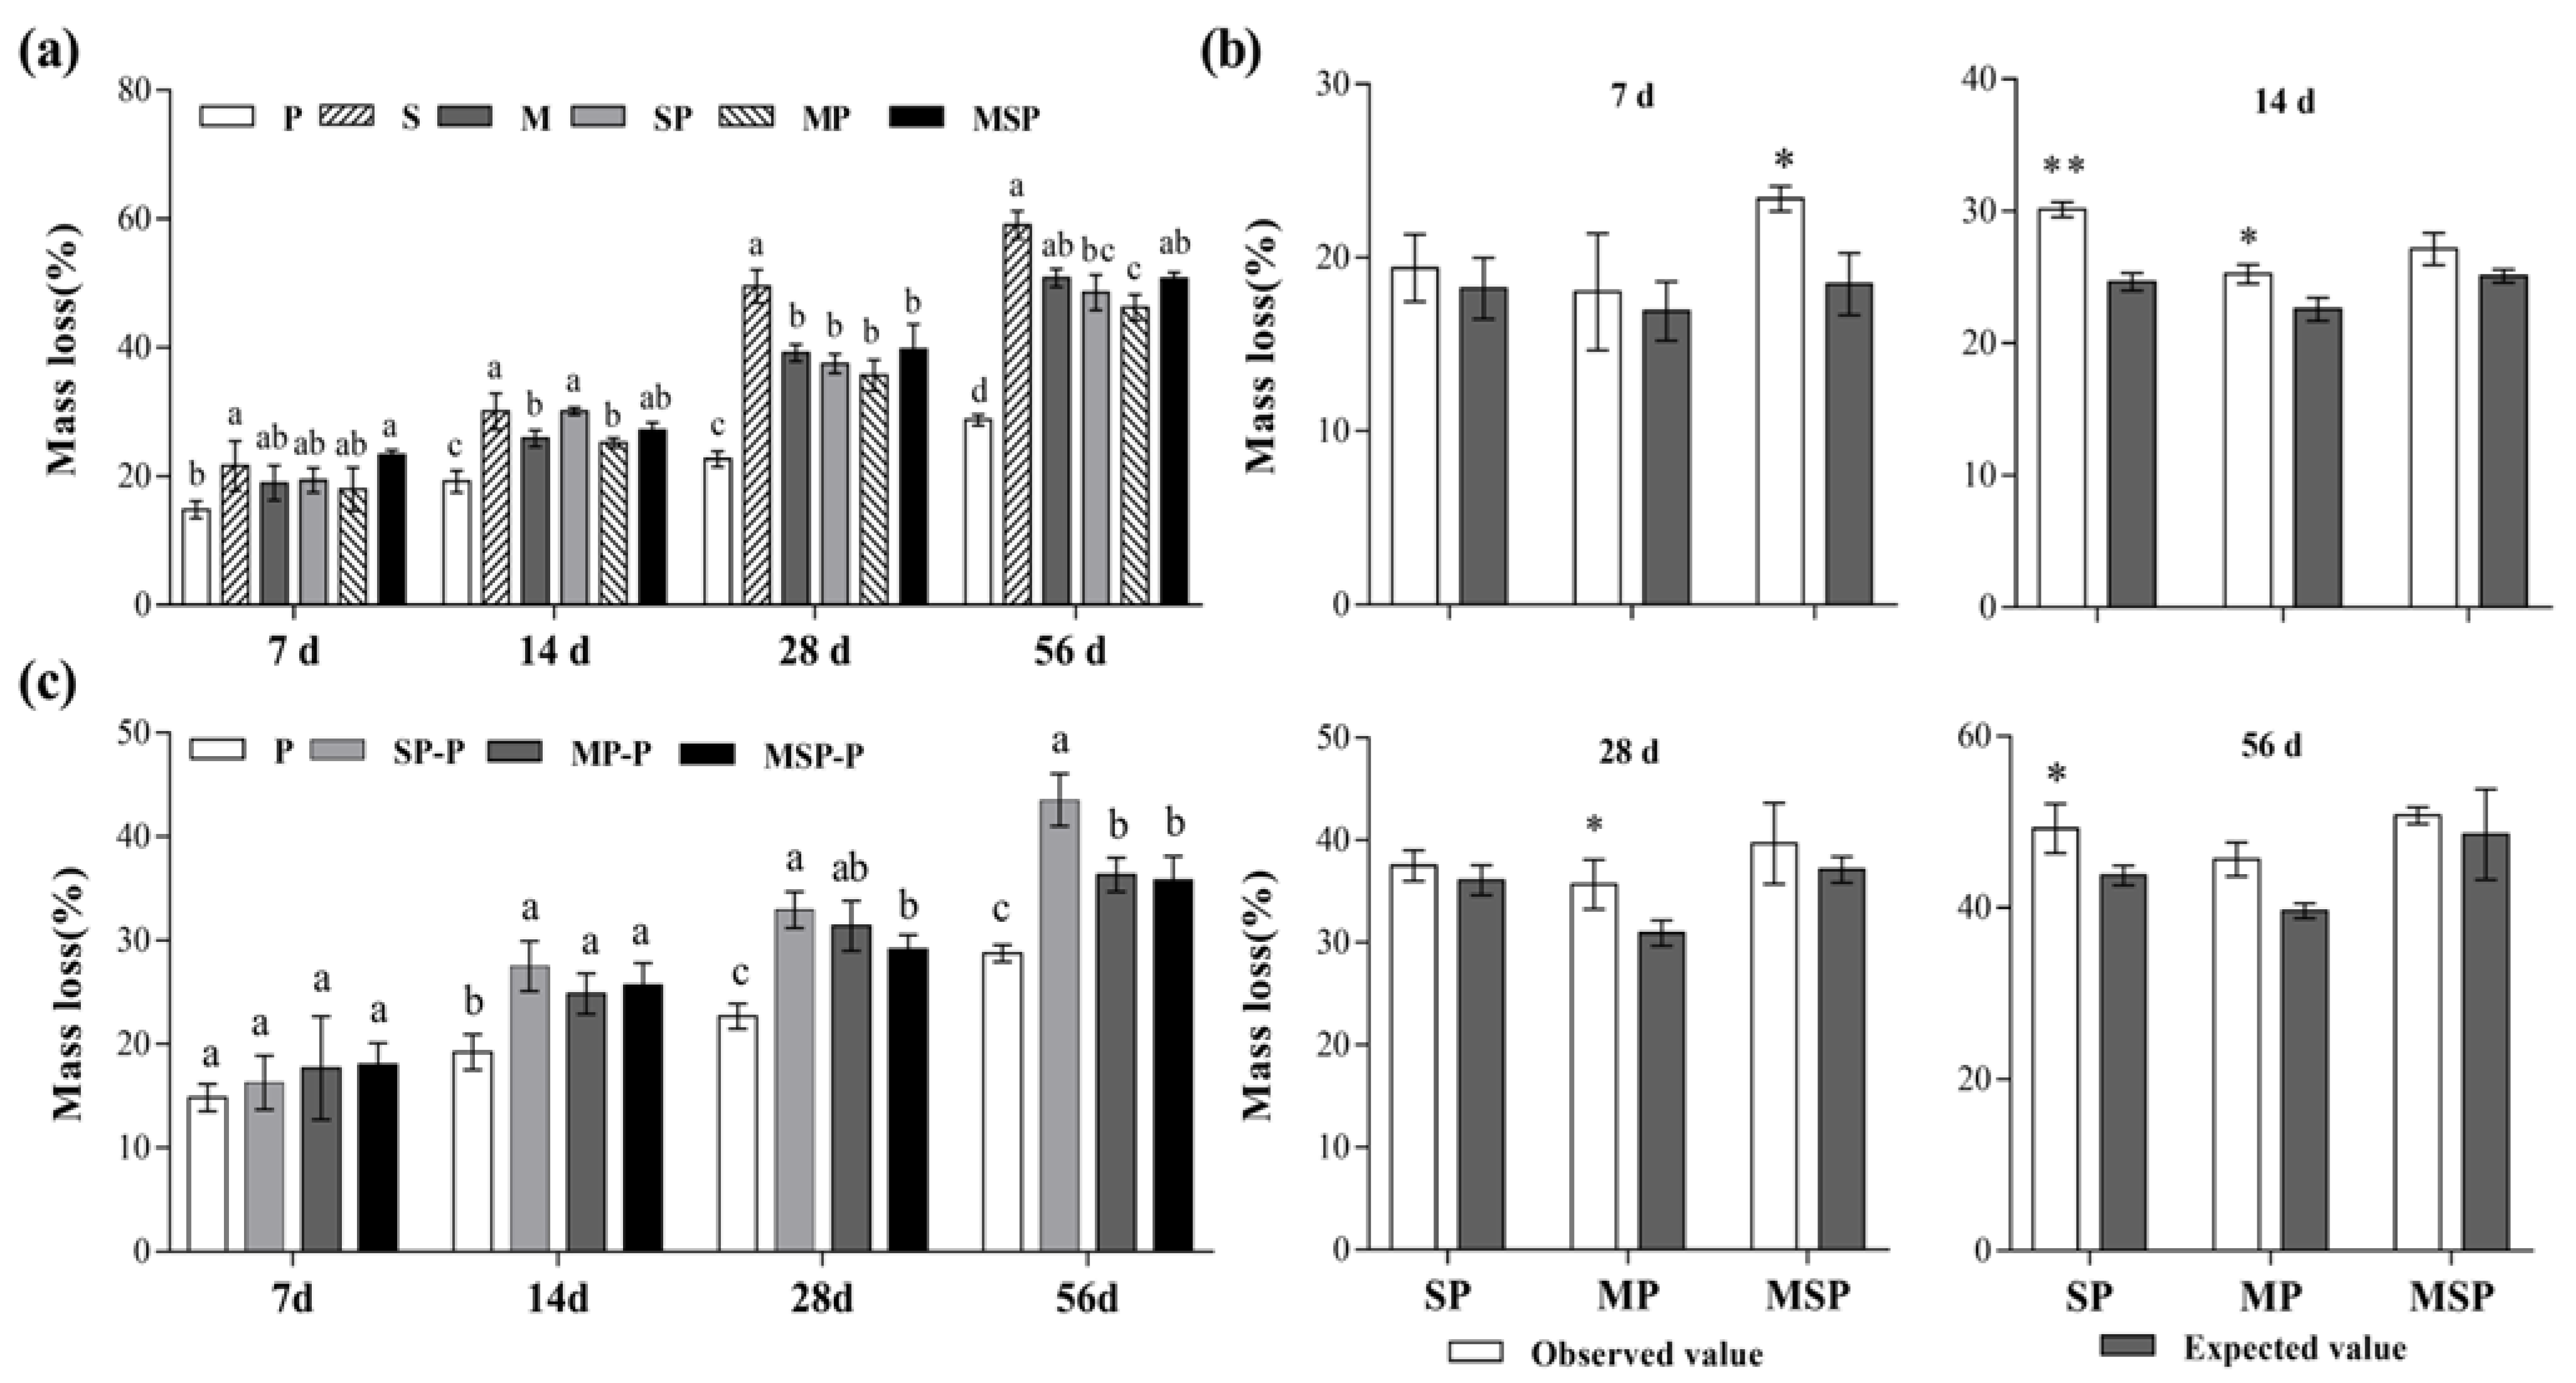
3.1. The Influence of Residue Mixing on the Decomposition Rate

The mass loss of residues varied significantly among the treatments and with the decomposition time (Figure 1a). When degraded alone, the mass loss of the pepper residue was significantly lower than that of other treatments, while the degradation rate of soybean residue was the highest at days 14–56 (p < 0.05; Figure 1a). The observed value of mass loss for MSP and MP were significantly higher than expected at day 14 and day 7, respectively (p < 0.05; Figure 1b). And that of SP was extremely significantly higher than expected at day 14 (Figure 1b). Throughout the degradation, there was no effect of residue mixing on the degradation of pepper residue at day 7. However, residue mixing significantly increased the degradation rate of pepper residue. The mass loss of SP-P was highest at day 14–56, while the degradation rate was increased by 14.38% compared with the solo degradation of pepper residue (Figure 1c). In addition, the non-additive effects produced by different residue mixtures were distributed over different decomposition times. In particular, the observed values of SP were extremely significant compared with other treatments (p < 0.01; Figure 1b) at day 14. In other words, the residue mixing and degradation time significantly affected the residue degradation rate, and the interaction between residue mixing and degradation time also significantly affected the residue degradation rate (Supplementary Table S1).

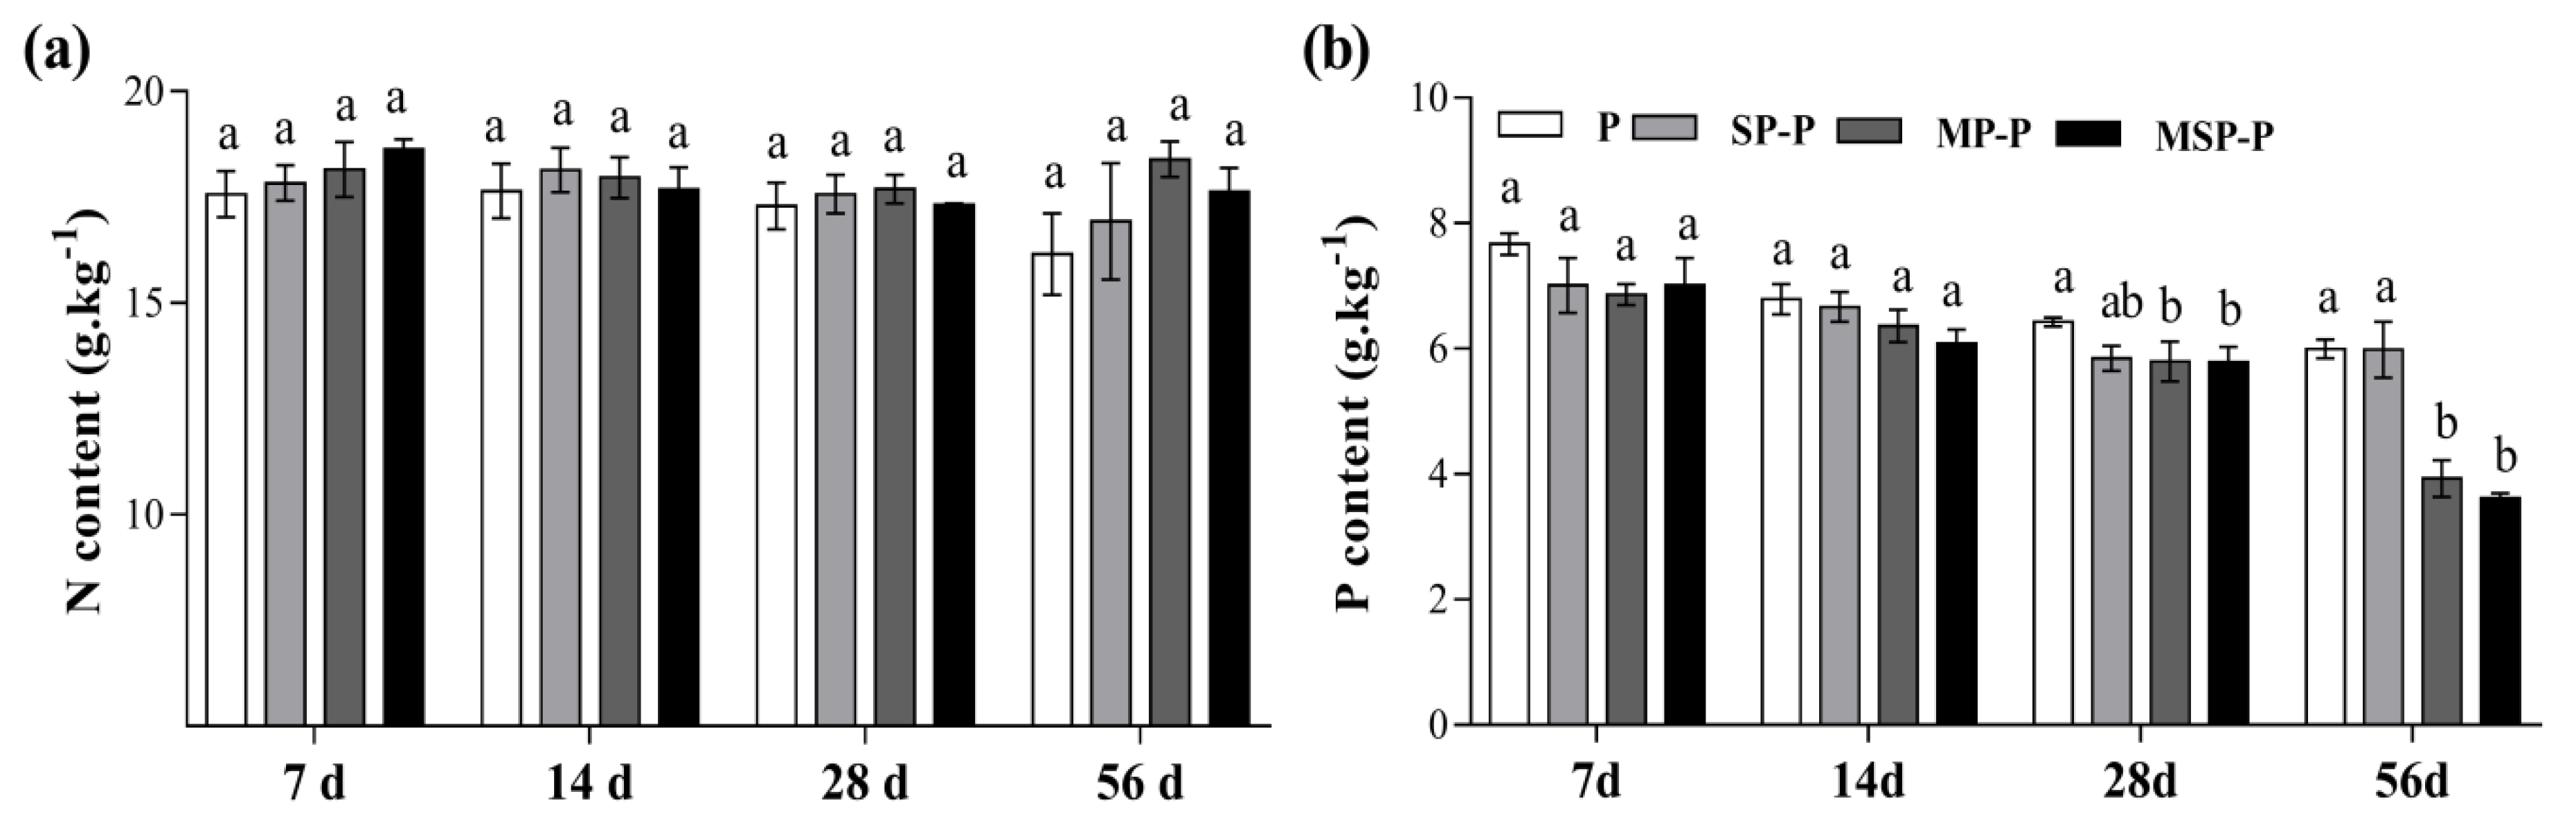
3.2. The Influence of Mixing Residues on Nitrogen and Phosphorus Contents in Pepper Root Residue

There was no significant effect of the residue mixture on the nitrogen content in pepper root residue (Figure 2a). However, the existence of maize residue significantly decreased the phosphorus content in pepper residue at days 28–56. The correlation analysis showed that the mass loss of pepper root residue was negatively correlated with the phosphorus content in residue at day 28 (Supplementary Table S2) but it was positively correlated with nitrogen content at day 7 (Supplementary Table S2).

3.3. The Influence of Mixing Residues on Microbial Community in Pepper Root Residue

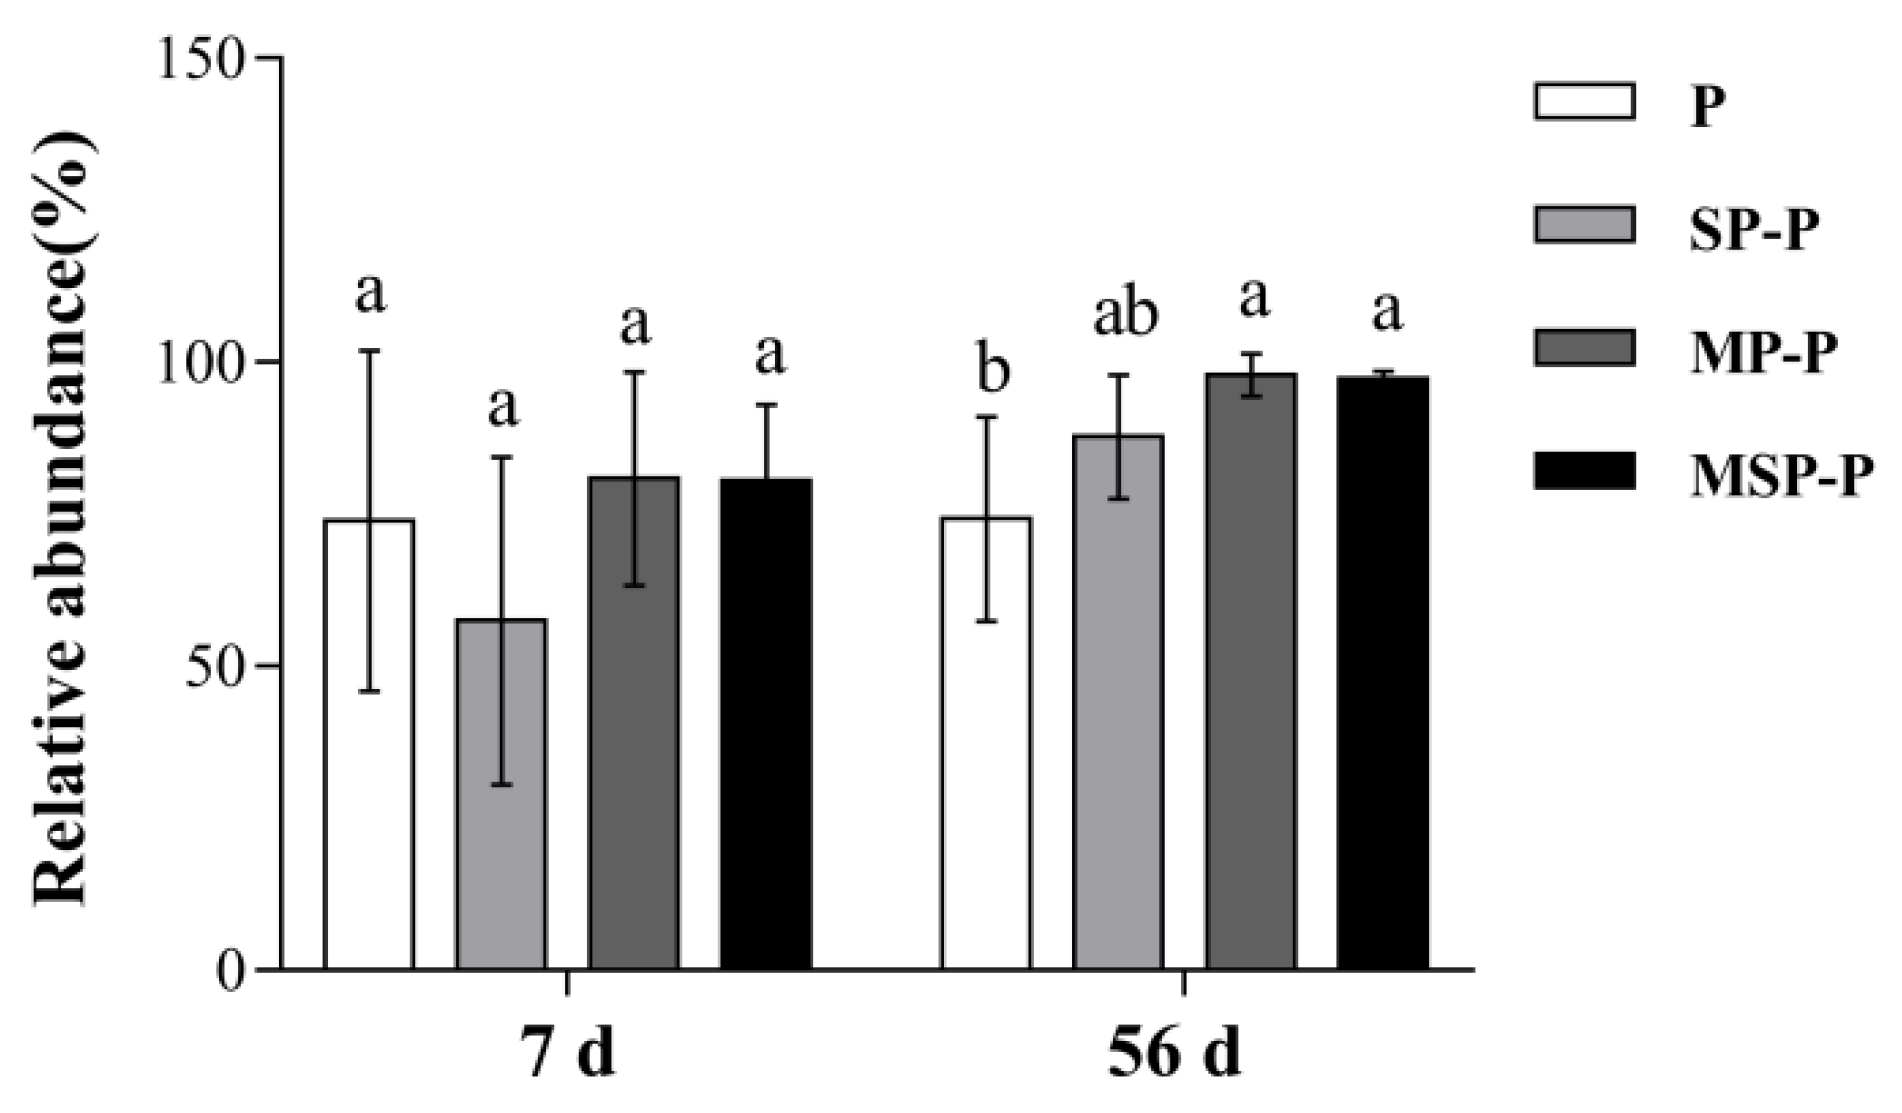
3.3.1. Effects of Residue Mixing on Bacterial and Fungal Community Abundance in Pepper Root Residue

There were no significant difference in bacterial community abundance among the treatments at day 7 (Figure 3a), but residue mixing increased bacterial community abundance in pepper residue at day 14 and day 56 (p < 0.05, Figure 3a). For the fungal community, the pepper residue in mixtures showed higher abundance than pepper root residue alone at days 14–56 of degradation (p < 0.05) (Figure 3b). In addition, the correlation analysis showed that the bacterial community abundance in pepper residue was positively related to mass loss at day 28, while the fungal community abundance was positively related to mass loss at days 14 and 56 (Supplementary Table S2).

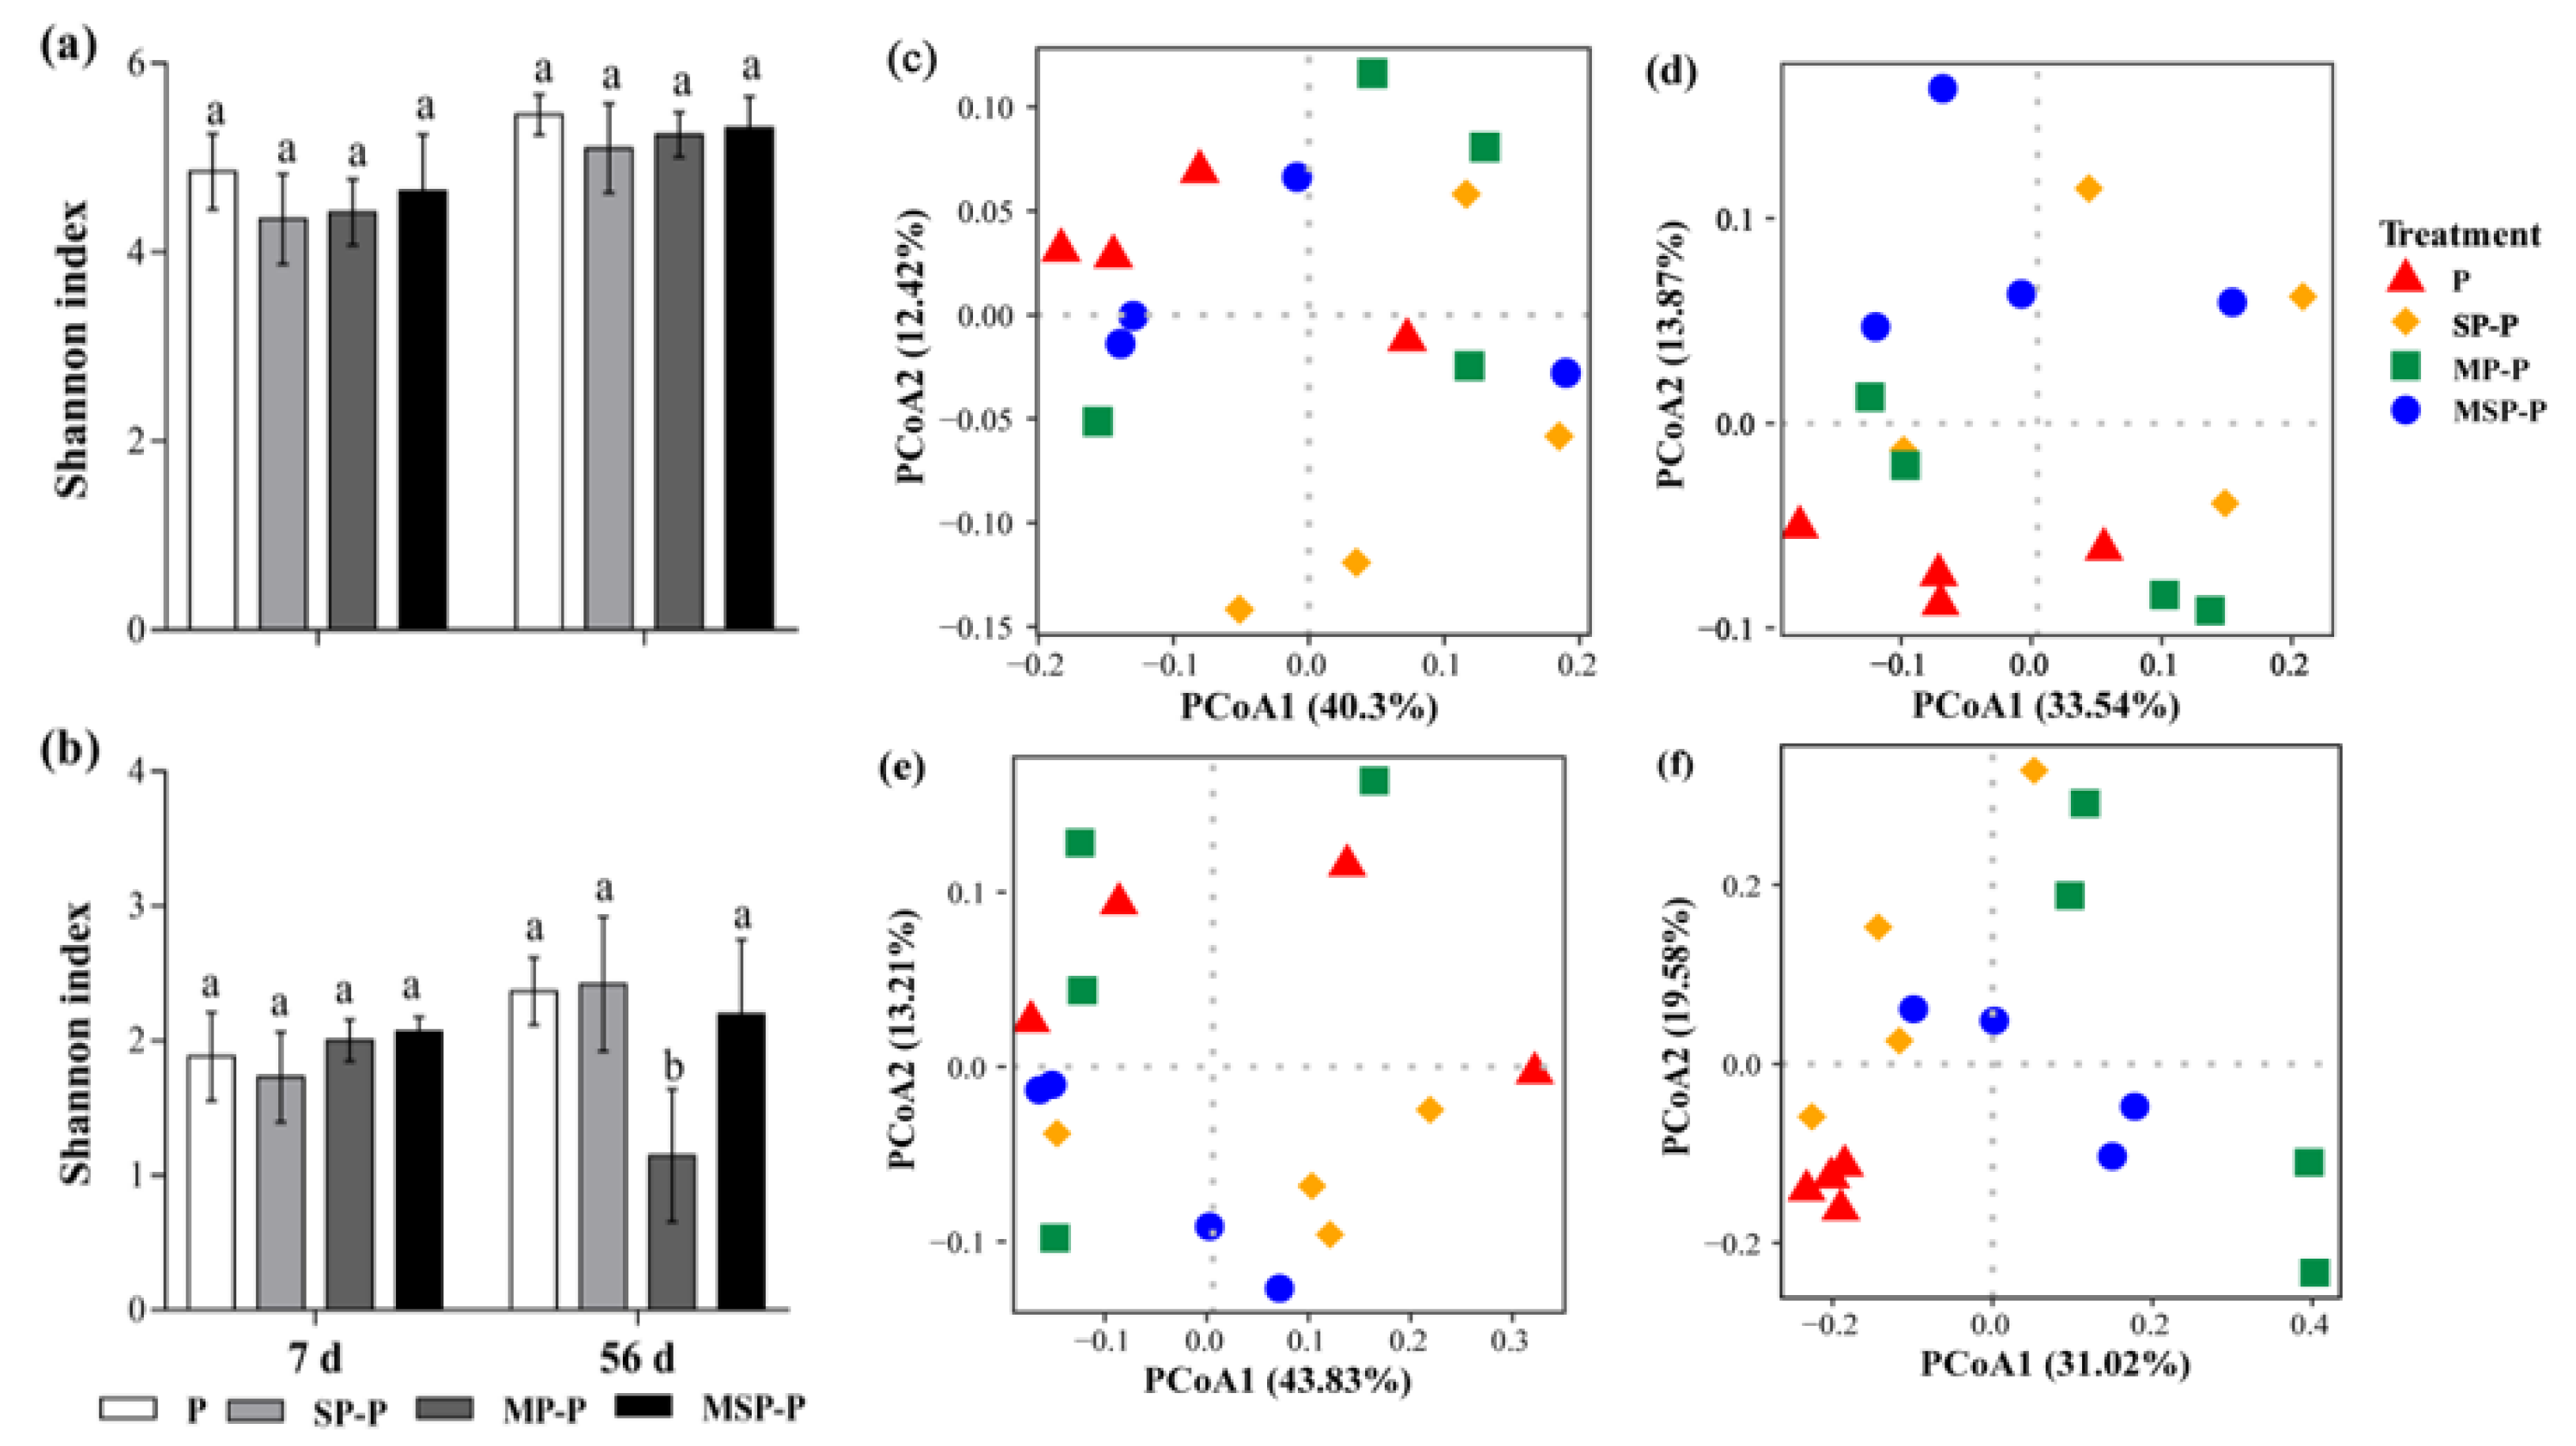
3.3.2. Effects of Residue Mixing on Bacterial and Fungal Community α- and β-Diversities of Pepper Root Residue

Regarding the alpha diversity of the pepper residue’s microbial community, our results showed that there were no differences in the Shannon index among treatments at day 7 and day 56 (Figure 4a). However, the Shannon index for fungal community in MP-P was significantly lower than for other treatments at day 56 (Figure 4b).
The PcoA analysis showed that there were no differences in bacterial community structure among the treatments at day 7 or day 56 (Figure 4c,d), although the fungal communities in MP-P and MSP-P were far away from P along the first axis (Figure 4f), indicating that the presence of maize residue significantly altered the microbial community structure of pepper root residue.

3.3.3. Effects of Residue Mixing on Relative Abundance of Bacteria and Fungi Community in Pepper Residue at the Level of Phylum

A total of 31 bacterial phyla were detected, with 9 bacterial phyla showing relative abundance greater than 1%. Cyanobacteria, WS6, and Nitrospirae were the main dominant bacteria, with a total abundance of more than 80% (Table 2). Compared with SP-P, P had higher relative abundance of Cyanobacteria, but lower relative abundance of WS6 (p < 0.05) (Table 2).
Across all sequences, 18.7% sequences were unclassified at the level of fungal phyla (Supplementary Table S3). The six fungal phyla detected were Ascomycota, Basidiomycota, Blastocladiomycota, Chytridiomycota, Glomeromycota, and Zygomycota. The dominant phylum was Zygomycota, which accounted for 81.2% the of total fungal sequences. Compared with P, MP-P and MSP-P had higher relative abundance of Zygomycota at day 56 (p < 0.05) (Figure 5).

3.3.4. Effects of Residue Mixing on Relative Abundance of Bacteria and Fungi Community in Pepper Residue at the Genus Level

A total of 468 bacterial genera were detected, with 31 bacterial genera showing relative abundance greater than 0.5% (Supplementary Table S4). The bacterial genera that showed differences among treatments were Brevundimonas, Shinella, Rhizobium, Devosia, Actinomadura, Chryseobacterium and Niastella. Compared with P, SP-P showed higher relative abundance of Actinomadura and Chryseobacterium, but lower relative abundance of Brevundimonas and Shinella at day 7 (p < 0.05, Supplementary Table S4). At day 56, SP-P and MSP-P showed higher relative abundance of Niastella and lower relative abundance of Shinella (p < 0.05, Supplementary Table S4).
A total of 88 fungal genera were detected, with 11 fungal genera showing relative abundance greater than 0.1%. There were no differences among treatments regarding 11 fungal genera at day 7 (Supplementary Table S5). However, the relative abundance of the genera Gibberella and Colletotrichum in P were significantly higher than under treatments (p < 0.05, Supplementary Table S5).

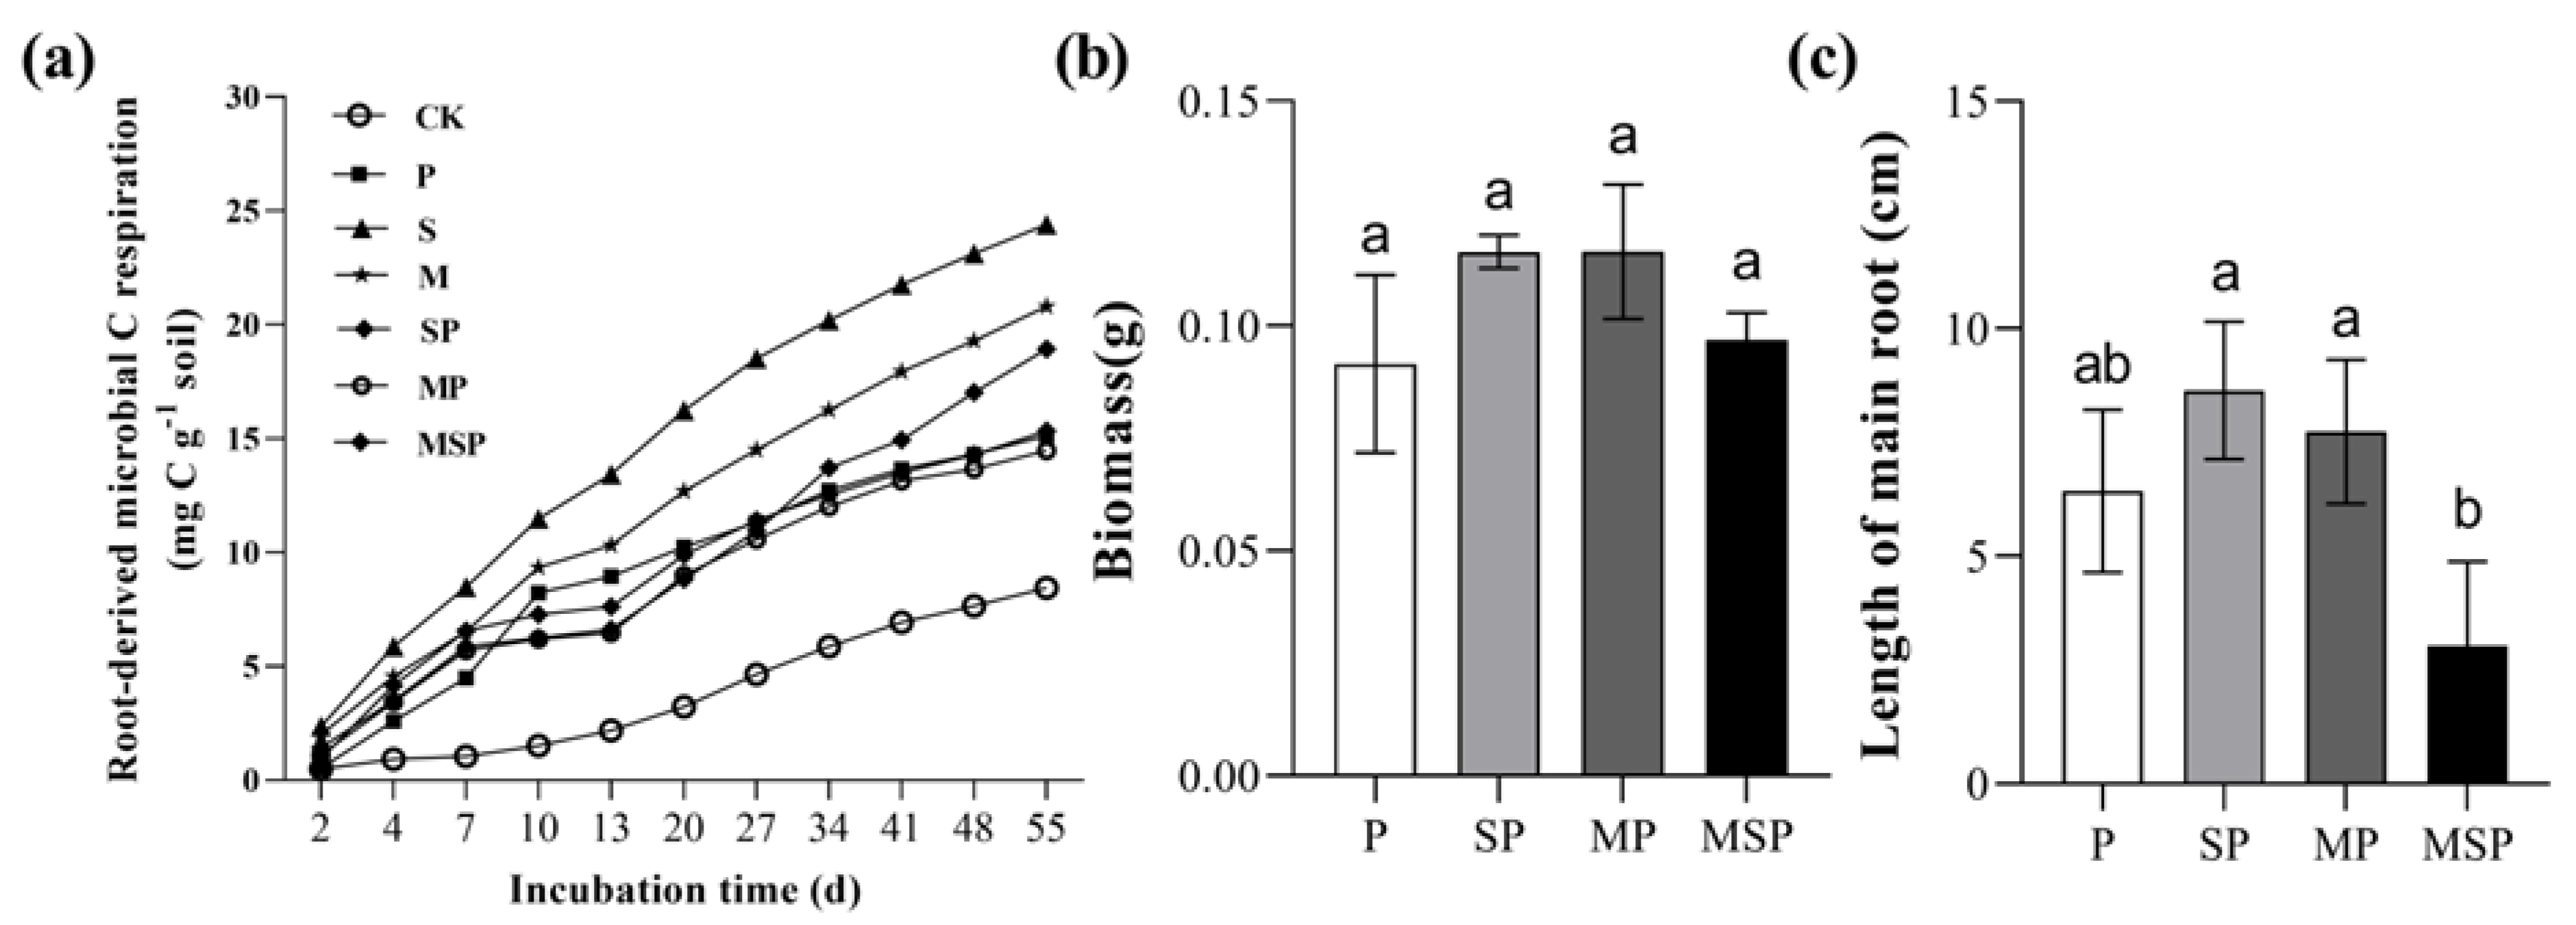
3.4. The Influence of Residues Mixing on Soil Respiration and Growth of Pepper Seedling

The results showed that residue mixing improves soil C respiration. At each time period, the CO2 respiration rate after residue addition was higher than that for soil without residue (Figure 6a), indicating that residue addition promoted the soil C cycle. A decline in litter quality may change the way the ecosystem processes nutrients and the emission of carbon from soil to atmosphere. Previous studies have shown that the slower the residue degradation rate, the higher the level of remaining C, resulting in the lower carbon dioxide emissions [38]. This is consistent with our findings, as S, M, and MSP showed higher decomposition rates with higher soil carbon respiration rates during decomposition. The emissions from soils without residue did not change significantly, while carbon dioxide emissions from residue-treated soils increased gradually with degradation time. However, there was no significant effect of residue mixing on the biomass of pepper seedlings (Figure 6b). The effects of maize and soybean residues on the lengths of the main root of pepper seedlings were similar, which were greater than with pepper residue alone, althouth the effects were not significant (Figure 6c). In addition, MSP inhibited the growth of pepper seedlings (Figure 6c).

4. Discussion

4.1. Effect of Residue Mixing on Mass Loss of Pepper Root Residue and the Growth of Pepper Seedling

Previous studies have shown that non-additive effects of litter mixing on litter decomposition are very common in natural ecosystems [11,39]. In the present study, synergistic effects of residue mixing on mass loss were detected at four sampling times, which was partly consistent with our hypothesis. In each degradation period, the degradation rate of soybean residue was higher than for maize and pepper, possibly because the higher phenol level limited microbial growth in maize and pepper residues, thereby slowing down the rate of degradation [13]; it is also possible that the higher initial calcium content not only improved the mass loss, but also the loss of hemicellulose and bound proteins, cellulose and AUR were also improved [40]. Studies have shown that residue mixtures have generally been found to improve decomposition rates when residue species with particular functional characteristics (i.e., nitrogen-fixing legumes, C 4 grasses) are present in the mixture [41,42]. This could explain why the degradation rate of pepper residue was the highest when mixed with soybean residues at days 14–56 (Figure 1a). However, the decomposition rate of MSP-P was significantly lower than SP-P at day 28 and day 56, indicating that the residue diversity is not always related to the degradation rate, which may be caused by the different properties and chemical compositions of residues [43]. Jarchow reported that the C:N ratio in corn residue was higher than that in soybean [44]. When high-quality residues were mixed with low-quality residues for degradation, the high-quality residue usually promoted the decomposition of the low-quality residues [45]. This observation can also explain why the degradation rate of MP-P was significantly lower than that of SP. In this study, soybean not only had the highest degradation rate alone, but also had a stronger promoting effect on pepper residue decomposition than maize. In addition to the relatively high phenol content in maize inhibiting the growth of microorganisms, it may also be the different interaction between residues caused by the mixing proportion of residues [4].
Previous studies have shown that adding plant residues to the soil can improve the soil environment and promote plant growth [4]. However, in the present study, the addition of residue had no effect on the biomass of pepper seedlings, which may have been because the addition of residues did not improve the soil environment or because the soil itself had enough nutrients for pepper seedlings to grow. The main root lengths for MSP were significantly lower than for other treatments, which may also have been caused by the high phosphorus and phenol content in maize residue. We will study this further in the next step.

4.2. Effects of Residue Mixing on Nitrogen and Phosphorus Contents in Pepper Root Residue

Changes in nitrogen and phosphorus contents during residue degradation are important markers for regulating the rate of residue degradation [46]. Previous studies have shown that nitrogen and phosphorus in residue provide nutrients to the residue decomposer, thereby changing the degradation rate [47]. Similarly, we found that the presence of maize and soybean residues promoted the degradation of pepper root residue (Figure 1a), which may have resulted from the nutrient components of maize or soybean being transferred from microorganisms to pepper residue. Additionally, the degradation rates of low-quality residues (i.e., low initial nitrogen and phosphorus concentrations) were lower than of high-quality residues (i.e., high initial nitrogen and phosphorus concentrations) [48]. In this study, although the initial nitrogen concentration of pepper root residue was significantly higher than for soybean and maize residues (Table 1), the decomposition rate of pepper was not higher than soybean or maize, which was not consistent with previous studies. At day 28–56 of degradation, the phosphorus content of P was significantly higher than for MP-P and MSP-P, indicating that in the later stage of degradation, the existence of maize may cause nutrient transfer between residues. However, there was no difference in nitrogen content in pepper residues among different treatments, which was not consistent with study by Mao, who found residues mixing had a positive non-additive effect on nitrogen release (10/12 of the residue mixtures) [4]. Therefore, we thought that nitrogen content may also be a less important predictor of decomposition than important micro-nutrients such as calcium, manganese and tannins [16]. The result of this study indicate that our second hypothesis was not fully validated, although they further explained the role of residue quality, especially regarding micronutrients, in decomposition process.

4.3. Effects of Residue Mixing on Microbial Community in Pepper Residue

In terrestrial ecosystems, microbial communities provide nutrients resources for aboveground plants via residue decomposition, which plays a very important role in the process of residue degradation process [49]. The greater the higher diversity of the decomposer community, the more complete and effective the utilization of substrates, improving the residue degradation rate [2]. In this study, the mass loss of pepper residue varied with bacterial community abundance. At day 28, the bacterial community abundance and residue mass loss of MSP-P were the lowest. Studies have shown that in the early phases of residue degradation, the change in bacterial community composition are closely related to the change in C substrate quantity and quality [50,51]. In the later phases of residue decomposition, oligotrophic bacteria and diverse fungal communities act as decomposers to degrade the recalcitrant carbon components of the residue [23,52]. Diverse residues can also alter the microclimatic condition and microbial community composition, and have indirect consequences for decomposition [53]. The correlation analysis showed that the mass loss of pepper residue was positively correlated with bacterial community abundance at day 14 and day 56, although only positively correlated with fungal community abundance at day 28 (Supplementary Table S2). One possible reason for this is that the whole degradation period was short, meaning the pepper residue only experienced the initial stage of degradation. The highest mass loss of pepper residue was only 46.53% across the whole decomposition process. The previous data also showed that the interaction between residue degradation time and residue mixing significantly affected the mass loss of residue (Supplementary Table S1).
Furthermore, lignocellulose is the main recalcitrant component in residue, and its degradation mainly relies on the complementary contribution of microbes [54], especially for a number of important wood-decaying fungi [55], such as Zygomycete. In the present study, the Zygomycota relative abundance for MP-P and MSP-P were significantly higher than for P at day 56, which was consistent with the decomposition rate, indicating that the main role in the later stages of degradation may be played by Zygomycota. At the genus level, there were no differences among treatments for genera Rhizobium and Pseudomonas. However, the relative abundance of Fusarium spp. correlated with cellulose degradation ability was significantly lower than that of P at day 56 (p < 0.05, Supplementary Table S5), which was inconsistent with previous studies [22]. In the middle and late stages of decomposition, the genus Niastella participated in straw destructionthe [20]. In this study, the mixtures showed pronounced (more than 1%) abundance of the genus Niastella. Therefore, we speculated that even though the genus Niastella represents a relatively small proportion of the bacterial genera sequenced, it has a significant effect on the degradation rate, although this aspect requires further study. The results of this study may contribute to a better understanding of the changes and roles of microbial communities in degradation processes.

5. Conclusions

Our study showed that residue mixing frequently had non-additive effects on residue decomposition. However, as decomposition progressed, the direction and magnitude of the non-additive effects changed with prolonged decomposition time. Meanwhile, residue mixing changed the microbial community abundance of pepper root residue, and improved the decomposition rate. In addition, soybean residue had the strongest promoting effect on the degradation of pepper residue.

Supplementary Materials

The following supporting information can be downloaded at: https://www.mdpi.com/article/10.3390/agriculture12010084/s1, Table S1: Effects of diversity and degradation time on the degradation of residues; Table S2: The correlation between mass loss and nitrogen, phosphorus, bacterial, and fungal abundance, respectively; Table S3: The relative abundance of main fungi at the level of phylum in the pepper residue at day 7 and day 56, respectively; Table S4: The relative abundance of main bacteria at the level of genus in the pepper residue at day 7 and day 56, respectively. Table S5: The relative abundance of main fungi at the level of genus in the pepper residue at day 7 and day 56, respectively.

Author Contributions

All authors declare that everyone contributed adequately to the experimental procedures and writing of the manuscript. X.Z. (Xingang Zhou) and F.W. conceived and designed the study; X.Z. (Xianhong Zhang) and Z.W. performed the experiments; X.Z. (Xianhong Zhang) processed data and wrote the manuscript. All authors have read and agreed to the published version of the manuscript.

Funding

This work was supported by the National Natural Science Foundation of China (32072655).

Data Availability Statement

Data are available by contacting the authors.

Conflicts of Interest

The authors declare no conflict of interest.

References

  1. Zou, Z.; Zou, X. Geographical and ecological differences in pepper cultivation and consumption in China. Front. Nutr. 2021, 8, 718517. [Google Scholar] [CrossRef]
  2. Swan, C.M.; Gluth, M.A.; Horne, C.L. Leaf litter species evenness influences nonadditive breakdown in a headwater stream. Ecology 2009, 90, 1650–1658. [Google Scholar] [CrossRef]
  3. Zhou, X.; Zhang, J.; Pan, D.; Ge, X.; Jin, X.; Chen, S.; Wu, F. p-Coumaric can alter the composition of cucumber rhizosphere microbial communities and induce negative plant-microbial interactions. Biol. Fertil. Soils 2018, 54, 363–372. [Google Scholar] [CrossRef]
  4. Mao, R.; Zeng, D.-H. Non-additive effects vary with the number of component residues and their mixing proportions during residue mixture decomposition: A microcosm study. Geoderma 2012, 170, 112–117. [Google Scholar] [CrossRef]
  5. Abelho, M. Litter traits and decomposer complexity set the stage for a global decomposition model. Funct. Ecol. 2015, 30, 674–675. [Google Scholar] [CrossRef] [Green Version]
  6. Chen, X.; Chen, H.Y.H. Global effects of plant litter alterations on soil CO2 to the atmosphere. Glob. Chang. Biol. 2018, 24, 3462–3471. [Google Scholar] [CrossRef] [PubMed]
  7. Xu, S.; Liu, L.L.; Sayer, E.J. Variability of above-ground litter inputs alters soil physicochemical and biological processes: A meta-analysis of litterfall-manipulation experiments. Biogeosciences 2013, 10, 7423–7433. [Google Scholar] [CrossRef] [Green Version]
  8. Barzegar, A.; Yousefi, A.; Daryashenas, A. The effect of addition of different amounts and types of organic materials on soil physical properties and yield of wheat. Plant Soil 2002, 247, 295–301. [Google Scholar] [CrossRef]
  9. Schneider, T.; Keiblinger, K.M.; Schmid, E.; Sterflinger-Gleixner, K.; Ellersdorfer, G.; Roschitzki, B.; Richter, A.; Eberl, L.; Zechmeister-Boltenstern, S.; Riedel, K. Who is who in litter decomposition? Metaproteomics reveals major microbial players and their biogeochemical functions. ISME J. 2012, 6, 1749–1762. [Google Scholar] [CrossRef] [Green Version]
  10. Steinwandter, M.; Schlick-Steiner, B.; Steiner, F.M.; Seeber, J. One plus one is greater than two: Mixing litter types accelerates decomposition of low-quality alpine dwarf shrub litter. Plant Soil 2019, 438, 405–419. [Google Scholar] [CrossRef] [Green Version]
  11. Liu, J.; Liu, X.; Song, Q.; Compson, Z.G.; LeRoy, C.J.; Luan, F.; Wang, H.; Hu, Y.; Yang, Q. Synergistic effects: A common theme in mixed-species litter decomposition. New Phytol. 2020, 227, 757–765. [Google Scholar] [CrossRef]
  12. Lidman, J.; Jonsson, M.; Burrows, R.; Bundschuh, M.; Sponseller, R.A. Composition of riparian litter input regulates organic matter decomposition: Implications for headwater stream functioning in a managed forest landscape. Ecol. Evol. 2017, 7, 1068–1077. [Google Scholar] [CrossRef]
  13. Mooshammer, M.; Wanek, W.; Schnecker, J.; Wild, B.; Leitner, S.; Hofhansl, F.; Blöchl, A.; Hämmerle, I.; Frank, A.; Fuchslueger, L.; et al. Stoichiometric controls of nitrogen and phosphorus cycling in decomposing beech leaf litter. Ecology 2012, 93, 770–782. [Google Scholar] [CrossRef]
  14. Vivanco, L.; Austin, A. The importance of macro- and micro-nutrients over climate for leaf litter decomposition and nutrient release in Patagonian temperate forests. For. Ecol. Manag. 2019, 441, 144–154. [Google Scholar] [CrossRef]
  15. Silver, W.L.; Miya, R.K. Global patterns in root decomposition: Comparisons of climate and litter quality effects. Oecologia 2001, 129, 407–419. [Google Scholar] [CrossRef] [PubMed]
  16. Makkonen, M.; Berg, M.P.; Handa, I.T.; Hättenschwiler, S.; van Ruijven, J.; van Bodegom, P.M.; Aerts, R. Highly consistent effects of plant litter identity and functional traits on decomposition across a latitudinal gradient. Ecol. Lett. 2012, 15, 1033–1041. [Google Scholar] [CrossRef] [PubMed]
  17. Cline, L.C.; Zak, D.R. Initial colonization, community assembly and ecosystem function: Fungal colonist traits and litter biochemistry mediate decay rate. Mol. Ecol. 2015, 24, 5045–5058. [Google Scholar] [CrossRef]
  18. Stemmer, M.; Watzinger, A.; Blochberger, K.; Haberhauer, G.; Gerzabek, M. Linking dynamics of soil microbial phospholipid fatty acids to carbon mineralization in a 13C natural abundance experiment: Impact of heavy metals and acid rain. Soil Biol. Biochem. 2007, 39, 3177–3186. [Google Scholar] [CrossRef]
  19. Banerjee, S.; Kirkby, C.A.; Schmutter, D.; Bissett, A.; Kirkegaard, J.; Richardson, A.E. Network analysis reveals functional redundancy and keystone taxa amongst bacterial and fungal communities during organic matter decomposition in an arable soil. Soil Biol. Biochem. 2016, 97, 188–198. [Google Scholar] [CrossRef]
  20. Orlova, O.V.; Kichko, A.A.; Pershina, E.V.; Pinaev, A.G.; Andronov, E.E. Succession of bacterial communities in the decomposition of oats straw in two soils with contrasting properties. Eurasian Soil Sci. 2020, 53, 1620–1628. [Google Scholar] [CrossRef]
  21. Purahong, W.; Kapturska, D.; Pecyna, M.J.; Schulz, E.; Schloter, M.; Buscot, F.; Hofrichter, M.; Krüger, D. Influence of different forest system management practices on leaf litter decomposition rates, nutrient dynamics and the activity of ligninolytic enzymes: A case study from central European forests. PLoS ONE 2014, 9, e93700. [Google Scholar] [CrossRef] [PubMed] [Green Version]
  22. Liu, Z.; Fu, T.; Hu, C.; Shen, D.; Macchioni, N.; Sozzi, L.; Chen, Y.; Liu, J.; Tian, X.; Ge, Q.; et al. Microbial community analysis and biodeterioration of waterlogged archaeological wood from the Nanhai No. 1 shipwreck during storage. Sci. Rep. 2018, 8, 7170. [Google Scholar] [CrossRef] [Green Version]
  23. Li, D.; Li, Z.; Zhao, B.; Zhang, J. Relationship between the chemical structure of straw and composition of main microbial groups during the decomposition of wheat and maize straws as affected by soil texture. Biol. Fertil. Soils 2019, 56, 11–24. [Google Scholar] [CrossRef]
  24. Yue, K.; García-Palacios, P.; Parsons, S.A.; Yang, W.; Peng, Y.; Tan, B.; Huang, C.; Wu, F. Assessing the temporal dynamics of aquatic and terrestrial litter decomposition in an alpine forest. Funct. Ecol. 2018, 32, 2464–2475. [Google Scholar] [CrossRef]
  25. Derderian, M.D. Determination of calcium and magnesium in plant material with EDTA. Anal. Chem. 1961, 33, 1796–1798. [Google Scholar] [CrossRef]
  26. Li, X.; Lin, J.; Gao, Y.; Han, W.; Chen, D. Antioxidant activity and mechanism of Rhizoma Cimicifugae. Chem. Central J. 2012, 6, 140. [Google Scholar] [CrossRef] [Green Version]
  27. Jin, X.; Wu, F.; Zhou, X. Different toxic effects of ferulic and p-hydroxybenzoic acids on cucumber seedling growth were related to their different influences on rhizosphere microbial composition. Biol. Fertil. Soils 2019, 56, 125–136. [Google Scholar] [CrossRef]
  28. Zhang, X.; Xie, H.; Wang, Y.; Zhou, X. Effects of green manure of wild rocket (Diplotaxis tenuifolia L.) on cucumber rhizosphere fungal community. Allelopath. J. 2021, 53, 93–100. [Google Scholar] [CrossRef]
  29. Birouste, M.; Kazakou, E.; Blanchard, A.; Roumet, C. Plant traits and decomposition: Are the relationships for roots comparable to those for leaves? Ann. Bot. 2011, 109, 463–472. [Google Scholar] [CrossRef] [Green Version]
  30. Yang, C.; Zhang, Y.; Rong, Y.; Bei, Y.; Wei, Y.; Liu, N. Temporal variation of Q 10 values in response to changes in soil physiochemical properties caused by fairy rings. Eur. J. Soil Biol. 2018, 86, 42–48. [Google Scholar] [CrossRef]
  31. Majumder, B.; Kuzyakov, Y. Effect of fertilization on decomposition of 14C labelled plant residues and their incorporation into soil aggregates. Soil Tillage Res. 2010, 109, 94–102. [Google Scholar] [CrossRef]
  32. Ran, L.; Li, J.; Xing, Y.; Zhang, J.; Zhou, X. Effects of p-coumaric acid on the structure and abundance of soil Pseudomonas spp. community. Allelopath. J. 2021, 53, 209–216. [Google Scholar] [CrossRef]
  33. Zhou, X.; Rahman, M.K.U.; Liu, J.; Wu, F. Soil acidification mediates changes in soil bacterial community assembly processes in response to agricultural intensification. Environ. Microbiol. 2021, 23, 4741–4755. [Google Scholar] [CrossRef]
  34. Zhou, X.; Liu, J.; Wu, F. Soil microbial communities in cucumber monoculture and rotation systems and their feedback effects on cucumber seedling growth. Plant Soil 2017, 415, 507–520. [Google Scholar] [CrossRef]
  35. Zhou, X.; Wang, Z.; Jia, H.; Li, L.; Wu, F. Continuously Monocropped jerusalem artichoke changed soil bacterial community composition and ammonia-oxidizing and denitrifying bacteria abundances. Front. Microbiol. 2018, 9, 705. [Google Scholar] [CrossRef] [Green Version]
  36. Caporaso, J.G.; Kuczynski, J.; Stombaugh, J.; Bittinger, K.; Bushman, F.D.; Costello, E.K.; Fierer, N.; Peña, A.G.; Goodrich, J.K.; Gordon, J.I.; et al. QIIME allows analysis of high-throughput community sequencing data. Nat. Methods 2010, 7, 335–336. [Google Scholar] [CrossRef] [Green Version]
  37. Edgar, R.C. UPARSE: Highly accurate OTU sequences from microbial amplicon reads. Nat. Methods 2013, 10, 996–998. [Google Scholar] [CrossRef] [PubMed]
  38. Stegarescu, G.; Escuer-Gatius, J.; Soosaar, K.; Kauer, K.; Tõnutare, T.; Astover, A.; Reintam, E. Effect of Crop Residue Decomposition on Soil Aggregate Stability. Agriculture 2020, 10, 527. [Google Scholar] [CrossRef]
  39. Hou, S.-L.; Lü, X.-T. Mixing effects of litter decomposition at plant organ and species levels in a temperate grassland. Plant Soil 2020, 459, 387–396. [Google Scholar] [CrossRef]
  40. Berg, B.; Johansson, M.-B.; Liu, C.; Faituri, M.; Sanborn, P.; Vesterdal, L.; Ni, X.; Hansen, K.; Ukonmaanaho, L. Calcium in decomposing foliar litter–A synthesis for boreal and temperate coniferous forests. For. Ecol. Manag. 2017, 403, 137–144. [Google Scholar] [CrossRef]
  41. Fornara, D.; Tilman, D. Plant functional composition influences rates of soil carbon and nitrogen accumulation. J. Ecol. 2008, 96, 314–322. [Google Scholar] [CrossRef]
  42. De Deyn, G.B.; Cornelissen, J.H.C.; Bardgett, R.D. Plant functional traits and soil carbon sequestration in contrasting biomes. Ecol. Lett. 2008, 11, 516–531. [Google Scholar] [CrossRef] [PubMed]
  43. Hishinuma, T.; Azuma, J.-I.; Osono, T.; Takeda, H. Litter quality control of decomposition of leaves, twigs, and sapwood by the white-rot fungus Trametes versicolor. Eur. J. Soil Biol. 2017, 80, 1–8. [Google Scholar] [CrossRef]
  44. Jarchow, M.E.; Liebman, M.; Dhungel, S.; Dietzel, R.; Sundberg, D.; Anex, R.P.; Thompson, M.L.; Chua, T. Trade-offs among agronomic, energetic, and environmental performance characteristics of corn and prairie bioenergy cropping systems. GCB Bioenergy 2014, 7, 57–71. [Google Scholar] [CrossRef] [Green Version]
  45. Zhang, P.; Tian, X.; He, X.; Song, F.; Ren, L.; Jiang, P. Effect of litter quality on its decomposition in broadleaf and coniferous forest. Eur. J. Soil Biol. 2008, 44, 392–399. [Google Scholar] [CrossRef]
  46. Liu, P.; Huang, J.; Han, X.; Sun, O.J. Litter decomposition in semiarid grassland of inner Mongolia, China. Rangel. Ecol. Manag. 2009, 62, 305–313. [Google Scholar] [CrossRef]
  47. Wardle, D.; Yeates, G.; Barker, G.; Bonner, K. The influence of plant litter diversity on decomposer abundance and diversity. Soil Biol. Biochem. 2006, 38, 1052–1062. [Google Scholar] [CrossRef]
  48. Chomel, M.; Guittonnylarcheveque, M.; DesRochers, A.; Baldy, V. Effect of mixing herbaceous litter with tree litters on decomposition and N release in boreal plantations. Plant Soil 2015, 398, 229–241. [Google Scholar] [CrossRef]
  49. Chen, B.-M.; Peng, S.-L.; D’Antonio, C.M.; Li, D.-J.; Ren, W.-T. Non-Additive effects on decomposition from mixing litter of the invasive mikania Micrantha H.B.K. with native plants. PLoS ONE 2013, 8, e66289. [Google Scholar] [CrossRef] [Green Version]
  50. Chapman, S.K.; Newman, G.S.; Hart, S.C.; Schweitzer, J.A.; Koch, G.W. Leaf litter mixtures alter microbial community development: Mechanisms for non-additive effects in litter decomposition. PLoS ONE 2013, 8, e62671. [Google Scholar] [CrossRef] [Green Version]
  51. Herzog, C.; Hartmann, M.; Frey, B.; Stierli, B.; Rumpel, C.; Buchmann, N.; Brunner, I. Microbial succession on decomposing root litter in a drought-prone Scots pine forest. ISME J. 2019, 13, 2346–2362. [Google Scholar] [CrossRef] [Green Version]
  52. Purahong, W.; Wubet, T.; Lentendu, G.; Schloter, M.; Pecyna, M.J.; Kapturska, D.; Hofrichter, M.; Krüger, D.; Buscot, F. Life in leaf litter: Novel insights into community dynamics of bacteria and fungi during litter decomposition. Mol. Ecol. 2016, 25, 4059–4074. [Google Scholar] [CrossRef] [PubMed]
  53. Wardle, D.A.; Nilsson, M.-C.; Zackrisson, O.; Gallet, C. Determinants of litter mixing effects in a Swedish boreal forest. Soil Biol. Biochem. 2003, 35, 827–835. [Google Scholar] [CrossRef]
  54. Tian, B.; Wang, C.; Lv, R.; Zhou, J.; Li, X.; Zheng, Y.; Jin, X.; Wang, M.; Ye, Y.; Huang, X.; et al. Community structure and succession regulation of fungal consortia in the lignocellulose-degrading process on natural biomass. Sci. World J. 2014, 2014, 845721. [Google Scholar] [CrossRef] [PubMed] [Green Version]
  55. Tian, B.-Y.; Huang, Q.-G.; Xu, Y.; Wang, C.-X.; Lv, R.-R.; Huang, J.-Z. Microbial community structure and diversity in a native forest wood-decomposed hollow-stump ecosystem. World J. Microbiol. Biotechnol. 2009, 26, 233–240. [Google Scholar] [CrossRef]
Figure 1. Mass loss values of different residue treatments (a); observed and expected values of mass loss (b) and mass loss of pepper root residue in the mixtures (c). P, S and M represent pepper, soybean, and maize residues, respectively. SP, MP, and MSP represent mixtures of soybean and pepper; maize and pepper; and maize, soybean, and pepper, respectively. SP-P, MP-P, and MSP-P represent pepper residue in the mixtures. The expected values were calculated as the average mass loss during component species decomposition in isolation. Different letters indicate significant differences based on Tukey’s HSD test (p < 0.05); * values were significantly different at p < 0.05; ** values were significantly different at p < 0.01. Error bars represent standard errors of the mean.
Agriculture 12 00084 g001
Figure 2. Effects of different treatments on the nitrogen content (a) and phosphorus content (b) in pepper root residue. P represents pepper residue; SP-P, MP-P, and MSP-P represent pepper residue in the mixtures. Different letters indicate significant differences based on Tukey’s HSD test (p < 0.05).
Agriculture 12 00084 g002
Figure 3. Effects of residue mixing on microbial community abundance in pepper root residue; bacterial community abundance (a); fungal community abundance (b); P represents pepper residue; SP-P, MP-P, and MSP-P represent pepper residue in the mixtures. Different letters indicate significant differences based on Tukey’s HSD test (p < 0.05).
Agriculture 12 00084 g003
Figure 4. Bacterial and fungal community α and β-diversity in pepper residue; bacterial community Shannon index (a), fungal community Shannon index (b). PCoA analysis of bacterial and fungal communities based on the Bray–Curtis, (cf) represent bacterial and fungal community composition at day 7 and day 56, respectively. P represents pepper residue; SP-P, MP-P, and MSP-P represent pepper residue in the mixtures; Different letters indicate significant differences based on Tukey’s HSD test (p < 0.05).
Agriculture 12 00084 g004
Figure 5. Effects of residue mixing on relative abundance of Zygomycota in pepper residue at day 7 and day 56, respectively. P represents pepper residue; SP-P, MP-P, and MSP-P represent pepper residue in the mixtures. Different letters indicate significant differences based on Tukey’s HSD test (p < 0.05).
Agriculture 12 00084 g005
Figure 6. Effects of different treatments on soil respiration (a), biomass (b), different residue and length of main root of pepper seedling (c). CK: soil without residues; P, S, and M represent pepper, soybean, and maize residue, respectively; SP, MP, and MSP represent mixtures of soybean and pepper; maize and pepper; and maize, soybean and pepper, respectively. Different letters indicate significant differences based on Tukey’s HSD test (p < 0.05).
Agriculture 12 00084 g006
Table 1. The initial contents of N, P, and Ca (g/kg) and the initial total phenolics (mg/kg) in residue samples.
ResiduesN (g/kg)P (g/kg)Ca (g/kg)Total Phenolics (mg/g)
Pepper26.97 ± 1.07a2.7 ± 0.11 a2.8 ± 0.00 a0.57 ± 0.06 a
Maize6.65 ± 0.6b2.89 ± 0.05 a1.4 ± 0.35 b0.36 ± 0.09 b
Soybean7.66 ± 0.13b1.57 ± 0.22 b2.8 ± 0.20 a0.19 ± 0.03 c
Note: Different letters indicate significant difference based on Tukey’s HSD test (p < 0.05).
Table 2. Relative abundances of main bacterial phylum in pepper root residues at 7 d and 56 d, respectively.
TaxonomyPSP-PMP-PMSP-P
7 dCyanobacteria53.67 ± 4.57 a39.61 ± 2.59 c46.73 ± 4.06 b50.38 ± 4.54 ab
WS624.69 ± 5.84 b39.22 ± 4.34 a32.40 ± 4.99 ab27.98 ± 7.29 b
Nitrospirae2.38 ± 0.83 a1.75 ± 0.43 a1.86 ± 0.34 a2.33 ± 0.74 a
Saccharibacteria1.11 ± 0.63 a0.79 ± 0.76 a0.80 ± 0.84 a0.79 ± 0.45 a
Chloroflexi1.24 ± 025 a1.99 ± 1.38 a1.50 ± 0.87 a1.48 ± 0.17 a
WWE30.77 ± 0.55 a0.40 ± 0.51 a0.37 ± 0.51 a0.32 ± 0.18 a
BRC10.53 ± 0.36 a0.12 ± 0.07 a0.41 ± 0.53 a0.41 ± 0.23 a
Latescibacteria0.41 ± 0.15 a0.29 ± 0.31 a0.24 ± 0.27 a0.37 ± 0.28 a
Deinococcus-Thermus0.17 ± 0.12 a0.12 ± 0.03 a0.17 ± 0.18 a0.16 ± 0.07 a
56 dCyanobacteria50.92 ± 2.87 ab40.02 ± 4.52 c52.65 ± 2.29 a45.46 ± 6.49 bc
WS621.98 ± 4.24 b33.41 ± 6.83 a22.64 ± 3.89 b28.25 ± 6.95 ab
Nitrospirae4.32 ± 1.59 a2.98 ± 1.68 a2.80 ± 0.36 a3.50 ± 1.41 a
Saccharibacteria2.88 ± 0.41 a2.27 ± 1.07 a1.80 ± 0.46 a2.34 ± 0.99 a
Chloroflexi2.14 ± 0.20 a1.73 ± 0.51 a2.04 ± 0.66 a1.89 ± 0.61 a
WWE31.17 ± 0.54 a0.90 ± 0.72 a0.71 ± 0.43 a0.94 ± 0.74 a
BRC10.85 ± 0.22 a0.56 ± 0.48 a0.63 ± 0.37 a0.66 ± 0.27 a
Latescibacteria0.92 ± 0.36 a0.62 ± 0.51 a0.60 ± 0.30 a0.64 ± 0.30 a
Deinococcus-Thermus1.22 ± 0.24 a0.62 ± 0.12 a0.62 ± 0.29 a0.71 ± 0.21 a
Note: Values represent percentages of each phylum in the total bacterial sequences among different treatments. P represents pepper residue; SP-P, MP-P, and MSP-P represent pepper residue in the mixtures. Data parameters are shown as means ±1 SE. Different lowercase letters indicate significant differences based on Tukey’s HSD test (p < 0.05).
Publisher’s Note: MDPI stays neutral with regard to jurisdictional claims in published maps and institutional affiliations.

