
Assessing the Long-Term Impact of Traditional Agriculture and the Mid-Term Impact of Intensification in Face of Local Climatic Changes

 ,
,  , , ,
, , ,  and
and
Abstract
1. Introduction
2. Materials and Methods
2.1. Study Area
2.2. Soil Data
2.3. Climatic Data
- 1981/2010 (Table 2) and 1991/2020 (Table 3) was calculated from monthly data (ranging from 1969 to 2020) gathered in the meteorological station of the study area. The evapotranspiration (ET0) was determined with the unadjusted Hargreaves equation (Equation (3)). The Portuguese Institute of the Sea and the Atmosphere (IPMA) provided the radiation (Ra) values. The homogeneity of the data is guaranteed as logistics in climatic observations remained constant.
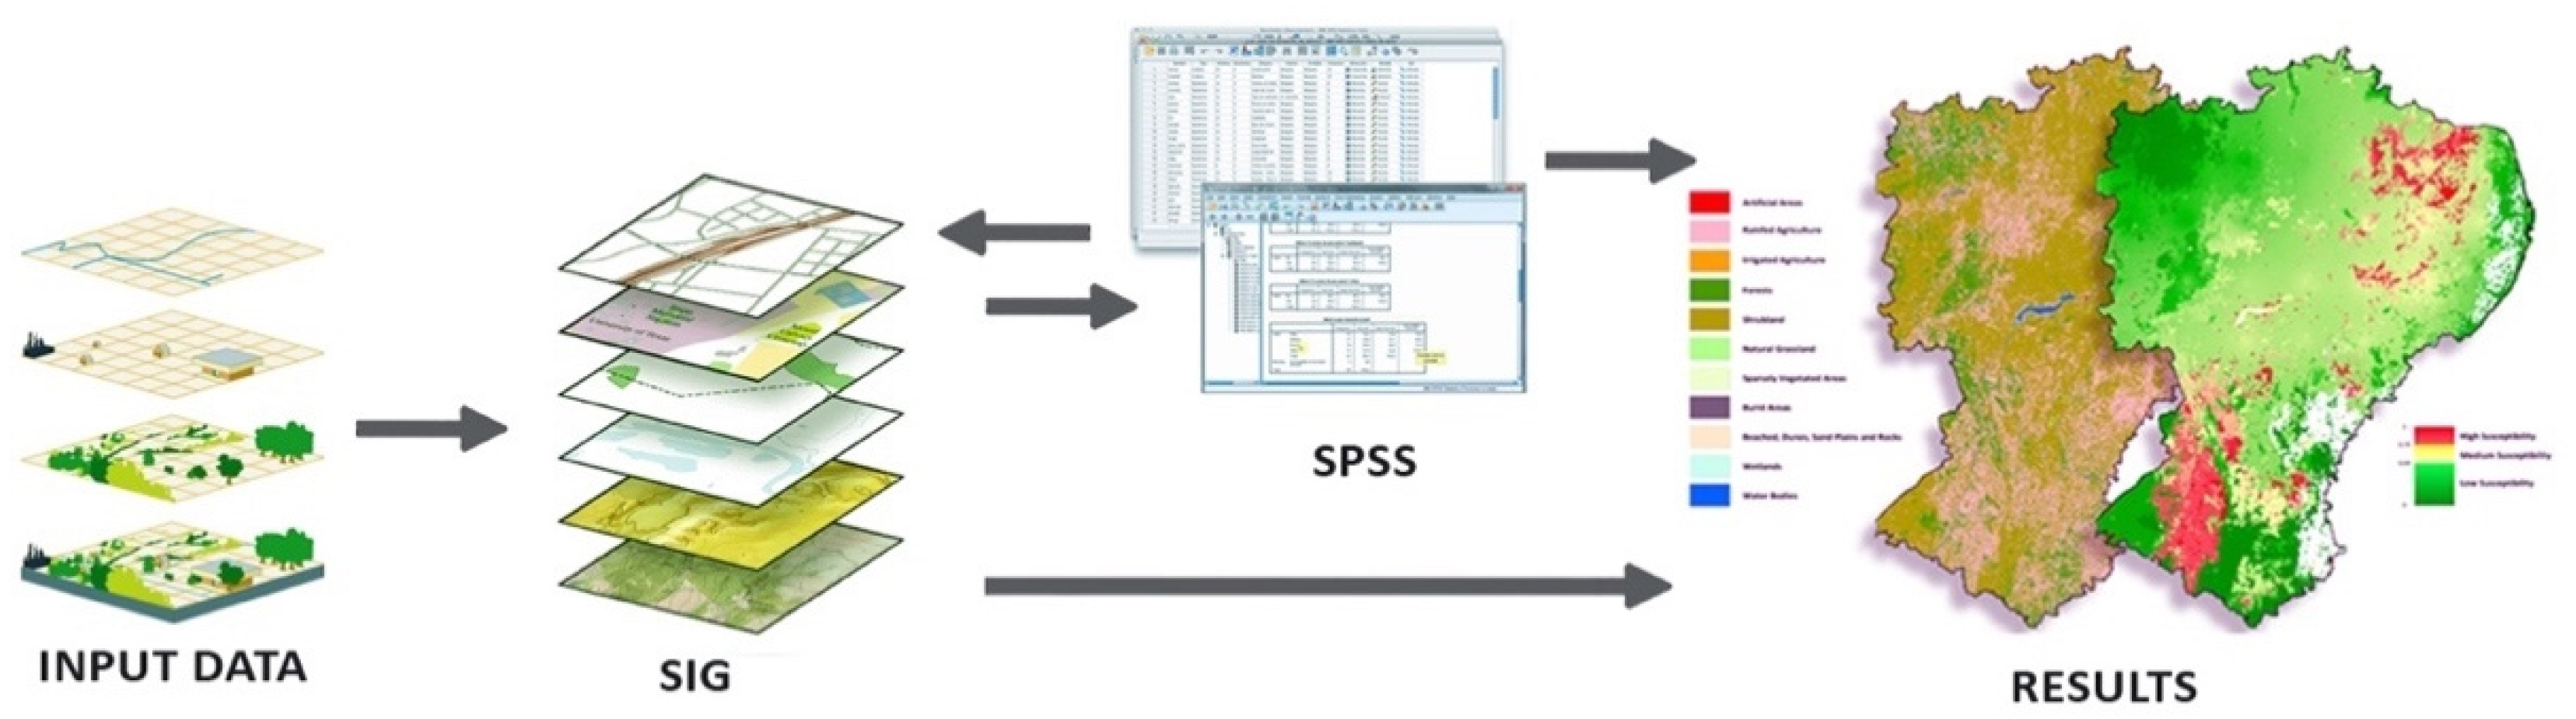
2.4. CROSS
2.5. Analytical Methods
2.6. Statistical Analysis
3. Results
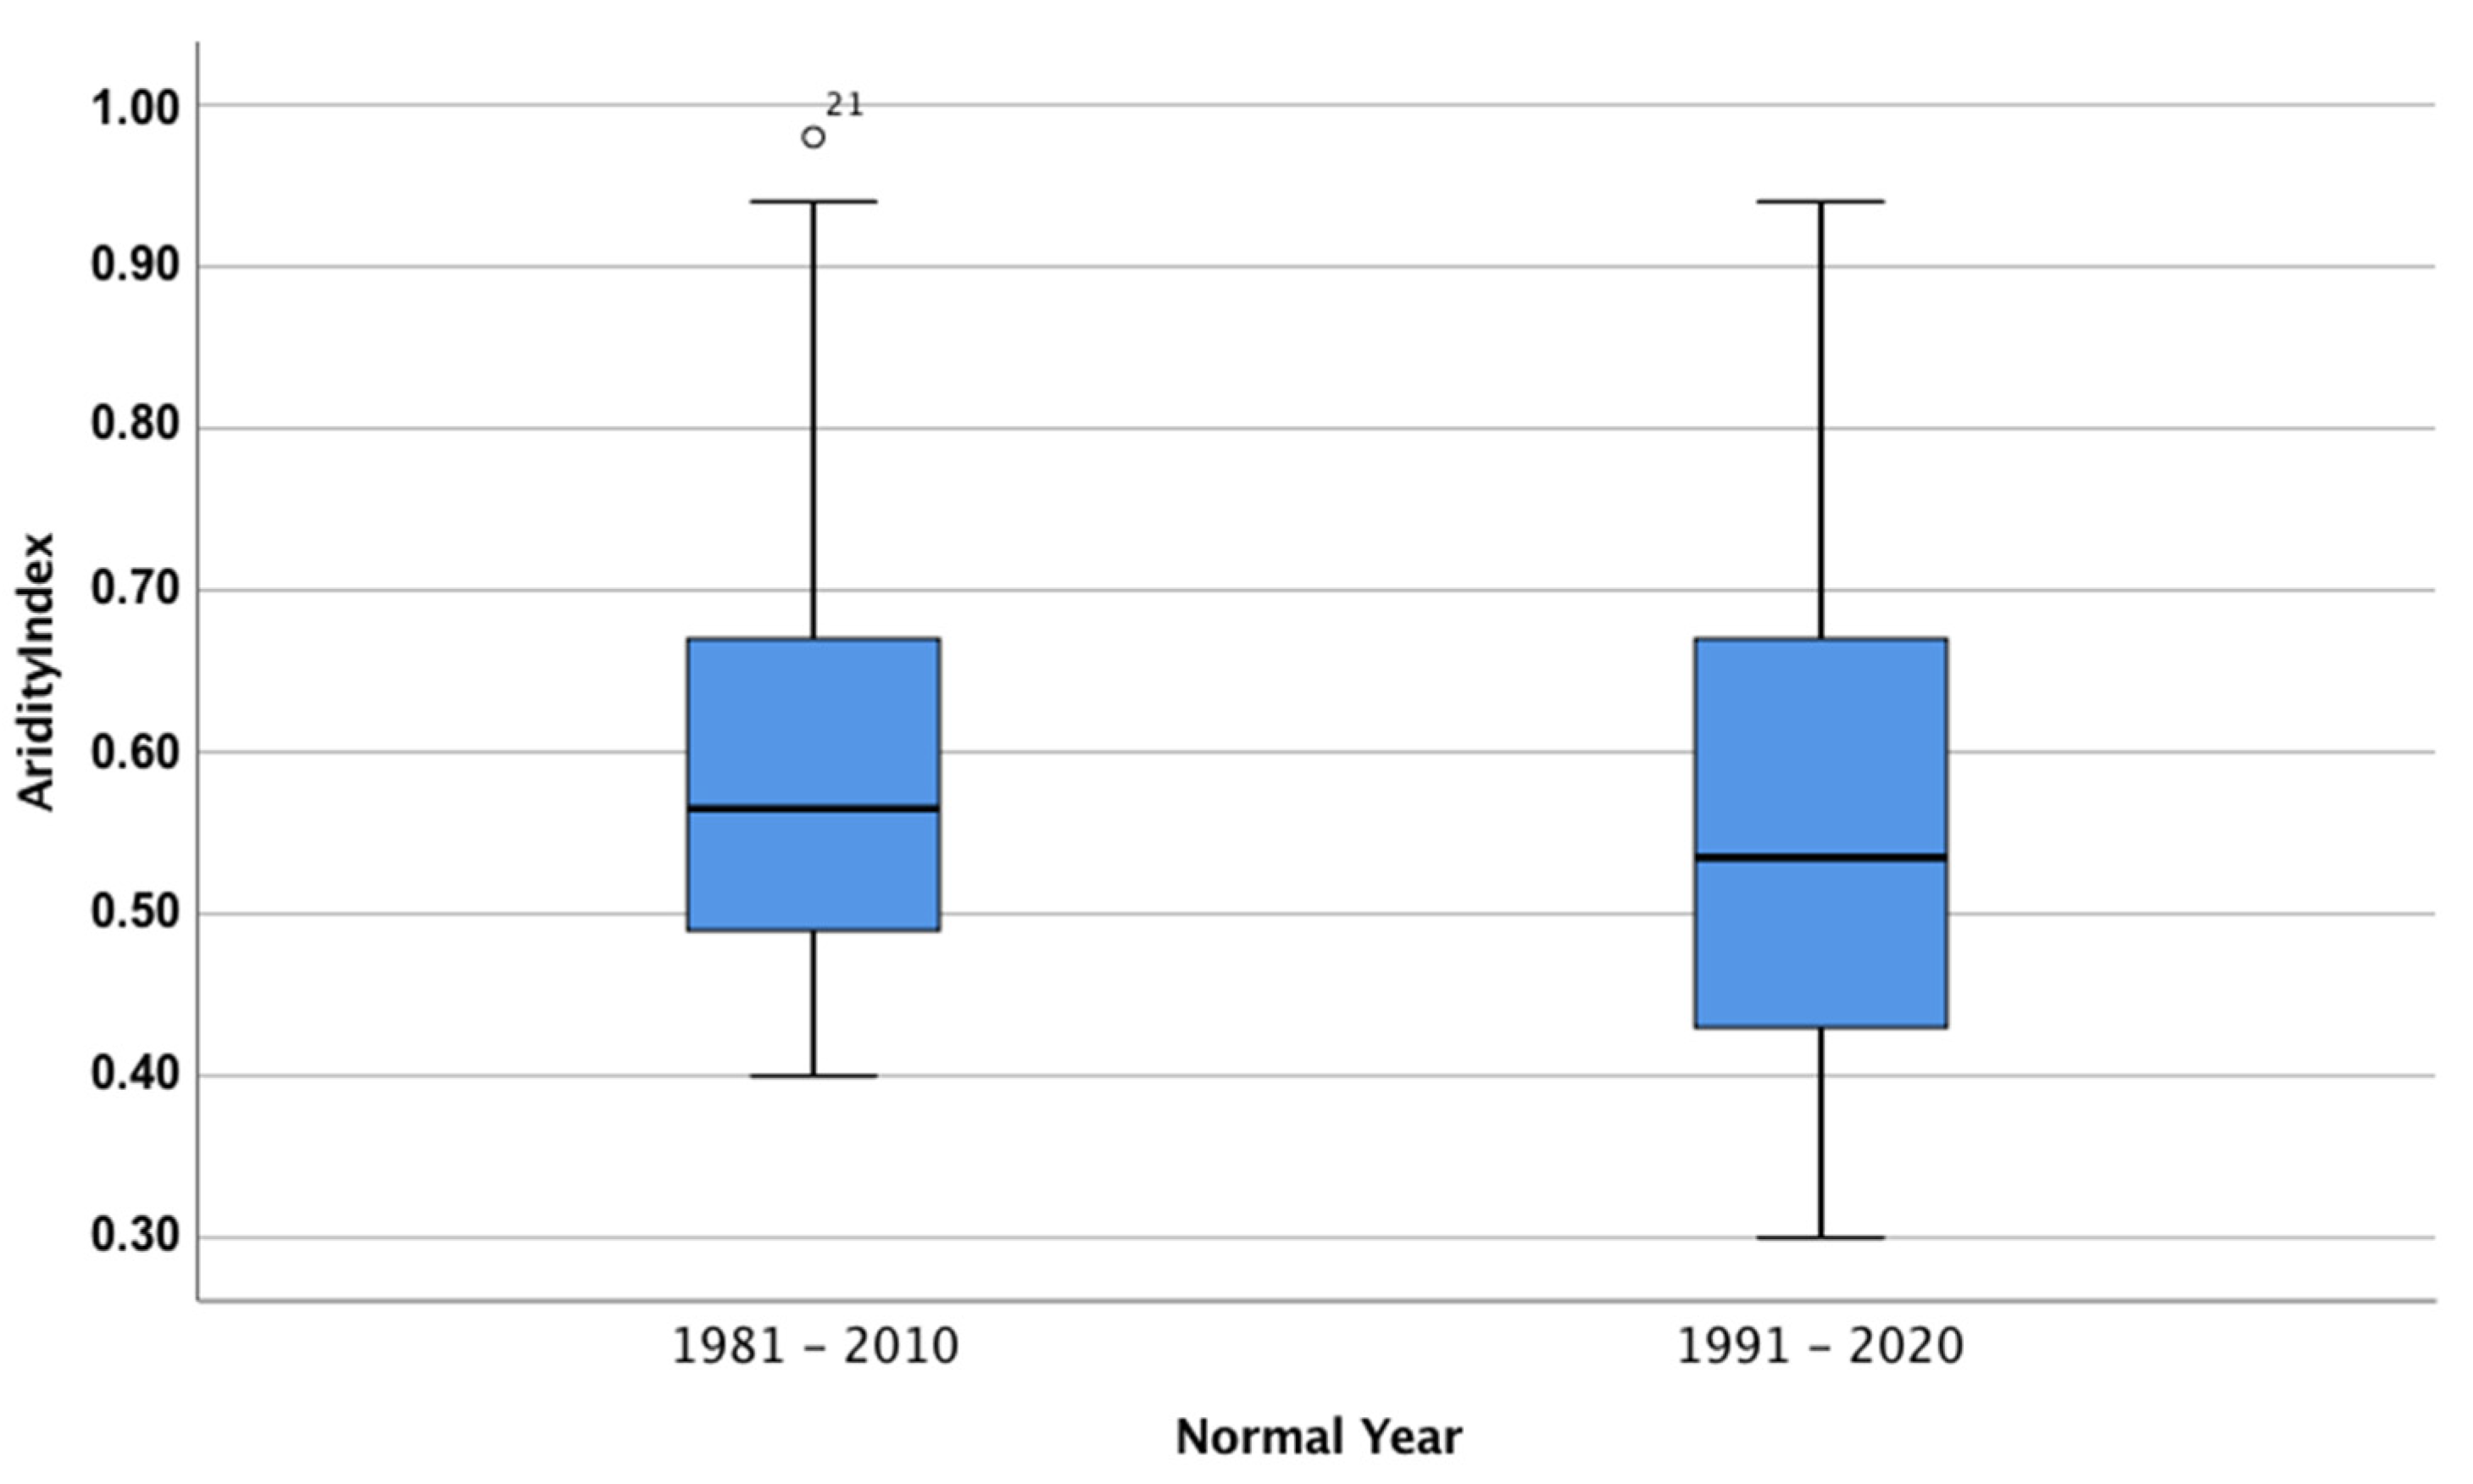
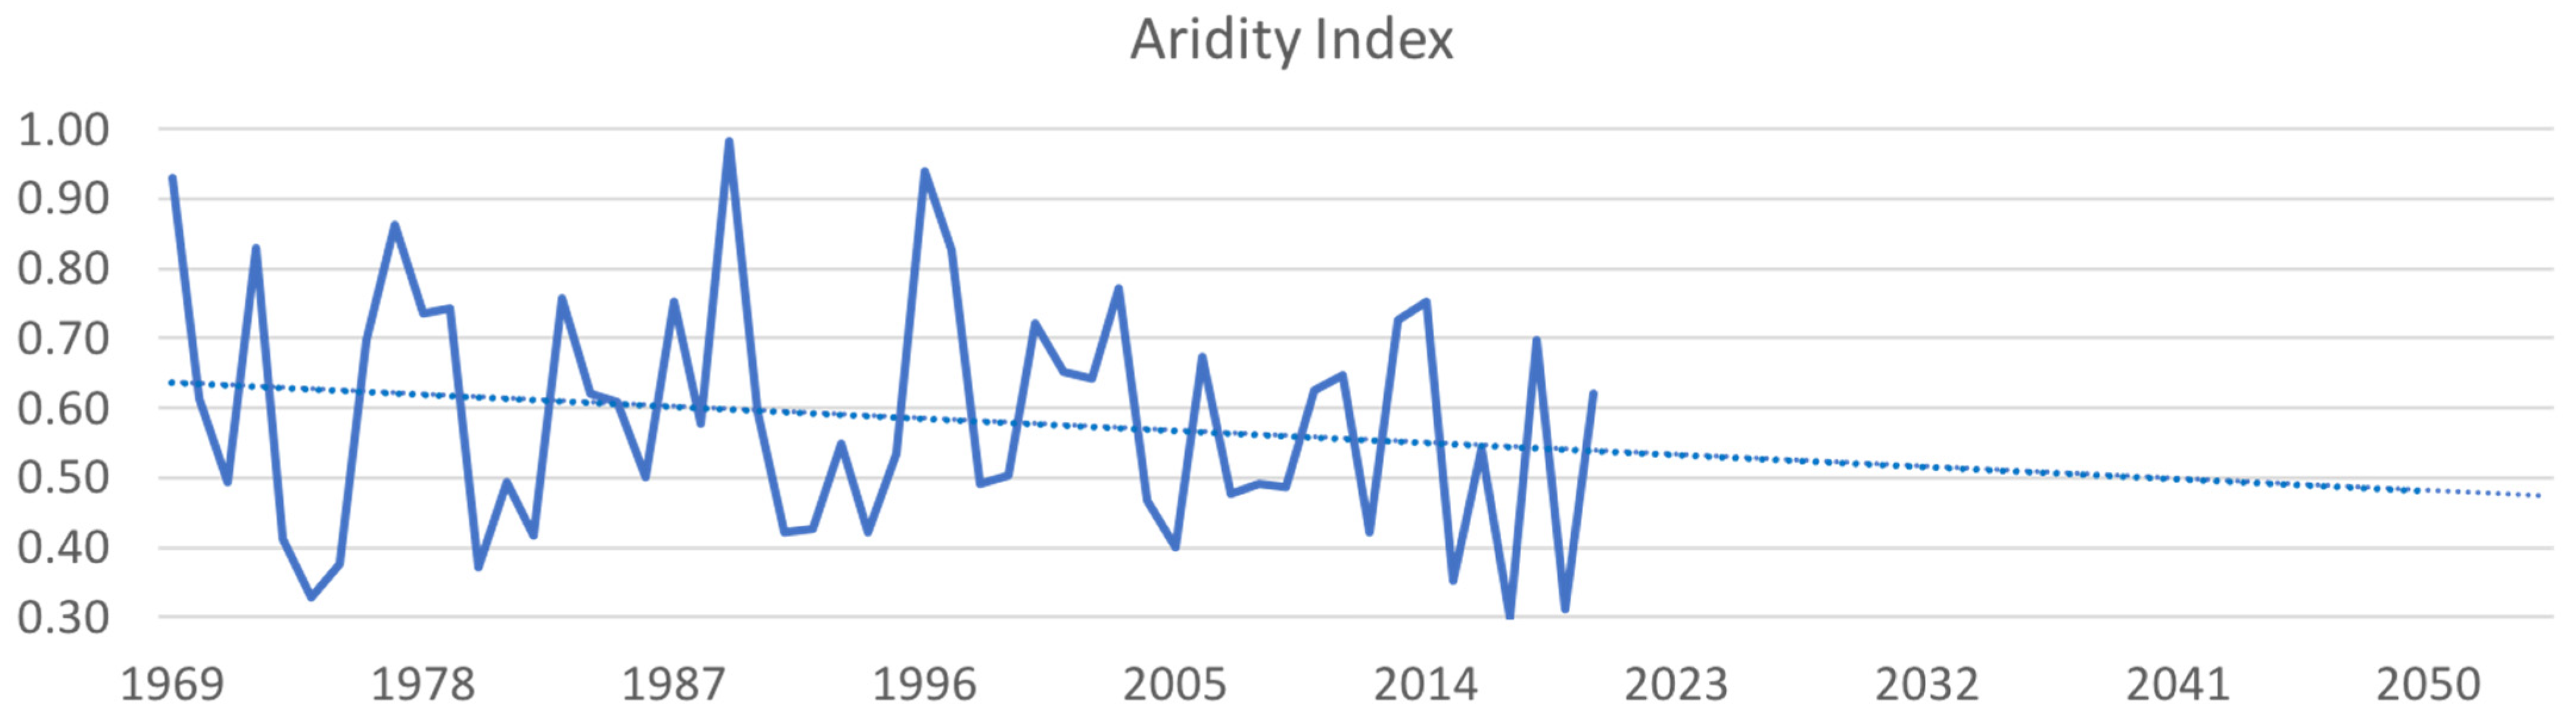
3.1. Climate
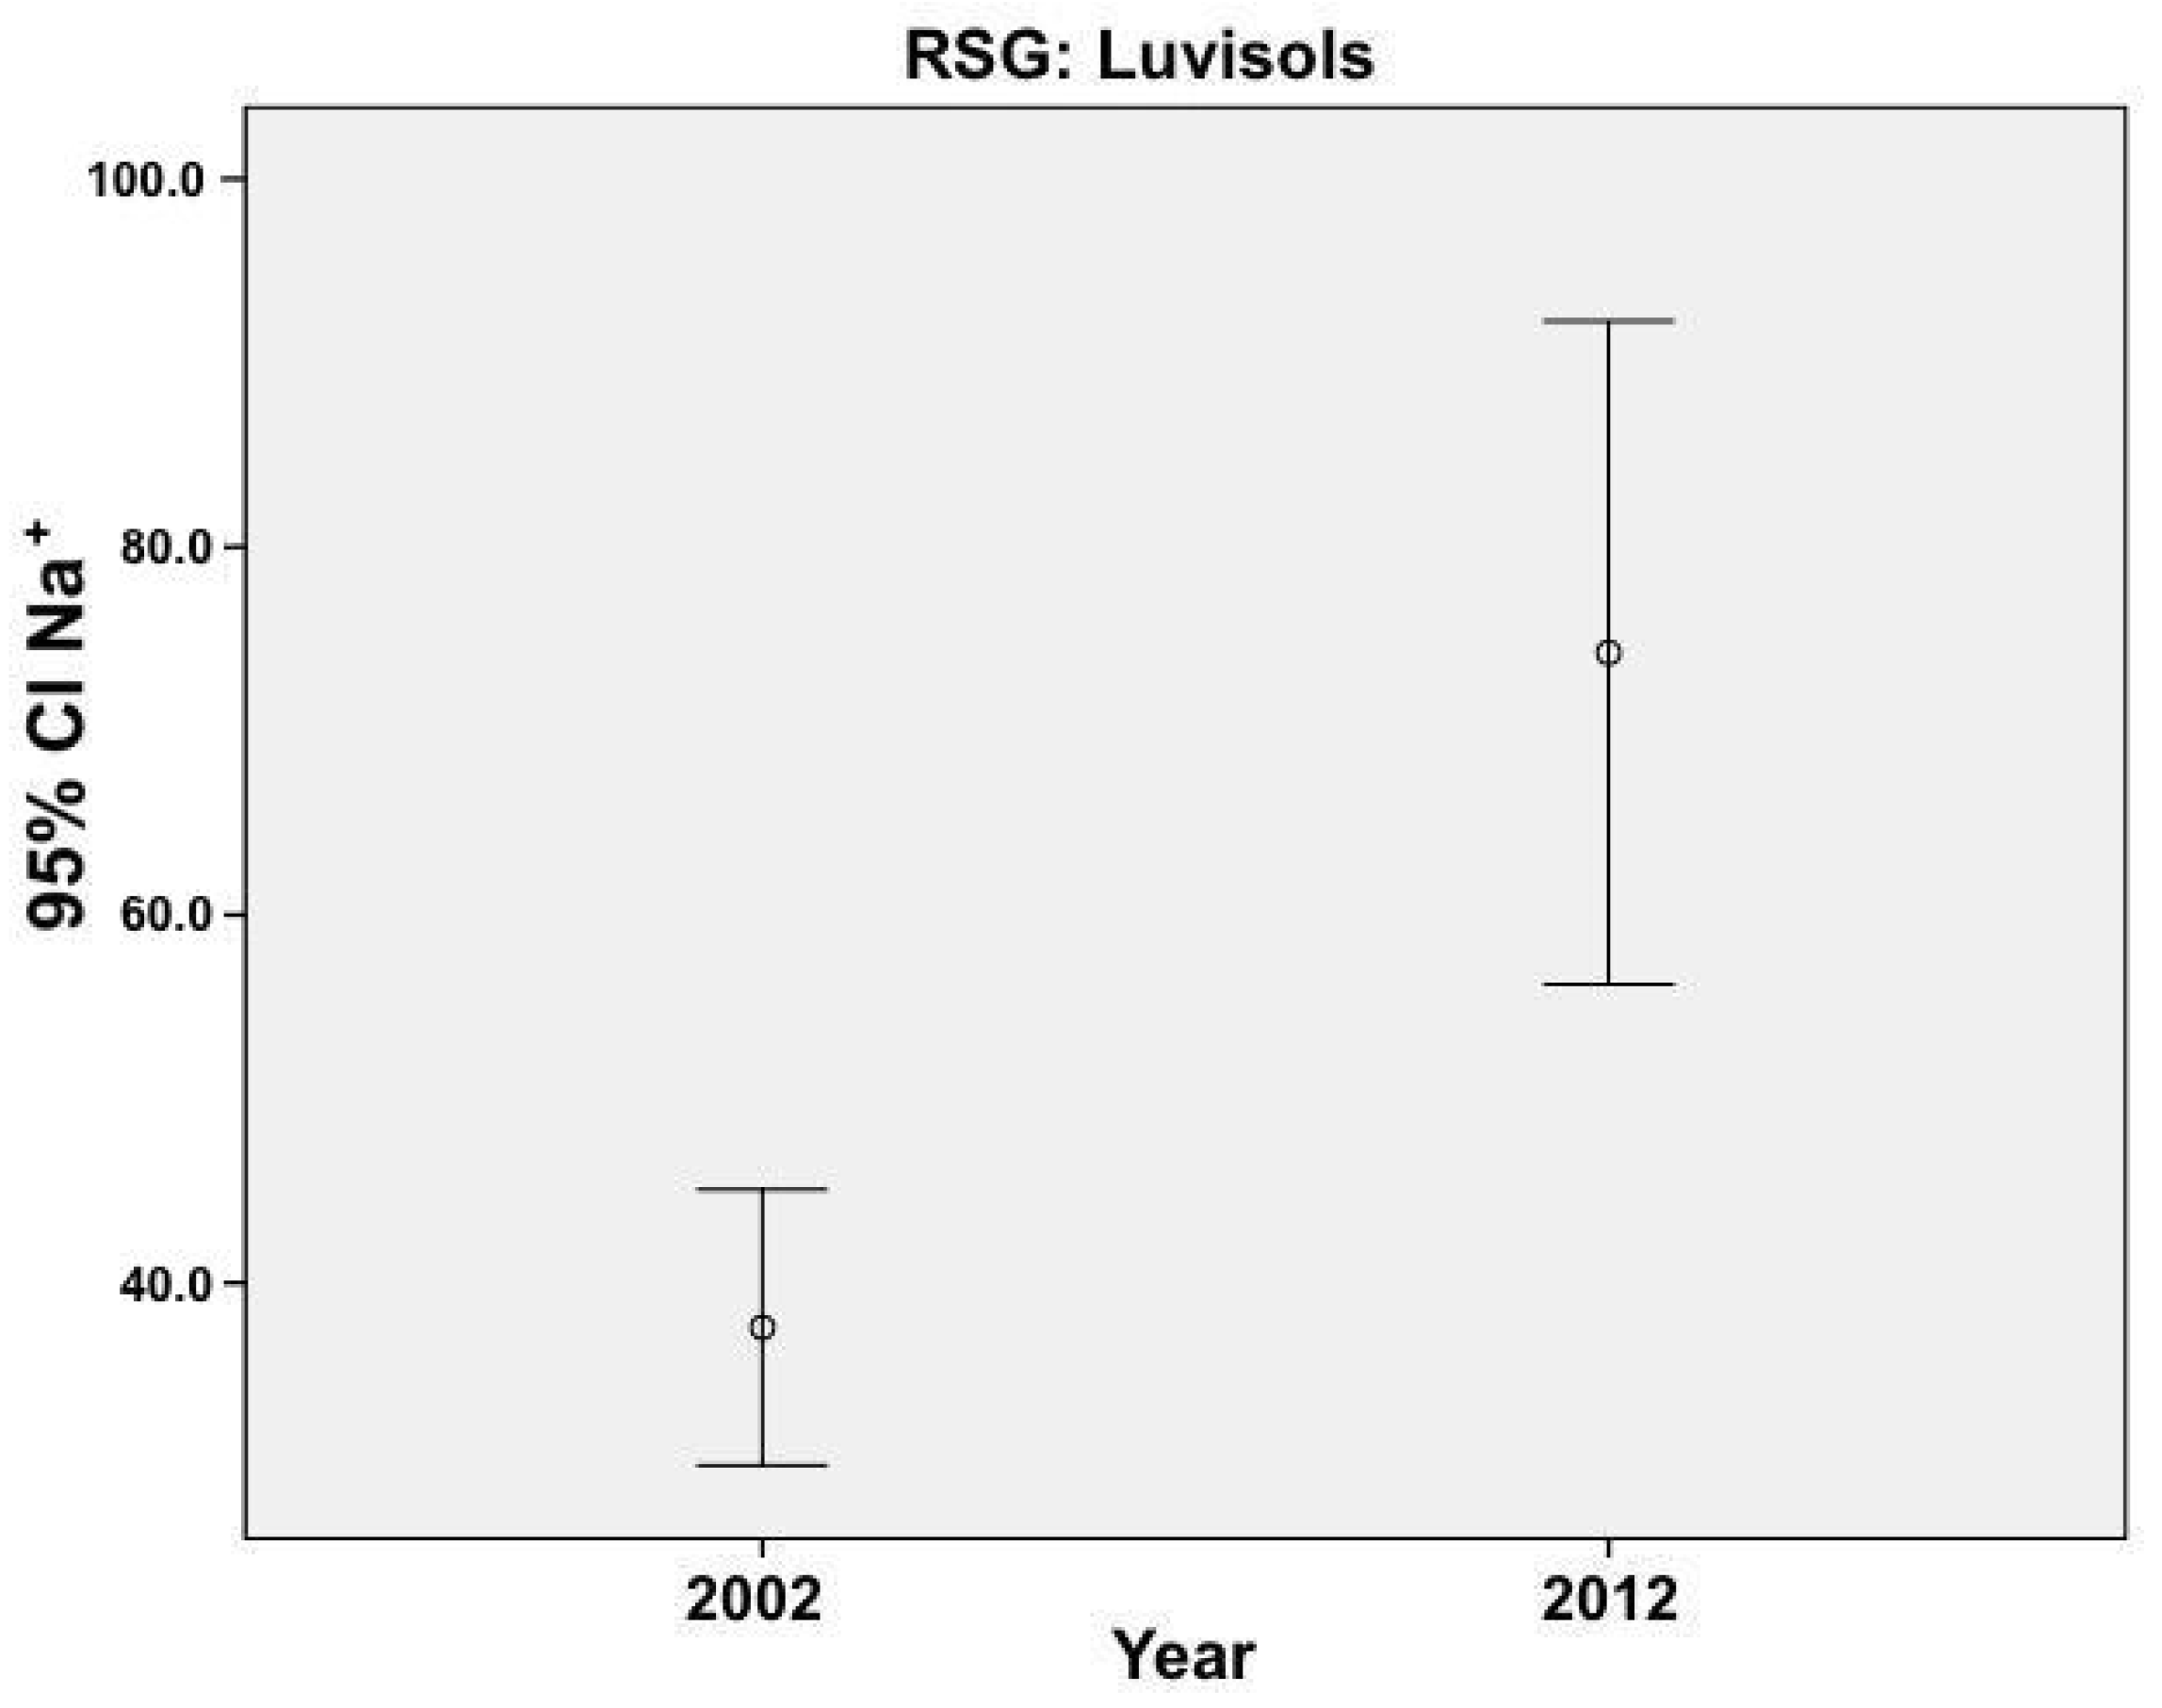
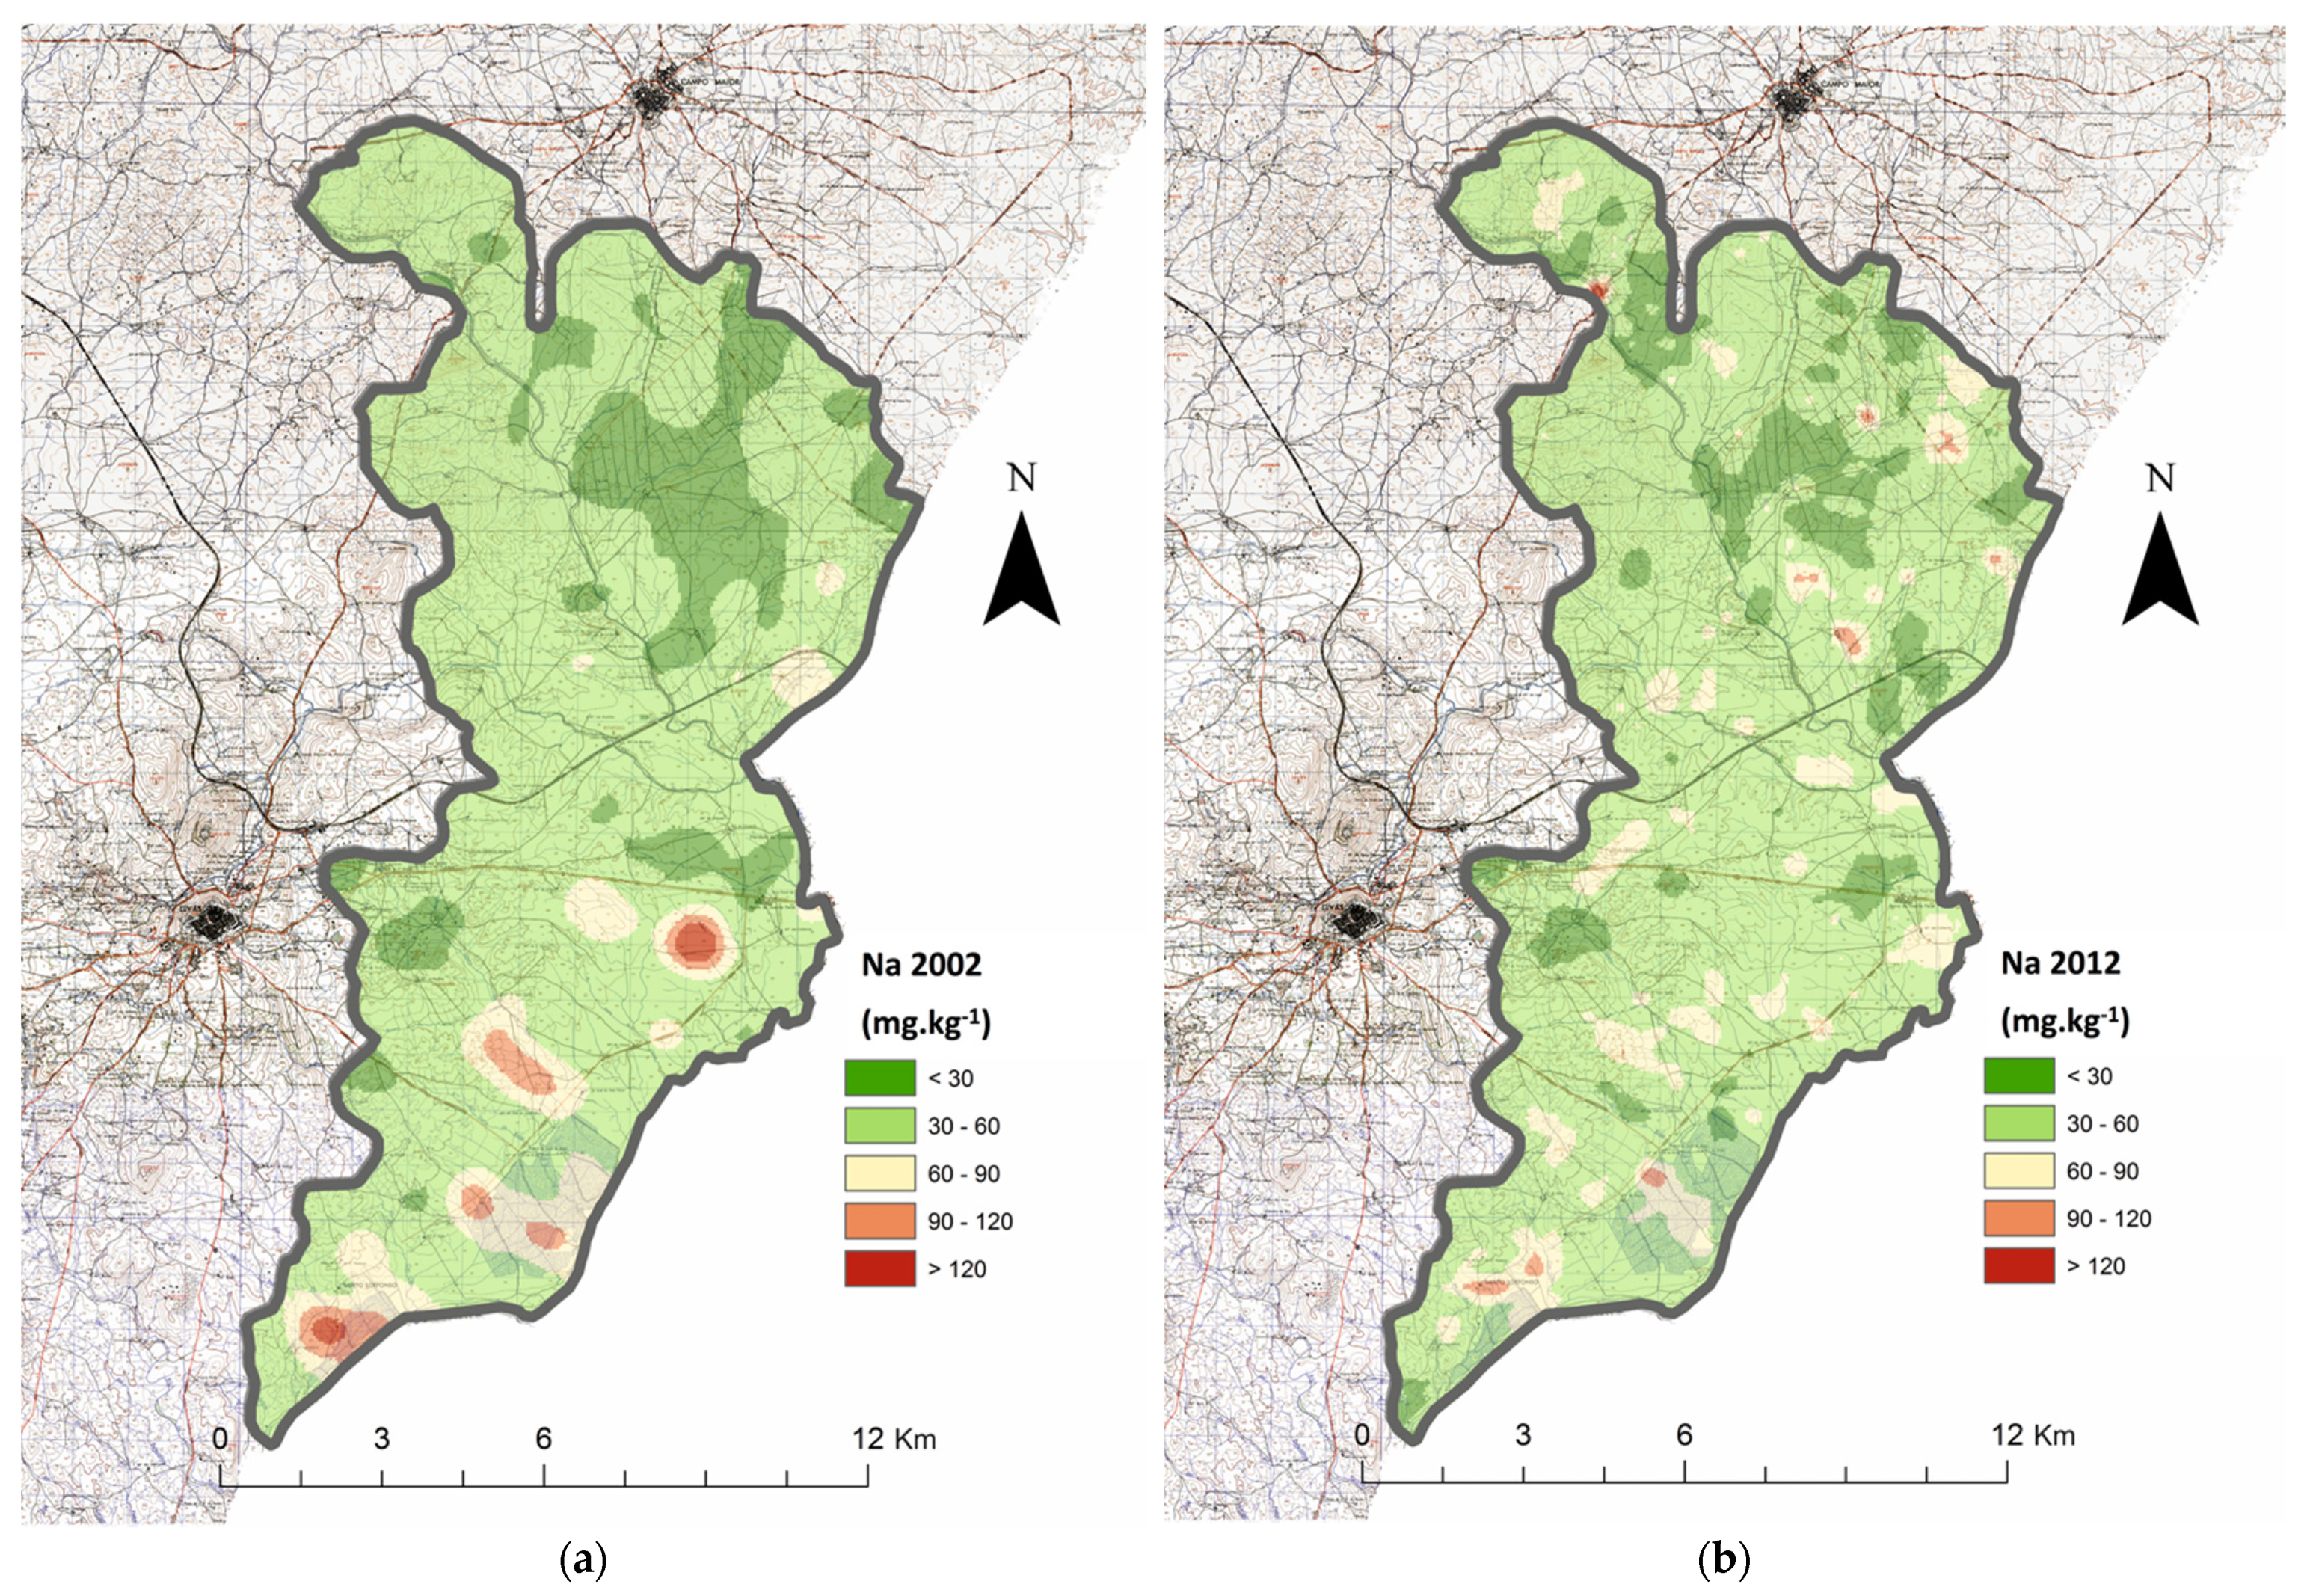
3.2. Irrigated Soils
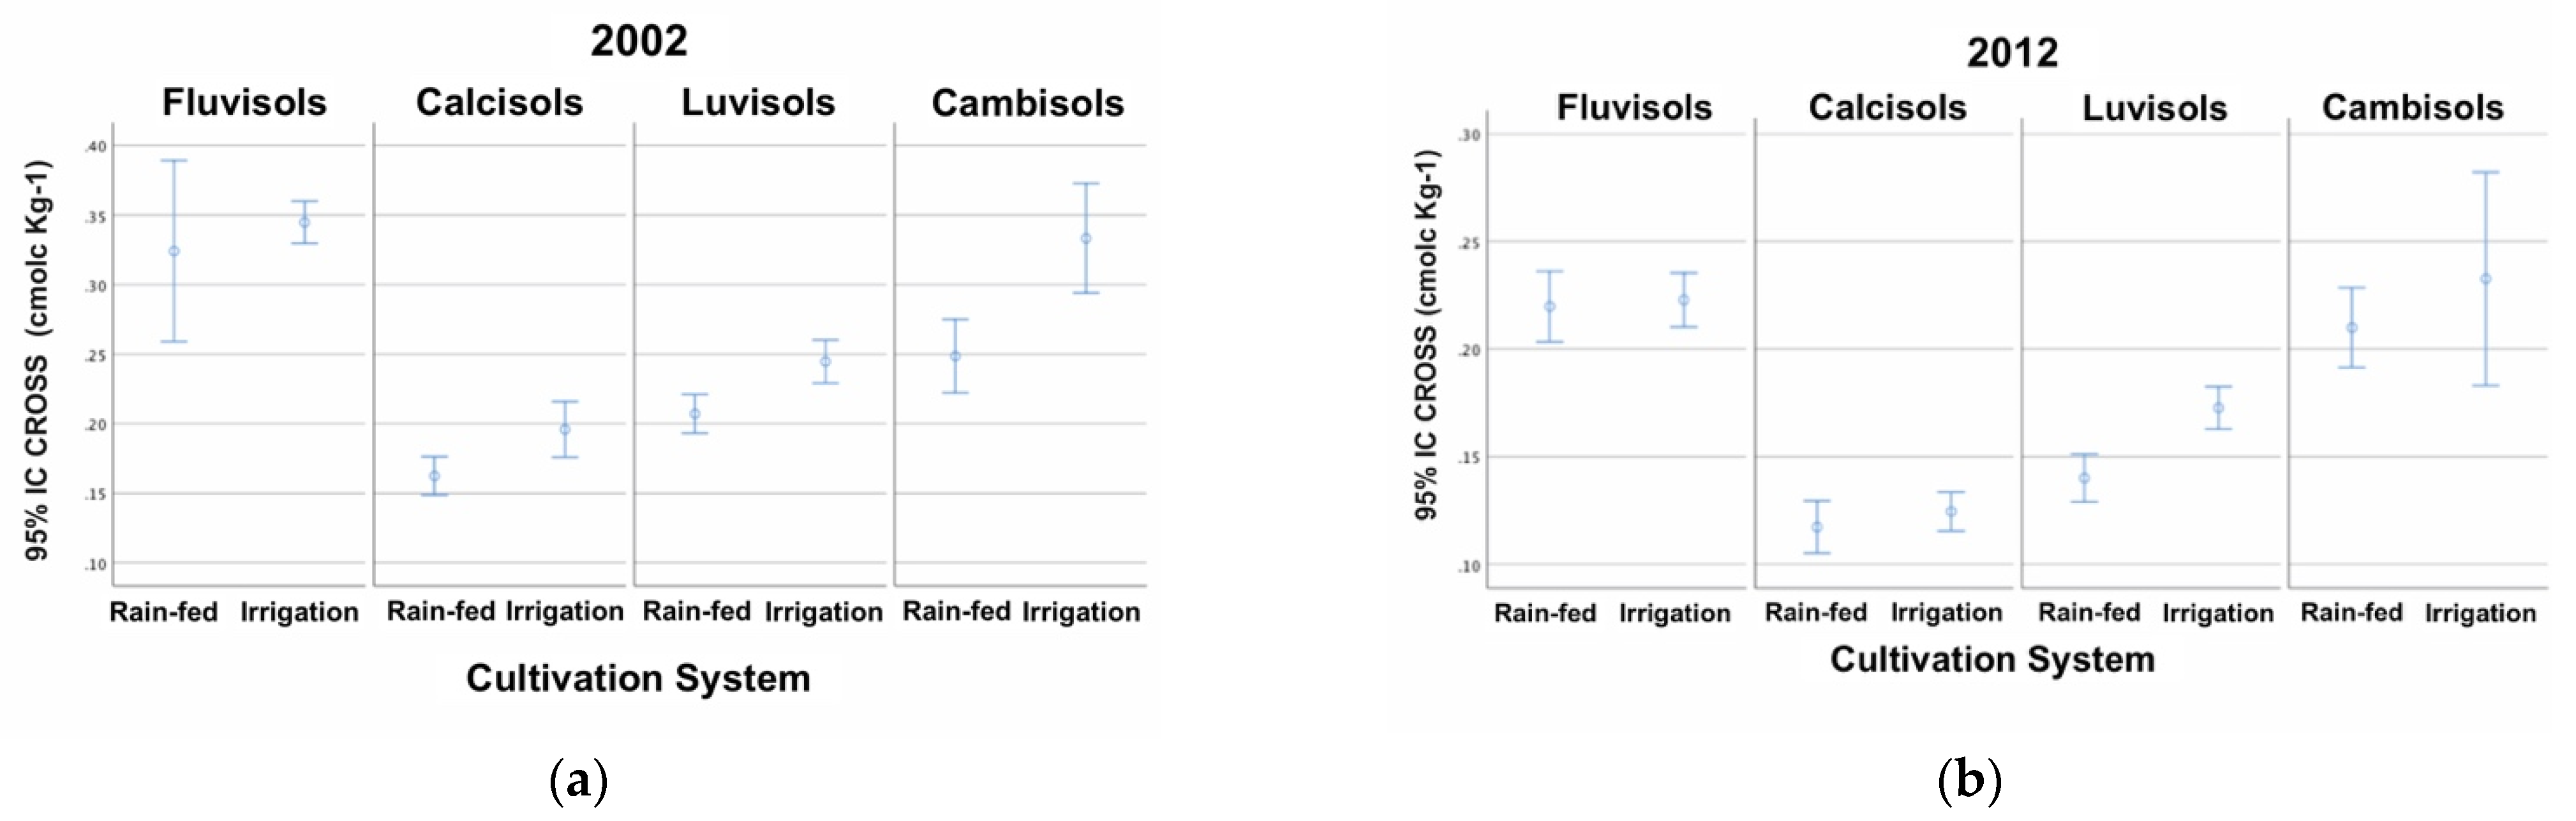
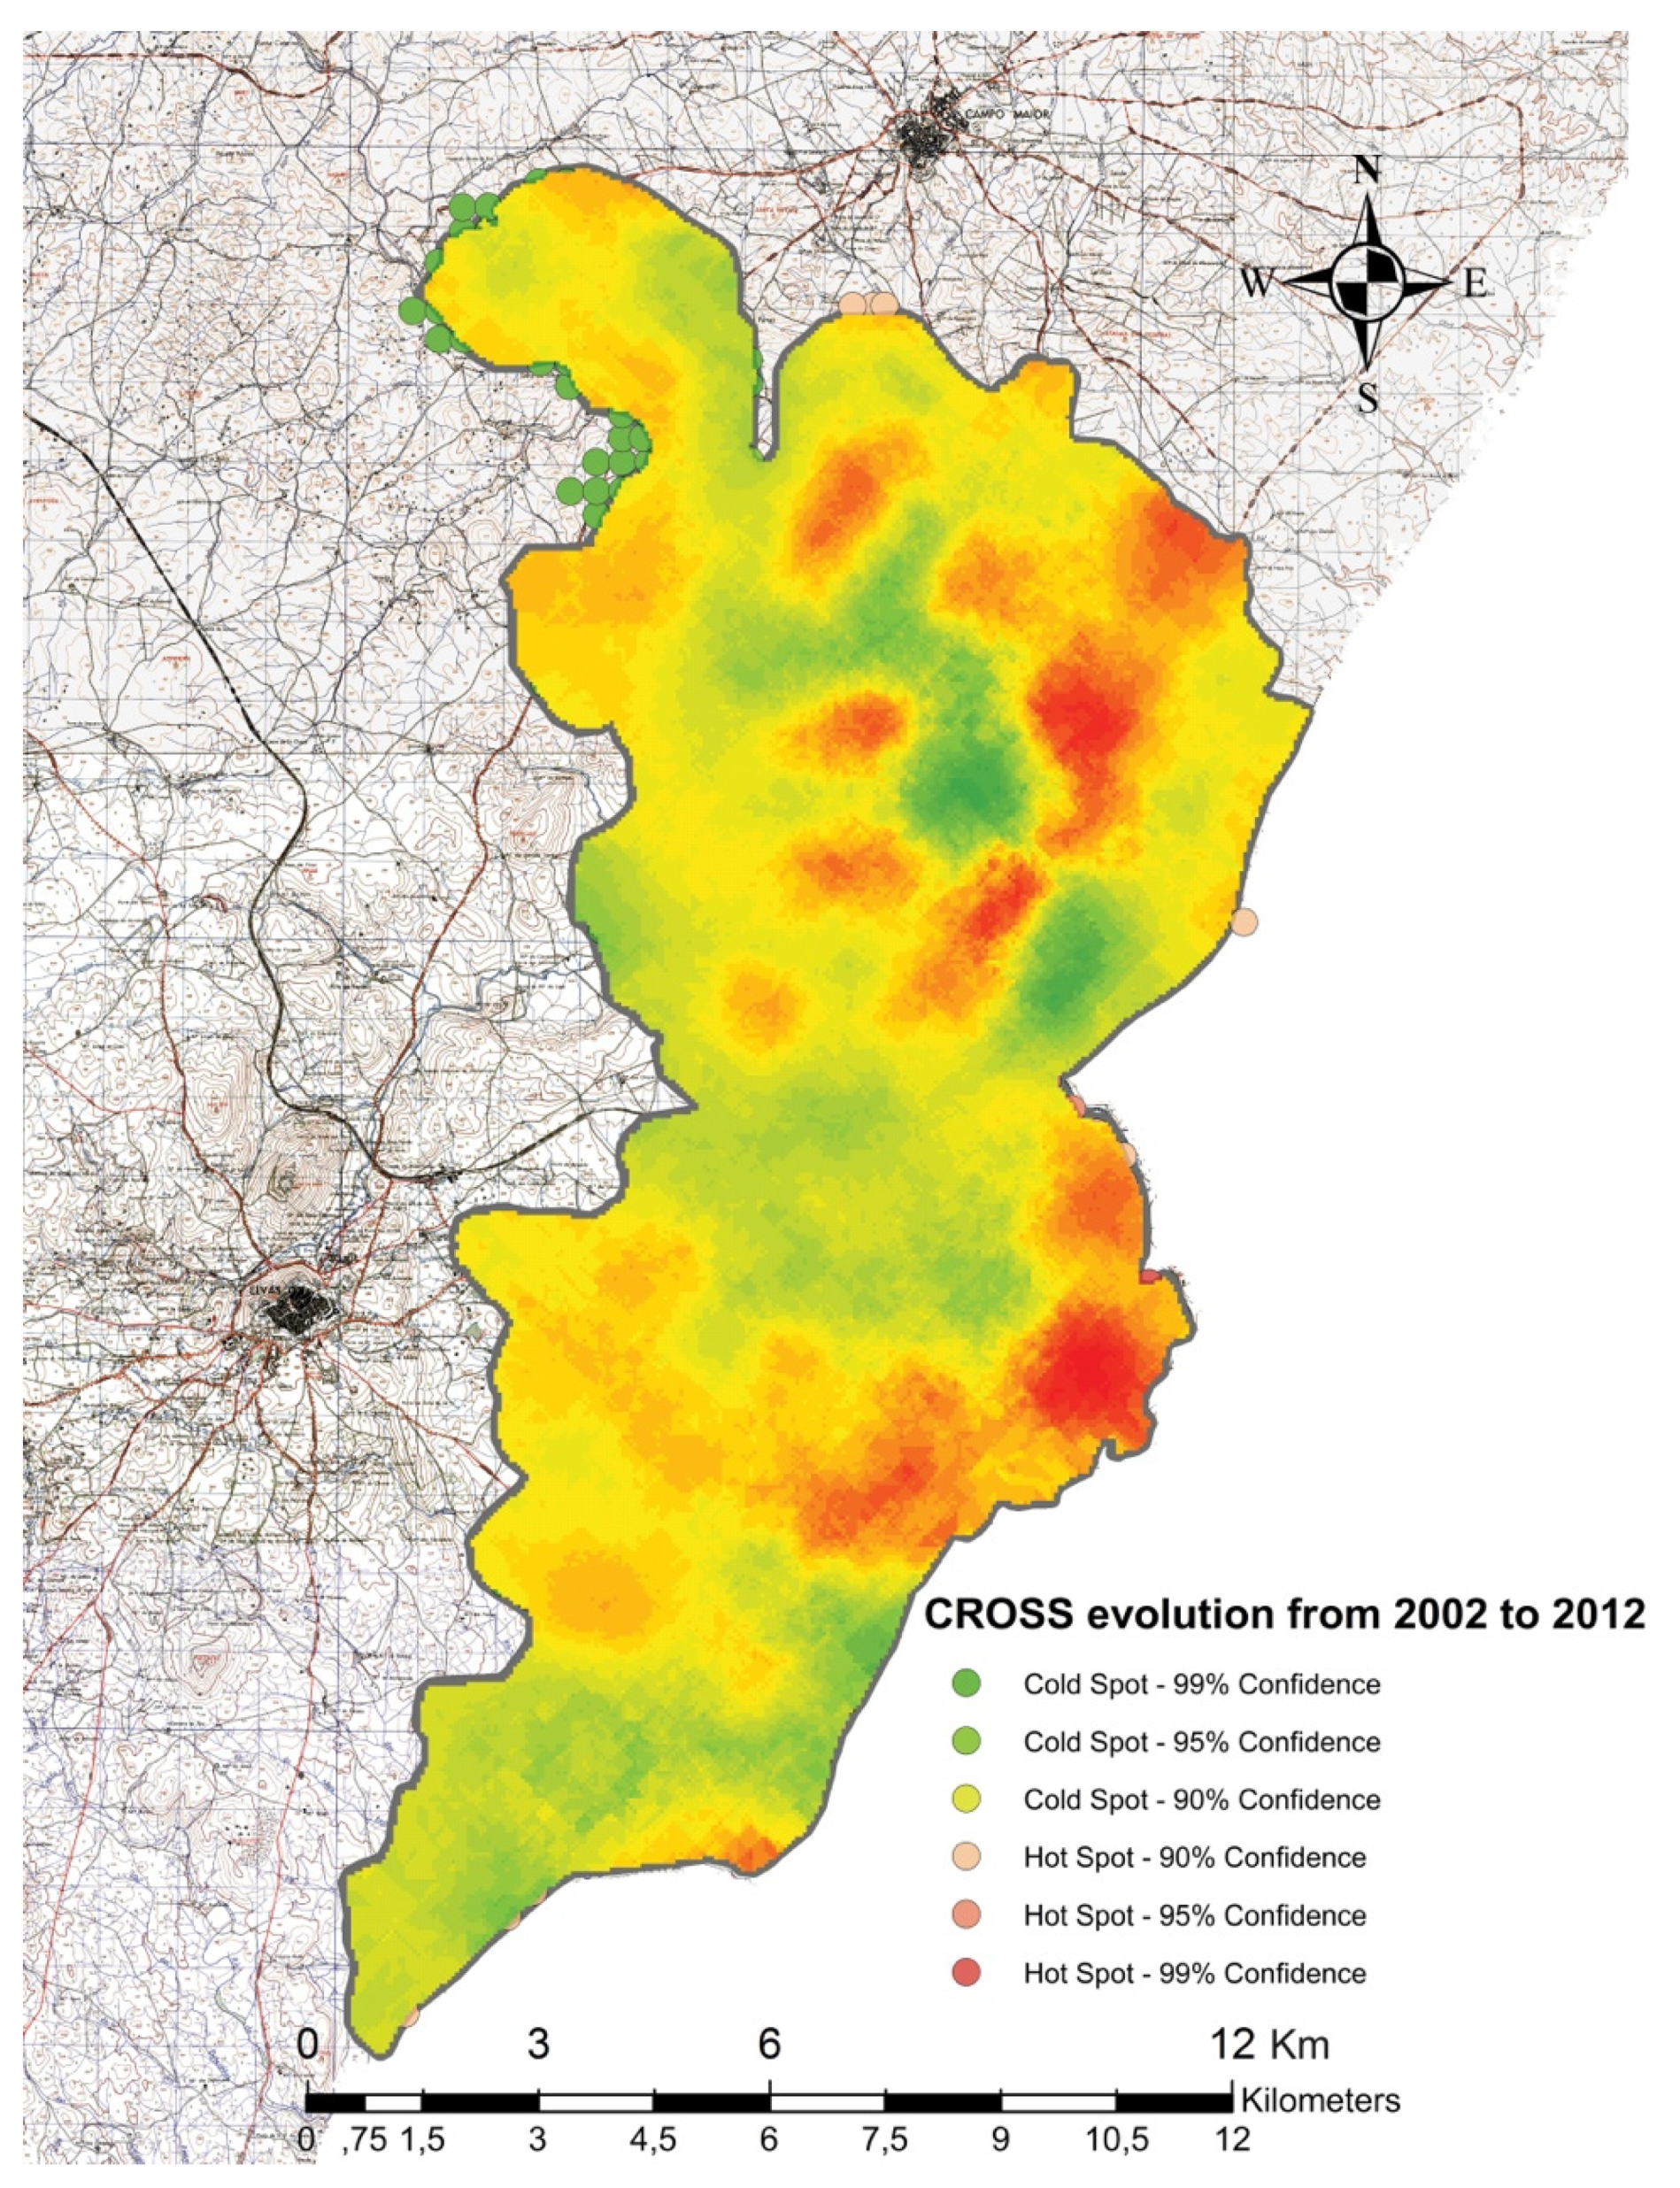
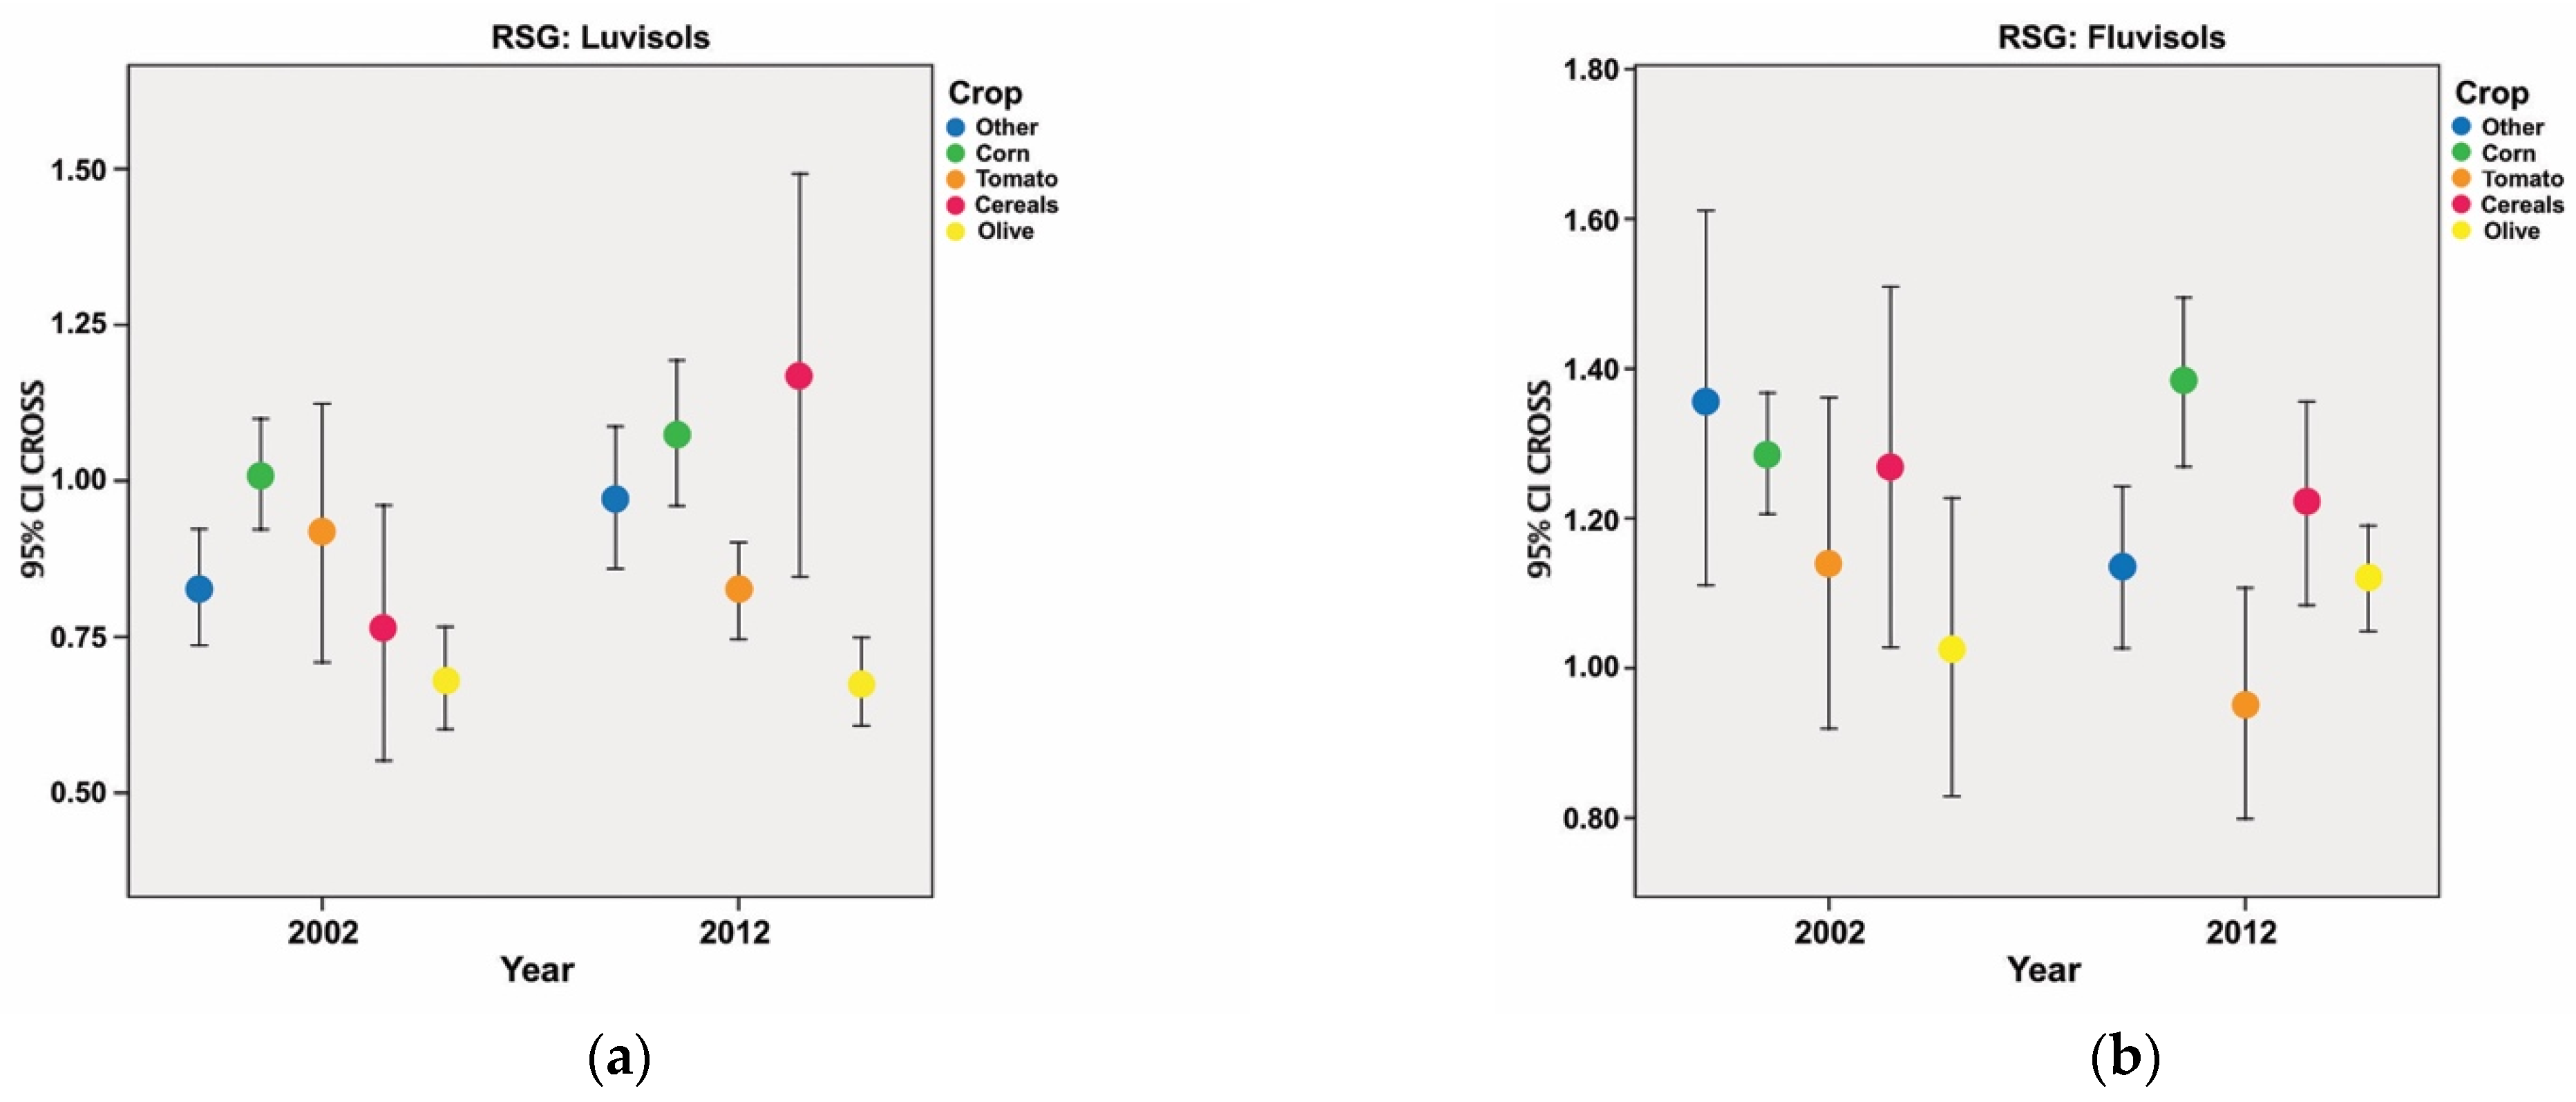
3.3. CROSS
3.4. Rain-Fed
4. Discussion
5. Conclusions
Author Contributions
Funding
Acknowledgments
Conflicts of Interest
References
- Khatteli, H.; Ali, R.R.; Bergametti, G.; Bouet, C.; Hachicha, M.; Hamdi-Aissa, B.; Labiadh, M.; Montoroi, J.-P.; Podwojewski, P.; Rajot, J.-L.; et al. Soils and desertification in the Mediterranean region. In The Mediterranean Region under Climate Change: A Scientific Update; IRD Editions: Marseille, France, 2016; pp. 617–625. [Google Scholar]
- Evrendilek, F.; Celik, I.; Kilic, S. Changes in soil organic carbon and other physical soil properties along adjacent Mediterranean forest, grassland, and cropland ecosystems in Turkey. J. Arid Environ. 2004, 59, 743–752. [Google Scholar] [CrossRef]
- López-Piñeiro, A.; Murillo, S.; Barreto, C.; Muñoz, A.; Rato, J.M.; Albarrán, A.; García, A. Changes in organic matter and residual effect of amendment with two-phase olive-mill waste on degraded agricultural soils. Sci. Total Environ. 2007, 378, 84–89. [Google Scholar] [CrossRef] [PubMed]
- Francaviglia, R.; Ledda, L.; Farina, R. Organic Carbon and Ecosystem Services in Agricultural Soils of the Mediterranean Basin. In Sustainable Agriculture Reviews 28; Gaba, S., Smith, B., Lichtfouse, E., Eds.; Springer International Publishing: Cham, Switzerland, 2018; Volume 28, pp. 183–210. ISBN 978-3-319-90308-8. [Google Scholar]
- Telo da Gama, J.; Nunes, J.R.; Loures, L.; Piñeiro, A.L.; Vivas, P. Assessing Spatial and Temporal Variability for Some Edaphic Characteristics of Mediterranean Rainfed and Irrigated Soils. Agronomy 2019, 9, 132. [Google Scholar] [CrossRef]
- Paranychianakis, N.V.; Chartzoulakis, K.S. Irrigation of Mediterranean crops with saline water: From physiology to management practices. Agric. Ecosyst. Environ. 2005, 106, 171–187. [Google Scholar] [CrossRef]
- Paz, J.M.; Visconti, F.; Zapata, R.; Sánchez, J. Integration of two simple models in a geographical information system to evaluate salinization risk in irrigated land of the Valencian Community, Spain. Soil Use Manag. 2006, 20, 333–342. [Google Scholar] [CrossRef]
- Kawy, W.A.M.A.; Ali, R.R. Assessment of soil degradation and resilience at northeast Nile Delta, Egypt: The impact on soil productivity. Egypt. J. Remote Sens. Space Sci. 2012, 15, 19–30. [Google Scholar] [CrossRef][Green Version]
- Chhabra, R. Soil Salinity and Water Quality; Routledge: London, UK, 2017; ISBN 1-351-41570-0. [Google Scholar]
- Geeson, N.; Brandt, C.J.; Thornes, J.B. (Eds.) Mediterranean Desertification: A Mosaic of Processes and Responses; John Wiley & Sons: Chichester, West Sussex, UK; Hoboken, NJ, USA, 2002; ISBN 978-0-470-84448-9. [Google Scholar]
- Molinari, P. A geographic information system (GIS) with integrated models: A new approach for assessing the vulnerability and risk of desertification in Sardinia (Italy). Glob. Bioeth. 2014, 25, 27–41. [Google Scholar] [CrossRef]
- Szabolcs, I. Chapter 6 Impact of Climatic Change on Soil Attributes. In Developments in Soil Science; Elsevier: Amsterdam, The Netherlands, 1990; Volume 20, pp. 61–69. ISBN 978-0-444-88838-9. [Google Scholar]
- Lavee, H.; Imeson, A.C.; Sarah, P. The impact of climate change on geomorphology and desertification along a mediterranean-arid transect. Land Degrad. Dev. 1998, 9, 407–422. [Google Scholar] [CrossRef]
- Farifteh, J.; Farshad, A.; George, R.J. Assessing salt-affected soils using remote sensing, solute modelling, and geophysics. Geoderma 2006, 130, 191–206. [Google Scholar] [CrossRef]
- Stagnari, F.; Maggio, A.; Galieni, A.; Pisante, M. Multiple benefits of legumes for agriculture sustainability: An overview. Chem. Biol. Technol. Agric. 2017, 4, 2. [Google Scholar] [CrossRef]
- Pagnani, G.; Pellegrini, M.; Galieni, A.; D’Egidio, S.; Matteucci, F.; Ricci, A.; Stagnari, F.; Sergi, M.; Lo Sterzo, C.; Pisante, M.; et al. Plant growth-promoting rhizobacteria (PGPR) in Cannabis sativa ‘Finola’ cultivation: An alternative fertilization strategy to improve plant growth and quality characteristics. Ind. Crops Prod. 2018, 123, 75–83. [Google Scholar] [CrossRef]
- Farooq, M.; Rehman, A.; Pisante, M. Sustainable Agriculture and Food Security. In Innovations in Sustainable Agriculture; Farooq, M., Pisante, M., Eds.; Springer International Publishing: Cham, Switzerland, 2019; pp. 3–24. ISBN 978-3-030-23168-2. [Google Scholar]
- Badia, D. Straw Management Effects on Organic Matter Mineralization and Salinity in Semiarid Agricultural Soils. Arid Soil Res. Rehabil. 2000, 14, 193–203. [Google Scholar] [CrossRef]
- Calvo-Polanco, M.; Sánchez-Romera, B.; Aroca, R. Mild Salt Stress Conditions Induce Different Responses in Root Hydraulic Conductivity of Phaseolus vulgaris Over-Time. PLoS ONE 2014, 9, e90631. [Google Scholar] [CrossRef]
- Shrivastava, P.; Kumar, R. Soil salinity: A serious environmental issue and plant growth promoting bacteria as one of the tools for its alleviation. Saudi J. Biol. Sci. 2015, 22, 123–131. [Google Scholar] [CrossRef]
- Galic, M. Bogunovic, Use of Organic Amendment from Olive and Wine Industry in Agricultural Land: A Review. Agric. Conspec. Sci. 2018, 83, 123–129. [Google Scholar]
- Marlet, S.; Barbiero, L.; Valles, V. Soil Alkalinization and irrigation in the Sahelian zone of Niger II: Agronomic consequences of alkalinity and sodicity. Arid Land Res. Manag. 1998, 12, 139–152. [Google Scholar] [CrossRef]
- Laraus, J. The problems of sustainable water use in the Mediterranean and research requirements for agriculture. Ann. Appl. Biol. 2004, 144, 259–272. [Google Scholar] [CrossRef]
- Pilatti, R.; Buyatti, M. El agua de riego bicarbonatada y su efecto sobre el cultivo de pimiento. FAVE 1997, 11, 28–34. [Google Scholar] [CrossRef]
- Zdruli, P.; Kapur, S.; Çelik, I. Soils of the Mediterranean Region, Their Characteristics, Management and Sustainable Use. In Sustainable Land Management; Kapur, S., Eswaran, H., Blum, W.E.H., Eds.; Springer Berlin Heidelberg: Berlin/Heidelberg, Germany, 2010; pp. 125–142. ISBN 978-3-642-14781-4. [Google Scholar]
- Rengasamy, P.; Marchuk, A. Cation ratio of soil structural stability (CROSS). Soil Res. 2011, 49, 280. [Google Scholar] [CrossRef]
- Markgraf, W.; Moreno, F.; Horn, R. Quantification of Microstructural Changes in Salorthidic Fluvaquents Using Rheological and Particle Charge Techniques. Vadose Zone J. 2012, 11, vzj2011.0061. [Google Scholar] [CrossRef]
- Smith, C.J.; Oster, J.D.; Sposito, G. Potassium and magnesium in irrigation water quality assessment. Agric. Water Manag. 2015, 157, 59–64. [Google Scholar] [CrossRef]
- Zhu, Y.; Marchuk, A.; Bennett, J.M. Rapid Method for Assessment of Soil Structural Stability by Turbidimeter. Soil Sci. Soc. Am. J. 2016, 80, 1629. [Google Scholar] [CrossRef]
- Zaker, M.; Emami, H. Effect of potassium to bivalent cations ratio in irrigation water on some physical and hydraulic properties of sandy loam soil. Soil Environ. 2019, 38, 66–74. [Google Scholar] [CrossRef]
- Di Matteo, L.; Spigarelli, A.; Ortenzi, S. Processes in the Unsaturated Zone by Reliable Soil Water Content Estimation: Indications for Soil Water Management from a Sandy Soil Experimental Field in Central Italy. Sustainability 2020, 13, 227. [Google Scholar] [CrossRef]
- González, J.E.; Alonso, M.T.; Gómez, Y.; Ruiz, S. Decreased Water Use in a Super-Intensive Olive Orchard Mediates Arthropod Populations and Pest Damage. Agronomy 2021, 11, 1337. [Google Scholar] [CrossRef]
- Attwa, M.; Mahmoudi, A.E.; Elshennawey, A.; Günther, T.; Altahrany, A.; Mohamed, L. Soil Characterization Using Joint Interpretation of Remote Sensing, Resistivity and Induced Polarization Data along the Coast of the Nile Delta. Nat. Resour. Res. 2021. [Google Scholar] [CrossRef]
- González-Zamora, Á.; Almendra-Martín, L.; de Luis, M.; Martínez-Fernández, J. Influence of Soil Moisture vs. Climatic Factors in Pinus Halepensis Growth Variability in Spain: A Study with Remote Sensing and Modeled Data. Remote Sens. 2021, 13, 757. [Google Scholar] [CrossRef]
- Nunes, J. Los suelos del perimetro regable del Caia (Portugal): Tipos, fertilidad e impacto del riego en sus propriedades químicas. Doctoral Thesis, Universidad de Extremadura, Badajoz, Spain, 2003. [Google Scholar]
- FAO. World Reference Base for Soil Resources 2014: International Soil Classification System for Naming Soils and Creating Legends for Soil Maps.; FAO: Rome, Italy, 2014; ISBN 978-92-5-108369-7. [Google Scholar]
- Yaalon, D.H. Soils in the Mediterranean region: What makes them different? Catena 1997, 28, 157–169. [Google Scholar] [CrossRef]
- Weil, R.R.; Brady, N.C. The Nature and Properties of Soils, 15th ed.; Global Edition; Pearson Prentice Hall: Harlow London, NY, USA, 2017; ISBN 978-1-292-16223-2. [Google Scholar]
- Cardoso, J.V.C. Os Solos de Portugal: Sua Classificação, Caracterização e Génese. A Sul do Rio Tejo; Secretaría de Estado da Agricultura: Lisboa, Portugal, 1965.
- INMG. O Clima de Portugal. Normais Climatológicas da Região de Alentejo e Algarve, Correspondentes a 1951–1980; Instituto Nacional de Meteorologia e Geofísica: Lisboa, Portugal, 1991. [Google Scholar]
- Buurman, P.; Van Lagen, B.; Velthorst, E.J. Manual for Soil and Water Analysis; Backhuys: Kerkwerve, The Netherlands, 1996. [Google Scholar]
- USDA. Soil Survey Laboratory Methods Manual. Soil Survey Investigation Report NO. 42, Version 3; United State Department of Agriculture: Washington, DC, USA, 1996; p. 692.
- Nelson, D.W.; Sommers, L.E. Total carbon, organic carbon, and organic matter. In Methods of Soil Analysis Part 3—Chemical Methods; American Society of Agronomy: Madison, WI, USA, 1996; pp. 961–1010. [Google Scholar]
- Sumner, M.E.; Miller, W.P. Cation exchange capacity and exchange coefficients. In Methods of Soil Analysis, Part 3—Chemical Methods; American Society of Agronomy: Madison, WI, USA, 1996; pp. 1201–1229. [Google Scholar]
- Egnér, H.; Riehm, H.; Domingo, W.R. Investigations on chemical soil analysis as the basis for estimating soil fertility. II. Chemical extraction methods for phosphorus and potassium determination. Kungliga Lantbrukshögskolans Ann. 1960, 26, 199–215. [Google Scholar]
- Macbeth Division of Kollmorgen Instruments Corporation. Charts, Munsell Soil Color; Macbeth Division of Kollmorgen Instruments Corporation: New Windsor, NY, USA, 1994. [Google Scholar]
- Shapiro, S.S.; Wilk, M.B. An Analysis of Variance Test for Normality (Complete Samples). Biometrika 1965, 52, 591. [Google Scholar] [CrossRef]
- Razali, N.M.; Wah, Y.B. Power comparisons of shapiro-wilk, kolmogorov-smirnov, lilliefors and anderson-darling tests. J. Stat. Model. Anal. 2011, 2, 21–33. [Google Scholar]
- Cramer, D. Fundamental Statistics for Social Research: Step-by-Step Calculations and Computer Techniques Using SPSS for Windows; Routledge: London, UK, 2003. [Google Scholar]
- Cramer, D.; Howitt, D.L. The Sage Dictionary of Statistics: A Practical Resource for Students in the Social Sciences; Sage: Thousand Oaks, CA, USA, 2004. [Google Scholar]
- Doane, D.P.; Seward, L.E. Measuring skewness: A forgotten statistic? J. Stat. Educ. 2011, 19. [Google Scholar] [CrossRef]
- Nordstokke, D.W.; Zumbo, B.D. A new nonparametric Levene test for equal variances. Psicol. Int. J. Methodol. Exp. Psychol. 2010, 31, 401–430. [Google Scholar]
- Nordstokke, D.W.; Zumbo, B.D.; Cairns, S.L.; Saklofske, D.H. The operating characteristics of the nonparametric Levene test for equal variances with assessment and evaluation data. Pract. Assess. Res. Eval. 2011, 16, 5. [Google Scholar] [CrossRef]
- Hengl, T.; Heuvelink, G.B.M.; Stein, A. A generic framework for spatial prediction of soil variables based on regression-kriging. Geoderma 2004, 120, 75–93. [Google Scholar] [CrossRef]
- Baxter, S.J.; Oliver, M.A. The spatial prediction of soil mineral N and potentially available N using elevation. Geoderma 2005, 128, 325–339. [Google Scholar] [CrossRef]
- Inácio, M.; Pereira, V.; Pinto, M. The Soil Geochemical Atlas of Portugal: Overview and applications. J. Geochem. Explor. 2008, 98, 22–33. [Google Scholar] [CrossRef]
- Li, Y. Can the spatial prediction of soil organic matter contents at various sampling scales be improved by using regression kriging with auxiliary information? Geoderma 2010, 159, 63–75. [Google Scholar] [CrossRef]
- Sun, W.; Minasny, B.; McBratney, A. Analysis and prediction of soil properties using local regression-kriging. Geoderma 2012, 171–172, 16–23. [Google Scholar] [CrossRef]
- Behera, S.K.; Shukla, A.K. Spatial Distribution of Surface Soil Acidity, Electrical Conductivity, Soil Organic Carbon Content and Exchangeable Potassium, Calcium and Magnesium in Some Cropped Acid Soils of India. Land Degrad. Dev. 2015, 26, 71–79. [Google Scholar] [CrossRef]
- Chen, T.; Chang, Q.; Liu, J.; Clevers, J.G.P.W.; Kooistra, L. Identification of soil heavy metal sources and improvement in spatial mapping based on soil spectral information: A case study in northwest China. Sci. Total Environ. 2016, 565, 155–164. [Google Scholar] [CrossRef] [PubMed]
- Hou, D.; O’Connor, D.; Nathanail, P.; Tian, L.; Ma, Y. Integrated GIS and multivariate statistical analysis for regional scale assessment of heavy metal soil contamination: A critical review. Environ. Pollut. 2017, 231, 1188–1200. [Google Scholar] [CrossRef]
- Tziachris, P.; Metaxa, E.; Papadopoulos, F.; Papadopoulou, M. Spatial Modelling and Prediction Assessment of Soil Iron Using Kriging Interpolation with pH as Auxiliary Information. ISPRS Int. J. Geo-Inf. 2017, 6, 283. [Google Scholar] [CrossRef]
- Team, Q.D. QGIS geographic information system. Open Source Geospatial Foundation Project, Version 2; 2015. Available online: https://qgis.org/en/site/ (accessed on 21 July 2021).
- Loures, L.; Gama, J.; Nunes, J.; Lopez-Piñeiro, A. Assessing the Sodium Exchange Capacity in Rainfed and Irrigated Soils in the Mediterranean Basin Using GIS. Sustainability 2017, 9, 405. [Google Scholar] [CrossRef]
- Malcolm, J.R.; Liu, C.; Neilson, R.P.; Hansen, L.; Hannah, L. Global Warming and Extinctions of Endemic Species from Biodiversity Hotspots. Conserv. Biol. 2006, 20, 538–548. [Google Scholar] [CrossRef] [PubMed]
- Cook, B.I.; Smerdon, J.E.; Seager, R.; Coats, S. Global warming and 21st century drying. Clim. Dyn. 2014, 43, 2607–2627. [Google Scholar] [CrossRef]
- Rivetti, I.; Fraschetti, S.; Lionello, P.; Zambianchi, E.; Boero, F. Global Warming and Mass Mortalities of Benthic Invertebrates in the Mediterranean Sea. PLoS ONE 2014, 9, e115655. [Google Scholar] [CrossRef]
- Guiot, J.; Cramer, W. Climate change: The 2015 Paris Agreement thresholds and Mediterranean basin ecosystems. Science 2016, 354, 465–468. [Google Scholar] [CrossRef]
- Polade, S.D.; Gershunov, A.; Cayan, D.R.; Dettinger, M.D.; Pierce, D.W. Precipitation in a warming world: Assessing projected hydro-climate changes in California and other Mediterranean climate regions. Sci. Rep. 2017, 7, 10783. [Google Scholar] [CrossRef]
- Barrow, C.J. World atlas of desertification (United nations environment programme). In Land Degradation and Development; Arnold: London, UK, 1992; Volume 3, p. 249. ISBN 0 340 55512 2. [Google Scholar]
- Cherlet, M.; Hutchinson, C.; Reynolds, J.; Hill, J.; Sommer, S.; von Maltitz, G. World Atlas of Desertification Rethinking Land Degradation and Sustainable Land Management; Publications Office of the European Union: Luxembourg, Luxembourg, 2018; ISBN 978-92-79-75350-3. [Google Scholar]
- Verslype, N.I.; de Souza Caldas, R.M.; Machado, J.; Martins, F.M.G.; Fernandez, H.M.; Rodrigues, J.I. Sustainable agriculture in temporary and permanent crops in Portugal| Agricultura sustentável em culturas temporárias e permanentes em Portugal. Rev. Geama 2016, 2, 211–219. [Google Scholar]
- Valles, V.; Rezagui, M.; Auque, L.; Semadi, A.; Roger, L.; Zougari, H. Geochemistry of saline soils in two arid zones of the Mediterranean basin. I. geochemistry of the chott melghir-mehrouane watershed in Algeria. Arid Soil Res. Rehabil. 1997, 11, 71–84. [Google Scholar] [CrossRef]
- Avilés, A.; Rodero, J.; Amores, V.; de Vicente, I.; Rodríguez, M.I.; Niell, F.X. Factors controlling phosphorus speciation in a Mediterranean basin (River Guadalfeo, Spain). J. Hydrol. 2006, 331, 396–408. [Google Scholar] [CrossRef]
- Brinkman, R. Chapter 5 Resilience Against Climate Change? In Developments in Soil Science; Elsevier: Amsterdam, The Netherlands, 1990; Volume 20, pp. 51–60. ISBN 978-0-444-88838-9. [Google Scholar]
- Aranda, V.; Domínguez-Vidal, A.; Comino, F.; Calero, J.; Ayora-Cañada, M.J. Agro-environmental characterization of semi-arid Mediterranean soils using NIR reflection and mid-IR-attenuated total reflection spectroscopies. Vib. Spectrosc. 2014, 74, 88–97. [Google Scholar] [CrossRef]
- Wang, R.; Dungait, J.A.J.; Buss, H.L.; Yang, S.; Zhang, Y.; Xu, Z.; Jiang, Y. Base cations and micronutrients in soil aggregates as affected by enhanced nitrogen and water inputs in a semi-arid steppe grassland. Sci. Total Environ. 2017, 575, 564–572. [Google Scholar] [CrossRef]
- Díaz-Hernández, J.L.; Sánchez-Navas, A.; Reyes, E. Isotopic evidence for dolomite formation in soils. Chem. Geol. 2013, 347, 20–33. [Google Scholar] [CrossRef]
- Sanghamitra, M.; Bhaskar, V.V. Effect of Different Sources and Levels of Potassium on Yield and Carotenoids Content of African Marigold (Tagetes Erecta Linn.) cv. ‘maxima yellow’. Plant Arch. 2015, 15, 633–636. [Google Scholar]
- El–Mageed, T.A.A.; El-Sherif, A.M.A.; Ali, M.M.; El-Wahed, M.H.A. Combined effect of deficit irrigation and potassium fertilizer on physiological response, plant water status and yield of soybean in calcareous soil. Arch. Agron. Soil Sci. 2017, 63, 827–840. [Google Scholar] [CrossRef]
- Keeley, G.M.; Quin, B.F. Effects of irrigation with meatworks-fellmongery effleunt on water quality in the unsaturated zone and shallow aquifer. Prog. Water Technol. 1979, 11, 369–386. [Google Scholar]
- Bernal, M.P.; Lax, A.; Roig, A. The effect of pig slurry on exchangeable potassium in calcareous soils. Biol. Fertil. Soils 1993, 16, 169–172. [Google Scholar] [CrossRef]
- INIAP. Manual de Fertilização das Culturas; Laboratório químico agricola Rebelo da Silva: Lisboa, Portugal, 2006; ISBN 978-989-95131-0-5.
- Siebert, S.F. Traditional Agriculture and the Conservation of Biological Diversity in Crete, Greece. Int. J. Agric. Sustain. 2004, 2, 109–117. [Google Scholar] [CrossRef]
- Gonçalves, M.C.; Martins, J.C. A salinização do solo em Portugal. Causas, extensão e soluções. Revista de Ciências Agrárias 2015, 38, 574–586. [Google Scholar] [CrossRef]
- Teixeira, R.F.M.; Domingos, T.; Costa, A.P.S.V.; Oliveira, R.; Farropas, L.; Calouro, F.; Barradas, A.M.; Carneiro, J.P.B.G. Soil organic matter dynamics in Portuguese natural and sown rainfed grasslands. Ecol. Model. 2011, 222, 993–1001. [Google Scholar] [CrossRef]
- Francaviglia, R.; Renzi, G.; Ledda, L.; Benedetti, A. Organic carbon pools and soil biological fertility are affected by land use intensity in Mediterranean ecosystems of Sardinia, Italy. Sci. Total Environ. 2017, 599–600, 789–796. [Google Scholar] [CrossRef]
- Kosmas, C.; Gerontidis, S.; Marathianou, M. The effect of land use change on soils and vegetation over various lithological formations on Lesvos (Greece). Catena 2000, 40, 51–68. [Google Scholar] [CrossRef]
- Spinoni, J.; Vogt, J.; Naumann, G.; Carrao, H.; Barbosa, P. Towards identifying areas at climatological risk of desertification using the Köppen–Geiger classification and FAO aridity index. Int. J. Climatol. 2015, 35, 2210–2222. [Google Scholar] [CrossRef]
- Huang, J.; Yu, H.; Guan, X.; Wang, G.; Guo, R. Accelerated dryland expansion under climate change. Nat. Clim. Change 2016, 6, 166. [Google Scholar] [CrossRef]
- León, P.; Espejo, R.; Gómez-Paccard, C.; Hontoria, C.; Mariscal, I.; Renella, G.; Benito, M. No tillage and sugar beet foam amendment enhanced microbial activity of degraded acidic soils in South West Spain. Appl. Soil Ecol. 2017, 109, 69–74. [Google Scholar] [CrossRef]


| Month | Aver. Temp (°C) | Max. Temp. (°C) | Min. Temp. (°C) | Prec. (mm) | ET0 (mm) | Aridity Index |
|---|---|---|---|---|---|---|
| January | 8.6 | 13.2 | 4.0 | 80.8 | 16.9 | 4.78 |
| February | 9.6 | 14.5 | 4.8 | 82.0 | 24.0 | 3.42 |
| March | 11.6 | 16.9 | 6.2 | 80.2 | 47.2 | 1.70 |
| April | 13.8 | 19.9 | 7.7 | 47.7 | 56.8 | 0.84 |
| May | 17.5 | 24.4 | 10.6 | 37.6 | 92.1 | 0.41 |
| June | 21.5 | 29.0 | 13.9 | 25.0 | 125.0 | 0.20 |
| July | 24.6 | 33.2 | 16.0 | 3.6 | 140.0 | 0.03 |
| August | 24.3 | 32.9 | 15.8 | 4.4 | 118.3 | 0.04 |
| September | 21.8 | 29.2 | 14.3 | 27.3 | 75.0 | 0.36 |
| October | 17.1 | 23.0 | 11.2 | 60.0 | 36.5 | 1.64 |
| November | 12.0 | 17.0 | 6.9 | 75.1 | 22.1 | 3.40 |
| December | 8.9 | 13.5 | 4.3 | 77.9 | 17.1 | 4.56 |
| year | 15.9 | 22.2 | 9.6 | 601.6 | 771.0 | 0.78 |
| Month | Aver. Temp (°C) | Max. Temp. (°C) | Min. Temp. (°C) | Prec. (mm) | ET0 (mm) | Aridity Index |
|---|---|---|---|---|---|---|
| January | 8.8 | 13.4 | 4.1 | 55.9 | 18.7 | 2.99 |
| February | 10.3 | 15.2 | 5.5 | 47.1 | 24.5 | 1.92 |
| March | 12.6 | 18.3 | 6.9 | 34.8 | 50.6 | 0.69 |
| April | 14.3 | 20.1 | 8.6 | 47.7 | 61.4 | 0.78 |
| May | 17.7 | 24.1 | 11.3 | 37.2 | 89.1 | 0.42 |
| June | 22.0 | 29.6 | 14.4 | 17.8 | 123.6 | 0.14 |
| July | 25.3 | 33.8 | 16.9 | 5.8 | 148.9 | 0.04 |
| August | 25.4 | 33.9 | 16.9 | 4.2 | 128.9 | 0.03 |
| September | 22.8 | 29.7 | 16.0 | 26.8 | 79.7 | 0.34 |
| October | 18.0 | 23.3 | 12.6 | 55.5 | 40.7 | 1.36 |
| November | 13.0 | 17.9 | 8.2 | 73.3 | 26.7 | 2.75 |
| December | 9.6 | 13.8 | 5.5 | 75.8 | 14.5 | 5.23 |
| year | 16.7 | 22.8 | 10.6 | 483.7 | 807.4 | 0.59 |
| Month | Aver. Temp (°C) | Max. Temp. (°C) | Min. Temp. (°C) | Prec. (mm) | ET0 (mm) | Aridity Index |
|---|---|---|---|---|---|---|
| January | 9.0 | 13.7 | 4.5 | 49.5 | 18.5 | 2.68 |
| February | 10.4 | 15.4 | 5.4 | 38.4 | 24.4 | 1.57 |
| March | 13.3 | 19.0 | 7.8 | 44.1 | 51.1 | 0.86 |
| April | 15.4 | 21.2 | 9.5 | 45.0 | 62.6 | 0.72 |
| May | 19.2 | 25.9 | 12.5 | 41.8 | 94.0 | 0.44 |
| June | 22.6 | 30.0 | 15.1 | 10.1 | 123.9 | 0.08 |
| July | 26.3 | 34.7 | 17.6 | 2.1 | 151.0 | 0.01 |
| August | 26.3 | 34.9 | 17.7 | 4.3 | 130.1 | 0.03 |
| September | 23.3 | 30.0 | 16.5 | 25.0 | 77.7 | 0.32 |
| October | 18.6 | 24.0 | 13.1 | 68.6 | 39.9 | 1.71 |
| November | 12.9 | 17.4 | 8.5 | 70.7 | 24.8 | 2.85 |
| December | 10.0 | 14.4 | 5.8 | 58.0 | 15.3 | 3.80 |
| year | 17.3 | 23.4 | 11.2 | 457.4 | 813.2 | 0.56 |
| Variable | Climate Normal | Mean | N | Test | p |
|---|---|---|---|---|---|
| Precipitation | 1951–1980 | 601.6 | 1 | T(29): −5.337 | 0.000 |
| 1981–2010 | 483.7 | 30 | |||
| 1951–1980 | 601.6 | 1 | T(29): −6.865 | 0.000 | |
| 1991–2020 | 457.5 | 30 | |||
| 1981–2010 | 483.7 | 30 | T(58): 0.859 | 0.394 | |
| 1991–2020 | 457.5 | 30 | |||
| ET0 | 1951–1980 | 771.0 | 1 | T(29): 5.728 | 0.000 |
| 1981–2010 | 817.7 | 30 | |||
| 1951–1980 | 771.0 | 1 | T(29): 5.464 | 0.000 | |
| 1991–2020 | 820.8 | 30 | |||
| 1981–2010 | 817.7 | 30 | T(58): −0.247 | 0.806 | |
| 1991–2020 | 820.8 | 30 | |||
| Aridity Index | 1951–1980 | 0.78 | 1 | T(29): −6.617 | 0.000 |
| 1981–2010 | 0.59 | 30 | |||
| 1951–1980 | 0.78 | 1 | T(29): −7.521 | 0.000 | |
| 1991–2020 | 0.56 | 30 | |||
| 1981–2010 | 0.59 | 30 | IT(58): 0.770 | 0.445 | |
| 1991–2020 | 0.56 | 30 |
| Parameter | Year | RSG | Mean | N | Test | p | |
|---|---|---|---|---|---|---|---|
| (a) | Ca2+ (mg kg−1) | 2002 | Overall | 2195 | 677 | U: 222,236.000 | 0.000 |
| 2012 | 2741 | 784 | |||||
| Mg2+ (mg kg−1) | 2002 | 263 | 677 | T (1.458): −1.205 | 0.228 | ||
| 2012 | 279 | 783 | |||||
| K+ (mg kg−1) | 2002 | 204 | 677 | T(1.459): −2.672 | 0.008 | ||
| 2012 | 223 | 784 | |||||
| Na+ (mg kg−1) | 2002 | 44.3 | 677 | U: 146,232.000 | 0.004 | ||
| 2012 | 47.2 | 765 | |||||
| (b) | Ca2+ (mg kg−1) | 2002 | Fluvisols | 1279 | 394 | U: 70,675.000 | 0.000 |
| 2012 | 1640 | 430 | |||||
| 2002 | Luvisols | 3200 | 160 | T(346): −1.532 | 0.126 | ||
| 2012 | 3567 | 188 | |||||
| 2002 | Calcisols | 5402 | 85 | T(213): −1.227 | 0.221 | ||
| 2012 | 5816 | 130 | |||||
| 2002 | Cambisols | 1155 | 36 | T(70): −1.551 | 0.125 | ||
| 2012 | 1665 | 36 | |||||
| Mg2+ (mg kg−1) | 2002 | Fluvisols | 234 | 394 | U: 79,545.500 | 0.130 | |
| 2012 | 243 | 430 | |||||
| 2002 | Luvisols | 315 | 160 | T(345): −2.110 | 0.036 | ||
| 2012 | 356 | 187 | |||||
| 2002 | Calcisols | 297 | 85 | T(213): 1.606 | 0.110 | ||
| 2012 | 271 | 130 | |||||
| 2002 | Cambisols | 271 | 36 | T(70): −1.459 | 0.149 | ||
| 2012 | 352 | 36 | |||||
| K+ (mg kg−1) | 2002 | Fluvisols | 182 201 | 394 430 | T(822): −1.981 | 0.048 | |
| 2012 | |||||||
| 2002 | Luvisols | 230 248 | 160 188 | T(346): −1.713 | 0.088 | ||
| 2012 | |||||||
| 2002 | Calcisols | 292 266 | 85 130 | T(213): 1.467 | 0.144 | ||
| 2012 | |||||||
| 2002 | Cambisols | 158 217 | 36 36 | U: 464.000 | 0.038 | ||
| 2012 | |||||||
| Na+ (mg kg−1) | 2002 | Fluvisols | 43.6 | 394 | U: 76,685.500 | 0.063 | |
| 2012 | 44.7 | 421 | |||||
| 2002 | Luvisols | 45.7 | 160 | T(339): −1.663 | 0.097 | ||
| 2012 | 51.3 | 181 | |||||
| 2002 | Calcisols | 48.2 | 85 | U: 5206.500 | 0.533 | ||
| 2012 | 49.7 | 129 | |||||
| 2002 | Cambisols | 36.6 | 36 | T(68): −1.575 | 0.119 | ||
| 2012 | 47.3 | 34 |
| Parameter | Year | CS | Mean | N | Test | p |
|---|---|---|---|---|---|---|
| CROSS (cmol (+) kg−1) | 2002 | Rain-fed | 0.215 | 620 | T (1293): 4.440 | 0.000 |
| Irrigation | 0.291 | 675 | ||||
| 2012 | Rain-fed | 0.165 | 508 | T (1271): 3.150 | 0.002 | |
| Irrigation | 0.186 | 765 |
| Parameter | Year | RSG | CS | Mean | N | Test | p |
|---|---|---|---|---|---|---|---|
| CROSS (cmol (+) kg−1) | 2002 | Fluvisols | Rain-fed | 0.268 | 222 | U: 31,422.000 | 0.000 |
| Irrigation | 0.336 | 394 | |||||
| Luvisols | Rain-fed | 0.198 | 194 | T (352): 3.569 | 0.000 | ||
| Irrigation | 0.239 | 160 | |||||
| Calcisols | Rain-fed | 0.155 | 143 | T (226): 2.805 | 0.005 | ||
| Irrigation | 0.187 | 85 | |||||
| Cambisols | Rain-fed | 0.244 | 61 | T (95): 3.724 | 0.000 | ||
| Irrigation | 0.331 | 36 | |||||
| 2012 | Fluvisols | Rain-fed | 0.208 | 194 | T (604): 0.281 | 0.779 | |
| Irrigation | 0.213 | 412 | |||||
| Luvisols | Rain-fed | 0.134 | 152 | T (338): 4.349 | 0.000 | ||
| Irrigation | 0.169 | 188 | |||||
| Calcisols | Rain-fed | 0.110 | 99 | T (227): 0.963 | 0.336 | ||
| Irrigation | 0.120 | 130 | |||||
| Cambisols | Rain-fed | 0.206 | 63 | U: 1076.000 | 0.844 | ||
| Irrigation | 0.219 | 35 |
| Parameter | Year | Mean | N | Test | p |
|---|---|---|---|---|---|
| SOM (%) | 1965 | 1.26 | 1 | T(524): 9.809 | 0.000 |
| 2012 | 1.55 | 525 | |||
| pH | 1965 | 6.43 | 1 | T(525): 10.819 | 0.000 |
| 2012 | 6.92 | 526 | |||
| Ca2+ (cmol(+) kg−1) | 1965 | 9.66 | 1 | T(525): 10.316 | 0.000 |
| 2012 | 15.45 | 526 | |||
| Mg2+ (cmol(+) kg−1) | 1965 | 2.25 | 1 | T(525): 5.797 | 0.000 |
| 2012 | 2.73 | 526 | |||
| K+ (cmol(+) kg−1) | 1965 | 0.15 | 1 | T(525): 24.982 | 0.000 |
| 2012 | 0.44 | 526 | |||
| Na+ (cmol(+) kg−1) | 1965 | 0.32 | 1 | T(520): −32.653 | 0.000 |
| 2012 | 0.16 | 521 |
Publisher’s Note: MDPI stays neutral with regard to jurisdictional claims in published maps and institutional affiliations. |
© 2021 by the authors. Licensee MDPI, Basel, Switzerland. This article is an open access article distributed under the terms and conditions of the Creative Commons Attribution (CC BY) license (https://creativecommons.org/licenses/by/4.0/).
Share and Cite
Telo da Gama, J.; Loures, L.; Lopez-Piñeiro, A.; Quintino, D.; Ferreira, P.; Nunes, J.R. Assessing the Long-Term Impact of Traditional Agriculture and the Mid-Term Impact of Intensification in Face of Local Climatic Changes. Agriculture 2021, 11, 814. https://doi.org/10.3390/agriculture11090814
Telo da Gama J, Loures L, Lopez-Piñeiro A, Quintino D, Ferreira P, Nunes JR. Assessing the Long-Term Impact of Traditional Agriculture and the Mid-Term Impact of Intensification in Face of Local Climatic Changes. Agriculture. 2021; 11(9):814. https://doi.org/10.3390/agriculture11090814
Chicago/Turabian StyleTelo da Gama, José, Luis Loures, António Lopez-Piñeiro, Derick Quintino, Paulo Ferreira, and José Rato Nunes. 2021. "Assessing the Long-Term Impact of Traditional Agriculture and the Mid-Term Impact of Intensification in Face of Local Climatic Changes" Agriculture 11, no. 9: 814. https://doi.org/10.3390/agriculture11090814
APA StyleTelo da Gama, J., Loures, L., Lopez-Piñeiro, A., Quintino, D., Ferreira, P., & Nunes, J. R. (2021). Assessing the Long-Term Impact of Traditional Agriculture and the Mid-Term Impact of Intensification in Face of Local Climatic Changes. Agriculture, 11(9), 814. https://doi.org/10.3390/agriculture11090814