Riparian Zone Nitrogen Management through the Development of the Riparian Ecosystem Management Model (REMM) in a Formerly Glaciated Watershed of the US Northeast
Abstract
1. Introduction
2. Materials and Methods
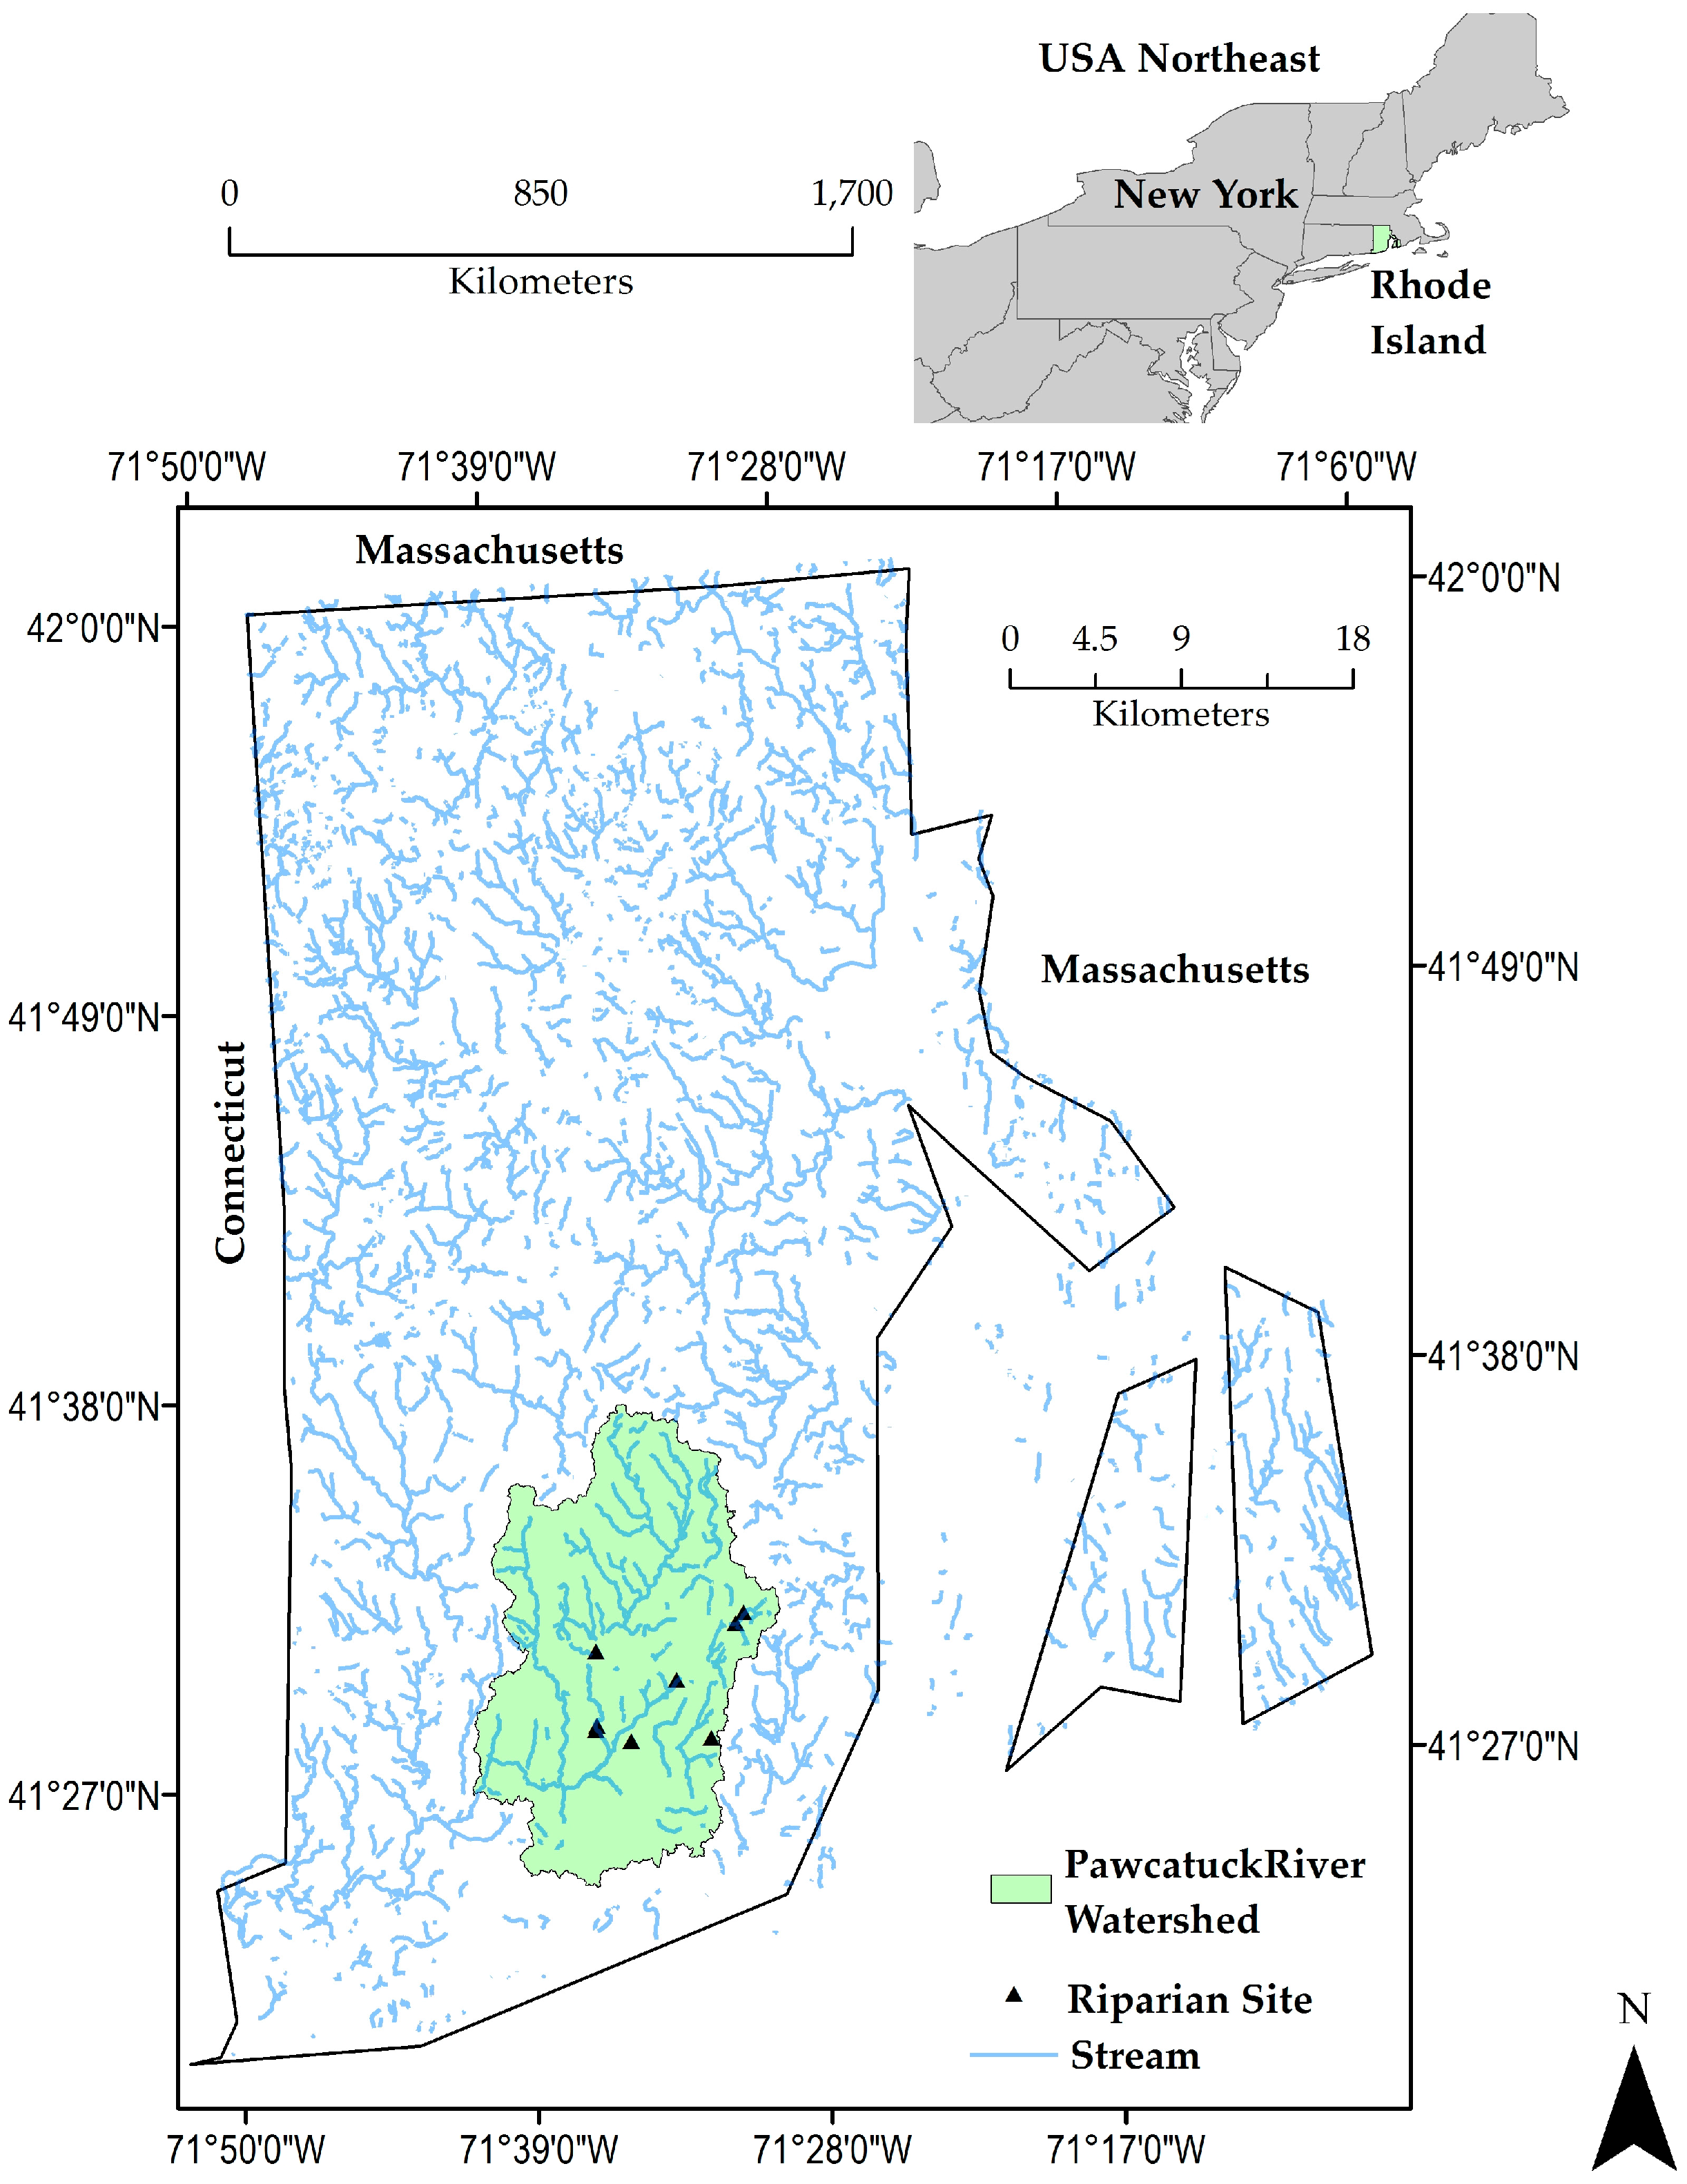
2.1. Site Description
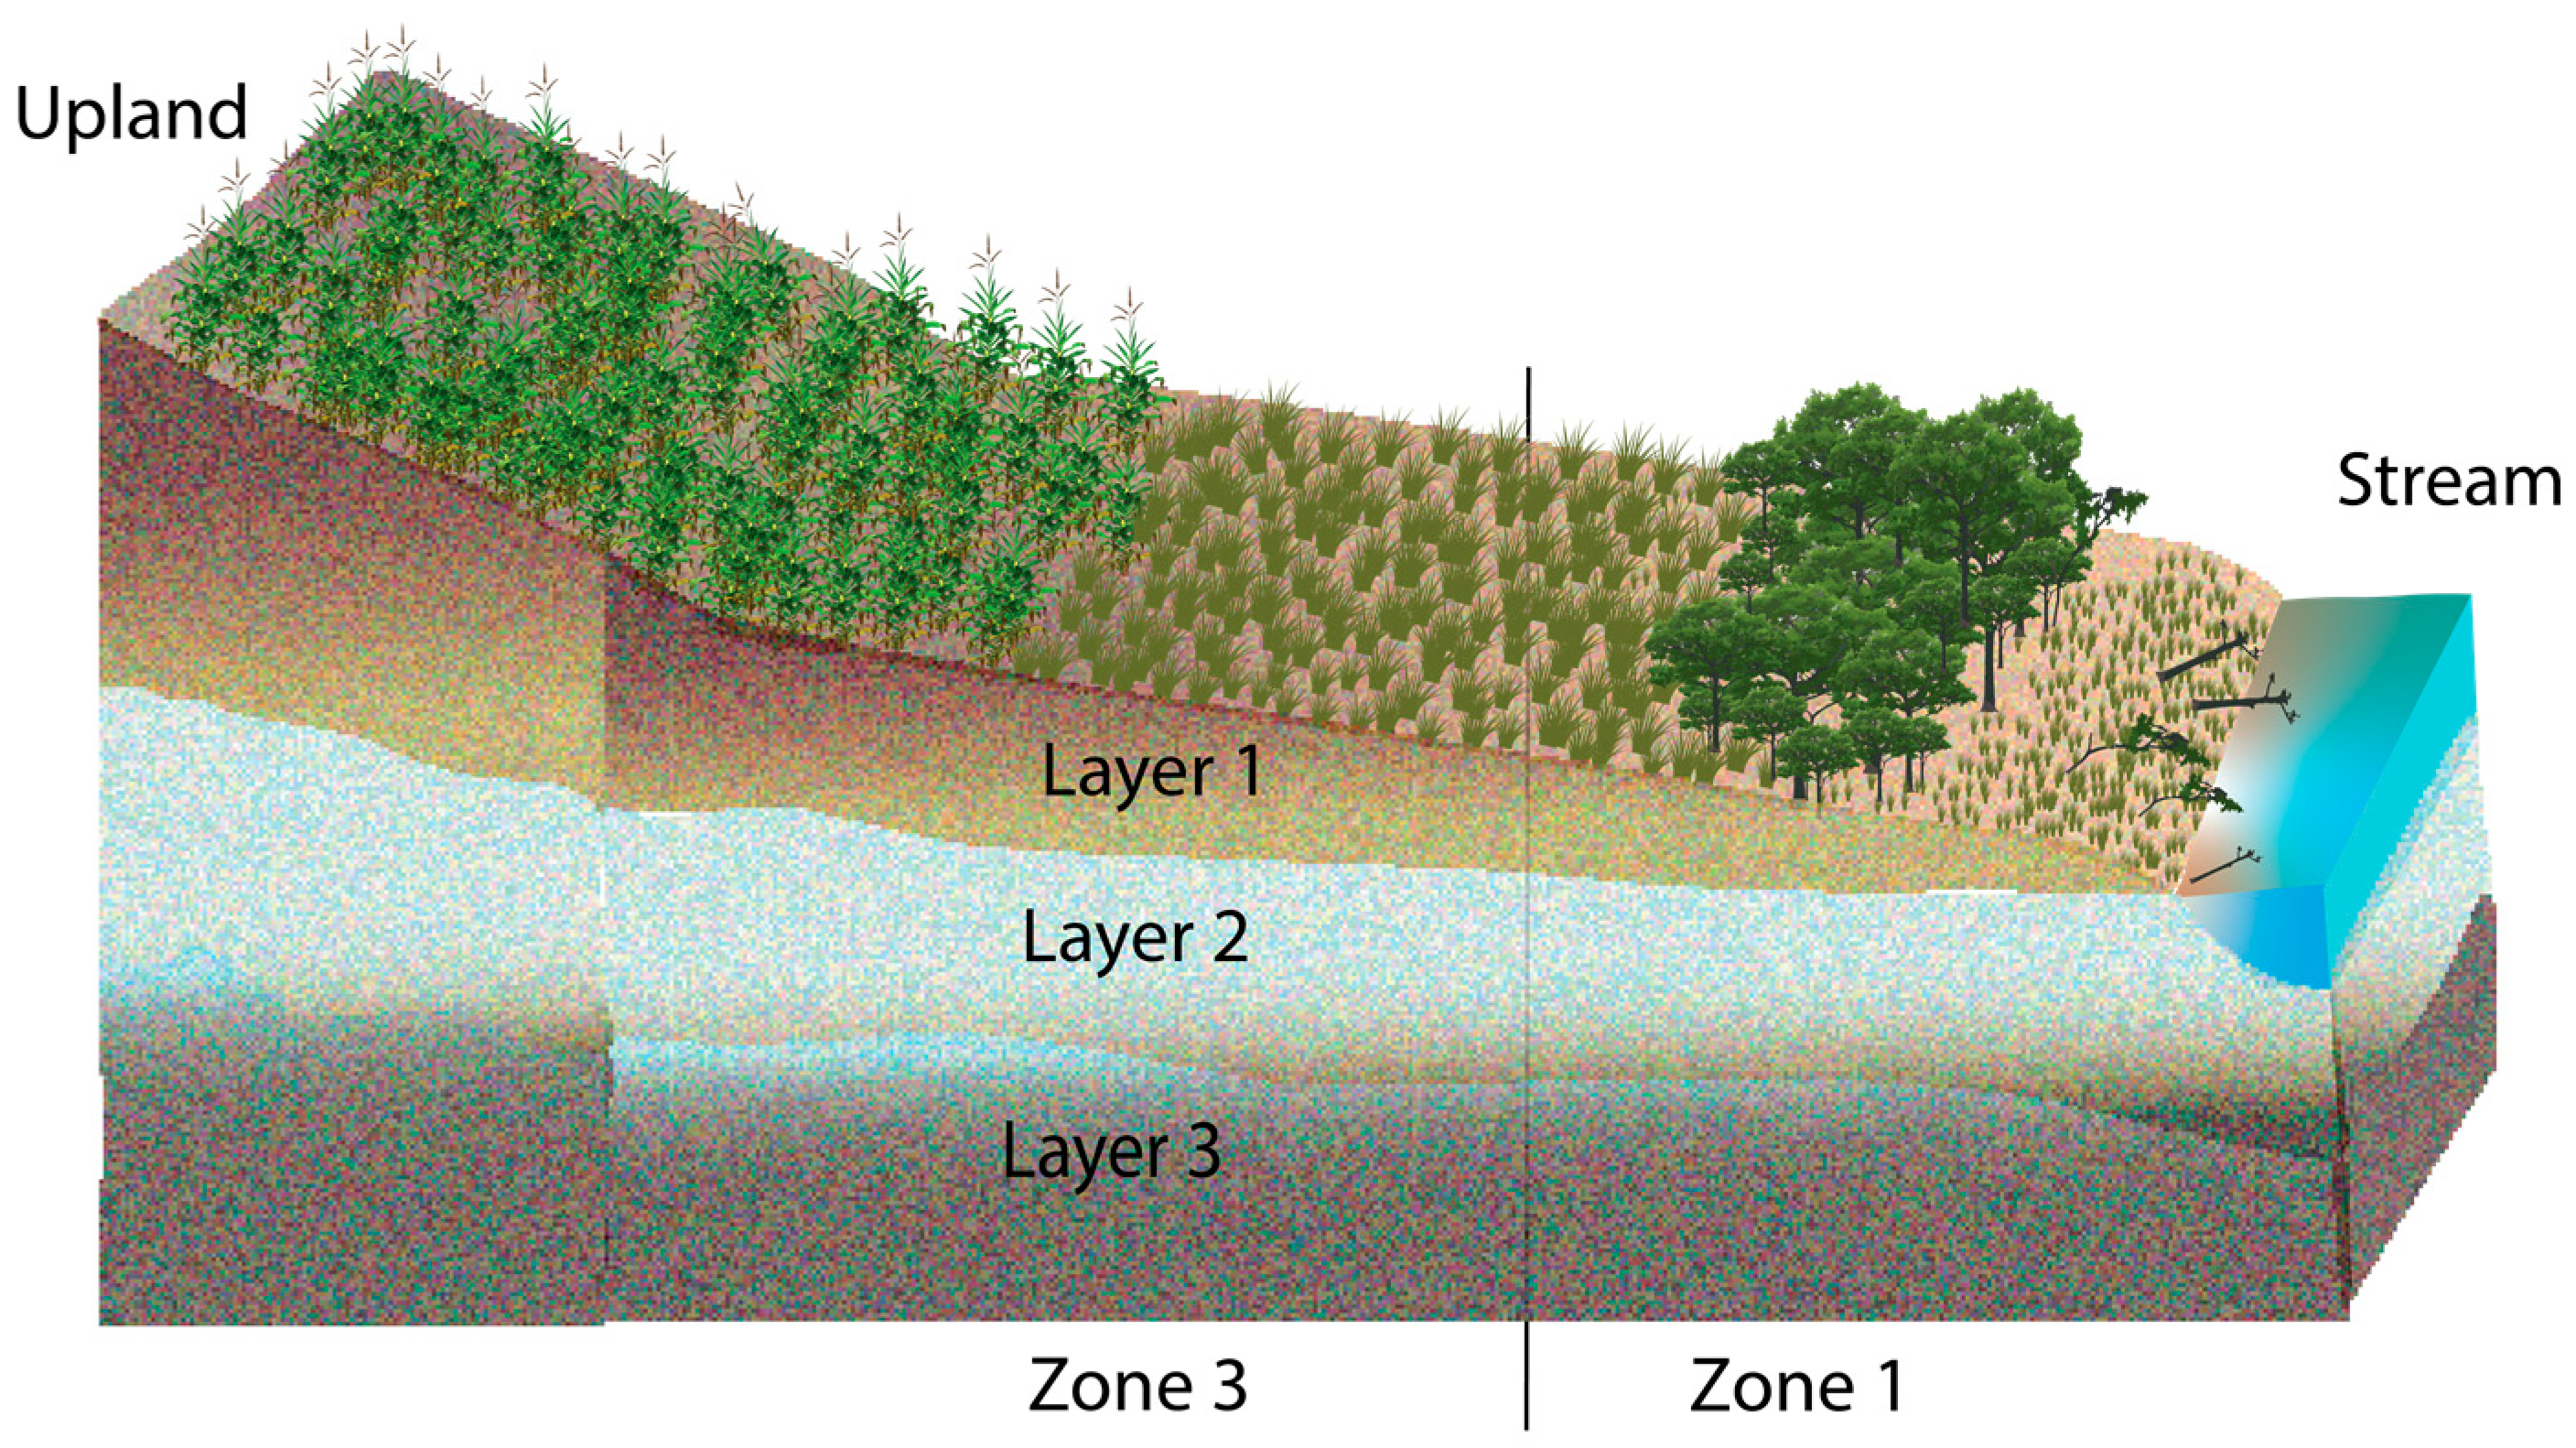
2.2. Description of The REMM Model
2.3. REMM Model Input Data
2.3.1. Upland Inputs (*.FIN File)
2.3.2. Weather Data (*.WEA File)
2.3.3. Vegetation Data (*.VEG File)
2.3.4. Site Characteristics (*.BUF File)
2.3.5. Collection of Field Data and Other Essential Inputs for REMM
2.4. Model Assessment
2.5. REMM Model Calibration, Validation and Sensitivity Analysis
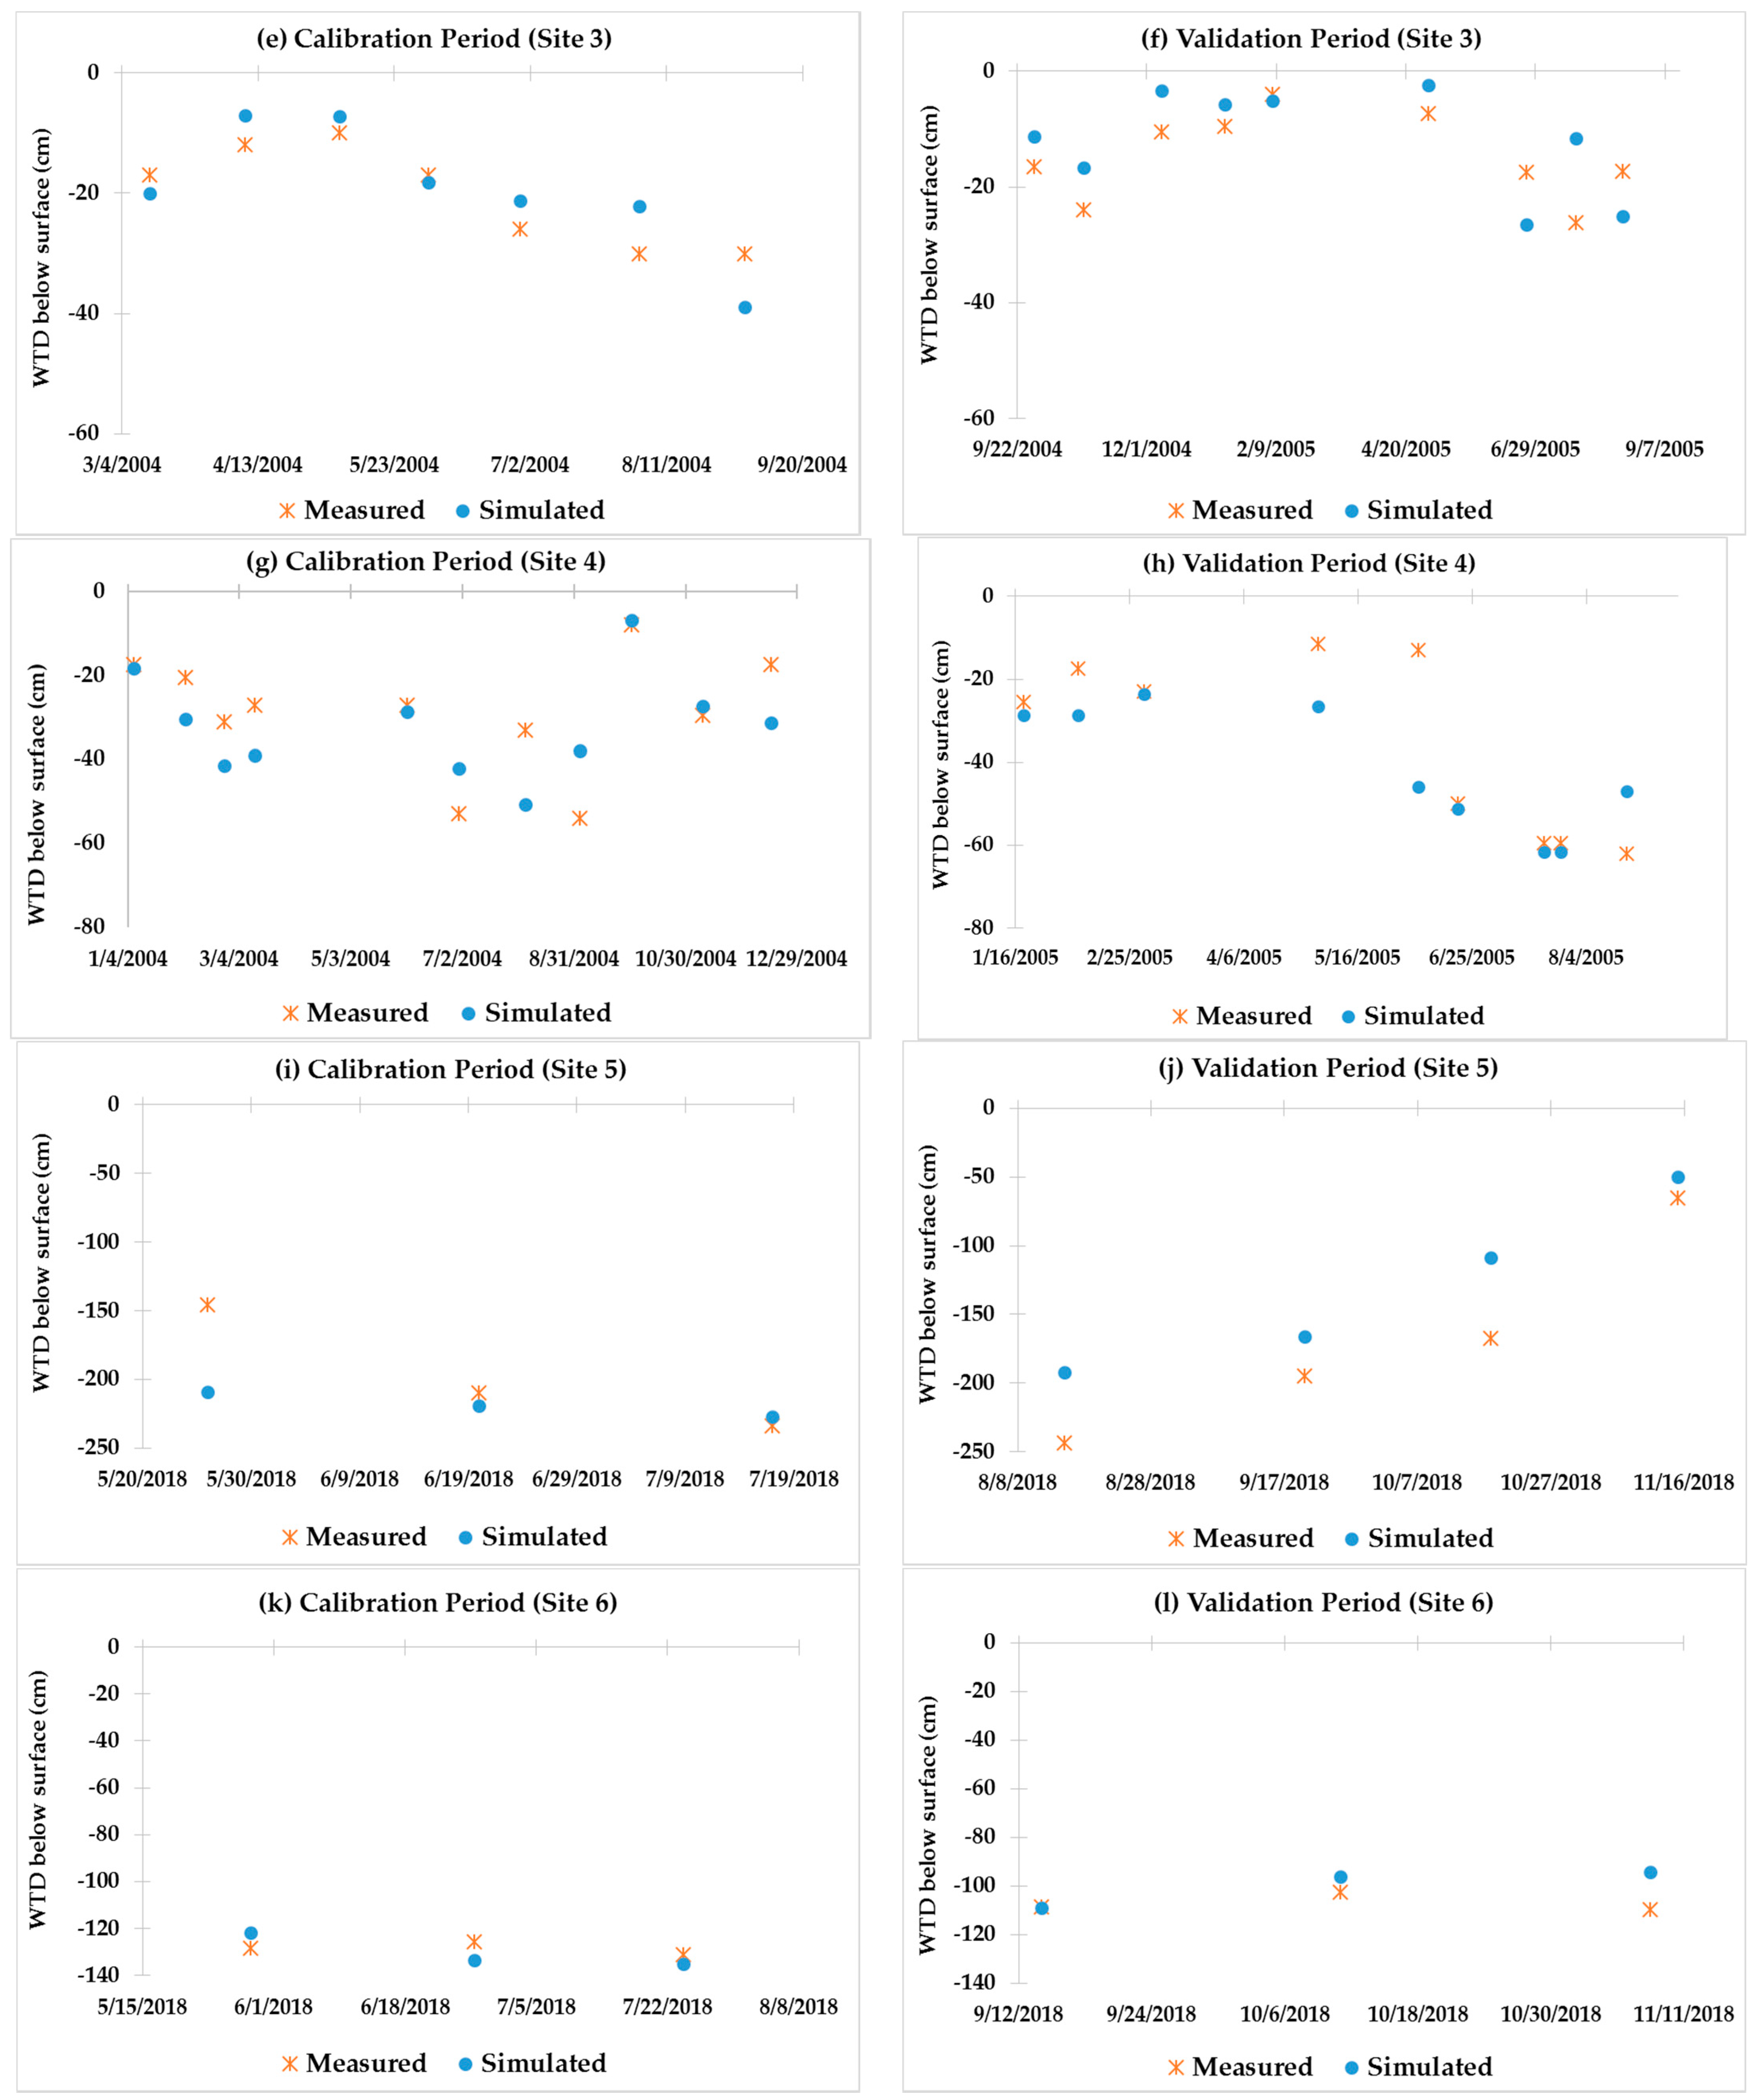
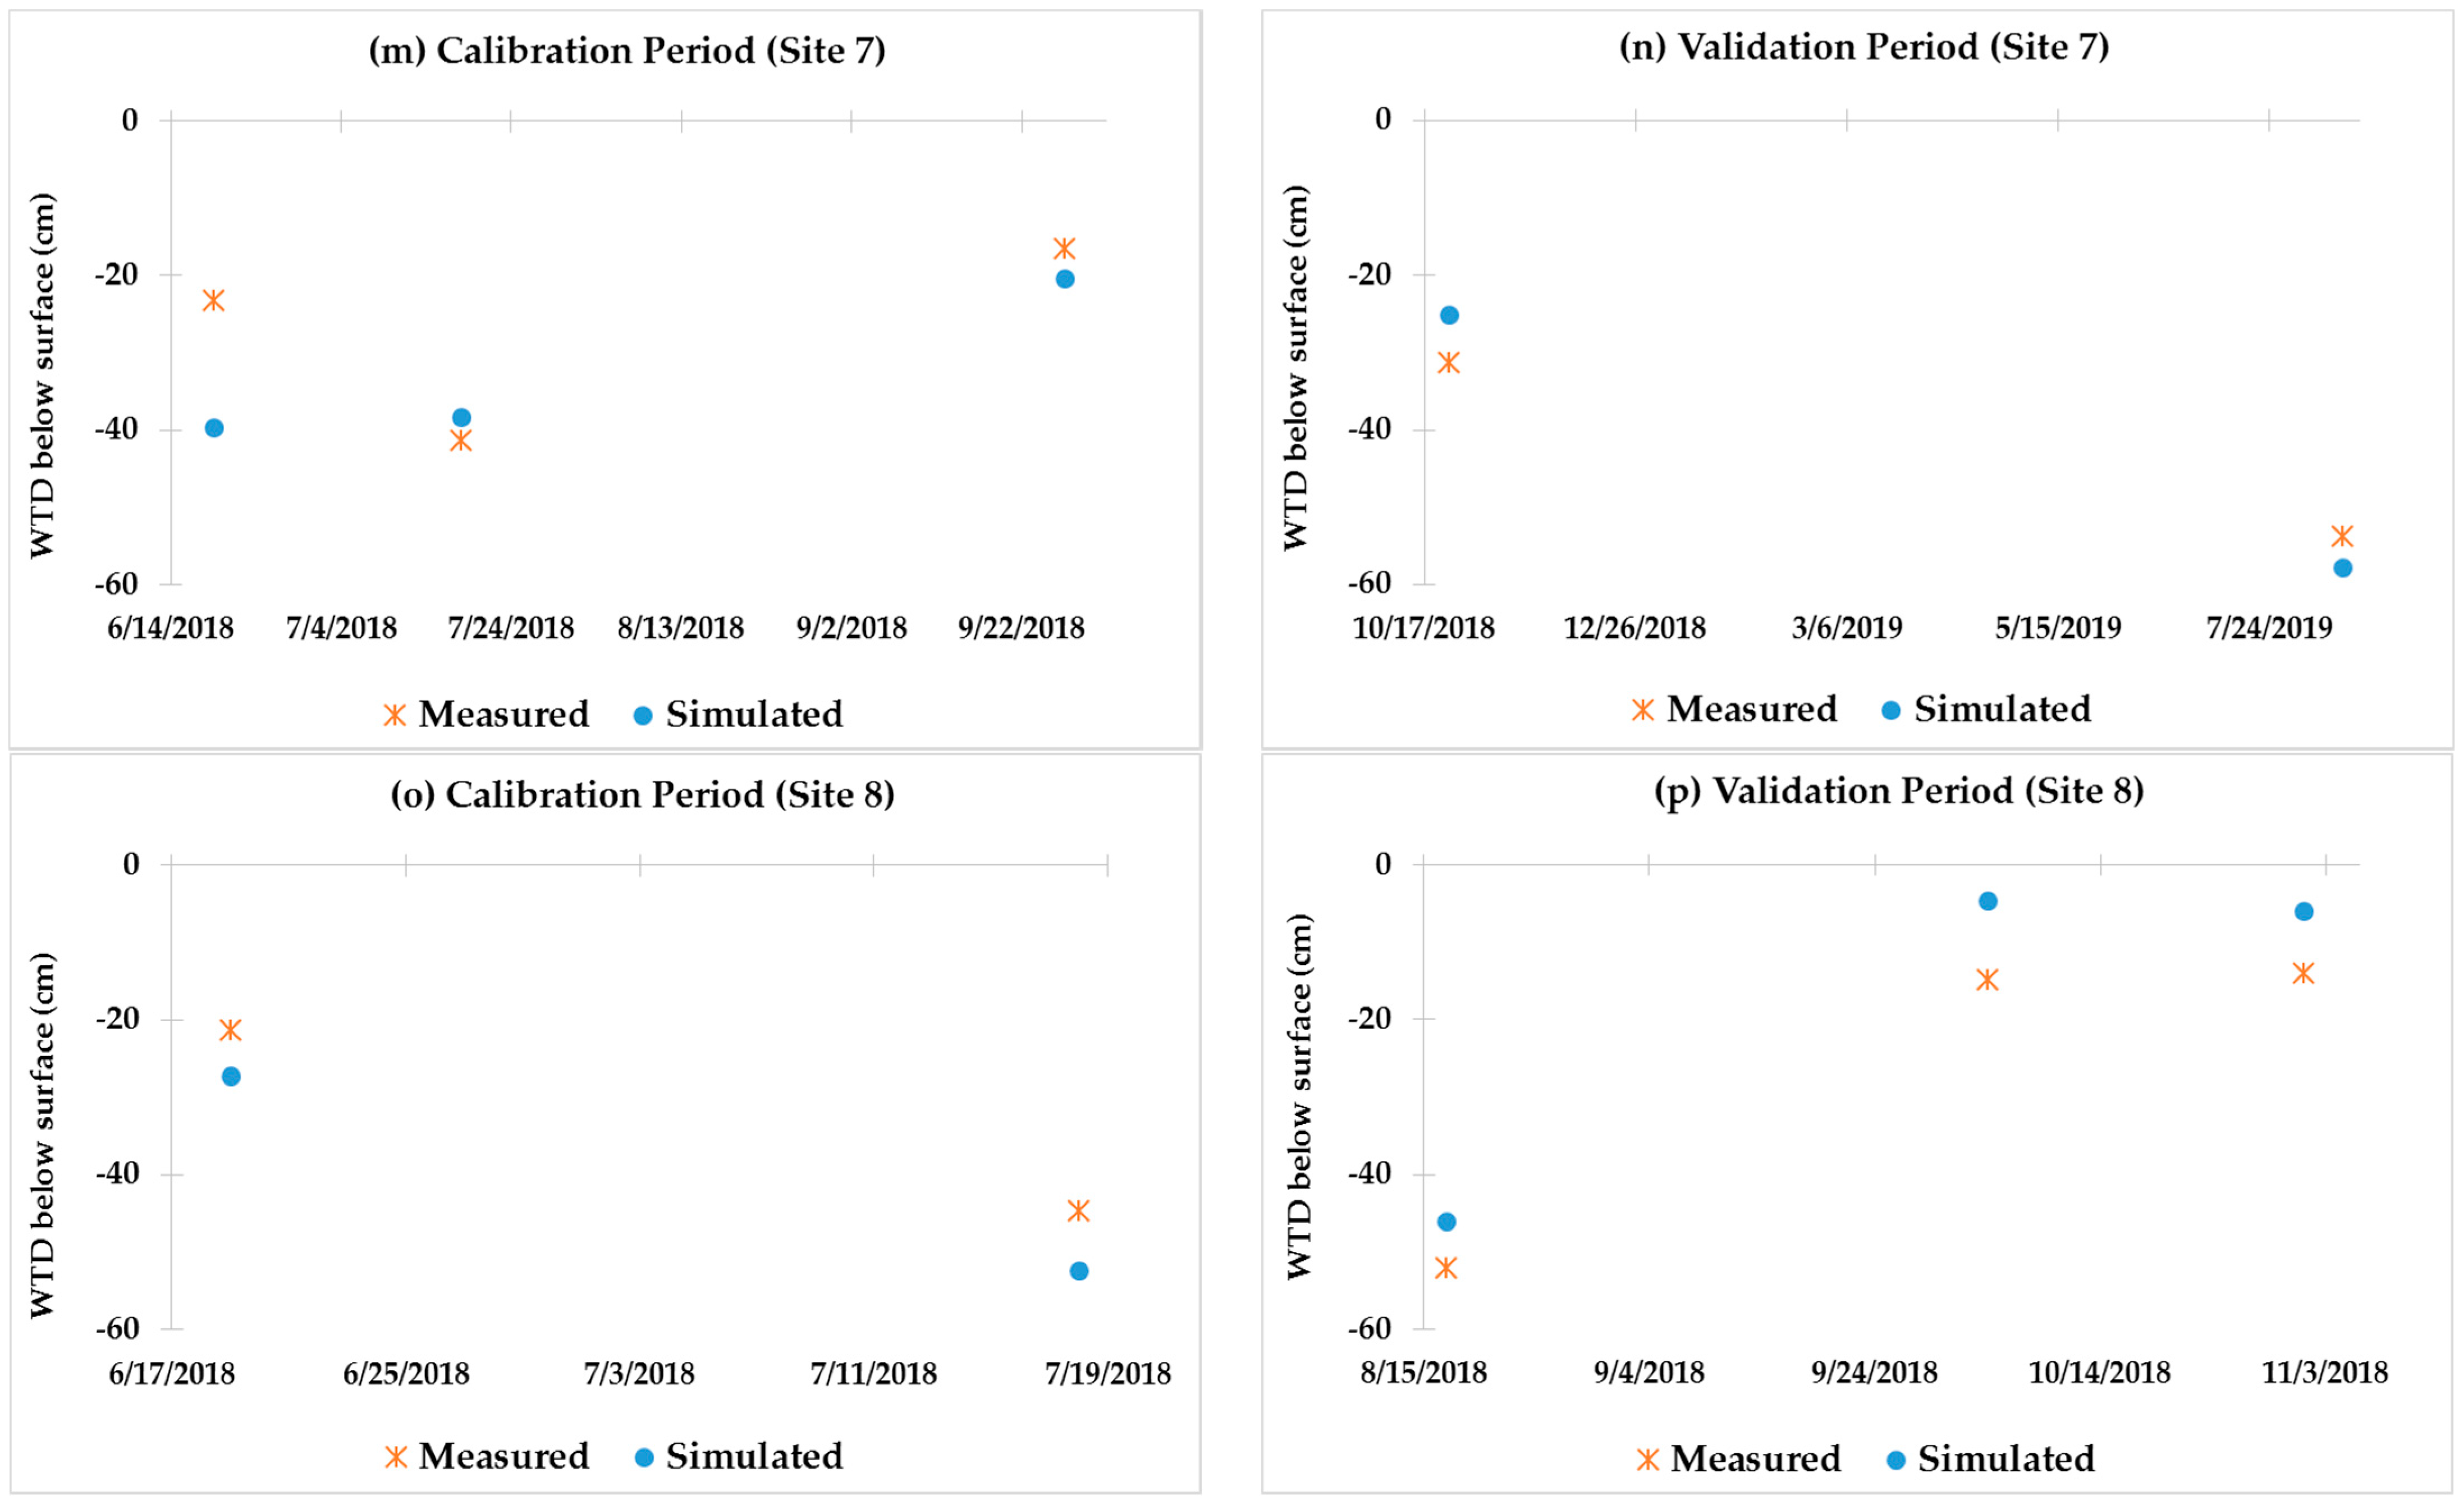
- We used field measured daily WTDs in order to calibrate and validate the hydrologic component of REMM.
- Soil inputs of the upland area were first calibrated, but buffer parameters were kept constant. Soil parameters (soil porosity, field capacity, and wilting point) were then modified within recommended ranges consistent with the soil texture to reduce difference between simulated and measured WTDs.
- We needed to adjust the soil layer thickness so that REMM generated buffer runoff and AnnAGNPS calibrated runoff, and simulated and measured WTDs were in close agreement.
- For the improvement of REMM predictions of WTDs, saturated hydraulic conductivities were also adjusted. The REMM permeability class of 2 (saturated hydraulic conductivities ranging from 42–141 µm/s) was used for all the sites. Hydraulic conductivities significantly affected horizontal water movement between riparian zones and the vertical gravity drainage between soil layers [16].
- The simulated WTDs were also sensitive to deep seepage from the bottom of the third layer (especially when the simulated water table was within layer 3) and were adjusted to improve model predictions of WTDs. Potential deep seep of 0.2 mm/day and 0.1 mm/day were used for all zones for site 5 and site 7, respectively. However, the other six sites had no potential deep seep in the model.
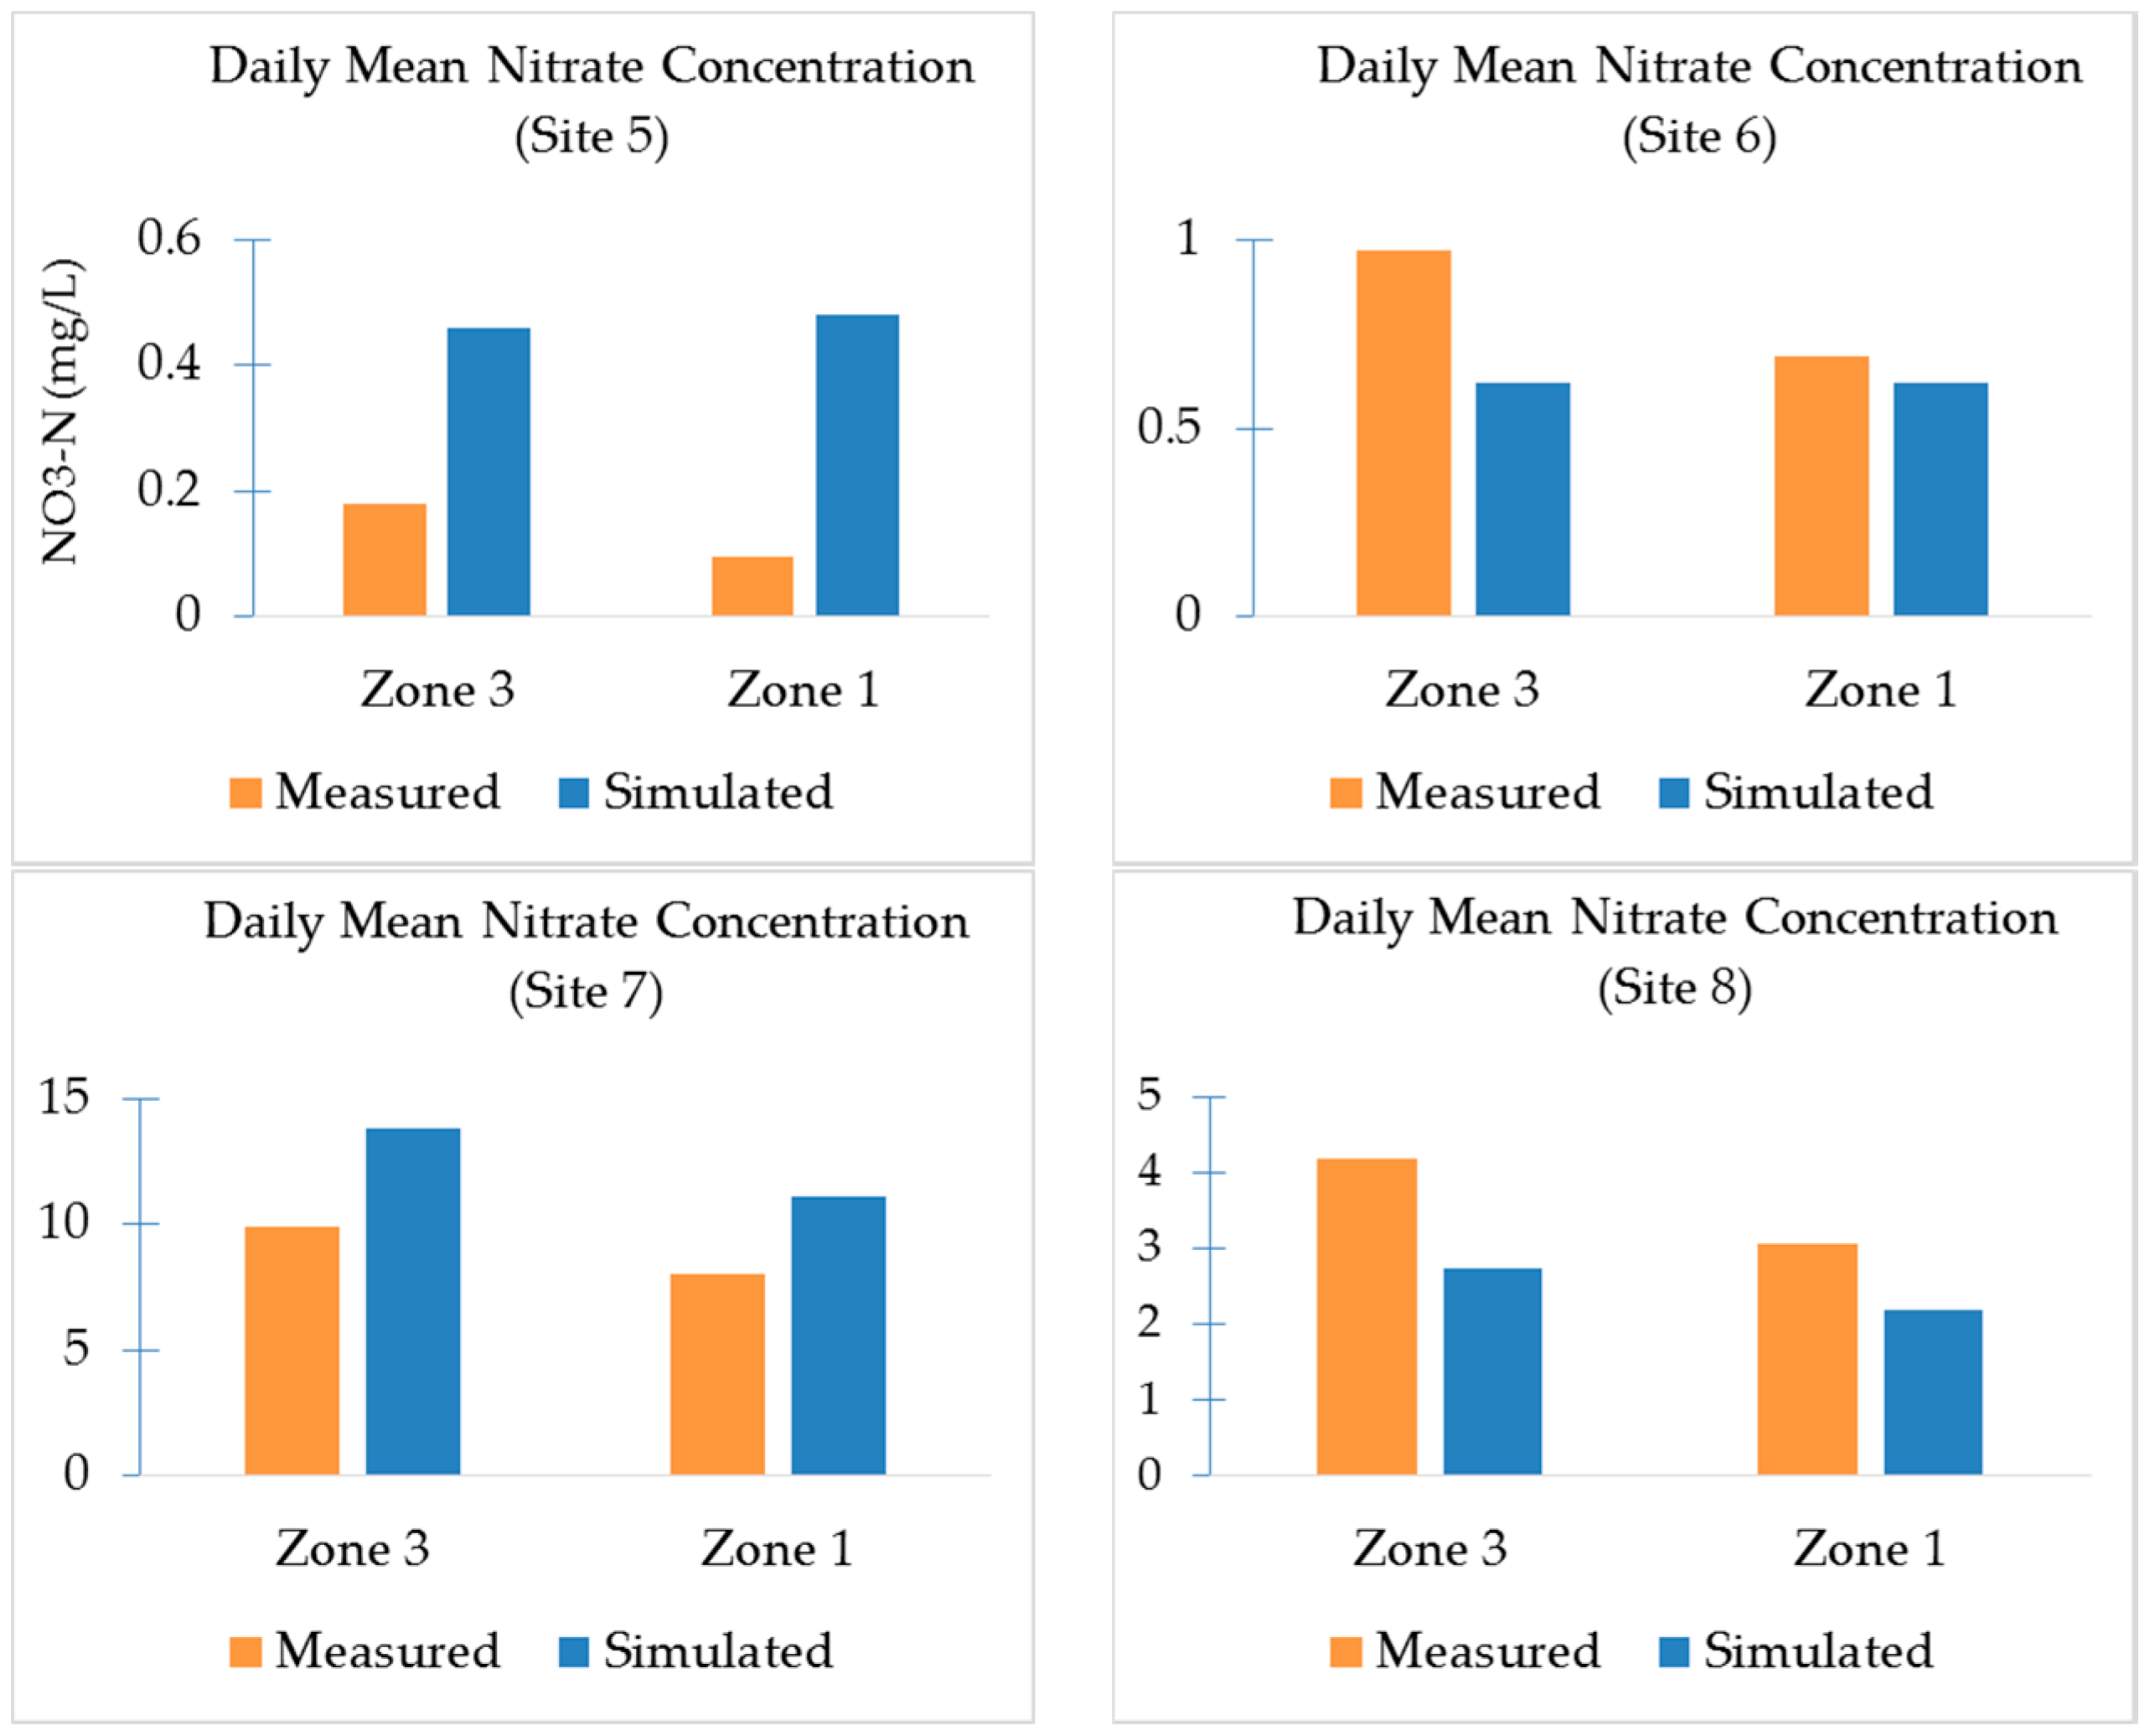
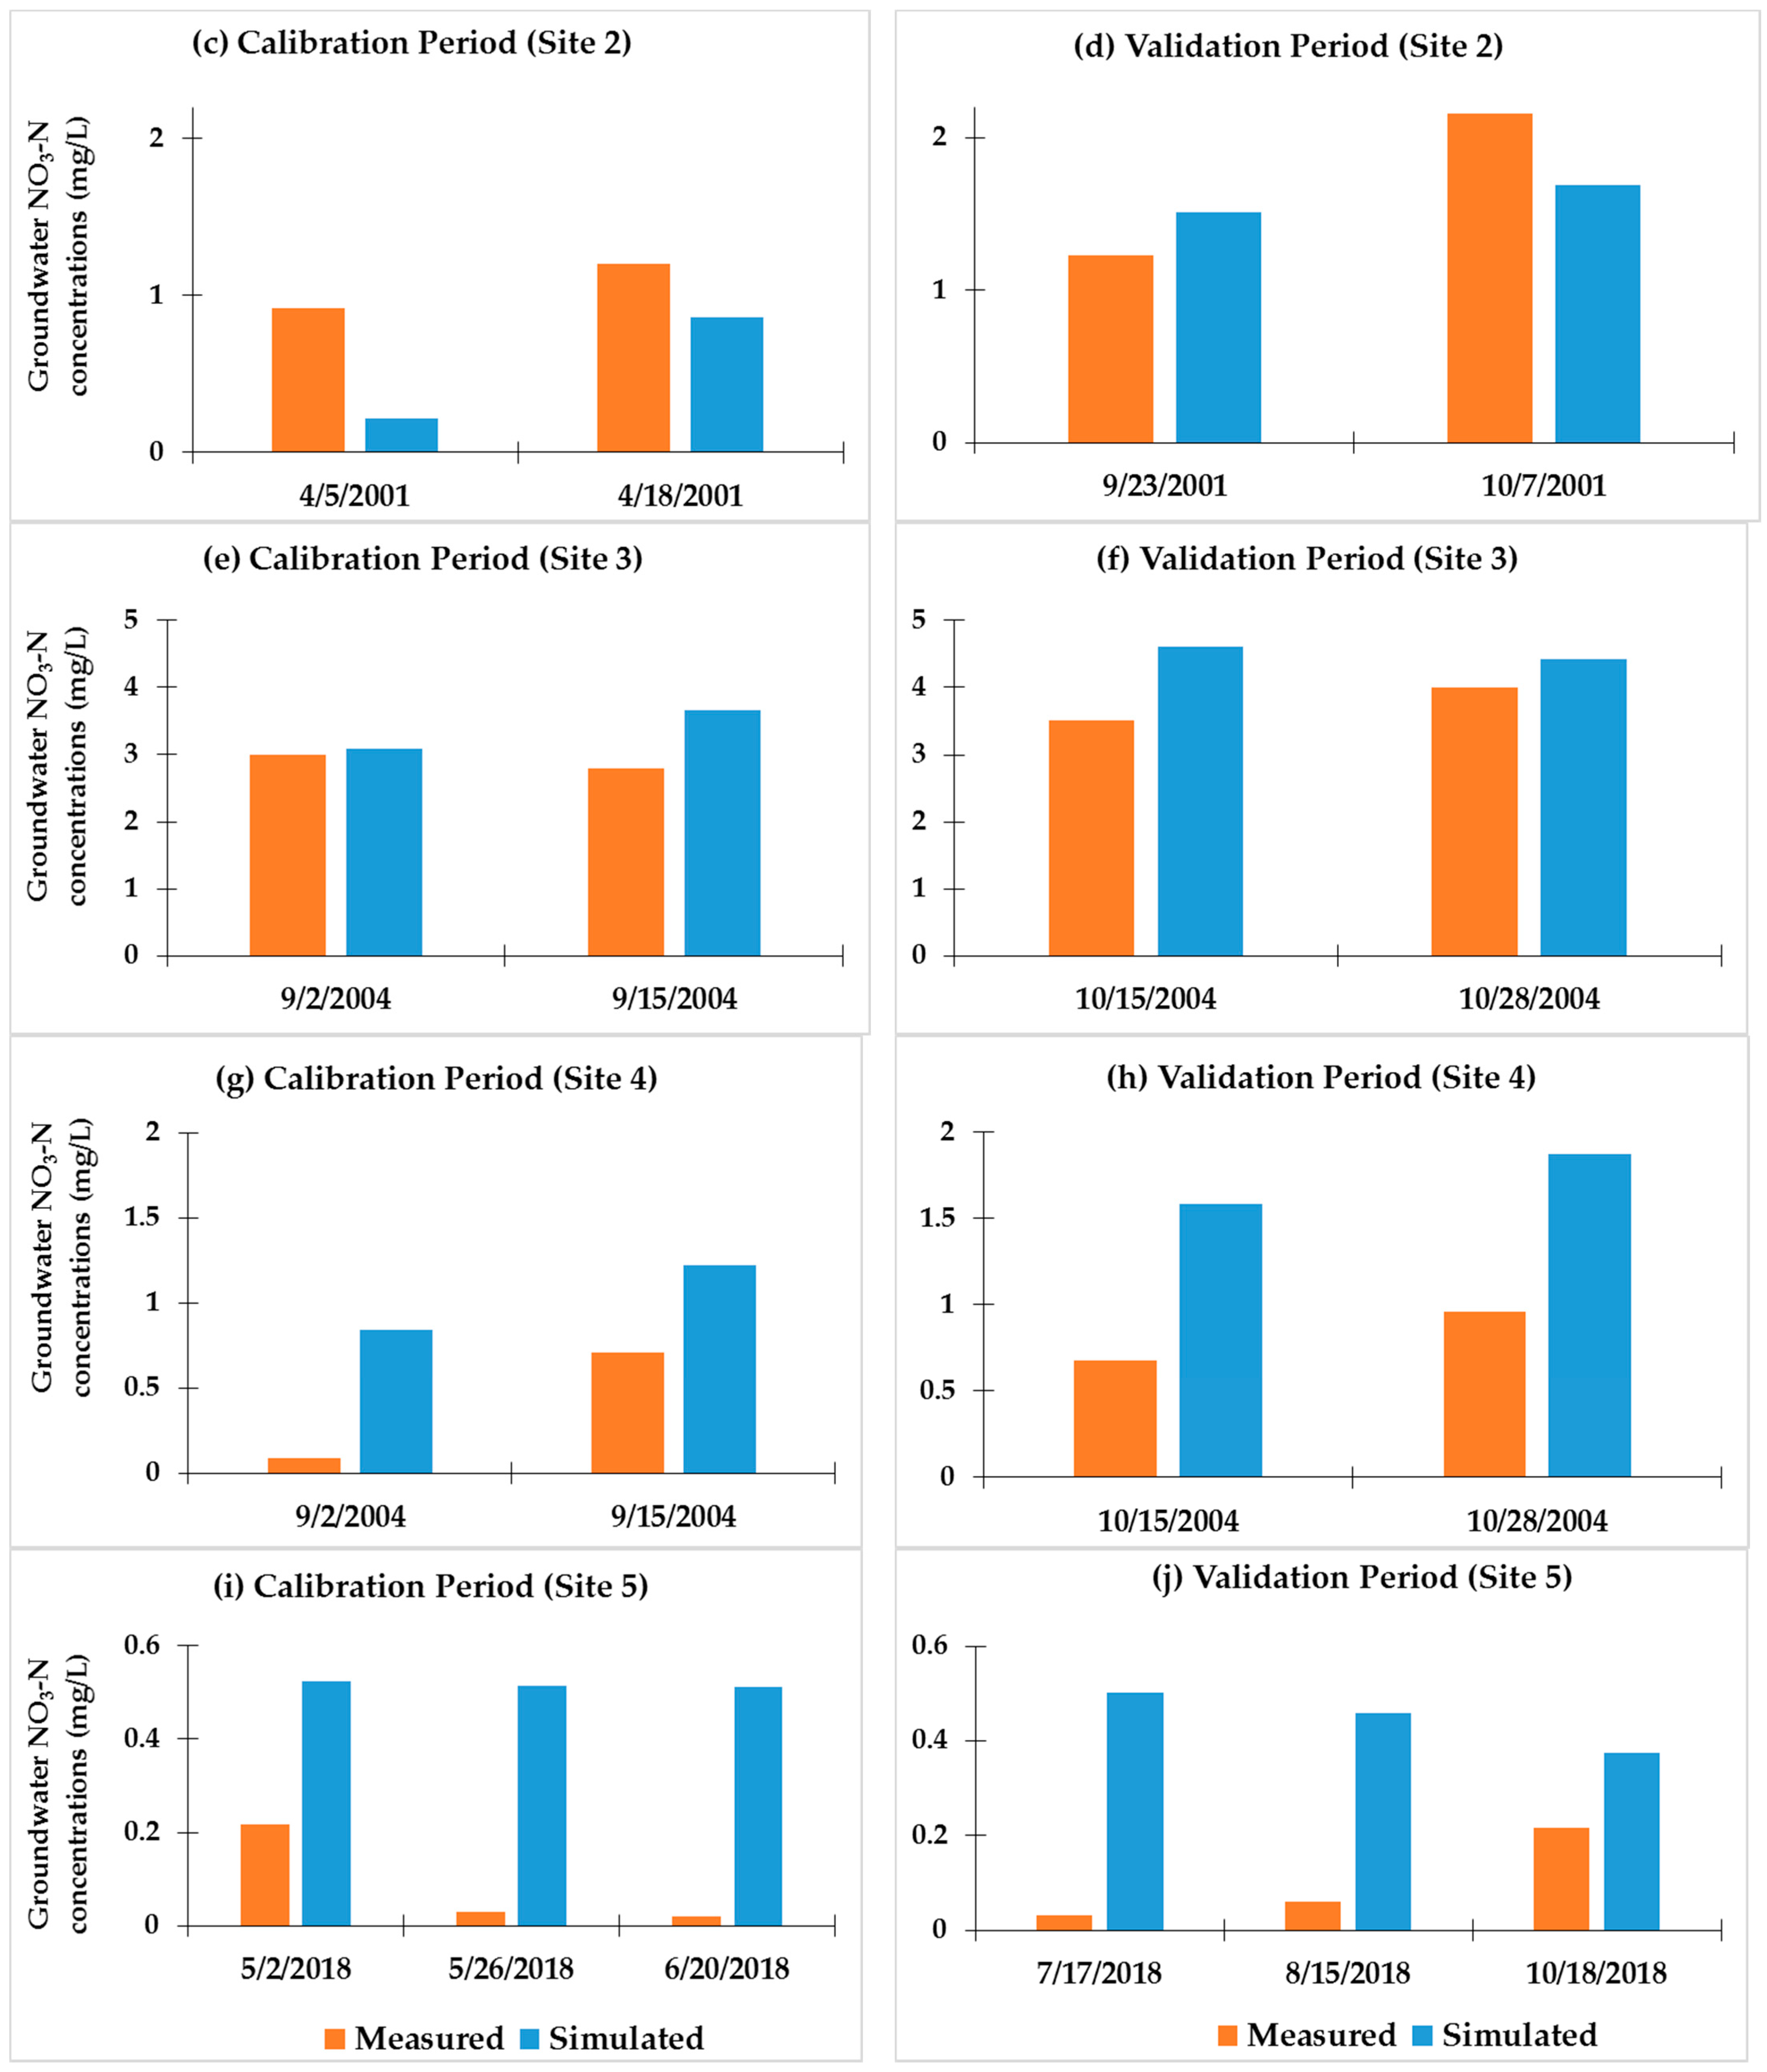
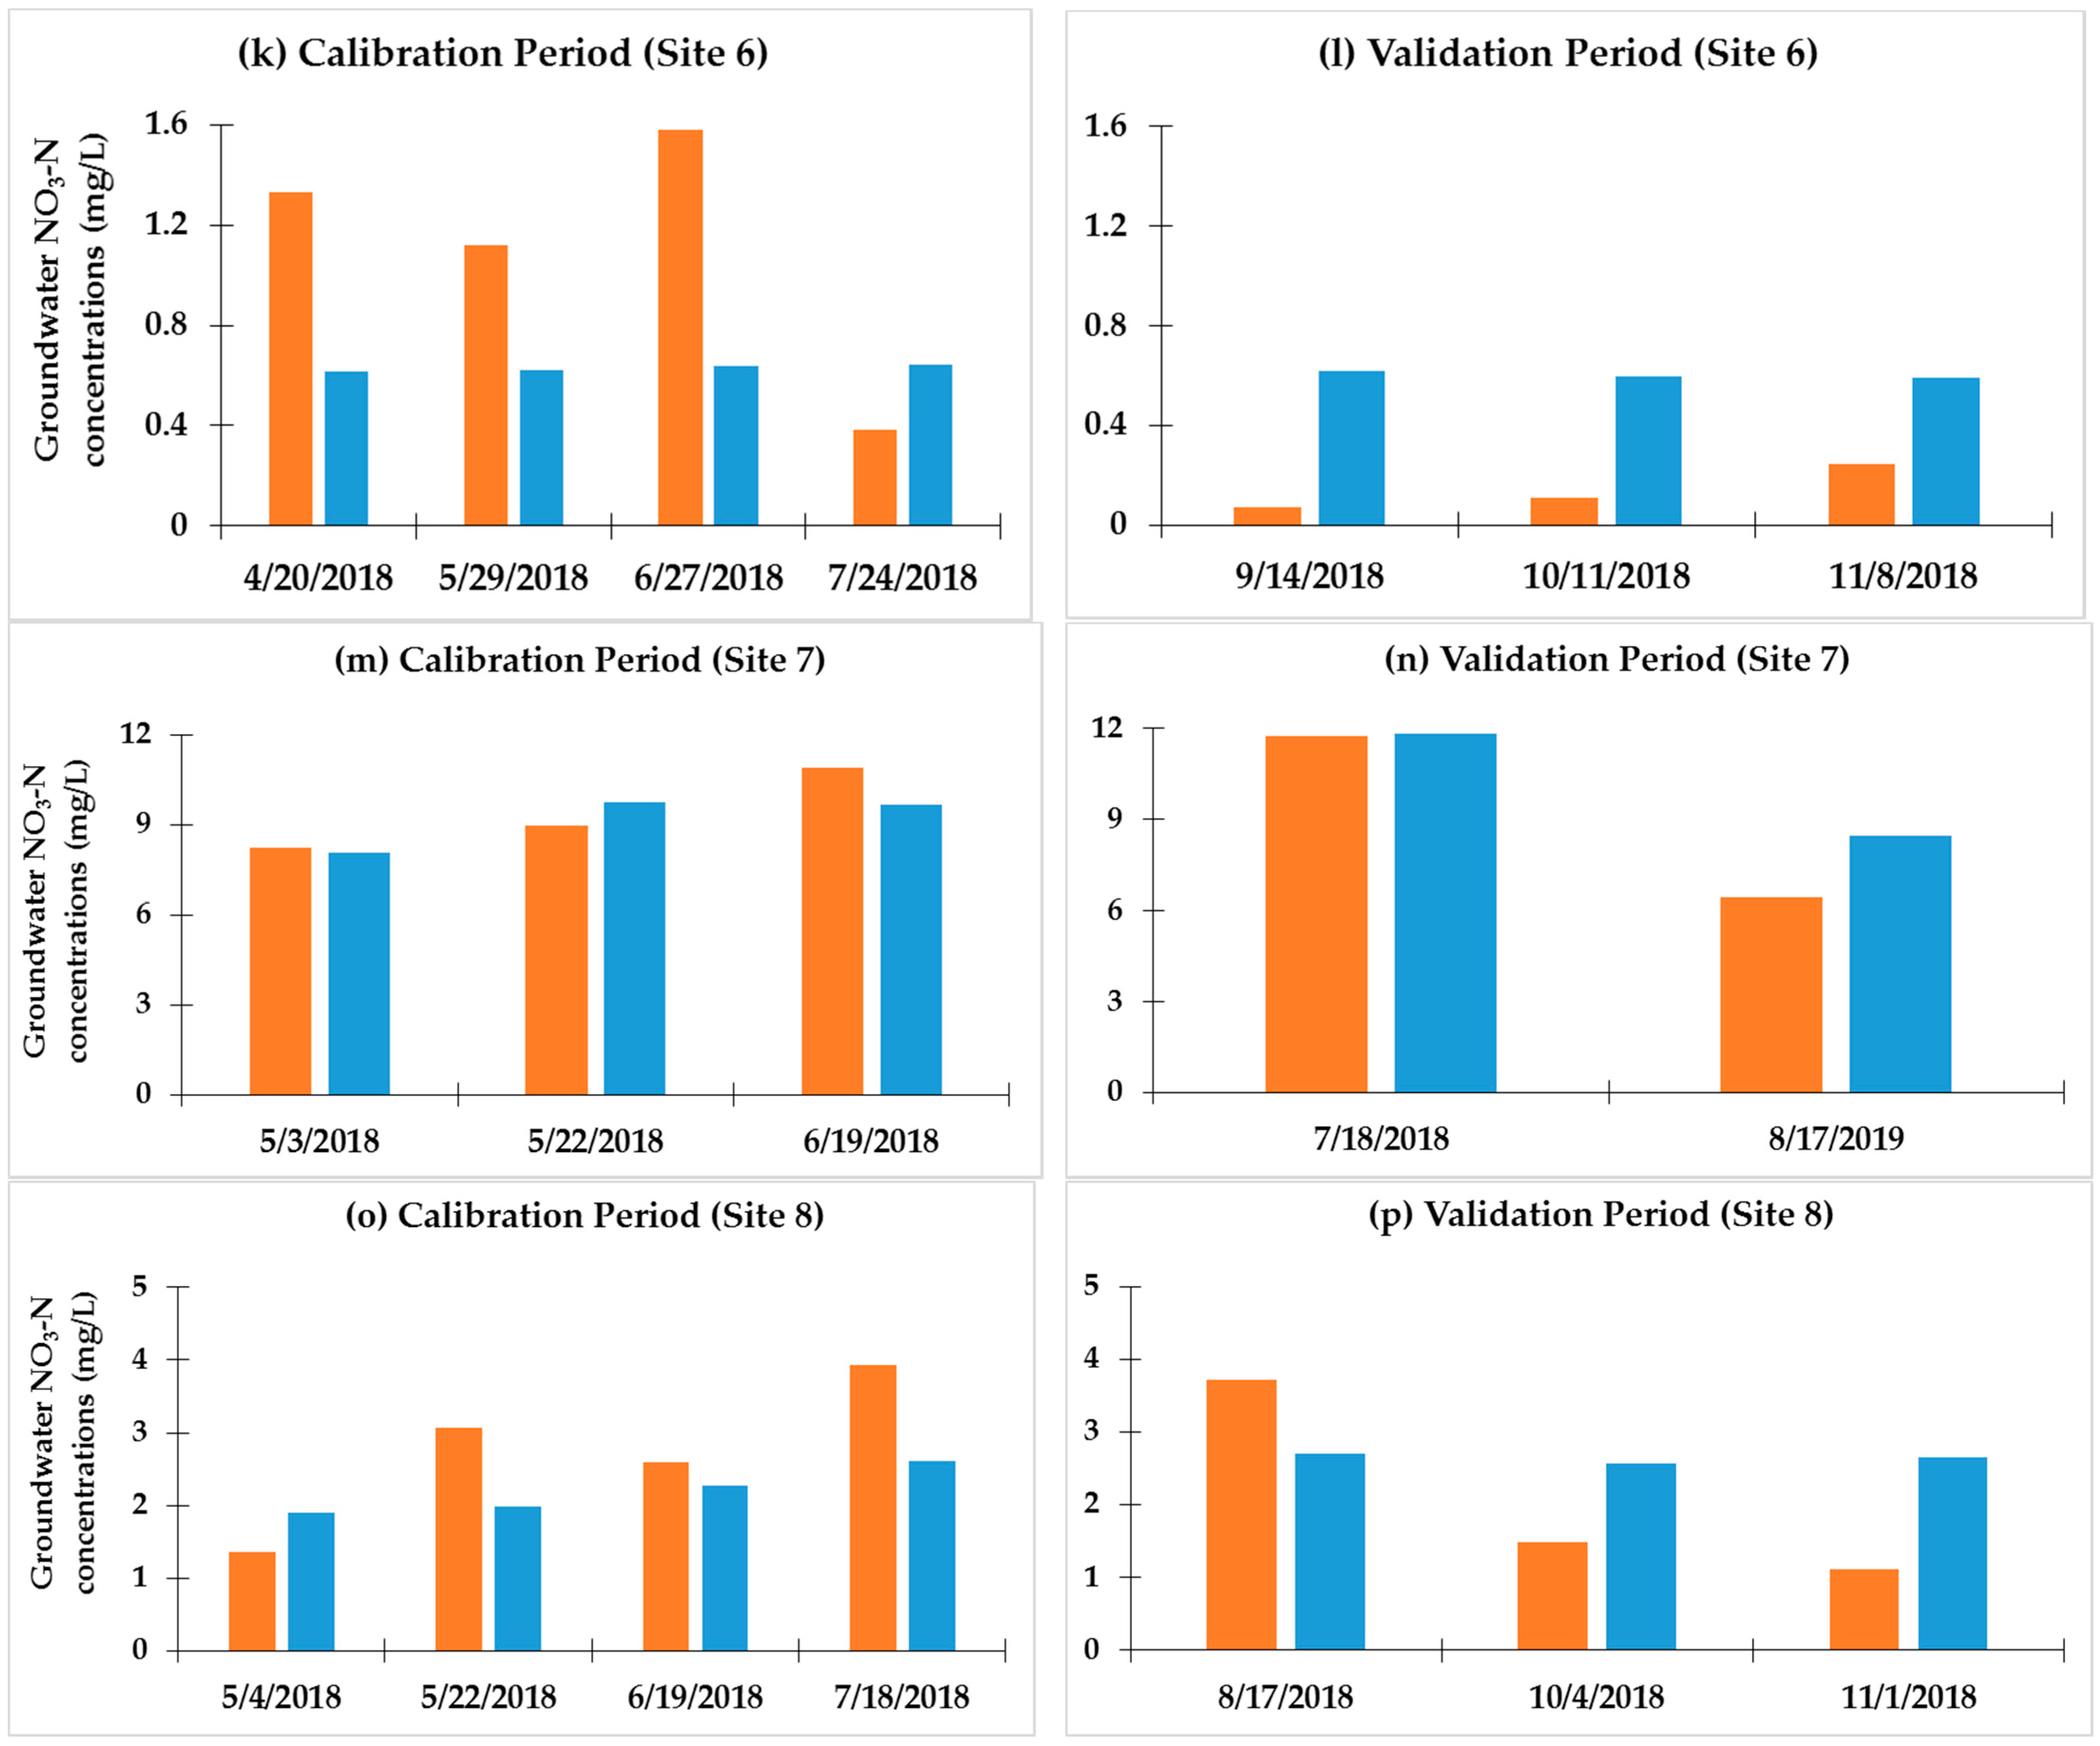
- After the hydrologic calibration, the litter and soil carbon and nitrogen pools needed to be stabilized. Otherwise REMM might calculate irrational drop in soil organic carbon and associated high N mineralization. Followed by [64], several 35-year simulations (a period selected based on available local historical weather data) were performed by varying percentage of active, slow, and passive pools. Using the initial residue and humus pools, simulations were run and the carbon and nitrogen pools at the end of the period were then used as initial pool values for new simulations. The model was again rerun for another 35-year period which helped to stabilize the carbon and nitrogen pools. After stabilizing these pools, the denitrification rate constant (Kd) was modified to improve the goodness-of-fit between simulated and measured NO3-N concentrations in groundwater. The calibrated soil physical buffer inputs, and calibrated Kd inputs are available in Supplemental Tables S1 and S2, respectively.
- The calibrated model that achieved the best goodness of fit with observed conditions for both WTDs and groundwater NO3-N concentrations had previously been saved. All the calibrated parameters were used without further changes to validate the model for the validation period. Model assessment guidelines defined in Section 2.4 were used to judge goodness of fit for WTDs and groundwater NO3-N concentrations in both calibration and validation phases.
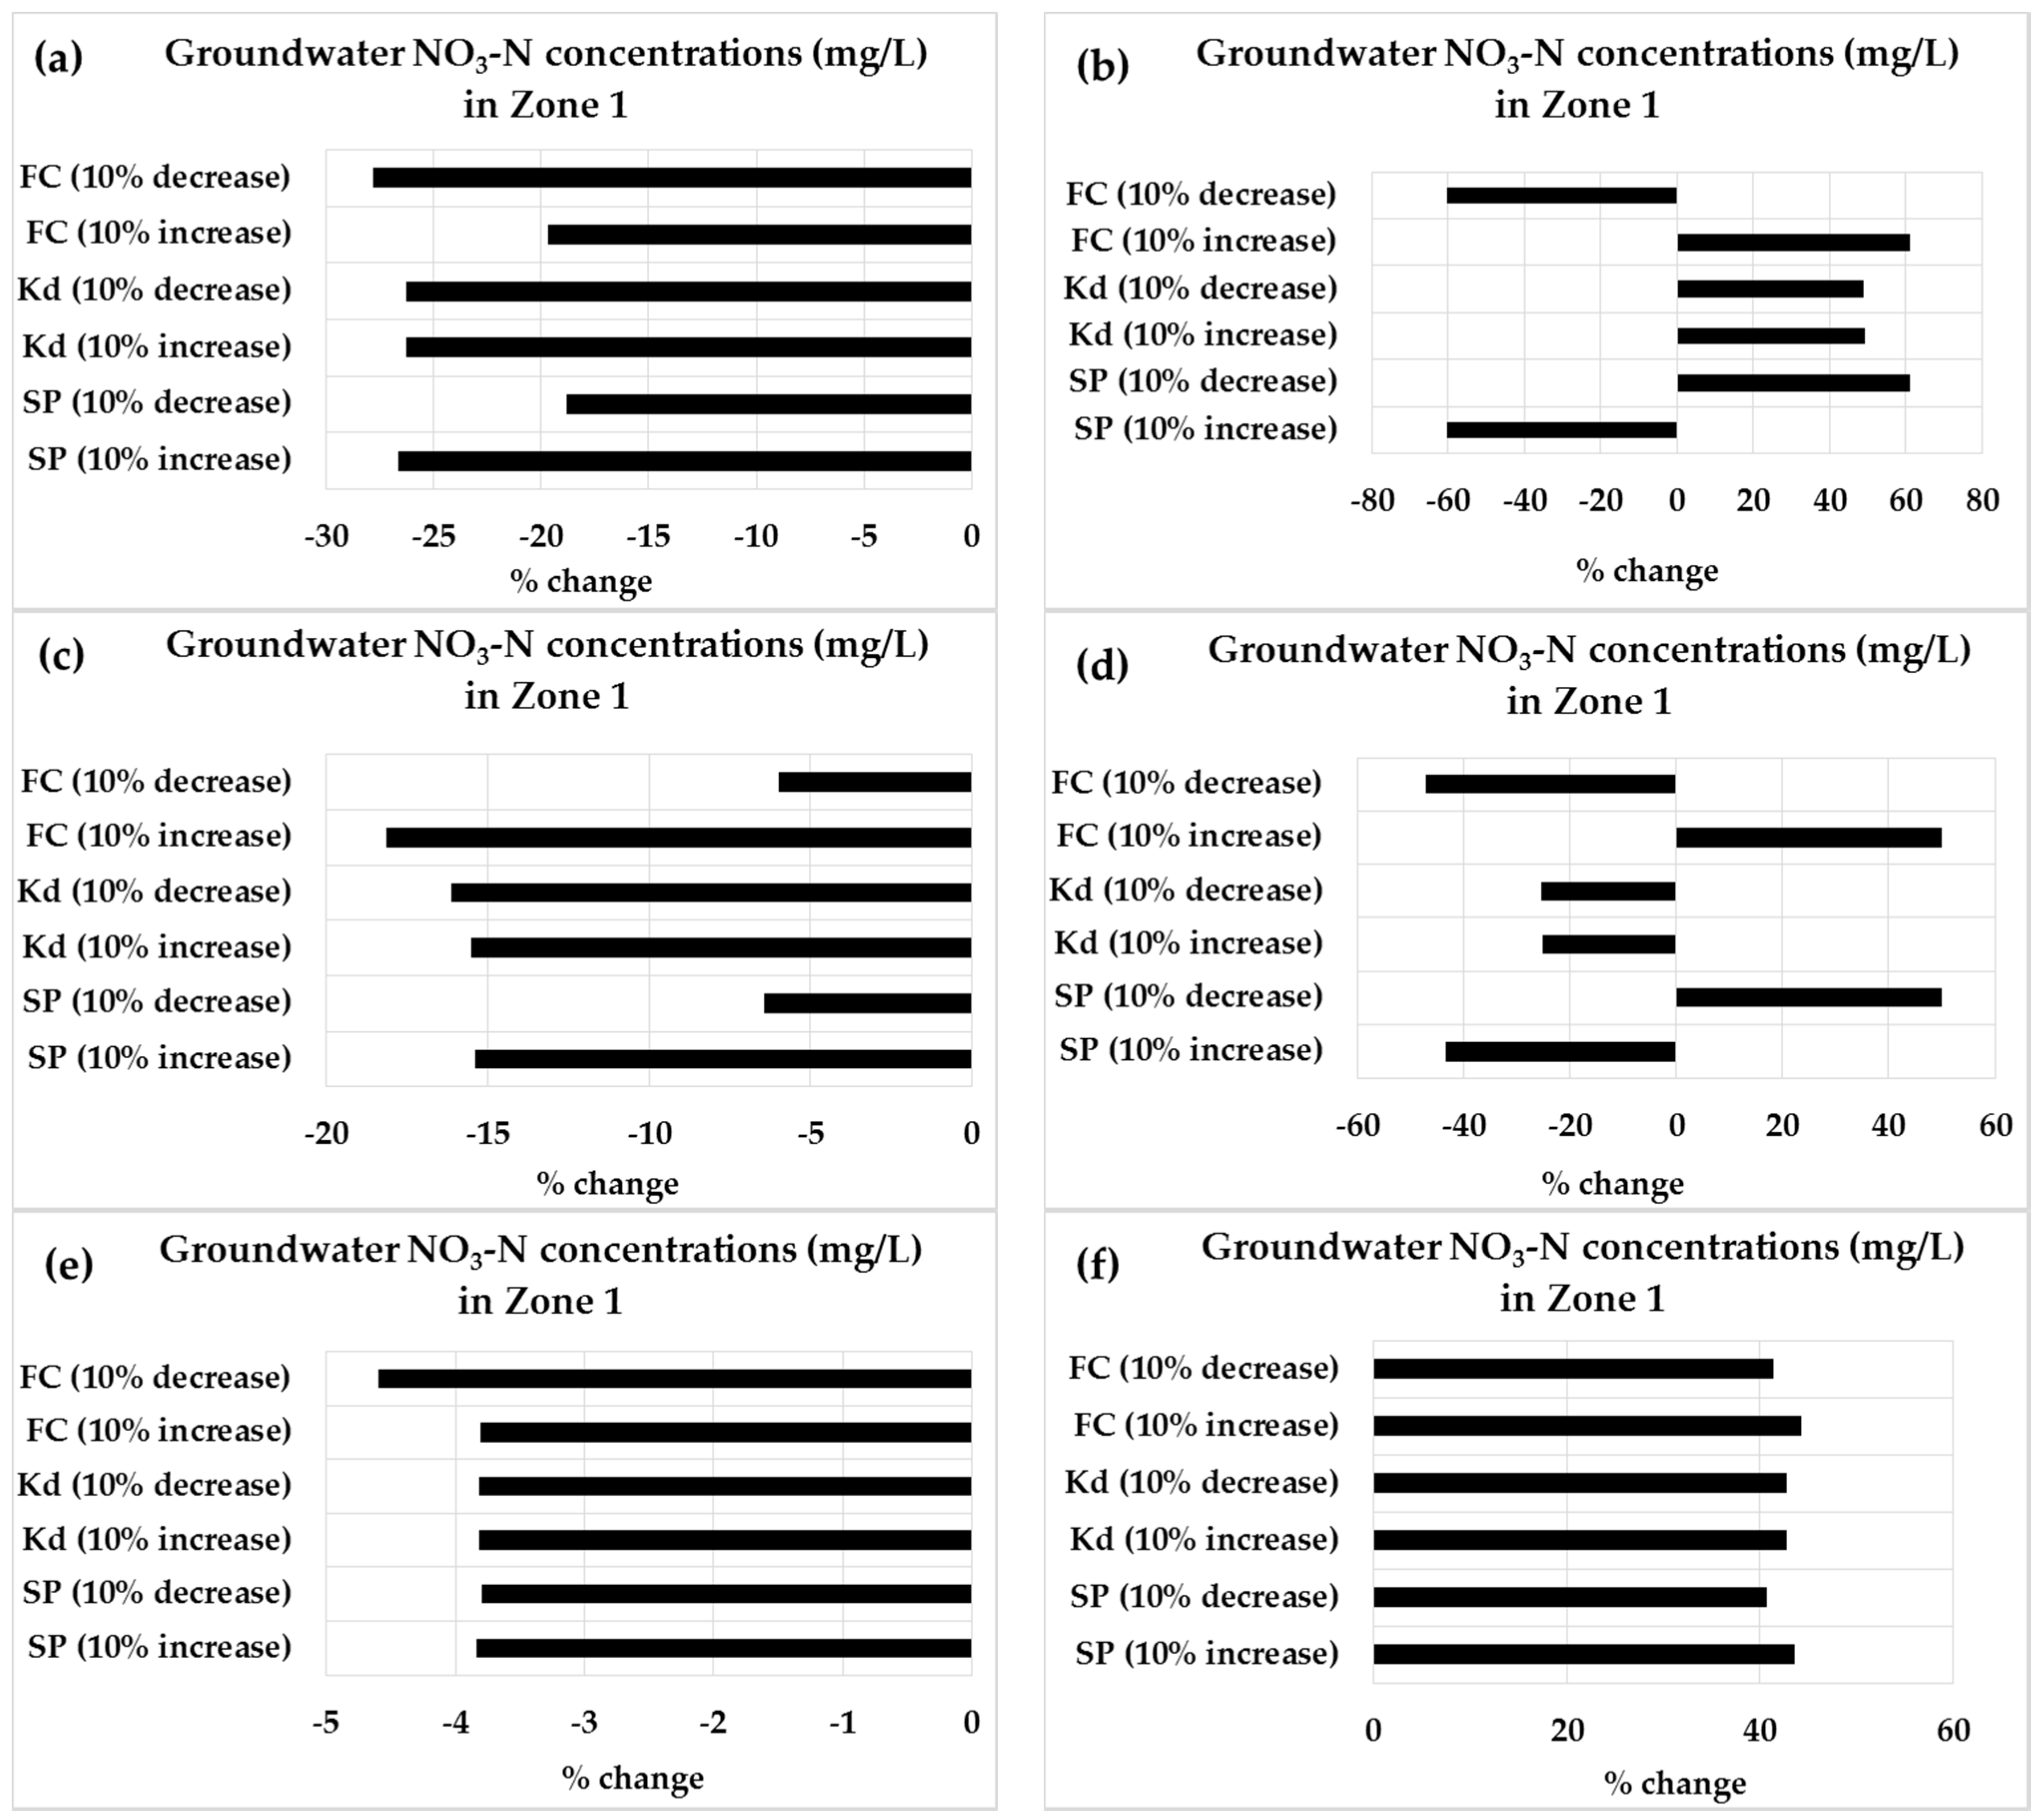
- Sensitivity analyses were performed to determine the effects of changing a number of key parameters associated with plant growth, nutrient cycling, surface runoff, and soil physical properties for REMM’s hydrological and nutrient simulation in Zone 1. We evaluated the sensitivity value of the most sensitive parameters (soil porosity, field capacity, wilting point) used for WTD estimation. In addition, we also evaluated the sensitivity value of the most sensitive parameters (soil porosity, field capacity, Kd) used for ground water nitrate concentration estimation. Each parameter was changed by +10% and −10% from the values used as the best estimates for each riparian site during calibration as described in [15]. Field capacity was always kept less than soil porosity during the change of these parameters. We utilized the integration of a local method into a global sensitivity method (the random one-factor-at-a-time) design proposed by [65]. This method consists of repetitions of a local method whereby the derivatives are calculated for each parameter by adding a small change to the parameter. The change in model outcome can then be measured by some lumped measure such as total mass export, sum of squares error between modeled and observed values or sum of absolute errors. The following equation has been used to perform sensitivity test for each parameter change—
3. Results
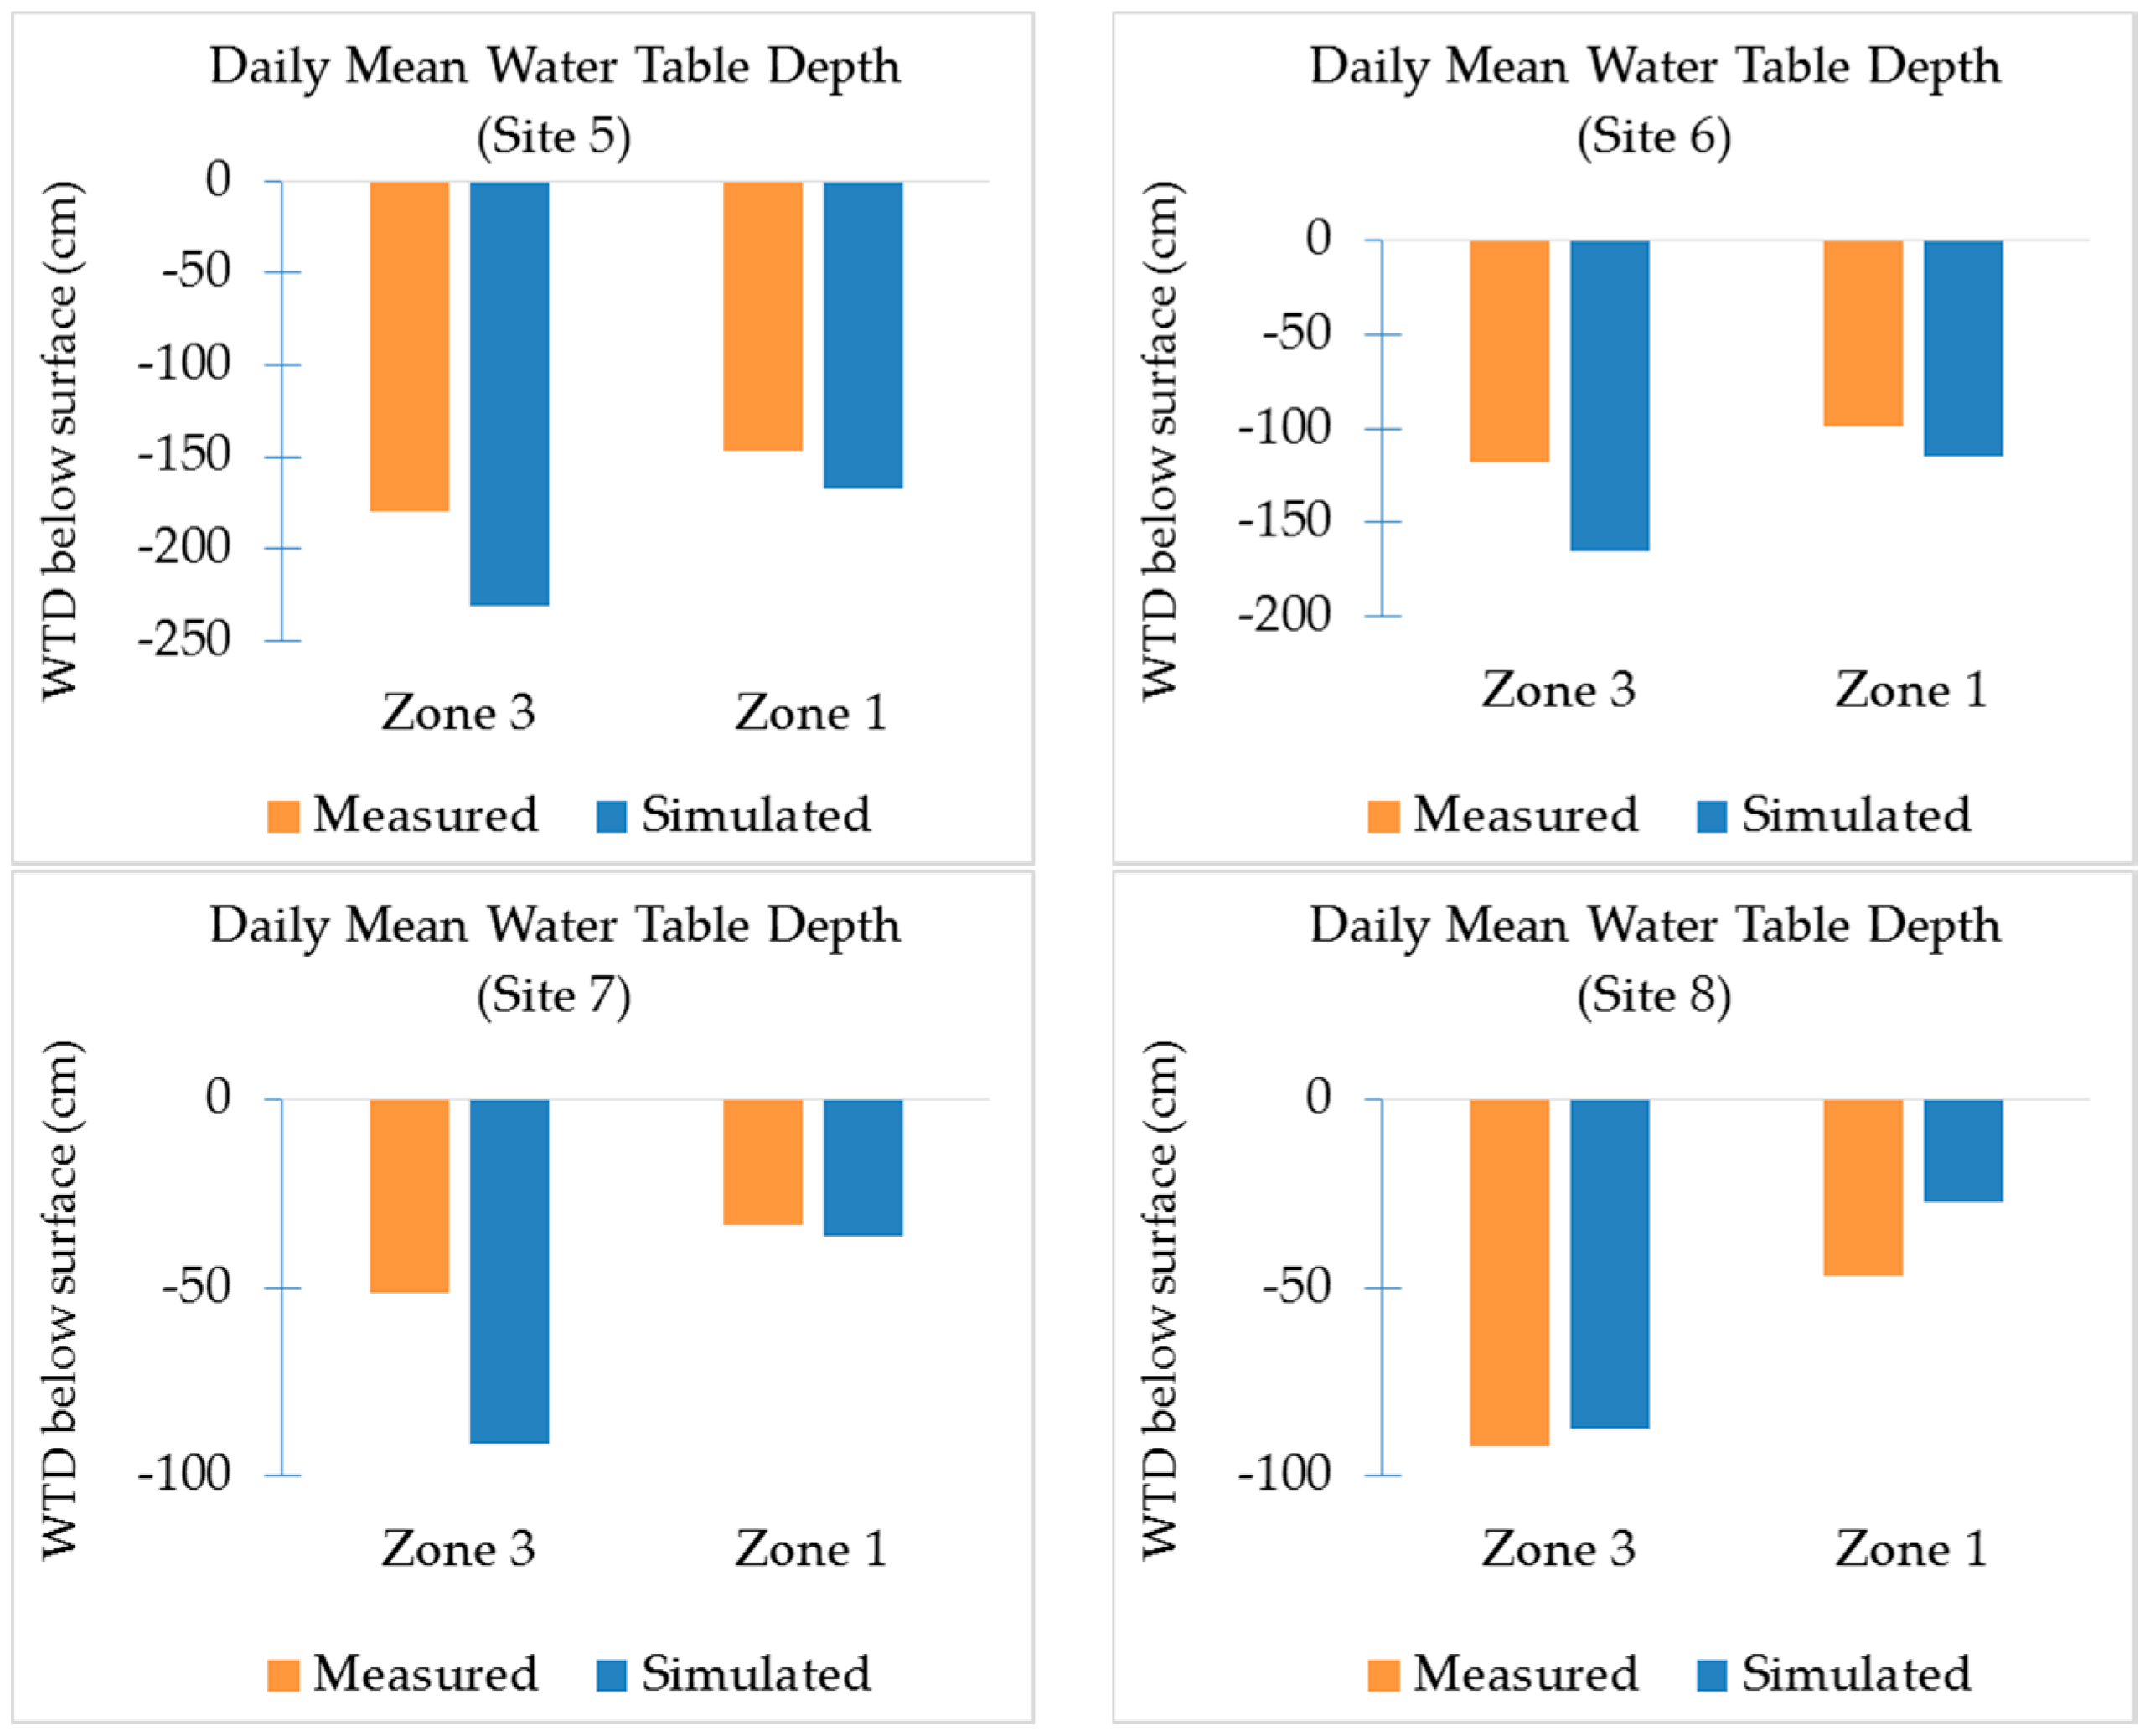
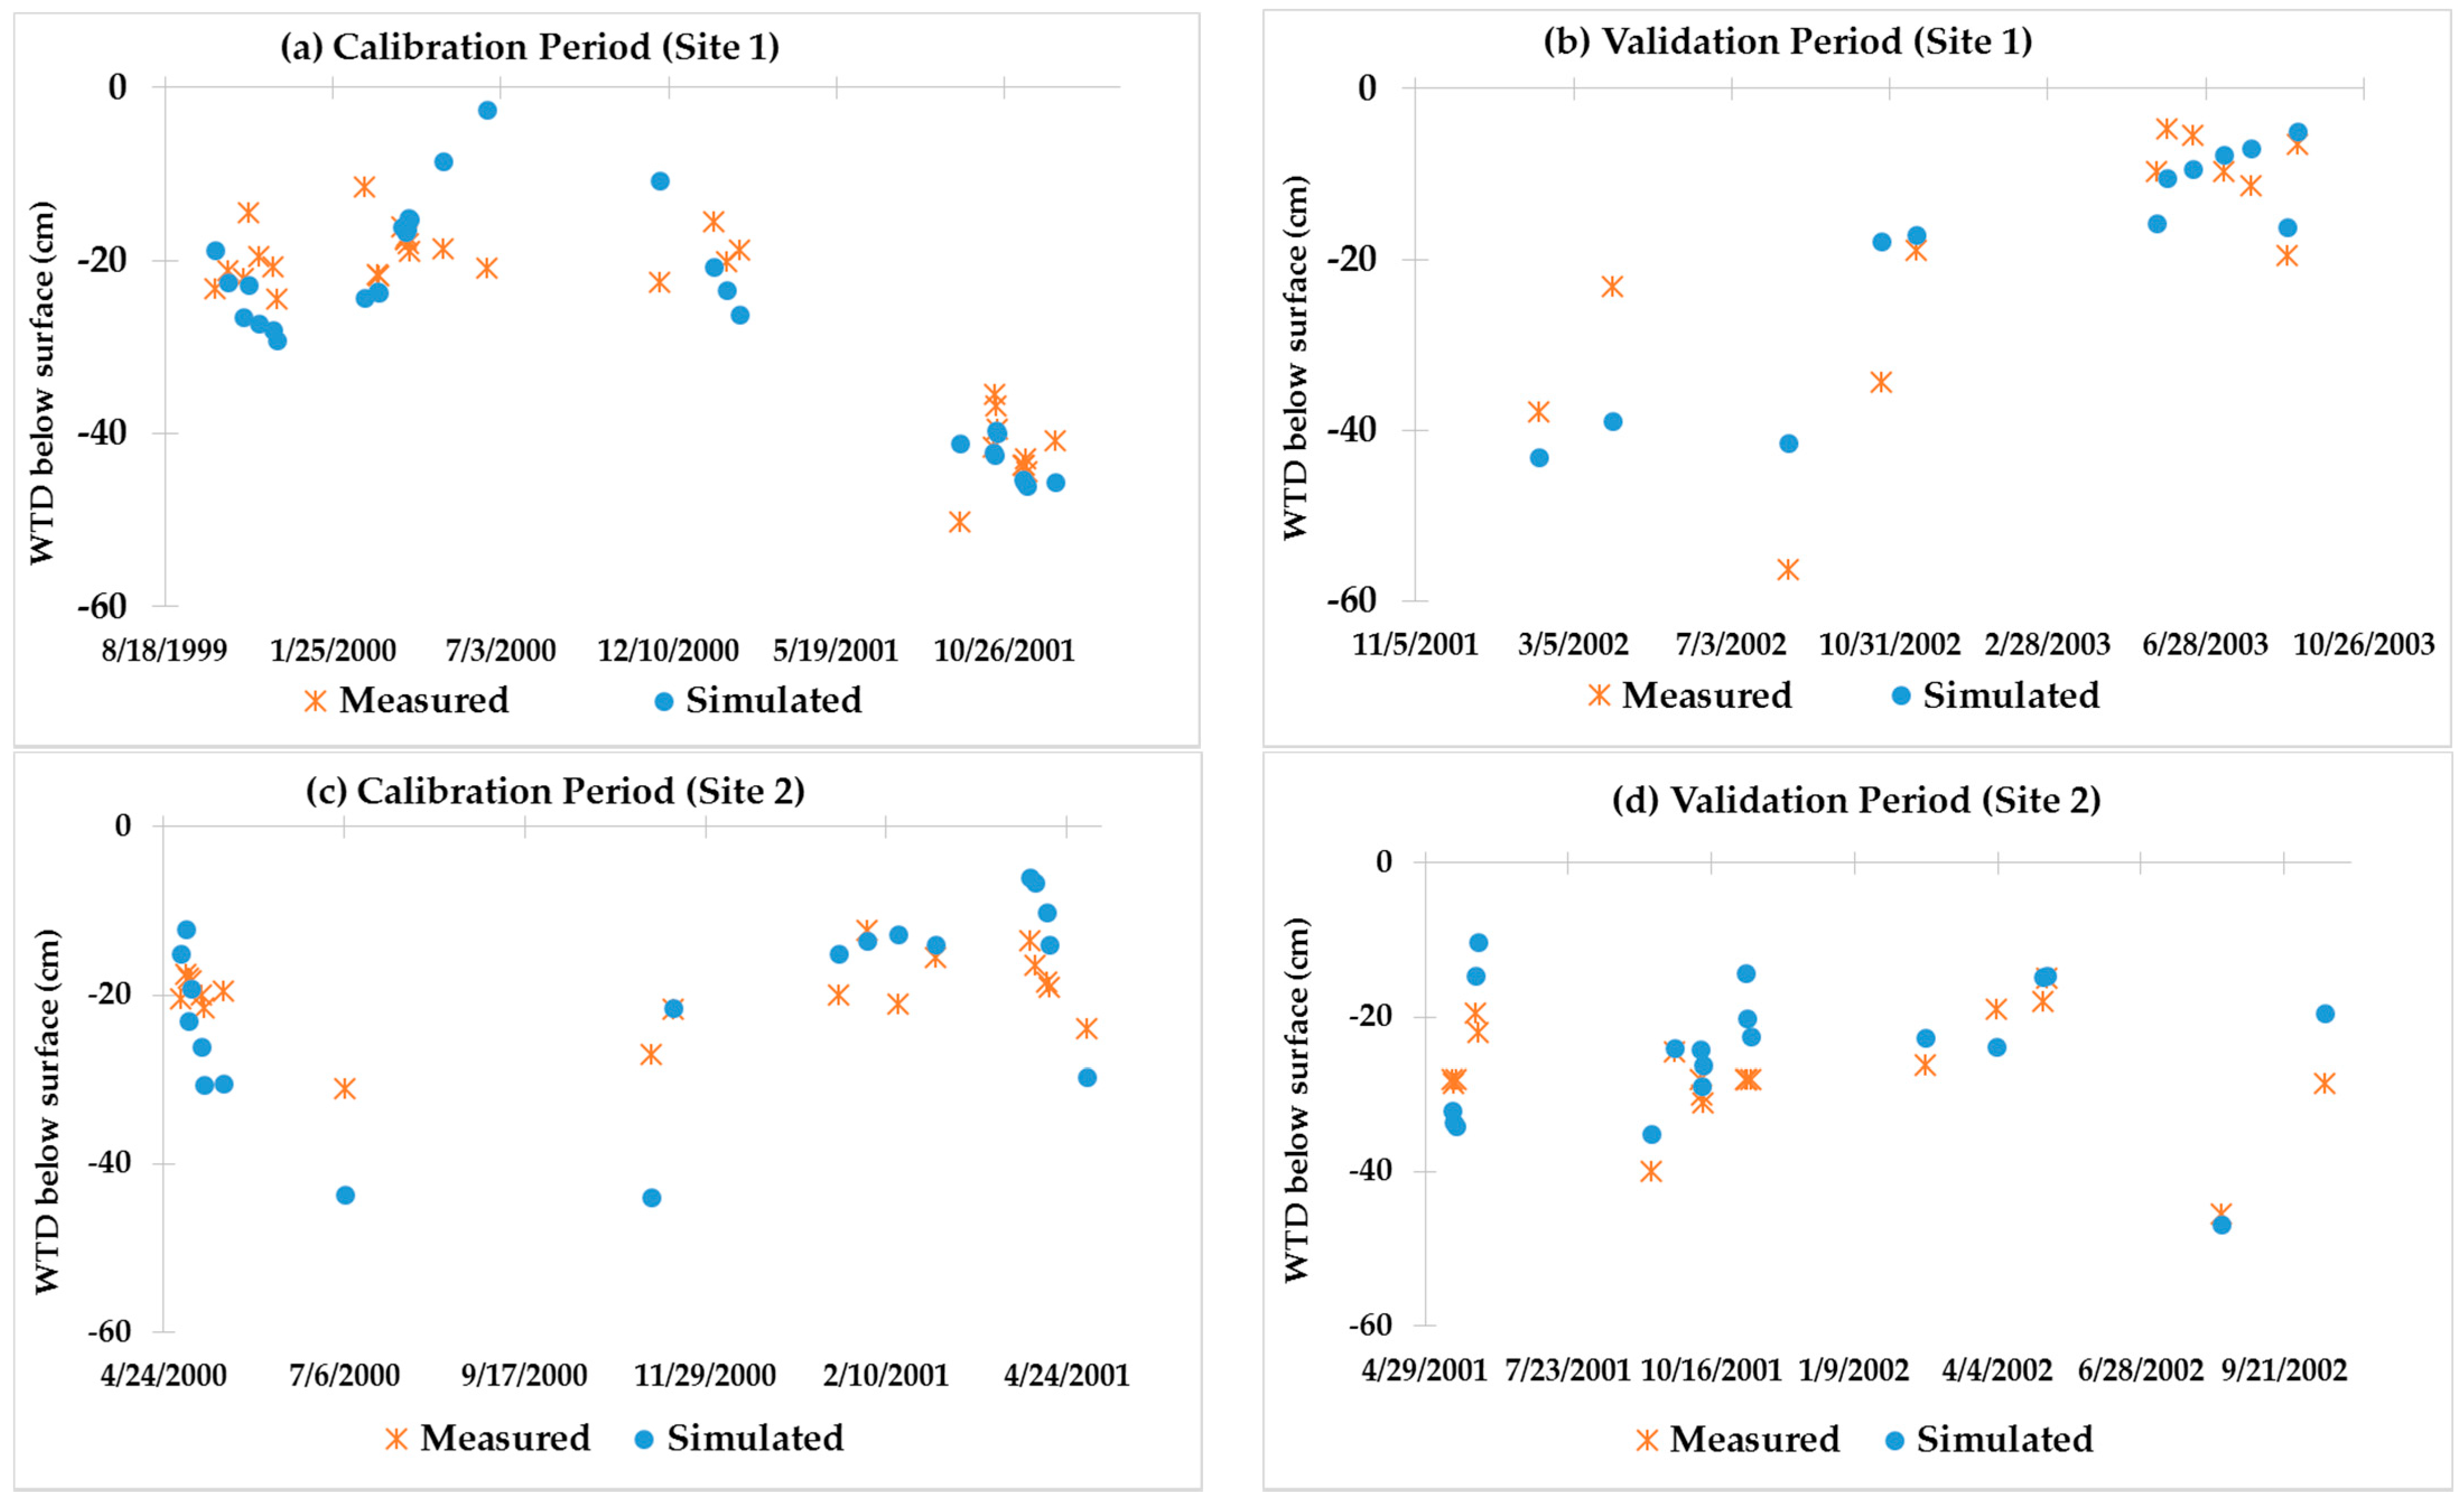
3.1. Water Table Depths Calibration and Validation
3.2. Groundwater NO3-N Concentrations Calibration and Validation
3.3. Parameter Sensitivity Analysis for Water Table Depths and Groundwater NO3-N Concentrations Simulation
4. Discussion
5. Conclusions
Supplementary Materials
Author Contributions
Funding
Institutional Review Board Statement
Informed Consent Statement
Data Availability Statement
Acknowledgments
Conflicts of Interest
References
- Groffman, P.M.; Gold, A.J.; Addy, K. Nitrous Oxide Production in Riparian Zones and its Importance to National Emission Inventories. Chemosphere Glob. Chang. Sci. 2000, 2, 291–299. [Google Scholar] [CrossRef]
- Jacinthe, P.; Groffman, P.M.; Gold, A.J. Dissolved Organic Carbon Dynamics in a Riparian Aquifer: Effects of Hydrology and Nitrate Enrichment. J. Environ. Qual. 2003, 32, 1365–1374. [Google Scholar] [CrossRef]
- Vidon, P.; Allan, C.; Burns, D.; Duval, T.P.; Gurwick, N.; Inamdar, S.; Lowrance, R.; Okay, J.; Scott, D.; Sebestyen, S. Hot Spots and Hot Moments in Riparian Zones: Potential for Improved Water Quality Management 1. JAWRA J. Am. Water Resour. Assoc. 2010, 46, 278–298. [Google Scholar] [CrossRef]
- Welsch, D.J. Riparian Forest Buffers: Function and Design for Protection and Enhancement of Water Resources; US Department of Agriculture, Forest Service, Northeastern Area, State & Private Forestry: Broomall, PA, USA, 1991.
- Dosskey, M.G. Toward Quantifying Water Pollution Abatement in Response to Installing Buffers on Crop Land. Environ. Manag. 2001, 28, 577–598. [Google Scholar] [CrossRef] [PubMed]
- Kellogg, D.Q.; Gold, A.J.; Cox, S.; Addy, K.; August, P.V. A Geospatial Approach for Assessing Denitrification Sinks within Lower-Order Catchments. Ecol. Eng. 2010, 36, 1596–1606. [Google Scholar] [CrossRef]
- Gold, A.J.; Groffman, P.M.; Addy, K.; Kellogg, D.Q.; Stolt, M.; Rosenblatt, A.E. Landscape Attributes as Controls on Groithd Water Nitrate Removal Capacity of Riparian Zones 1. JAWRA J. Am. Water Resour. Assoc. 2001, 37, 1457–1464. [Google Scholar] [CrossRef]
- Hill, A.R. Stream Chemistry and Riparian Zones. In Streams Ground Waters; Jones, J.B., Mulholland, P.J., Eds.; Academic Press: San Diego, CA, USA, 2000; pp. 83–110. [Google Scholar]
- Lowrance, R.; Altier, L.S.; Newbold, J.D.; Schnabel, R.R.; Groffman, P.M.; Denver, J.M.; Correll, D.L.; Gilliam, J.W.; Robinson, J.L.; Brinsfield, R.B. Water Quality Functions of Riparian Forest Buffers in Chesapeake Bay Watersheds. Environ. Manag. 1997, 21, 687–712. [Google Scholar] [CrossRef]
- Vidon, P.G.; Hill, A.R. Landscape Controls on Nitrate Removal in Stream Riparian Zones. Water Resour. Res. 2004, 40, 1–14. [Google Scholar] [CrossRef]
- Kellogg, D.Q.; Gold, A.J.; Groffman, P.M.; Addy, K.; Stolt, M.H.; Blazejewski, G. In Situ Ground Water Denitrification in Stratified, Permeable Soils Underlying Riparian Wetlands. J. Environ. Qual. 2005, 34, 524–533. [Google Scholar] [CrossRef] [PubMed]
- Inamdar, S.P.; Sheridan, J.M.; Williams, R.G.; Bosch, D.D.; Lowrance, R.R.; Altier, L.S.; Thomas, D.L. Riparian Ecosystem Management Model (REMM): I. Testing of the Hydrologic Component for a Coastal Plain Riparian System. Trans. ASAE 1999, 42, 1679–1690. [Google Scholar] [CrossRef]
- Rosenblatt, A.E.; Gold, A.J.; Stolt, M.H.; Groffman, P.M.; Kellogg, D.Q. Identifying Riparian Sinks for Watershed Nitrate using Soil Surveys. J. Environ. Qual. 2001, 30, 1596–1604. [Google Scholar] [CrossRef] [PubMed]
- Vidon, P.G.; Hill, A.R. A Landscape-based Approach to Estimate Riparian Hydrological and Nitrate Removal Functions 1. JAWRA J. Am. Water Resour. Assoc. 2006, 42, 1099–1112. [Google Scholar] [CrossRef]
- Lowrance, R.; Altier, L.S.; Williams, R.G.; Inamdar, S.P.; Sheridan, J.M.; Bosch, D.D.; Hubbard, R.K.; Thomas, D.L. REMM: The Riparian Ecosystem Management Model. J. Soil Water Conserv. 2000, 55, 27–34. [Google Scholar]
- Altier, L.S.; Lowrance, R.; Williams, R.G.; Inamdar, S.P.; Bosch, D.D.; Sheridan, J.M.; Hubbard, R.K.; Thomas, D.L. Riparian Ecosystem Management Model: Simulator for Ecological Processes in Riparian Zones. Conserv. Res. Rep. 2002, 46, 1691. [Google Scholar]
- Mayer, P.M.; Reynolds, S.K., Jr.; McCutchen, M.D.; Canfield, T.J. Meta-analysis of Nitrogen Removal in Riparian Buffers. J. Environ. Qual. 2007, 36, 1172–1180. [Google Scholar] [CrossRef] [PubMed]
- Hassanzadeh, Y.T.; Vidon, P.G.; Gold, A.J.; Pradhanang, S.M.; Addy Lowder, K. RZ-TRADEOFF: A New Model to Estimate Riparian Water and Air Quality Functions. Water 2019, 11, 769. [Google Scholar] [CrossRef]
- Hassanzadeh, Y.T.; Vidon, P.G.; Gold, A.J.; Pradhanang, S.M.; Addy, K. A New Approach to Generalizing Riparian Water and Air Quality Function Across Regions. Environ. Monit. Assess. 2019, 191, 1–12. [Google Scholar] [CrossRef]
- Alberta Environment. Stepping Back from the Water: A Beneficial Management Practices Guide for New Development Near Water Bodies in Alberta’s Settled Region. 2012. Available online: http://environment.gov.ab.ca/info/library/8554.pdf (accessed on 16 January 2017).
- Santangelo, T. Development of a Spatially Distributed Model for Estimating Nitrogen Removal in Forested Riparian Buffers. Master’s Thesis, University of Delaware, Newark, DE, USA, 2016. [Google Scholar]
- Dwivedi, D.; Arora, B.; Steefel, C.I.; Dafflon, B.; Versteeg, R. Hot Spots and Hot Moments of Nitrogen in a Riparian Corridor. Water Resour. Res. 2018, 54, 205–222. [Google Scholar] [CrossRef]
- Dosskey, M.G.; Qiu, Z. Comparison of Indexes for Prioritizing Placement of Water Quality Buffers in Agricultural Watersheds 1. JAWRA J. Am. Water Resour. Assoc. 2011, 47, 662–671. [Google Scholar] [CrossRef]
- Hill, A.R.; Devito, K.J.; Vidon, P.G. Long-Term Nitrate Removal in a Stream Riparian Zone. Biogeochemistry 2014, 121, 425–439. [Google Scholar] [CrossRef]
- Baker, M.E.; Wiley, M.J.; Seelbach, P.W. Gis-based Hyirologic Modeling of Riparian Areas: Implications for Stream Water Quality 1. JAWRA J. Am. Water Resour. Assoc. 2001, 37, 1615–1628. [Google Scholar] [CrossRef]
- Groh, T.A.; Isenhart, T.M.; Schultz, R.C. Long-Term Nitrate Removal in Three Riparian Buffers: 21 Years of Data from the Bear Creek Watershed in Central Iowa, USA. Sci. Total. Environ. 2020, 740, 140114. [Google Scholar] [CrossRef]
- Hill, A.R. Nitrate Removal in Stream Riparian Zones. J. Environ. Qual. 1996, 25, 743–755. [Google Scholar] [CrossRef]
- Groffman, P.M.; Gold, A.J.; Simmons, R.C. Nitrate Dynamics in Riparian Forests: Microbial Studies. J. Environ. Qual. 1992, 21, 666–671. [Google Scholar] [CrossRef]
- Graff, C.D.; Sadeghi, A.M.; Lowrance, R.R.; Williams, R.G. Quantifying the Sensitivity of the Riparian Ecosystem Management Model (REMM) to Changes in Climate and Buffer Characteristics Common to Conservation Practices. Trans. ASAE 2005, 48, 1377–1387. [Google Scholar] [CrossRef]
- Allison, B.E.; Fatula, S.M.; Wolanski, D.P. Evaluating Riparian Buffers for Nonpoint Source Pollution Control in an Urban Setting using the Riparian Ecosystem Management Model, REMM. In Hydrology and Management of Forested Wetlands, Proceedings of the International Conference, New Bern, NC, USA, 8–12 April 2006; American Society of Agricultural & Biological Engineers: St. Joseph, MI, USA, 2006; p. 18. [Google Scholar]
- Langendoen, E.J.; Richard Lowrance, R.; Simon, A. Assessing the Impact of Riparian Processes on Streambank Stability. Ecohydrol. Ecosyst. Land Water Process. Interact. Ecohydrogeomorphol. 2009, 2, 360–369. [Google Scholar] [CrossRef]
- Tilak, A.S.; Youssef, M.A.; Burchell, M.R., II; Lowrance, R.R.; Williams, R.G. Testing the Riparian Ecosystem Management Model (REMM) on a Riparian Buffer with Dilution from Deep Groundwater. Trans. ASABE 2017, 60, 377–392. [Google Scholar]
- Tilak, A.S.; Burchell, M.R.; Youssef, M.A.; Lowrance, R.R.; Williams, R.G. Field Testing the Riparian Ecosystem Management Model on a Riparian Buffer in the North Carolina Upper Coastal Plain. JAWRA J. Am. Water Resour. Assoc. 2014, 50, 665–682. [Google Scholar] [CrossRef]
- Dukes, M.D.; Evans, R.O. Riparian ecosystem management model: Hydrology performance and sensitivity in the North Carolina middle coastal plain. Trans. ASAE 2003, 46, 1567. [Google Scholar] [CrossRef]
- Inamdar, S.P.; Lowrance, R.R.; Altier, L.S.; Williams, R.G.; Hubbard, R.K. Riparian Ecosystem Management Model (REMM): II. Testing of the Water Quality and Nutrient Cycling Component for a Coastal Plain Riparian System. Trans. ASAE 1999, 42, 1691–1707. [Google Scholar] [CrossRef]
- Bhat, S.; Hatfield, K.; Jacobs, J.M.; Lowrance, R.; Williams, R. Surface Runoff Contribution of Nitrogen during Storm Events in a Forested Watershed. Biogeochemistry 2007, 85, 253–262. [Google Scholar] [CrossRef]
- Todd, A.H. Riparian Ecosystems and Buffers: Working at the Water’s Edge. Water Resour. IMPACT 2008, 10, 3–5. [Google Scholar]
- Williams, C.O.; Lowrance, R.; Potter, T.; Bosch, D.D.; Strickland, T. Atrazine Transport within a Coastal Zone in Southeastern Puerto Rico: A Sensitivity Analysis of an Agricultural Field Model and Riparian Zone Management Model. Environ. Model. Assess. 2016, 21, 751–761. [Google Scholar] [CrossRef]
- Zhang, C.; Li, S.; Qi, J.; Xing, Z.; Meng, F. Assessing Impacts of Riparian Buffer Zones on Sediment and Nutrient Loadings into Streams at Watershed Scale using an Integrated REMM-SWAT Model. Hydrol. Process. 2017, 31, 916–924. [Google Scholar] [CrossRef]
- Liu, C.; Wu, J.; Clausen, J.; Yang, X. Assessment of the Effects of Riparian Buffer Zones on the Water Quality in the Jinghe Catchment using the AnnAGNPS and REMM Models. In Proceedings of the ASABE Annual International Meeting, Washington, DC, USA, 16–19 July 2017; American Society of Agricultural & Biological Engineers: St. Joseph, MI, USA; p. 1. [Google Scholar]
- Cartographic Boundary Files. Available online: https://www.census.gov/geographies/mapping-files/time-series/geo/carto-boundary-file.html (accessed on 6 October 2015).
- Rivers and Streams: RI Integrated Water Quality Monitoring Assessment 2012. Available online: https://www.rigis.org/datasets/rivers-and-streams-ri-integrated-water-quality-monitoring-assessment-2012/explore?location=41.593807%2C-71.483873%2C9.85 (accessed on 3 January 2017).
- Johnson, T.E.; McNair, J.N.; Srivastava, P.; Hart, D.D. Stream Ecosystem Responses to Spatially Variable Land Cover: An Empirically Based Model for Developing Riparian Restoration Strategies. Freshwat. Biol. 2007, 52, 680–695. [Google Scholar] [CrossRef]
- Yongping, Y.; Bingner, R.; Williams, R.; Lowrance, R.; Bosch, D.; Sheridan, J. Integration of the models of AnnAGNPS and REMM to assess riparian buffer system for sediment reduction. Int. J. Sediment Res. 2007, 22, 60–69. [Google Scholar]
- Tamanna, M.; Pradhanang, S.M.; Gold, A.J.; Addy, K.; Vidon, P.G.; Bingner, R.L. Evaluation of AnnAGNPS Model for Runoff Simulation on Watersheds from Glaciated Landscape of USA Midwest and Northeast. Water 2020, 12, 3525. [Google Scholar] [CrossRef]
- Bingner, R.L.; Theurer, F.D. AnnAGNPS: Estimating Sediment Yield by Particle Size for Sheet and Rill Erosion. In Proceedings of the 7th Interagency Sedimentation Conference, Reno, NV, USA, 25–29 March 2001. [Google Scholar]
- Geter, W.F.; Theurer, F.D. AnnAGNPS-RUSLE Sheet and Rill Erosion. In Proceedings of the First Federal Interagency Hydrologic Modeling Conference, Las Vegas, NV, USA, 19–23 April 1998; pp. 19–23. [Google Scholar]
- Parajuli, P.B.; Nelson, N.O.; Frees, L.D.; Mankin, K.R. Comparison of AnnAGNPS and SWAT Model Simulation Results in USDA-CEAP Agricultural Watersheds in South-central Kansas. Hydrol. Process. Int. J. 2009, 23, 748–763. [Google Scholar] [CrossRef]
- Pradhanang, S.M. Monitoring and Modeling of Water Quality in Streams of Skaneateles Lake Watershed, NY. Ph.D. Thesis, State University of New York College of Environmental Science and Forestry, New York, NY, USA, 2010. [Google Scholar]
- Pradhanang, S.M.; Briggs, R.D. Effects of Critical Source Area on Sediment Yield and Streamflow. Water Environ. J. 2014, 28, 222–232. [Google Scholar] [CrossRef]
- TNM Download (vs.2.0). Available online: https://apps.nationalmap.gov/downloader/#/ (accessed on 24 January 2017).
- USDA Natutal Resources Conservation Service Soils. Available online: https://www.nrcs.usda.gov/wps/portal/nrcs/detail/soils/survey/tools/?cid=nrcseprd1407024 (accessed on 7 February 2017).
- National Land Cover Database. Available online: https://www.usgs.gov/centers/eros/science/national-land-cover-database?qt-science_center_objects=0#qt-science_center_objects (accessed on 7 February 2017).
- Dile, Y.T.; Srinivasan, R. Evaluation of CFSR Climate Data for Hydrologic Prediction in Data-scarce Watersheds: An Application in the Blue Nile River Basin. JAWRA J. Am. Water Resour. Assoc. 2014, 50, 1226–1241. [Google Scholar] [CrossRef]
- Fuka, D.R.; Walter, M.T.; MacAlister, C.; Degaetano, A.T.; Steenhuis, T.S.; Easton, Z.M. Using the Climate Forecast System Reanalysis as Weather Input Data for Watershed Models. Hydrol. Process. 2014, 28, 5613–5623. [Google Scholar] [CrossRef]
- Kim, I.; Hutchinson, S.L.; Hutchinson, J.S.; Young, C.B. Riparian Ecosystem Management Model: Sensitivity to Soil, Vegetation, and Weather Input Parameters 1. JAWRA J. Am. Water Resour. Assoc. 2007, 43, 1171–1182. [Google Scholar] [CrossRef]
- Southeast Watershed Research: Tifton, GA. Available online: https://www.ars.usda.gov/southeast-area/tifton-ga/southeast-watershed-research/research/models/remm-model/user-manual/ (accessed on 18 July 2016).
- Watson, T.K.; Kellogg, D.Q.; Addy, K.; Gold, A.J.; Stolt, M.H.; Donohue, S.W.; Groffman, P.M. Groundwater Denitrification Capacity of Riparian Zones in Suburban and Agricultural Watersheds 1. JAWRA J. Am. Water Resour. Assoc. 2010, 46, 237–245. [Google Scholar] [CrossRef]
- Addy, K.; Kellogg, D.Q.; Gold, A.J.; Groffman, P.M.; Ferendo, G.; Sawyer, C. In Situ Push–pull Method to Determine Ground Water Denitrification in Riparian Zones. J. Environ. Qual. 2002, 31, 1017–1024. [Google Scholar] [CrossRef]
- Tiedje, J.M. Denitrification. In Methods of Soil Analysis. Part 2: Chemical and Microbiological Properties; Page, A.L., Ed.; Agronomy Monographs Series; American Society of Agronomy: Madison, WI, USA, 1982; pp. 1011–1026. [Google Scholar]
- Nelson, W.M.; Gold, A.J.; Groffman, P.M. Spatial and Temporal Variation in Groundwater Nitrate Removal in a Riparian Forest. J. Environ. Qual. 1995, 24, 691–699. [Google Scholar] [CrossRef]
- Vidon, P.; Dosskey, M.G. Testing a Simple Field Method for Assessing Nitrate Removal in Riparian Zones 1. JAWRA J. Am. Water Resour. Assoc. 2008, 44, 523–534. [Google Scholar] [CrossRef][Green Version]
- Willmott, C.J. Some Comments on the Evaluation of Model Performance. Bull. Am. Meteorol. Soc. 1982, 63, 1309–1313. [Google Scholar] [CrossRef]
- Tilak, A.S. Modeling Groundwater Hydrology and Nitrate-Nitrogen (NO3-N) Dynamics of Two Riparian Buffers Located in the Upper Eastern Coastal Plain of North Carolina Using Riparian Ecosystem Management Model (REMM). Ph.D. Thesis, North Carolina State University, Raleigh, NC, USA, 2012. [Google Scholar]
- Morris, M.D. Factorial sampling plans for preliminary computational experiments. Technometrics 1991, 33, 161–174. [Google Scholar] [CrossRef]
- Tucker, M.A.; Thomas, D.L.; Bosch, D.D.; Vellidis, G. GIS-based coupling of GLEAMS and REMM hydrology: I. Development and sensitivity. Trans. ASAE 2000, 43, 1525. [Google Scholar] [CrossRef]
- Tucker, M.A.; Thomas, D.L.; Bosch, D.D.; Vellidis, G. GIS-based coupling of GLEAMS and REMM hydrology: II. Field test results. Trans. ASAE 2000, 43, 1535. [Google Scholar] [CrossRef]
- Linn, D.M.; Doran, J.W. Effect of water-filled pore space on carbon dioxide and nitrous oxide production in tilled and nontilled soils. Soil Sci. Soc. Am. J. 1984, 48, 1267–1272. [Google Scholar] [CrossRef]
- Heliotis, F.D.; DeWitt, C.B. Rapid water table responses to rainfall in a northern peatland ecosystem. JAWRA J. Am. Water Resour. Assoc. 1987, 23, 1011–1016. [Google Scholar] [CrossRef]




| Riparian Site | Geology | Soil | Land Cover |
|---|---|---|---|
| Site 1 | Outwash | Sandy loam | Agricultural |
| Site 2 | Outwash | Sandy loam | Forested |
| Site 3 | Outwash | Sandy loam | Agricultural |
| Site 4 | Outwash | Sandy loam | Agricultural |
| Site 5 | Outwash | Sandy loam | Agricultural |
| Site 6 | Outwash | Sandy loam | Agricultural |
| Site 7 | Outwash | Sandy loam | Agricultural |
| Site 8 | Outwash | Sandy loam | Agricultural |
| Riparian Site | Buffer Area (m2) | Buffer Length (m) | Riparian Zone Width (3,2, and 1) (m) | Zone Slope (%) | Manning’s n for Zone (3,2, and 1) | Soil (Zone 1) | Soil Drainage Class (Zone 1) | Geomorphology |
|---|---|---|---|---|---|---|---|---|
| Site 1 | 10,000 | 100 | 100 (33, 35, 32) | <3 | (0.046, 0.046, 0.046) | Sandy, mesic Aeric Endoaquept | somewhat poorly drained | Outwash |
| Site 2 | 1200 | 100 | 12 (4, 5, 3) | <3 | (0.074, 0.074, 0.012) | Sandy, mesic Terric Haplosaprist | somewhat poorly drained to very poorly drained | Outwash |
| Site 3 | 6000 | 100 | 60 (20, 20, 20) | <3 | (0.074, 0.074, 0.074) | Coarse-loamy Fluvaquentic Humaquept | very poorly drained | Alluvium |
| Site 4 | 6500 | 100 | 65 (21.67, 21.67, 21.67) | <3 | (0.074, 0.074, 0.012) | Sandy Typic Humaquept | very poorly drained | Alluvium |
| Site 5 | 3300 | 100 | 33 (11, 11, 11) | <3 | (0.046, 0.046, 0.046) | Coarse-loamy Fluvaquentic Humaquept | very poorly drained | Outwash |
| Site 6 | 3750 | 100 | 37.5 (12.5, 12.5, 12.5) | <3 | (0.046, 0.046, 0.046) | Sandy, mesic Terric Haplosaprist | somewhat poorly drained to very poorly drained | Outwash |
| Site 7 | 5800 | 100 | 58 (19.33, 19.33, 19.33) | <3 | (0.046, 0.046, 0.046) | Sandy, mesic Terric Haplosaprist | somewhat poorly drained to very poorly drained | Outwash |
| Site 8 | 15,600 | 100 | 156 (52, 52, 52) | <3 | (0.046, 0.046, 0.046) | Sandy, mesic Terric Haplosaprist | somewhat poorly drained tovery poorly drained | Outwash |
| WTD Simulation Period (mm/dd/yy) | NO3-N Simulation Period (mm/dd/yy) | |||
|---|---|---|---|---|
| Calibration | Validation | Calibration | Validation | |
| Site 1 | 5 October 1999 to 14 December 2001 | 6 February 2002 to 5 September 2003 | 29 November 1999 to 30 November 1999 | 21 March 2002 to 4 April 2002 |
| Site 2 | 1 May 2000 to 2 May 2001 | 15 May 2001 to 15 October 2002 | 5 April 2001 to 18 April 2001 | 23 September 2001 to 7 October 2001 |
| Site 3 | 12 March 2004 to 3 September 2004 | 1 October 2004 to 15 August 2005 | 2 September 2004 to 15 September 2004 | 15 October 2004 to 28 October 2004 |
| Site 4 | 7 January 2004 to 15 December 2004 | 19 January 2005 to 18 August 2005 | 2 September 2004 to 15 September 2004 | 15 October 2004 to 28 October 2004 |
| Site 5 | 26 May 2018 to 17 July 2018 | 15 August 2018 to 15 November 2018 | 2 May 2018 to 20 June 2018 | 17 July 2018 to 18 October 2018 |
| Site 6 | 29 May 2018 to 29 July 2018 | 14 September 2018 to 8 November 2018 | 20 April 2018 to 29 July 2018 | 14 September 2018 to 8 November 2018 |
| Site 7 | 19 June 2018 to 27 September 2018 | 25 October 2018 to 17 August 2019 | 3 May 2018 to 19 June 2018 | 18 July 2018 to 17 August 2019 |
| Site 8 | 19 June 2018 to 18 July 2018 | 17 August 2018 to 1 November 2018 | 4 May 2018 to 18 July 2018 | 17 August 2018 to 1 November 2018 |
| MAE (cm) | Willmott’s Index of Agreement (d) | |||
|---|---|---|---|---|
| Calibration | Validation | Calibration | Validation | |
| Minimum | 5 | 5 | 0.01 | 0.00 |
| Interquartile Range | 9–5.5 | 8.5–5 | 0.62–0.12 | 0.75–0.33 |
| Maximum | 26 | 38 | 0.69 | 0.81 |
| Willmott’s Index of Agreement (d) | RMSE (mg/L) | MAE (mg/L) | ||||
|---|---|---|---|---|---|---|
| Calibration | Validation | Calibration | Validation | Calibration | Validation | |
| Minimum | 0.22 | 0.11 | 0.13 | 0.27 | 0.10 | 0.25 |
| Interquartile Range | 0.60–0.40 | 0.65–0.17 | 0.75–0.50 | 1.07–0.38 | 0.68–0.45 | 0.99–0.36 |
| Maximum | 0.83 | 0.76 | 0.91 | 1.45 | 0.81 | 1.21 |
Publisher’s Note: MDPI stays neutral with regard to jurisdictional claims in published maps and institutional affiliations. |
© 2021 by the authors. Licensee MDPI, Basel, Switzerland. This article is an open access article distributed under the terms and conditions of the Creative Commons Attribution (CC BY) license (https://creativecommons.org/licenses/by/4.0/).
Share and Cite
Tamanna, M.; Pradhanang, S.M.; Gold, A.J.; Addy, K.; Vidon, P.G. Riparian Zone Nitrogen Management through the Development of the Riparian Ecosystem Management Model (REMM) in a Formerly Glaciated Watershed of the US Northeast. Agriculture 2021, 11, 743. https://doi.org/10.3390/agriculture11080743
Tamanna M, Pradhanang SM, Gold AJ, Addy K, Vidon PG. Riparian Zone Nitrogen Management through the Development of the Riparian Ecosystem Management Model (REMM) in a Formerly Glaciated Watershed of the US Northeast. Agriculture. 2021; 11(8):743. https://doi.org/10.3390/agriculture11080743
Chicago/Turabian StyleTamanna, Marzia, Soni M. Pradhanang, Arthur J. Gold, Kelly Addy, and Philippe G. Vidon. 2021. "Riparian Zone Nitrogen Management through the Development of the Riparian Ecosystem Management Model (REMM) in a Formerly Glaciated Watershed of the US Northeast" Agriculture 11, no. 8: 743. https://doi.org/10.3390/agriculture11080743
APA StyleTamanna, M., Pradhanang, S. M., Gold, A. J., Addy, K., & Vidon, P. G. (2021). Riparian Zone Nitrogen Management through the Development of the Riparian Ecosystem Management Model (REMM) in a Formerly Glaciated Watershed of the US Northeast. Agriculture, 11(8), 743. https://doi.org/10.3390/agriculture11080743


