Article

Optimizing Nitrogen Application in Root Vegetables from Their Growth, Biochemical and Antioxidant Response to Urea Fertilizer

by
Adnan Shakeel
1,*,
Abrar Ahmad Khan
1,
Hesham F. Alharby
2,
Atif A. Bamagoos
2,
Nadiyah M. Alabdallah
3 and
Khalid Rehman Hakeem
2,*
1
Section of Environmental Botany, Faculty of Life Sciences, Aligarh Muslim University, Aligarh 202002, India
2
Department of Biological Sciences, King Abdulaziz University, Jeddah 21589, Saudi Arabia
3
Department of Biology, College of Science, Imam Abdulrahman Bin Faisal University, P.O. Box 383, Dammam 31113, Saudi Arabia
*
Authors to whom correspondence should be addressed.
Agriculture 2021, 11(8), 704; https://doi.org/10.3390/agriculture11080704
Submission received: 22 June 2021 / Revised: 9 July 2021 / Accepted: 19 July 2021 / Published: 27 July 2021

Abstract

:
Nitrogen is one of the most influencing inorganic nutrients for improved plant growth and yield in crops. However, excessive fertilizer application may have adverse impacts on the environment. Therefore, we strive to investigate in this work by examining the impact of different nitrogen (N) doses in the form of urea (46% N) on the growth, yield, photosynthetic pigment content, nitrate reductase activity, carbohydrate content, protein content, and antioxidant enzyme activity of the carrot and beetroot. A pot experiment was conducted under natural conditions with four nitrogen levels as basal treatment (Control = Nil N, U50 = 145.57 mg/kg N; U100 = 291.14 mg/kg N; U150 = 436.71 mg/kg N; U200 = 582.28 mg/kg N). Results found that U150 (436.71 mg/kg N) is the optimum N fertilizer dose at which significant (p ≤ 0.05) improvements in all the growth, yield and biochemical attributes of carrot and beetroot were observed. However, the further increment in N doses did not affect the observed parameters and, therefore, excessive N level was observed beyond U150 = 436.71 mg/kg N. The principal component analysis presented significant correlations among the various parameters observed. Two principal components account for a total of 98.86% variance (PC1 =  92.96%; PC2 =  5.90%) in carrot and 99.2% variance (PC1 = 92.64; PC = 6.56) in beetroot of the overall data variability in plants supplemented with different N treatments.

1. Introduction

Rising demand for food, the requirement of eco-friendly agriculture and future risks due to climate change are all connected with the urgent need to adopt suitable fertilizer management strategies in crop ecosystems [1,2,3]. Nitrogen (N), classified as a primary macronutrient, plays an important role in improving the quantity and quality of crops [4,5]. Due to the urge of food demand, farmers have amplified the application of N fertilizers to their fields year by year without taking into consideration the response of various species to N rate and forms. The application of N fertilizer significantly contributed to the doubling of agricultural food production up to the 1990s [6]. The primary reason is that N is a constituent of amino acids, proteins, cell walls, membranes, nucleic acids, rubisco and plays a role in stress tolerance [7,8]. Its deficiency decreases the leaf area and rate of photosynthesis which leads to reduced crop yield [9,10]. N also works as a signaling element that influences the expression of various genes, regulates various biochemical pathways, including photosynthesis, nitrogen assimilation, antioxidant systems and the cell cycle, etc. [11,12]. A retrospective analysis of data showed that an adequate supply of N could enhance plant growth and upsurge crop production. Still, extreme and inappropriate use of chemical N fertilizers results in the accumulation of compounds in edible crops. This may be problematic to humans and causes environmental pollution and economic losses [13,14,15]. Therefore, N application’s optimal management strategies are required to reduce the environmental impact of agricultural practices that would increase profitability in crop production. Thus, N recommendations for root crops may include a detailed profit evaluation associated with the quality factors affected by deficient or excessive N applications.
Vegetables comprise a crucial component of worldwide agriculture due to their powerful nutritional value, widespread cultivation, and economic importance. India holds the 2nd rank in vegetable production globally, with an annual production of 184.39 million tonnes from a cultivated area of 10.25 million hectares [16]. Two root vegetable crops (carrot and beetroot) are well known for their flashy storage roots with enormous nutritional values. Carrot (Daucus carota L.), a member of the family Apiaceae, is an important nutritious root vegetable. Its roots are used mainly as a crunchy salad or in juice preparation. Besides, it is used in sweets and halwa, cooked with mixed vegetables, preserved by pickling and canning [17]. With an annual production of 1147.08 thousand metric tonnes, India ranks among the top 15 countries in carrot production [18]. Phytochemicals that contribute to the nutritional value of carrots comprise mostly four types viz: carotenoids, phenolic compounds, polyacetylenes and ascorbic acid [19]. In recent times, the consumption of carrot and its derivatives has increased progressively due to their recognition as an important source of natural antioxidants besides the anticancer activity of β-carotene, which also is the precursor of vitamin A. Similarly, beetroot (Beta vulgaris L.) belongs to the family Chenopodiaceae. It ranks among the 10 common potent vegetables concerning its antioxidant property [20]. Being a rich source of antioxidants, minerals, and vitamins, it becomes an efficient supplementary food for humans [21,22]. Considering the nutritional value and health benefits of root crops and the management strategies of N fertilizer, it was planned to evaluate the growth, yield, and biochemical response of these root crops to N fertilizer.

2. Materials and Methods

2.1. Experimental Site and Plant Growth Conditions

A pot experiment was set in a complete randomized block design under natural conditions at the Department of Botany, Aligarh Muslim University, India. An average day/night temperature of 24 °C/18 °C (±3 °C) with a relative humidity of 68 ± 5% was observed during the experiment. Seeds of carrot and beetroot were sterilized in 0.1% HgCl2 solution for two minutes prior to sowing. Soil from the agricultural field was collected and autoclaved at 20 lb. p for 20 min. The treatments were formulated as Control = Nil N; U50 = 145.57 mg/kg N; U100 = 291.14 mg/kg N; U150 = 436.71 mg/kg N; U200 = 582.28 mg/kg N, respectively. Earthen pots (25 × 25 cm) were used for making different treatments and the number of replicates for each treatment was maintained at three (n = 3). All the experiments were repeated twice. Ten seeds were sown in each pot, but only one healthy plant in each pot was maintained. Plants were irrigated on alternate days with the required amount of water.

2.2. Soil Analysis

For the experimental work, the physicochemical characteristics of soil were determined before the application of N fertilizer and the sowing of crops. Ultrastructure and elemental analysis of the soil was done through energy dispersive X-ray analyzer (EDX) of make JEOL, JSM-6510 LV, Japan. Soil texture was determined by the traditional feel method, which involves rubbing of moistened soil/CFA between the thumb and fingers. For determining the water holding capacity, the method of Priha and Smolander [23] was followed. The pH was measured by the method of Jackson [24]. EC was determined by the method of Rayment and Higginson [25]. N (nitrogen) content was determined by the standard Kjeldahl method [26]. P (phosphorous) content was determined by the protocol of Dickman and Bray [27]. K (potassium) content was determined by using flame photometry.

2.3. Determination of Growth Biomarkers

The plants were uprooted at maturity from the pots and cleaned with water to remove the adhered particles. Plant length was measured by using a meter scale. Plant weight was taken by a digital weighing balance. Prerequisite for dry weight analysis, plants were oven dried at 80 °C for 48 h. For determination of leaf area, the graph paper method was employed.

2.4. Determination of Leaf Characteristics

Number of stomata and the ultra-structural dimensions of stomata were determined with the help of scanning electron microscope (SEM) of make JEOL, JSM-6510 LV, Japan. For SEM studies, leaf sample was prepared by following our previous study Shakeel et al. [22].

2.5. Determination of Photosynthetic Pigments

The content of chlorophyll and carotenoids was measured according to the Maclachalan and Zalik protocol [28]. At 663 and 645 nm, the absorbance was read against a blank 80 percent acetone on a spectrophotometer.

2.6. Determination of Nitrate Reductase Activity, Protein and Carbohydrate Content

In leaves, nitrate reductase (NR) activity was calculated by preparing an enzyme extract using the Jaworski process [29]. By using the Bradford method [30] with bovine serum as normal, protein content was calculated. The carbohydrate content was measured by using the Hedge and Hofreiter assay [31].

2.7. Assay of Antioxidant Enzyme Activity

Total antioxidant enzyme activity from the fleshy roots was assessed according to a standardized protocol defined by Shimada et al. [32]. An aliquot of 100 μL samples was added to a working solution made of 3 mL of 2, 2-diphenyl-1-picrylhydrazyl (DPPH). Absorbance was recorded at 517 nm through a spectrophotometer. The lower value of absorbance would signify the presence of higher antioxidant activity of the sample and vice-versa. Antioxidant activity was expressed as percent scavenging of DPPH radical and the following formula was used:
IC   50   % = 1 Absorbance   of   sample   Absorbance   of   control × 100

2.8. Quantification and Histochemical Localization of Superoxide Anion (O2) and Determination of SOD Activity

The estimation of the O2 content was done as per a standardized protocol defined by Wu et al. [33]. The superoxide content was calculated by a standard curve of sodium nitrite, and the content was demonstrated as μ mole g–1 FW. Localization of superoxide anions was done as per a standardized protocol defined by Kaur et al. [34]. Images were captured with the help of a stereomicroscope. The SOD (superoxide dismutase) activity was measured spectrophotometrically by following a standardized protocol of Dhindsa et al. [35] based on the ability of SOD to inhibit the photochemical reduction of nitro blue tetrazolium.

2.9. Determination of the Root Cell Viability through Confocal Laser Scanning Microscopy

Root cell viability was determined by dipping the roots in propidium iodide dye, followed by scanning through confocal laser microscope (Zeiss, LSM 780, Jena, Germany) respectively.

2.10. Statistical Analysis

The data is presented as mean from triplicate measurements of two repeated experiments. The results were analyzed by one-way analysis of variance (ANOVA) with DMRT test, using SPSS version 17.0 software and p < 0.05 was considered statistically significant. In addition, the data were analyzed using principal component analysis (PCA) by using Origin pro (2021) software.

3. Results

3.1. Physicochemical Characterization of the Soil

Table 1 demonstrates the physicochemical characteristics of soil in terms of pH, EC, texture, porosity and water holding capacity. Scanning electron microscopy reveals the shape of soil particles as peds (Figure 1). Energy dispersive X-ray shows the composition of the soil in terms of elements (Figure S1).

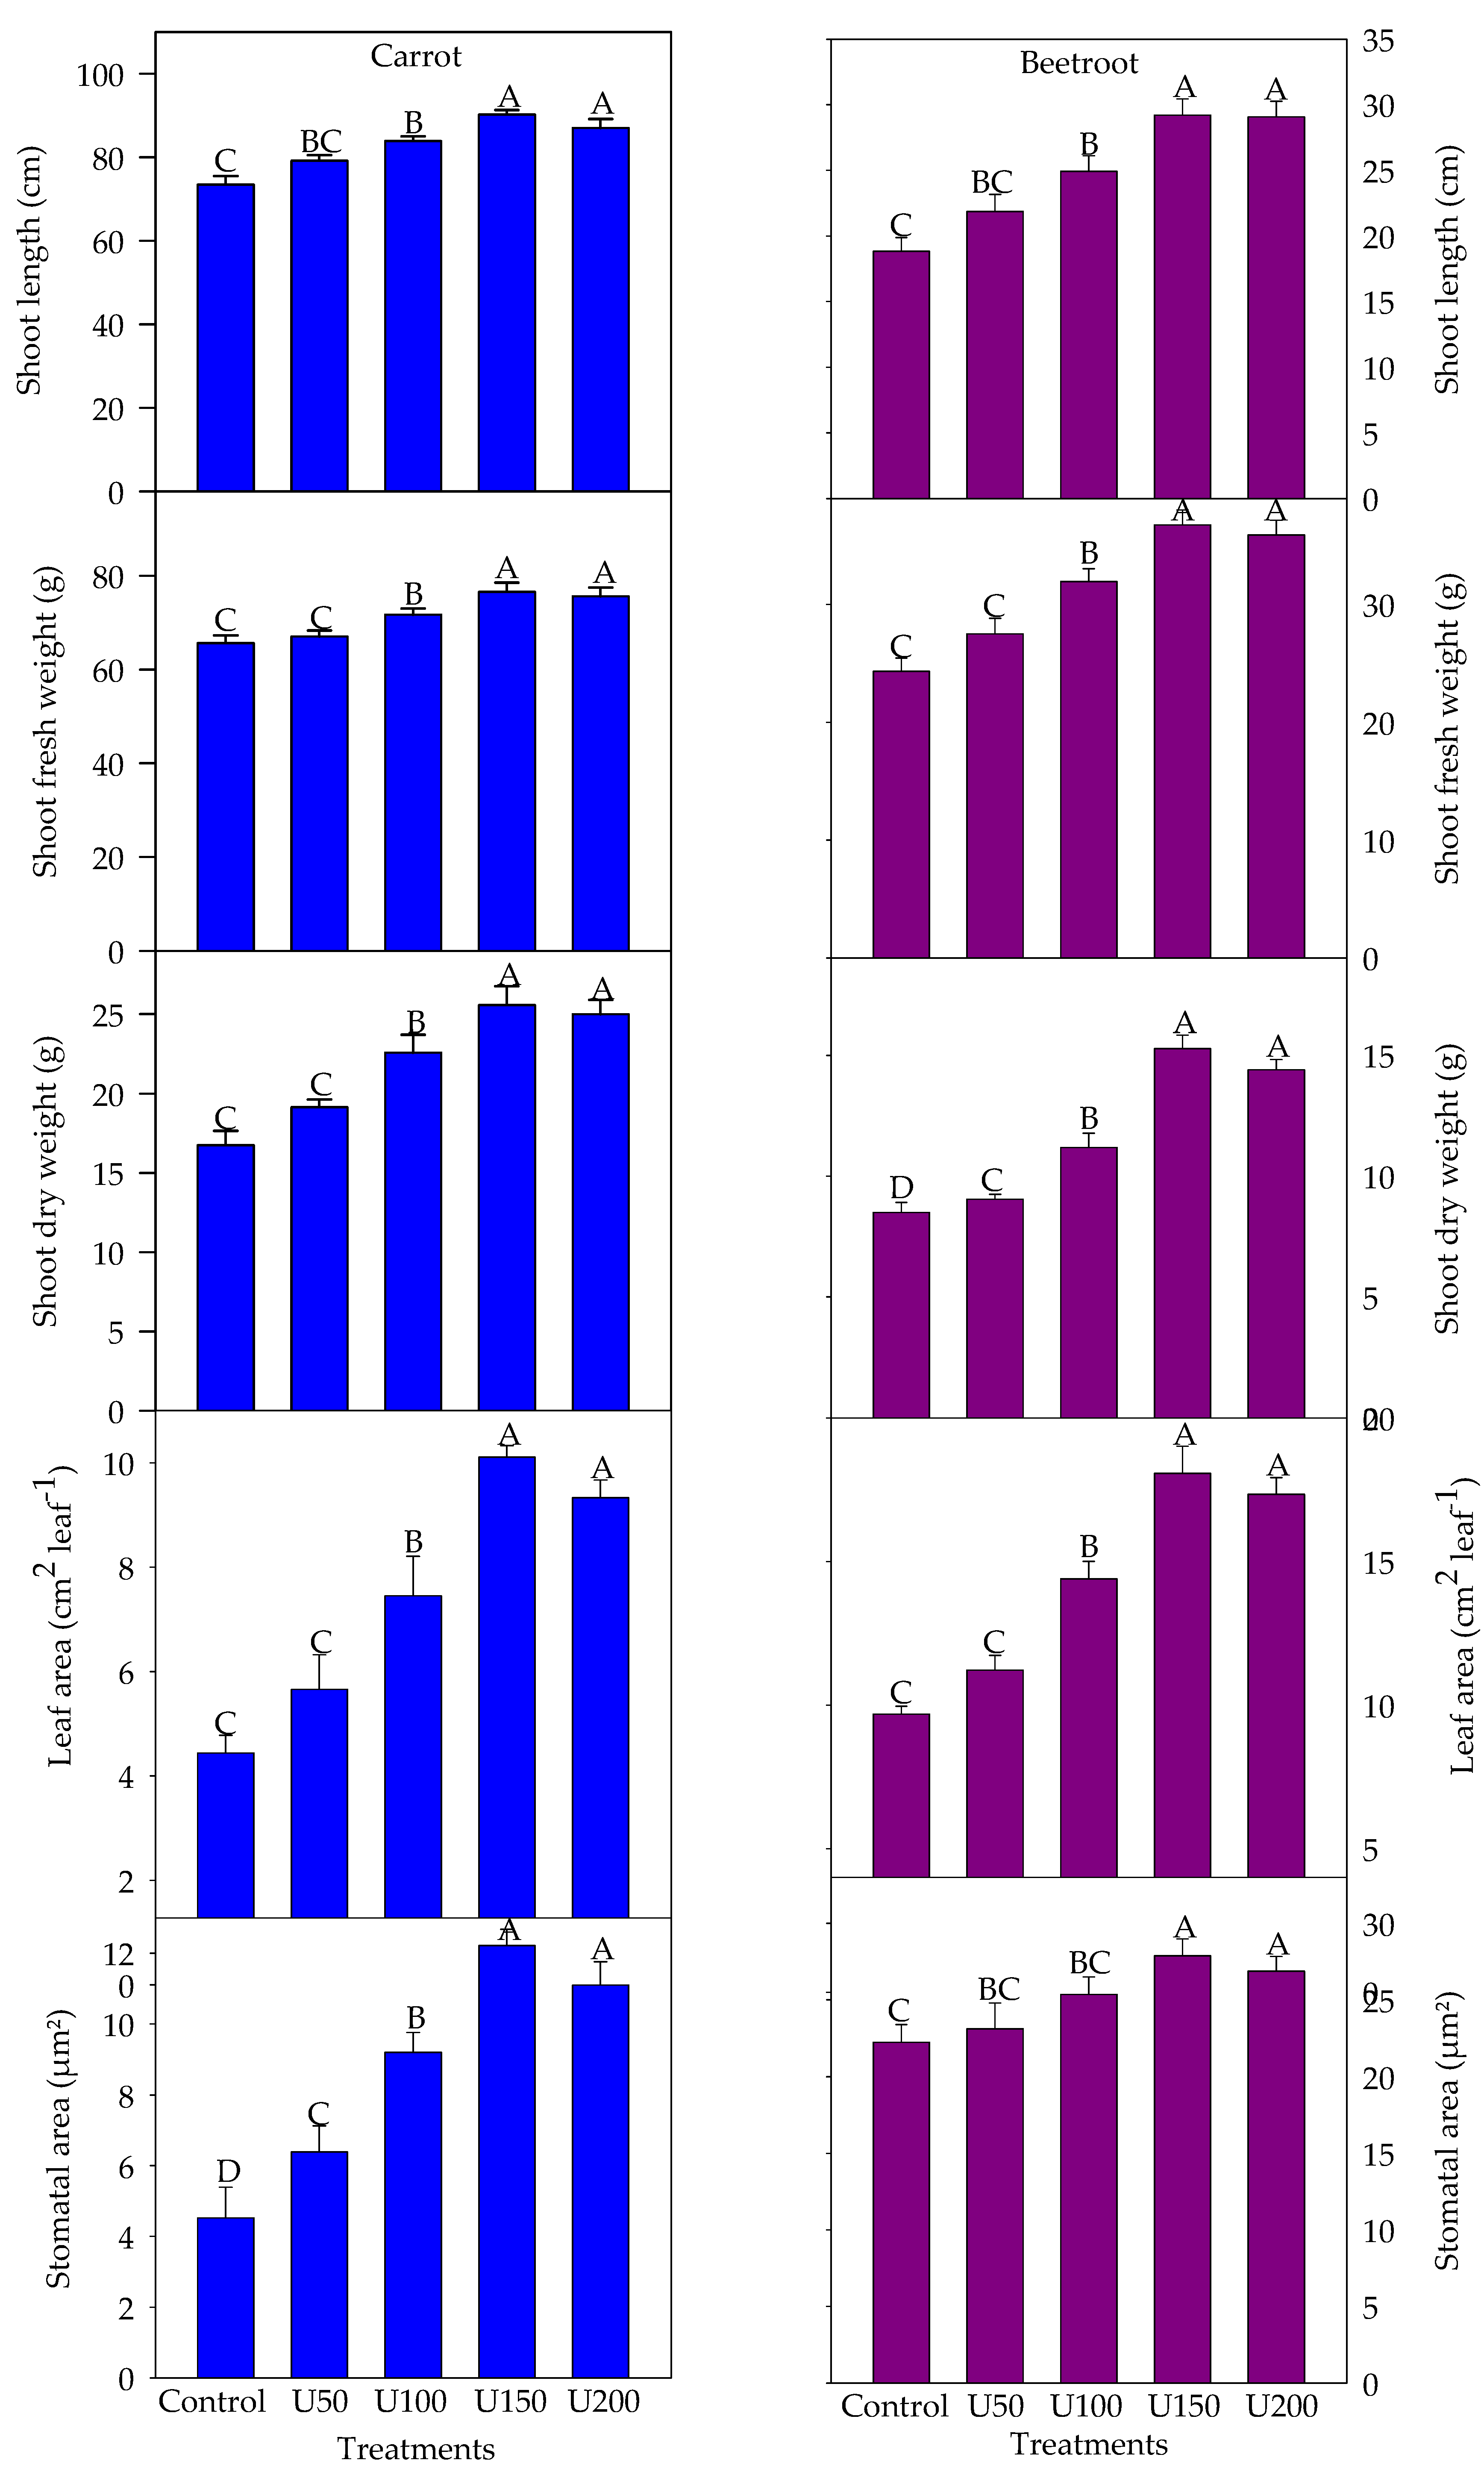
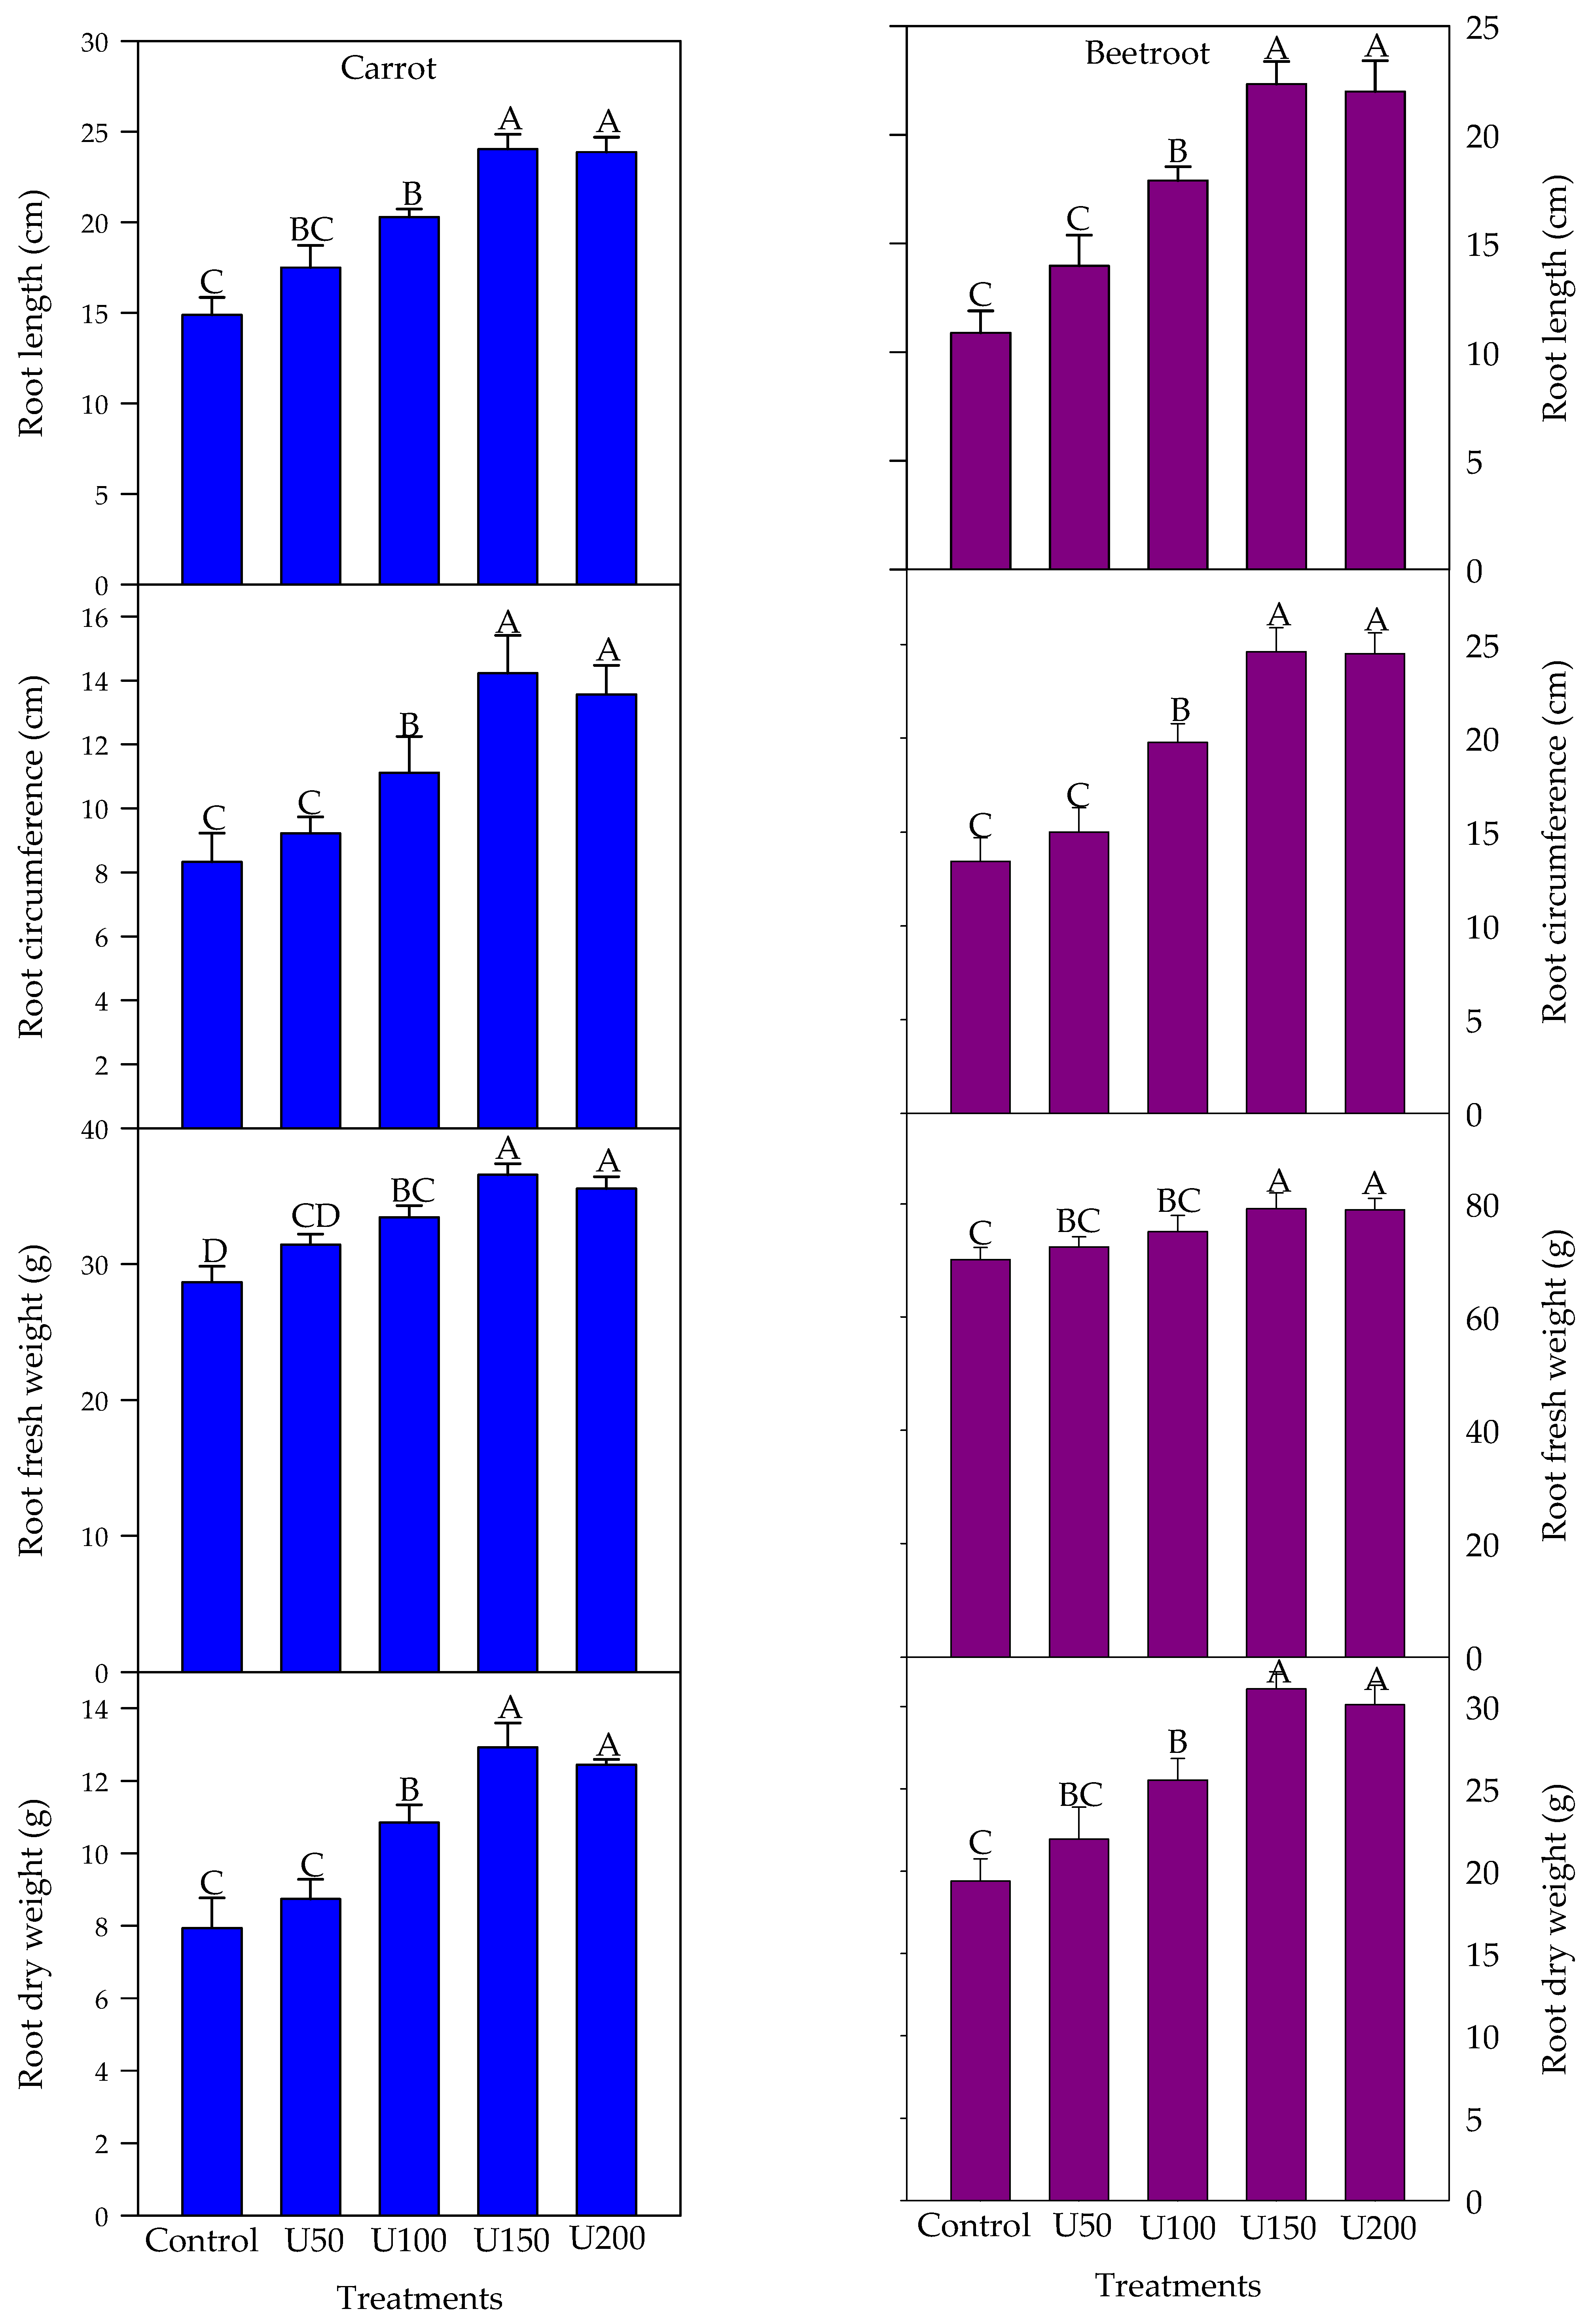
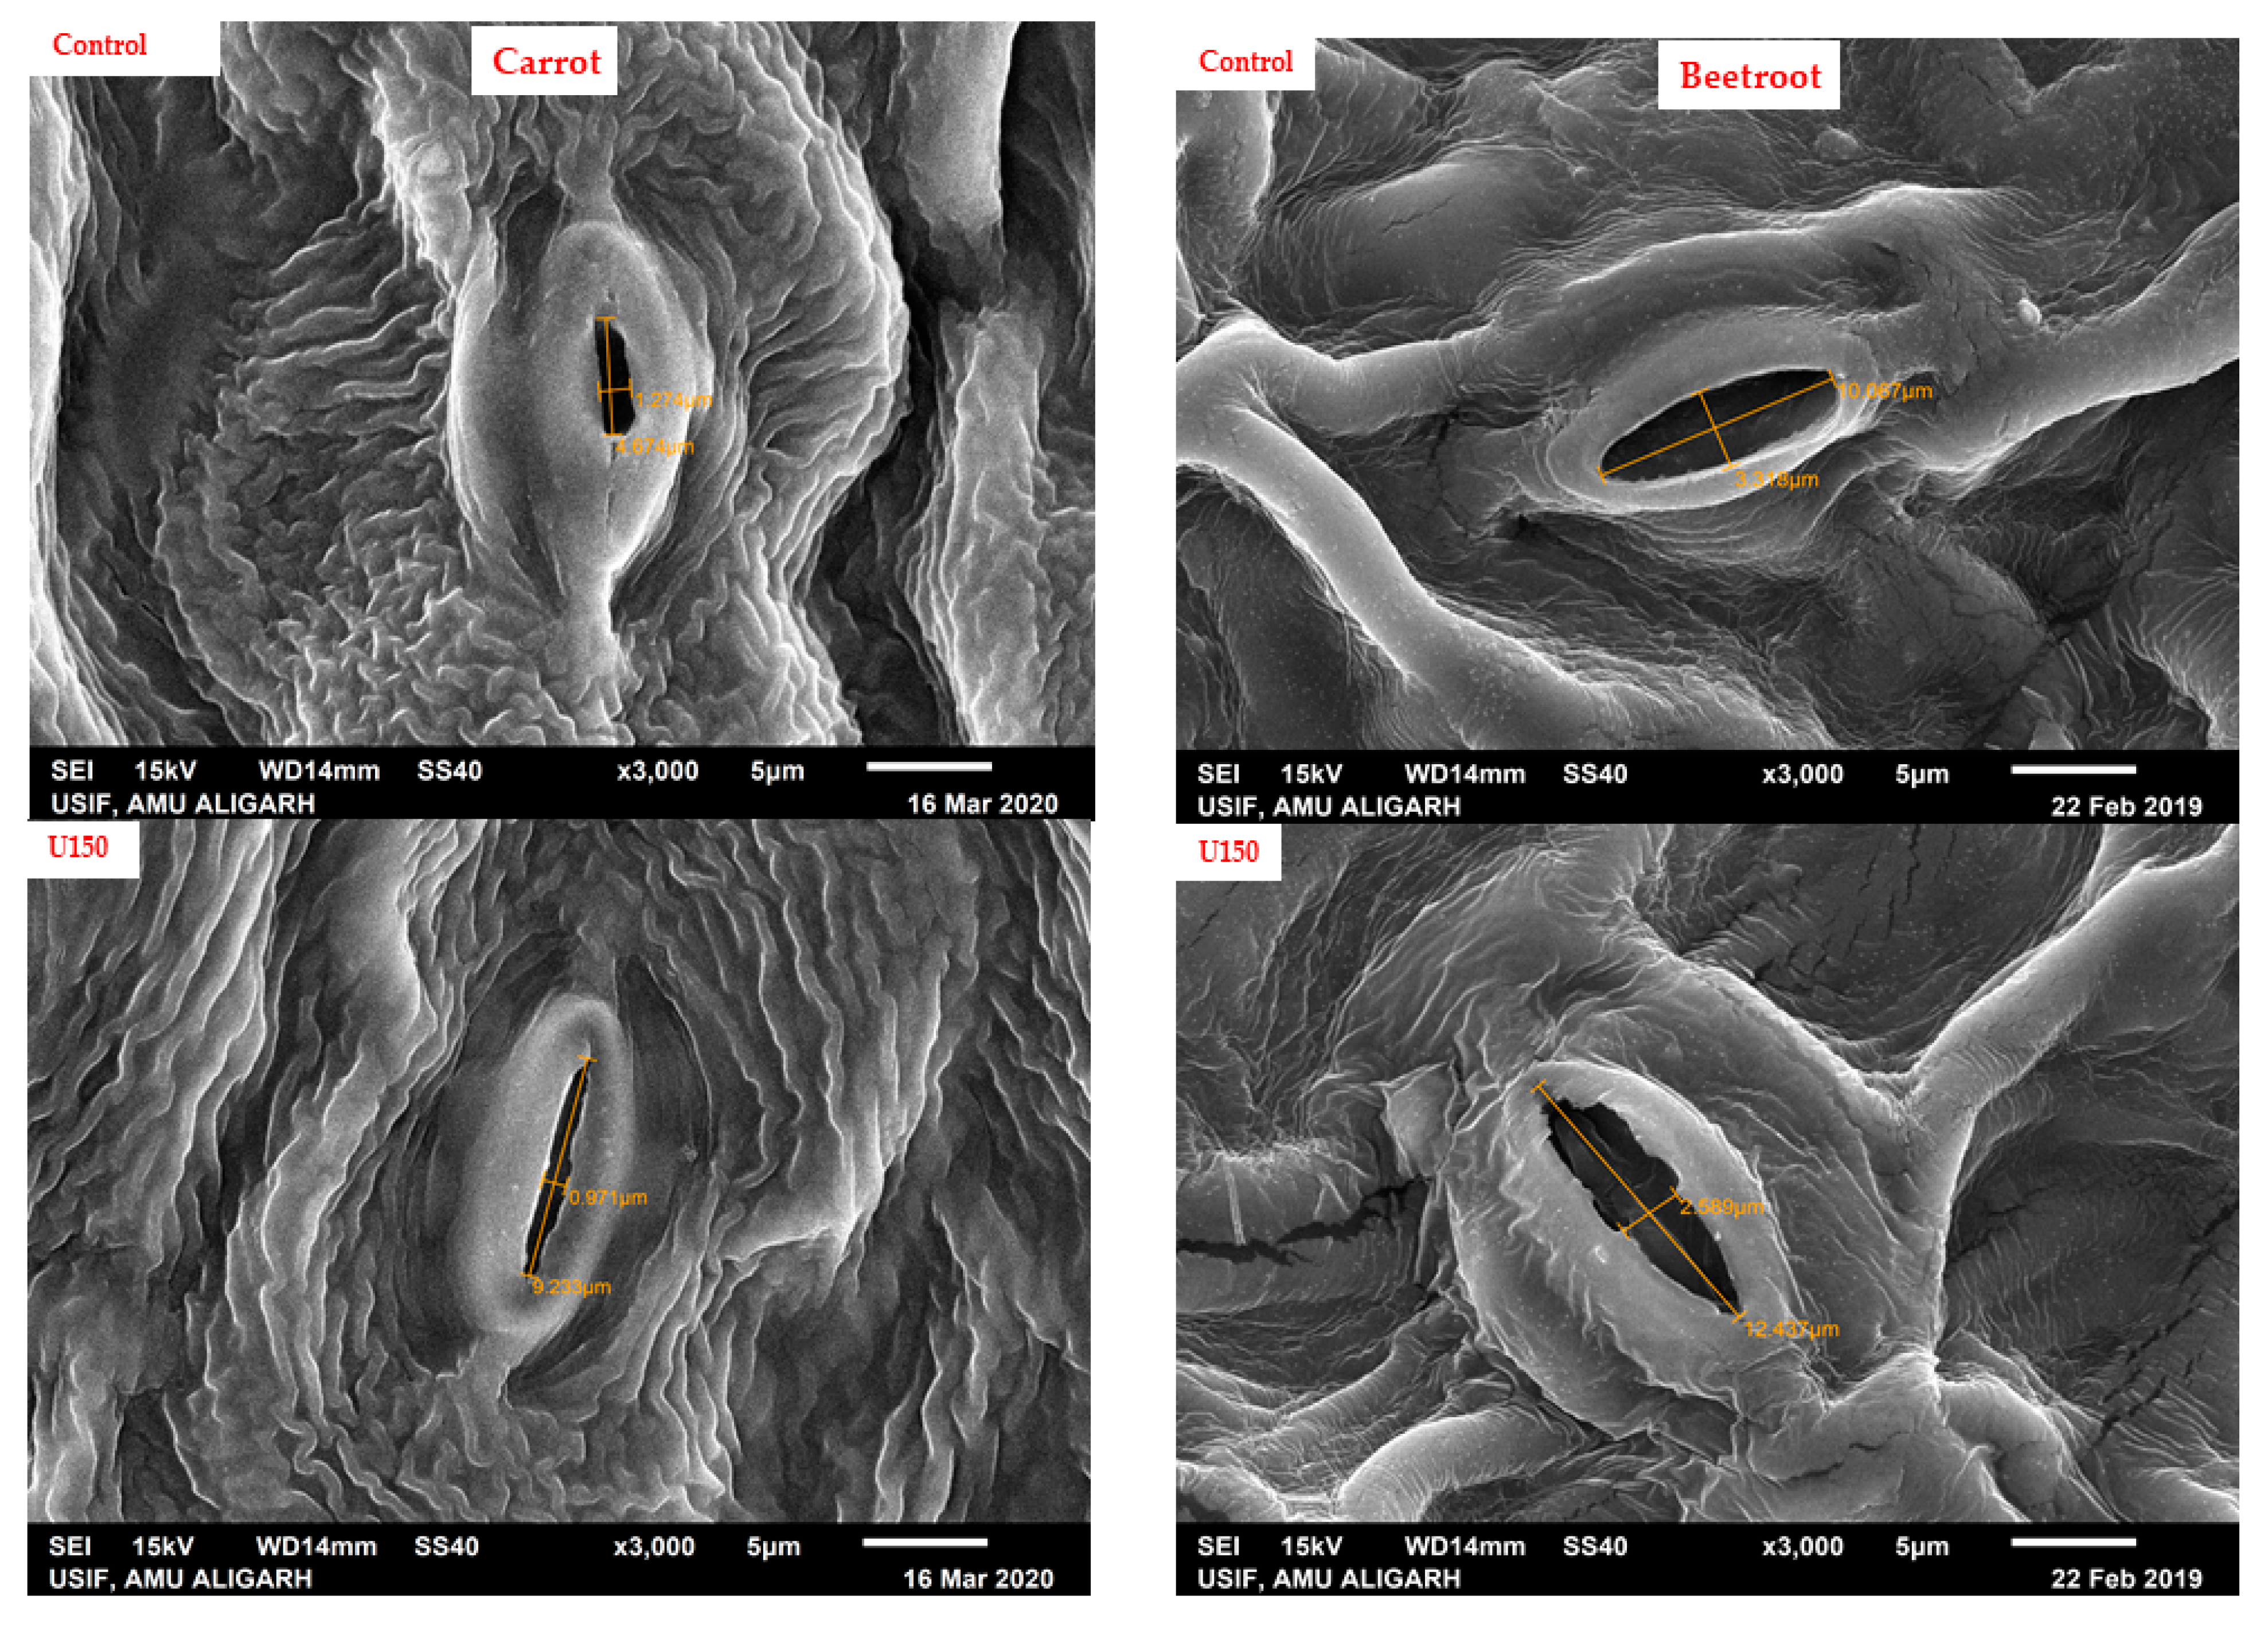
3.2. Effect of N on the Growth and Yield Attributes of Carrot and Beetroot

Application of N fertilizer as a basal dose caused a significant enhancement in all the growth markers and yield attributes of carrot and beetroot. Among all the treatments, U150 (436.71 mg/kg) proved optimum to significantly enhance the growth in terms of shoot length (37.46% and 43.57%), shoot fresh (16.63% and 23.33%) and dry weight (39.3% and 46.32%) number of leaves (76.4% and 79.67%), and leaf area (72.70% and 86.60%), and stomatal area (70.29% and 60.74%) in carrot and beetroot, respectively (Figure 1). Congruently, the yield of carrot and beetroot was markedly increased in terms of root length (61.40% and 73.5%) root fresh (19.27% and 12.72%), root dry weight (62.87% and 60.20%), and root circumference (70.70% and 83.03%) at U150 treatment (Figure 2). Scanning electron microscopy revealed a significant improvement in the stomatal aperture of carrot and beetroot at U150 treatment (Figure 3). The results of the repeated experiment are attached to the Supplementary Data (Tables S1 and S2).

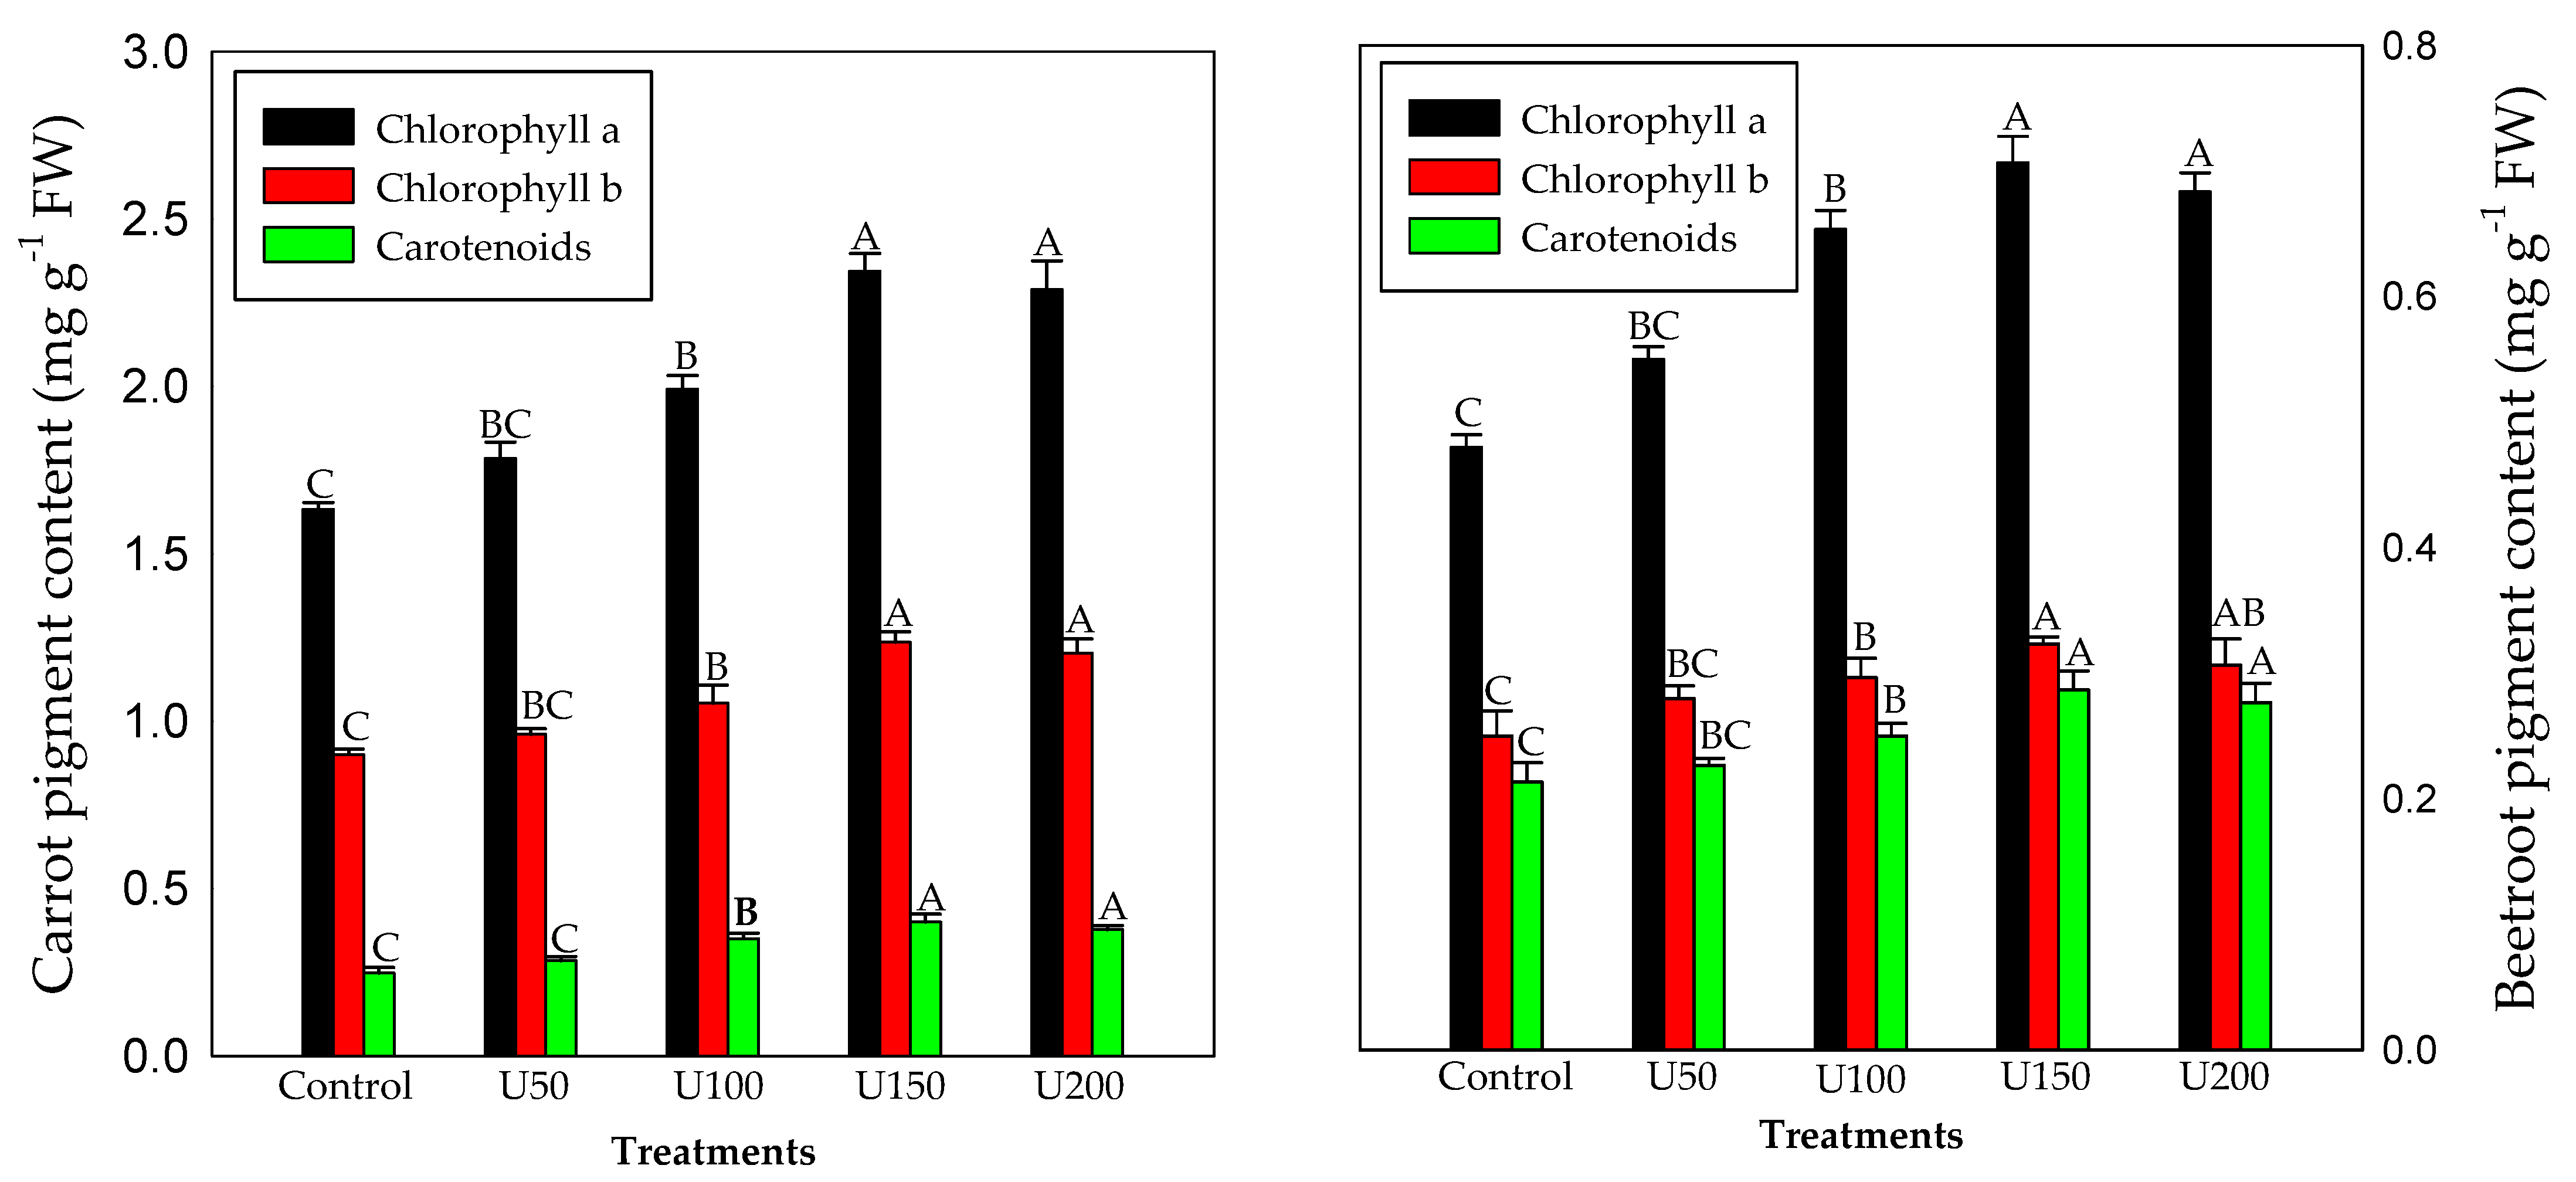
3.3. Effect of N on the Photosynthetic Pigment Content of Carrot and Beetroot

The photosynthetic pigment contents, including chlorophyll a, chlorophyll b, and carotenoid contents showed a gradual increment with higher N concentrations and the maximum enhancement was observed at U150 (436.71 mg/kg) (Figure 4). Chlorophyll a was enhanced by 63.80%, chlorophyll b by 58.8% and carotenoid content by 63.3% in carrot at U150 (436.71 mg/kg). Similarly, in beetroot, chlorophyll a was enhanced by 29.0%, chlorophyll b by 28.45% and carotenoid content by 33.35% at U150 (436.71 mg/kg).

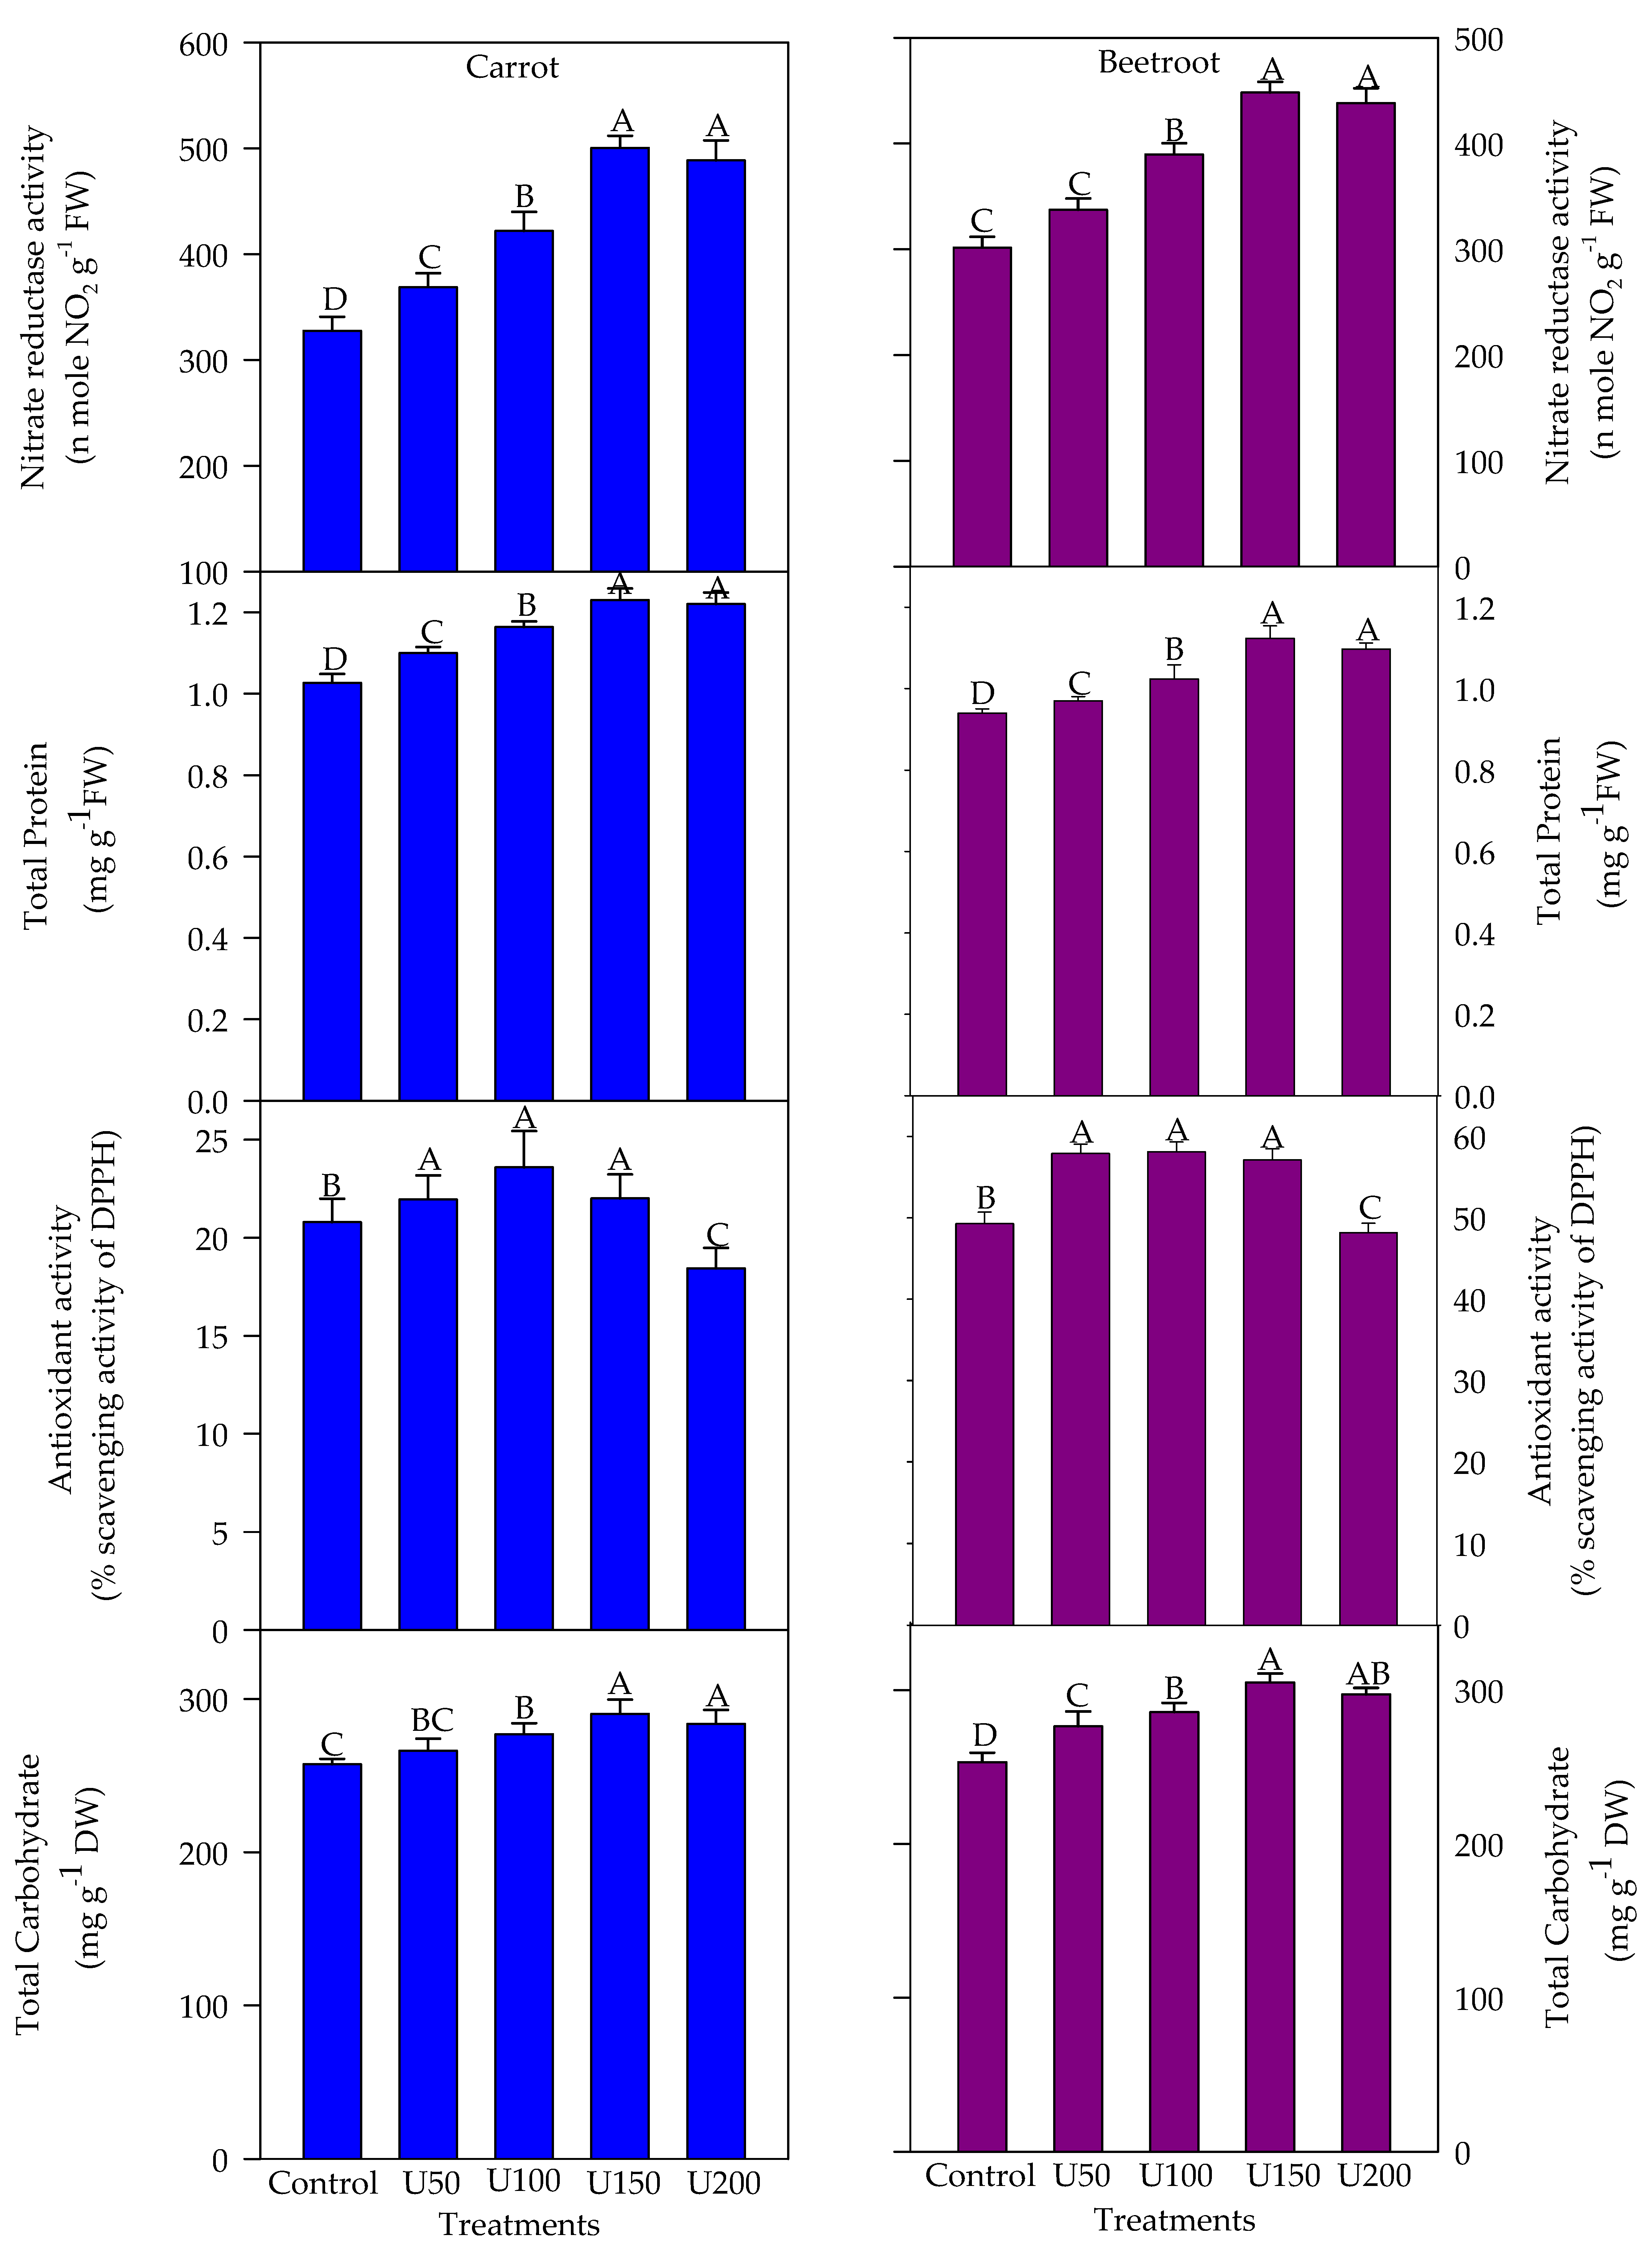
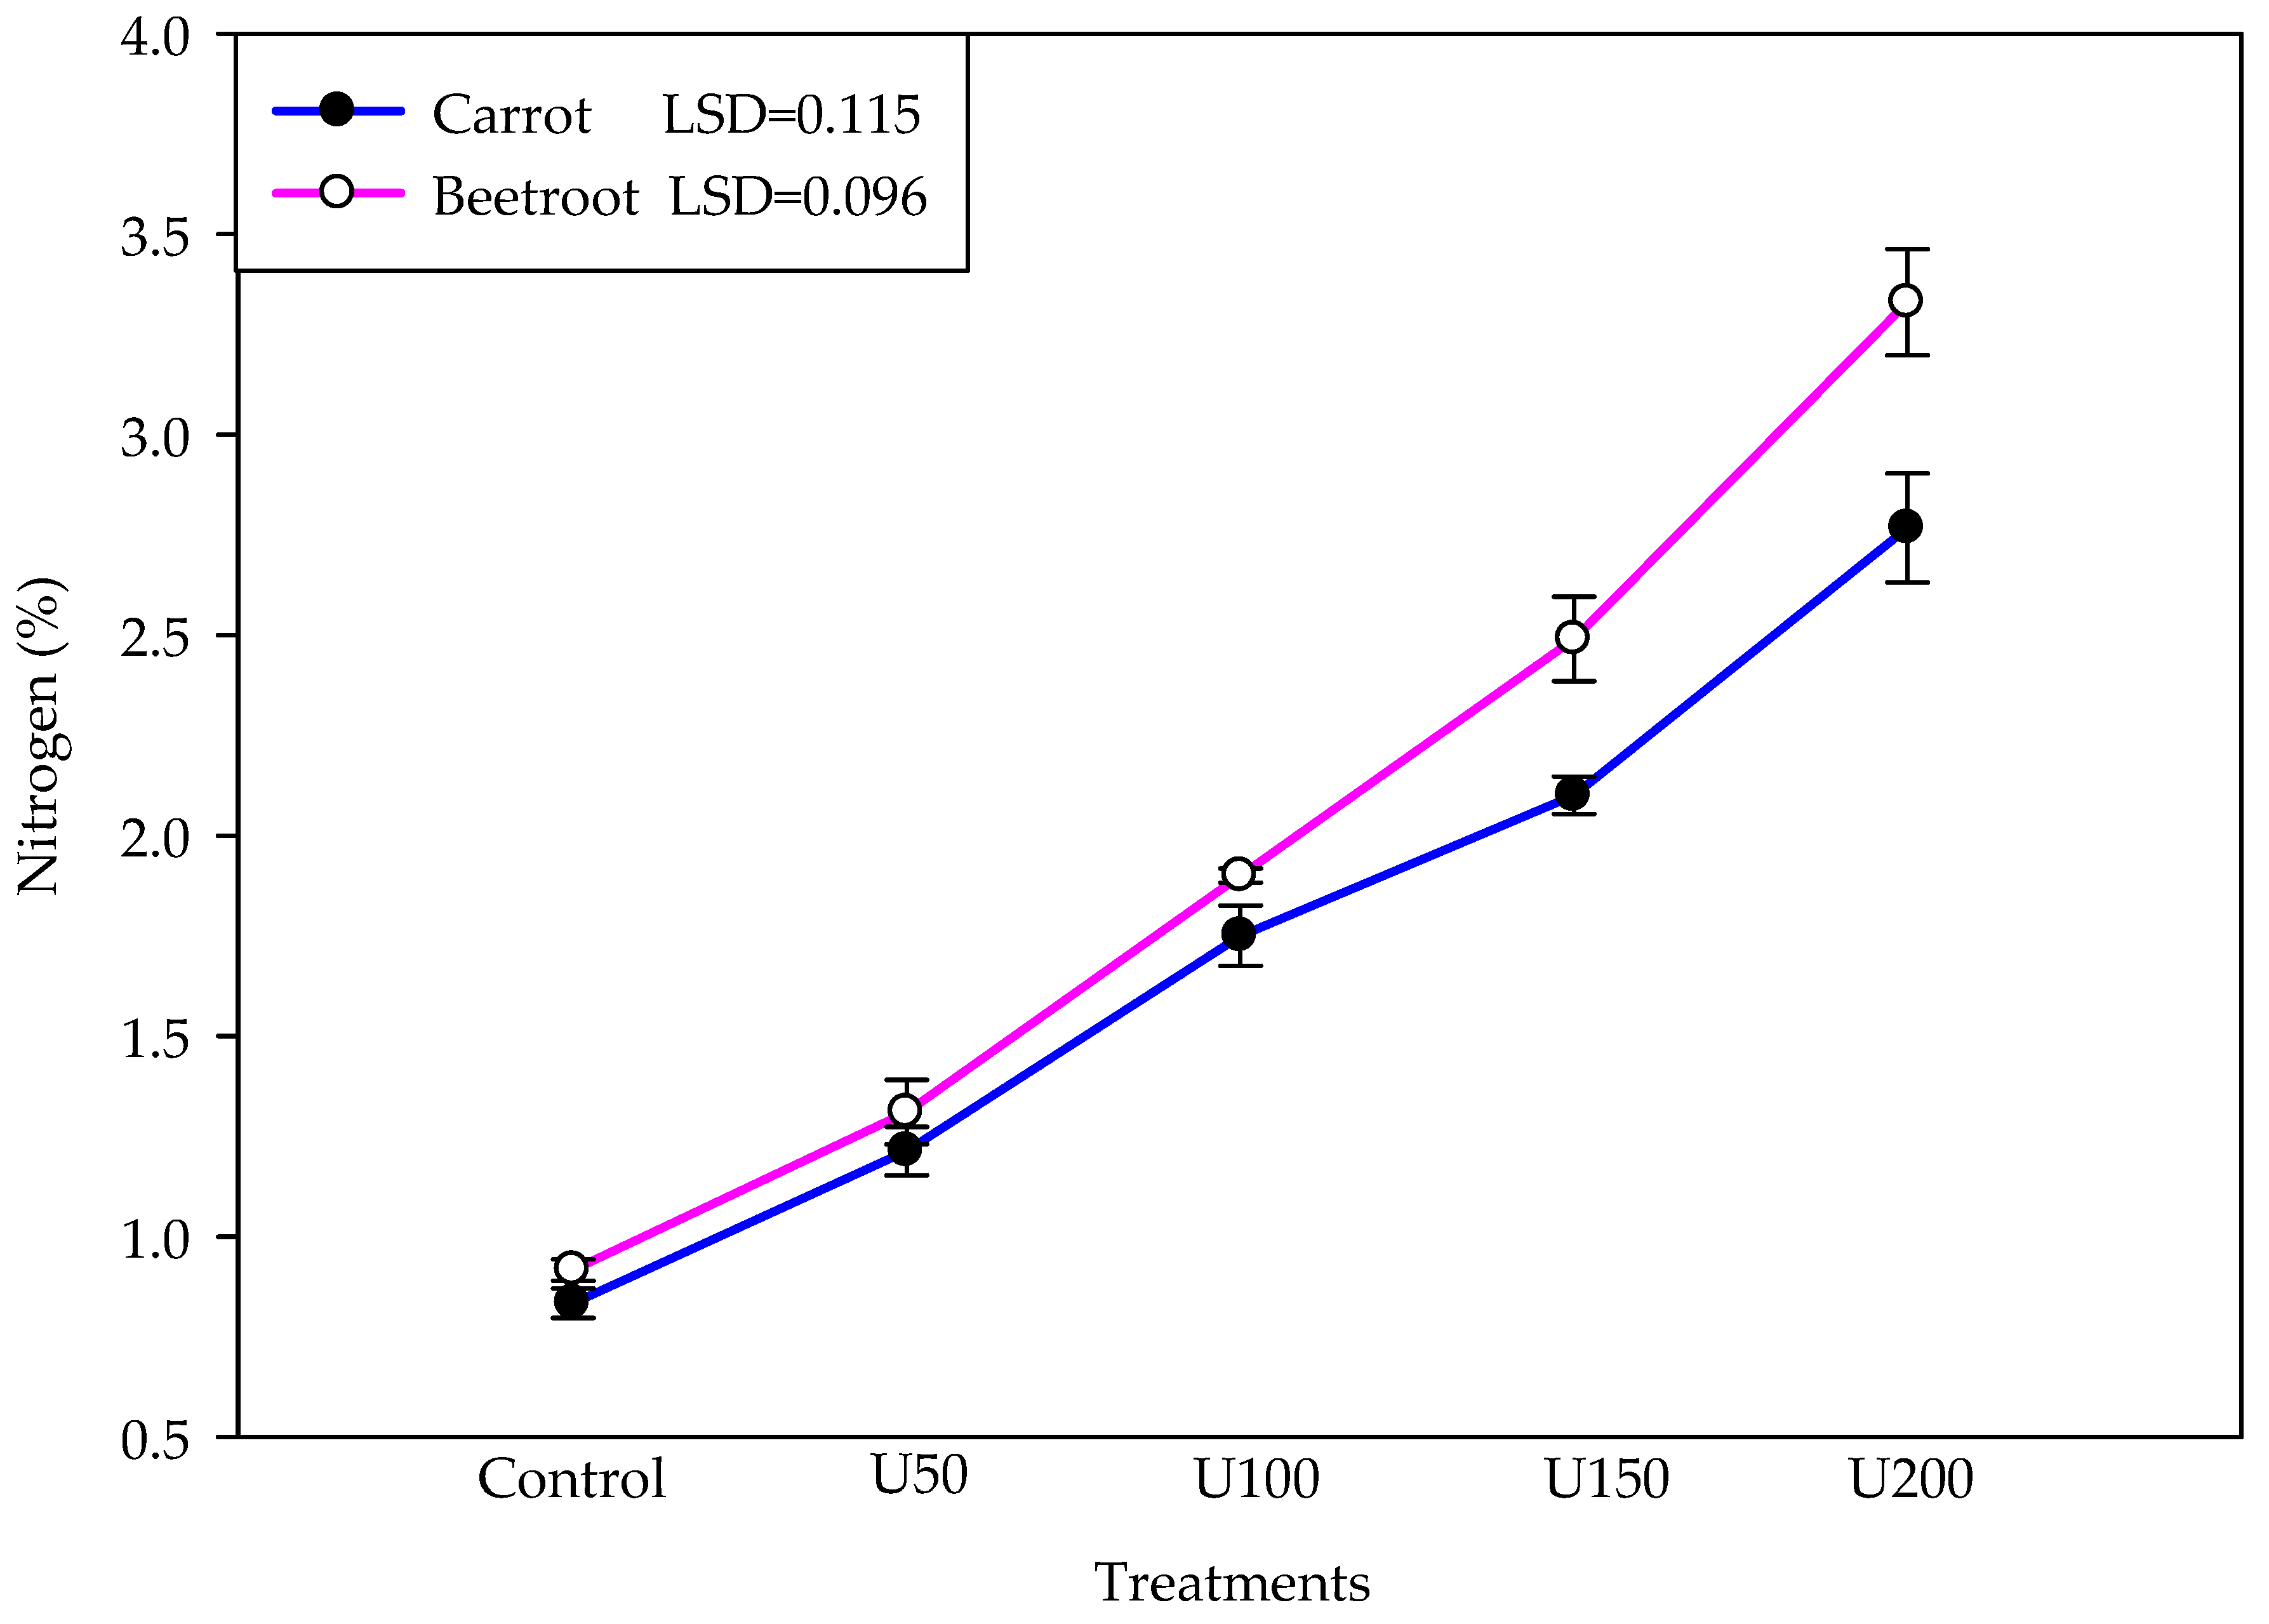
3.4. Effect of N on the NR Activity, Carbohydrate and Protein, and Nitrogen Contents of the Carrot and Beetroot

The effect of the basal application of N on the activity of nitrate reductase was found positive at all the N concentrations as compared to the control. However, U150 (436.71 mg/kg) was found most optimum concentration at which the enzyme activity was enhanced by 52.83% and 48.70% in carrot and beetroot, respectively (Figure 5). Similarly, the protein and carbohydrate contents in the storage roots were positively affected by the basal application of N in both crops. Among different treatments, U150 (436.71 mg/kg) N was found most optimum at which protein content was enhanced by 19.80% and 19.50% in carrot and beetroot, respectively. Likewise, carbohydrate content was enhanced by 12.82% and 20.46% in carrot and beetroot, respectively. The basal application of N had a marked impact on the antioxidant activity in the edible parts of both the crops. Among different N concentrations, U150 (436.71 mg/kg) was found optimum to enhance the scavenging capacity (Figure 5). Antioxidant activity was enhanced by 18.84% and 17.95% at U150 in carrot and beetroot, respectively. The role of N in improving the growth and yield of crops is a manifestation of how various biochemical pathways and molecules are influenced by it. N content in the edible part of both the crops was found in direct proportionality with the basal application of N to the soil (Figure 6).

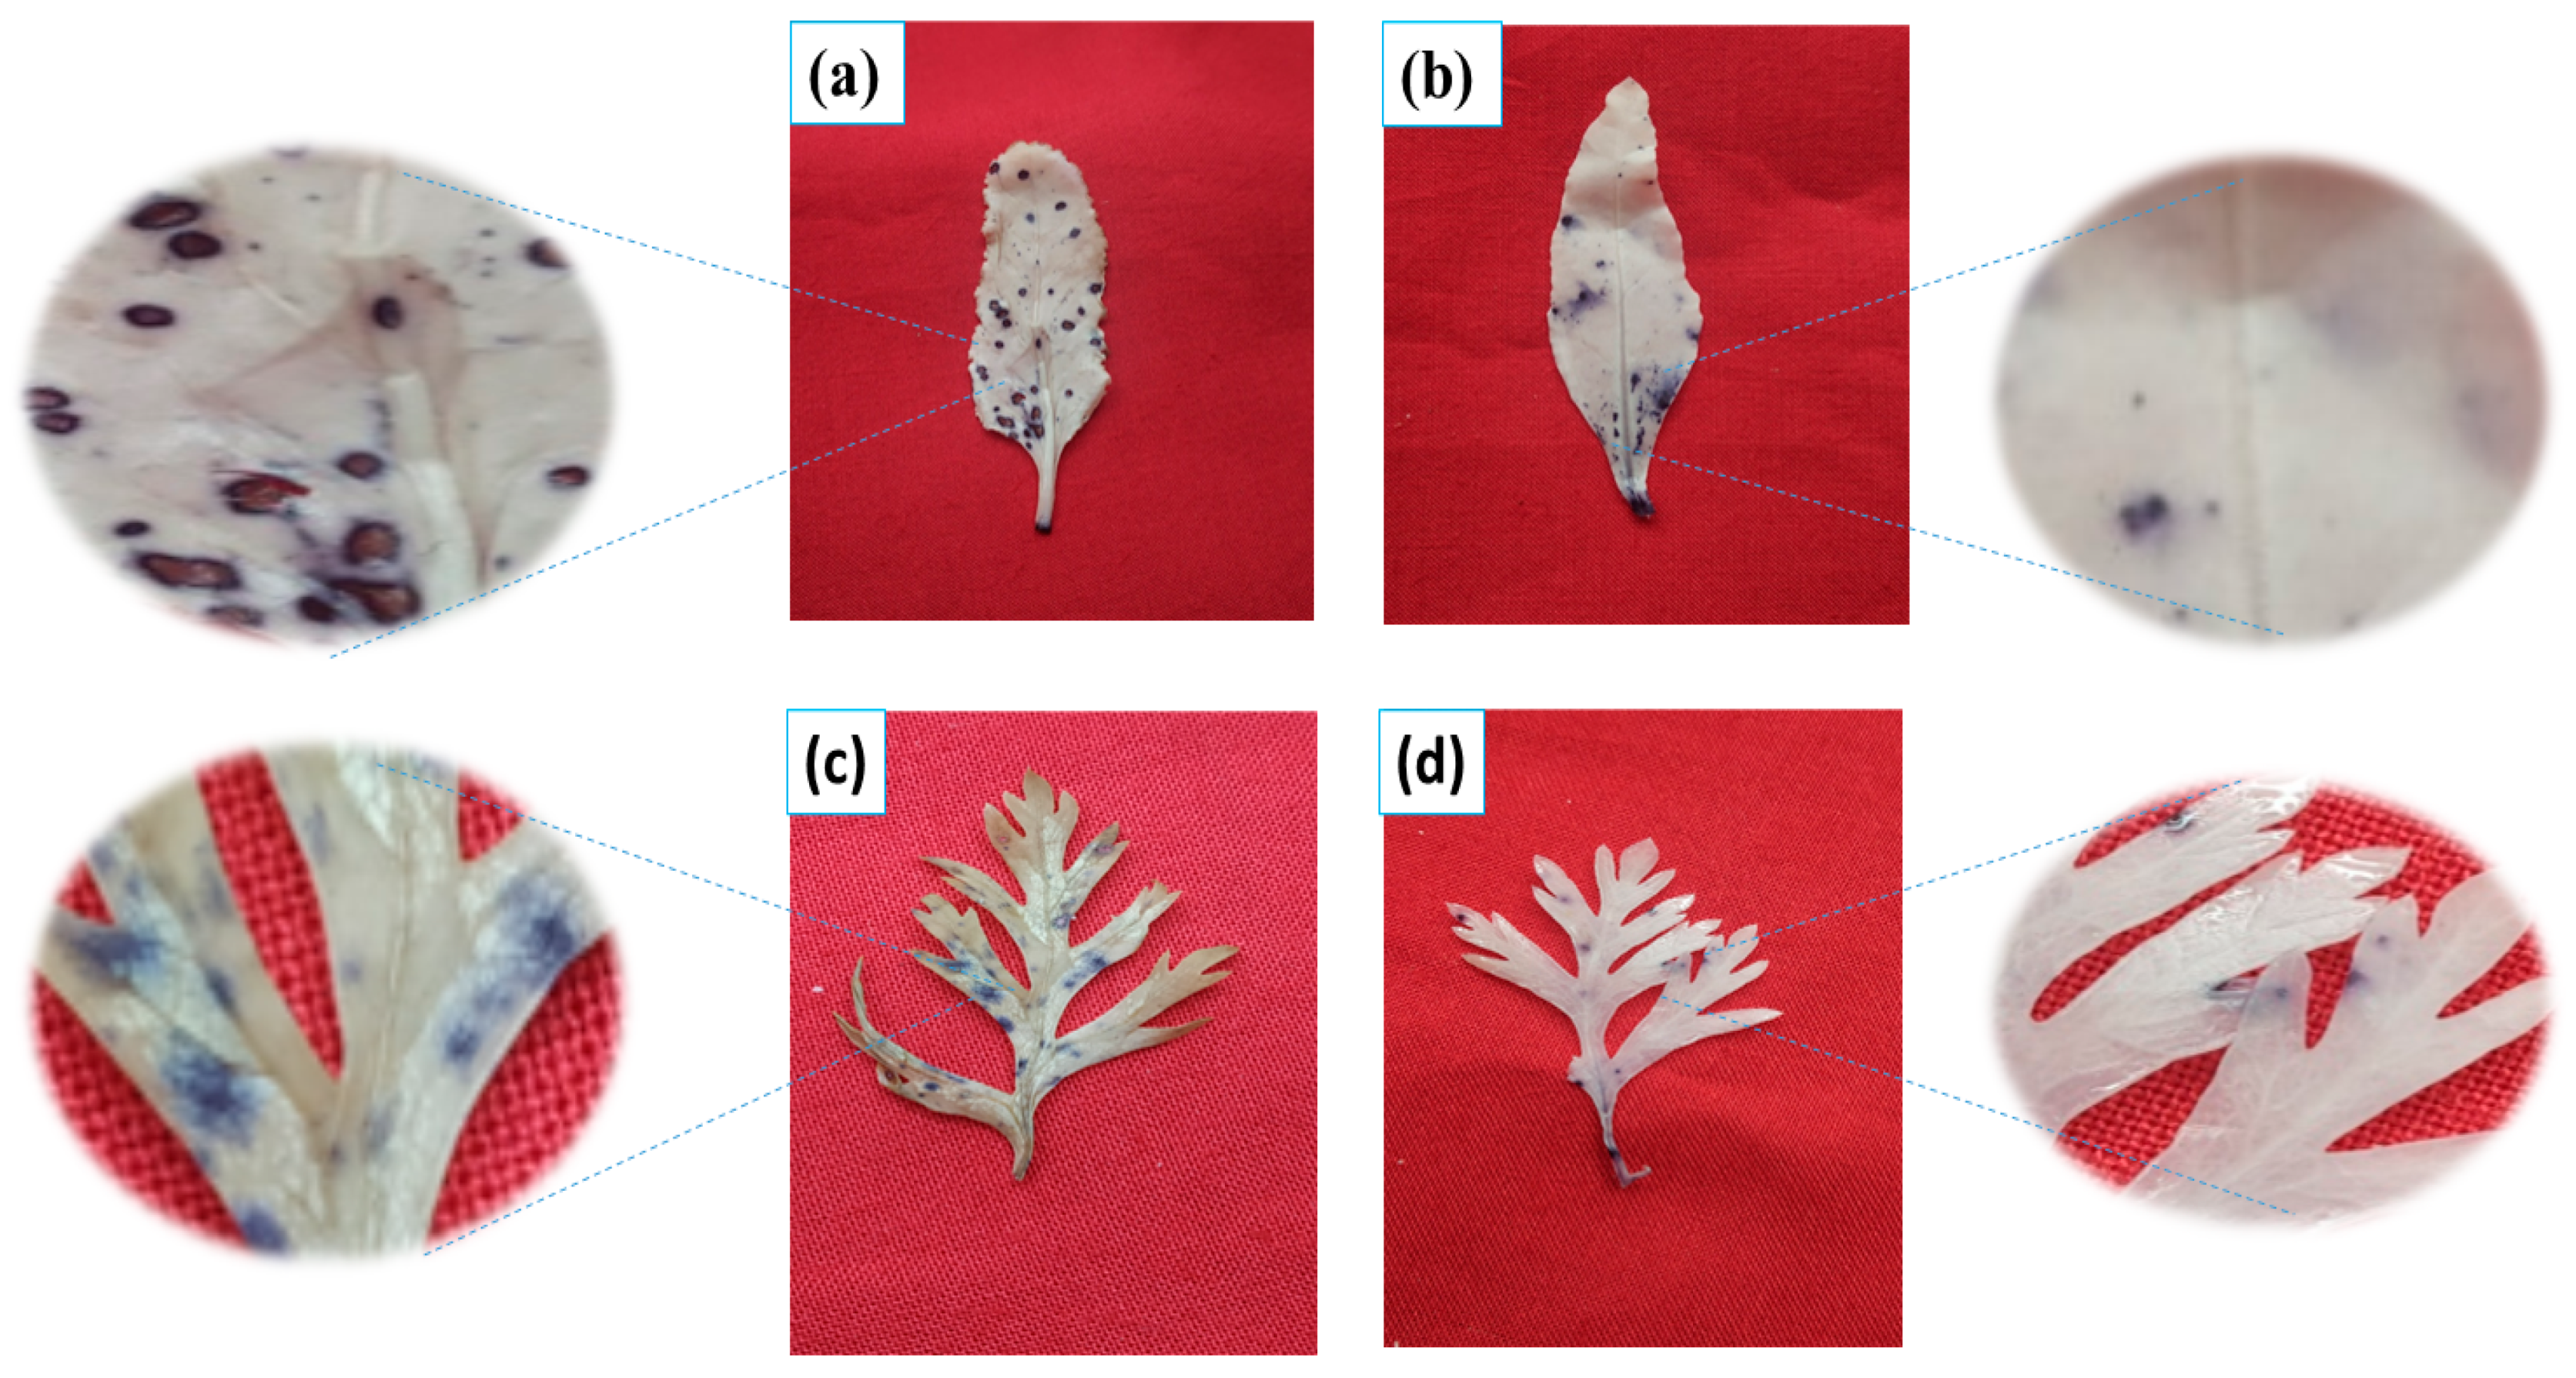
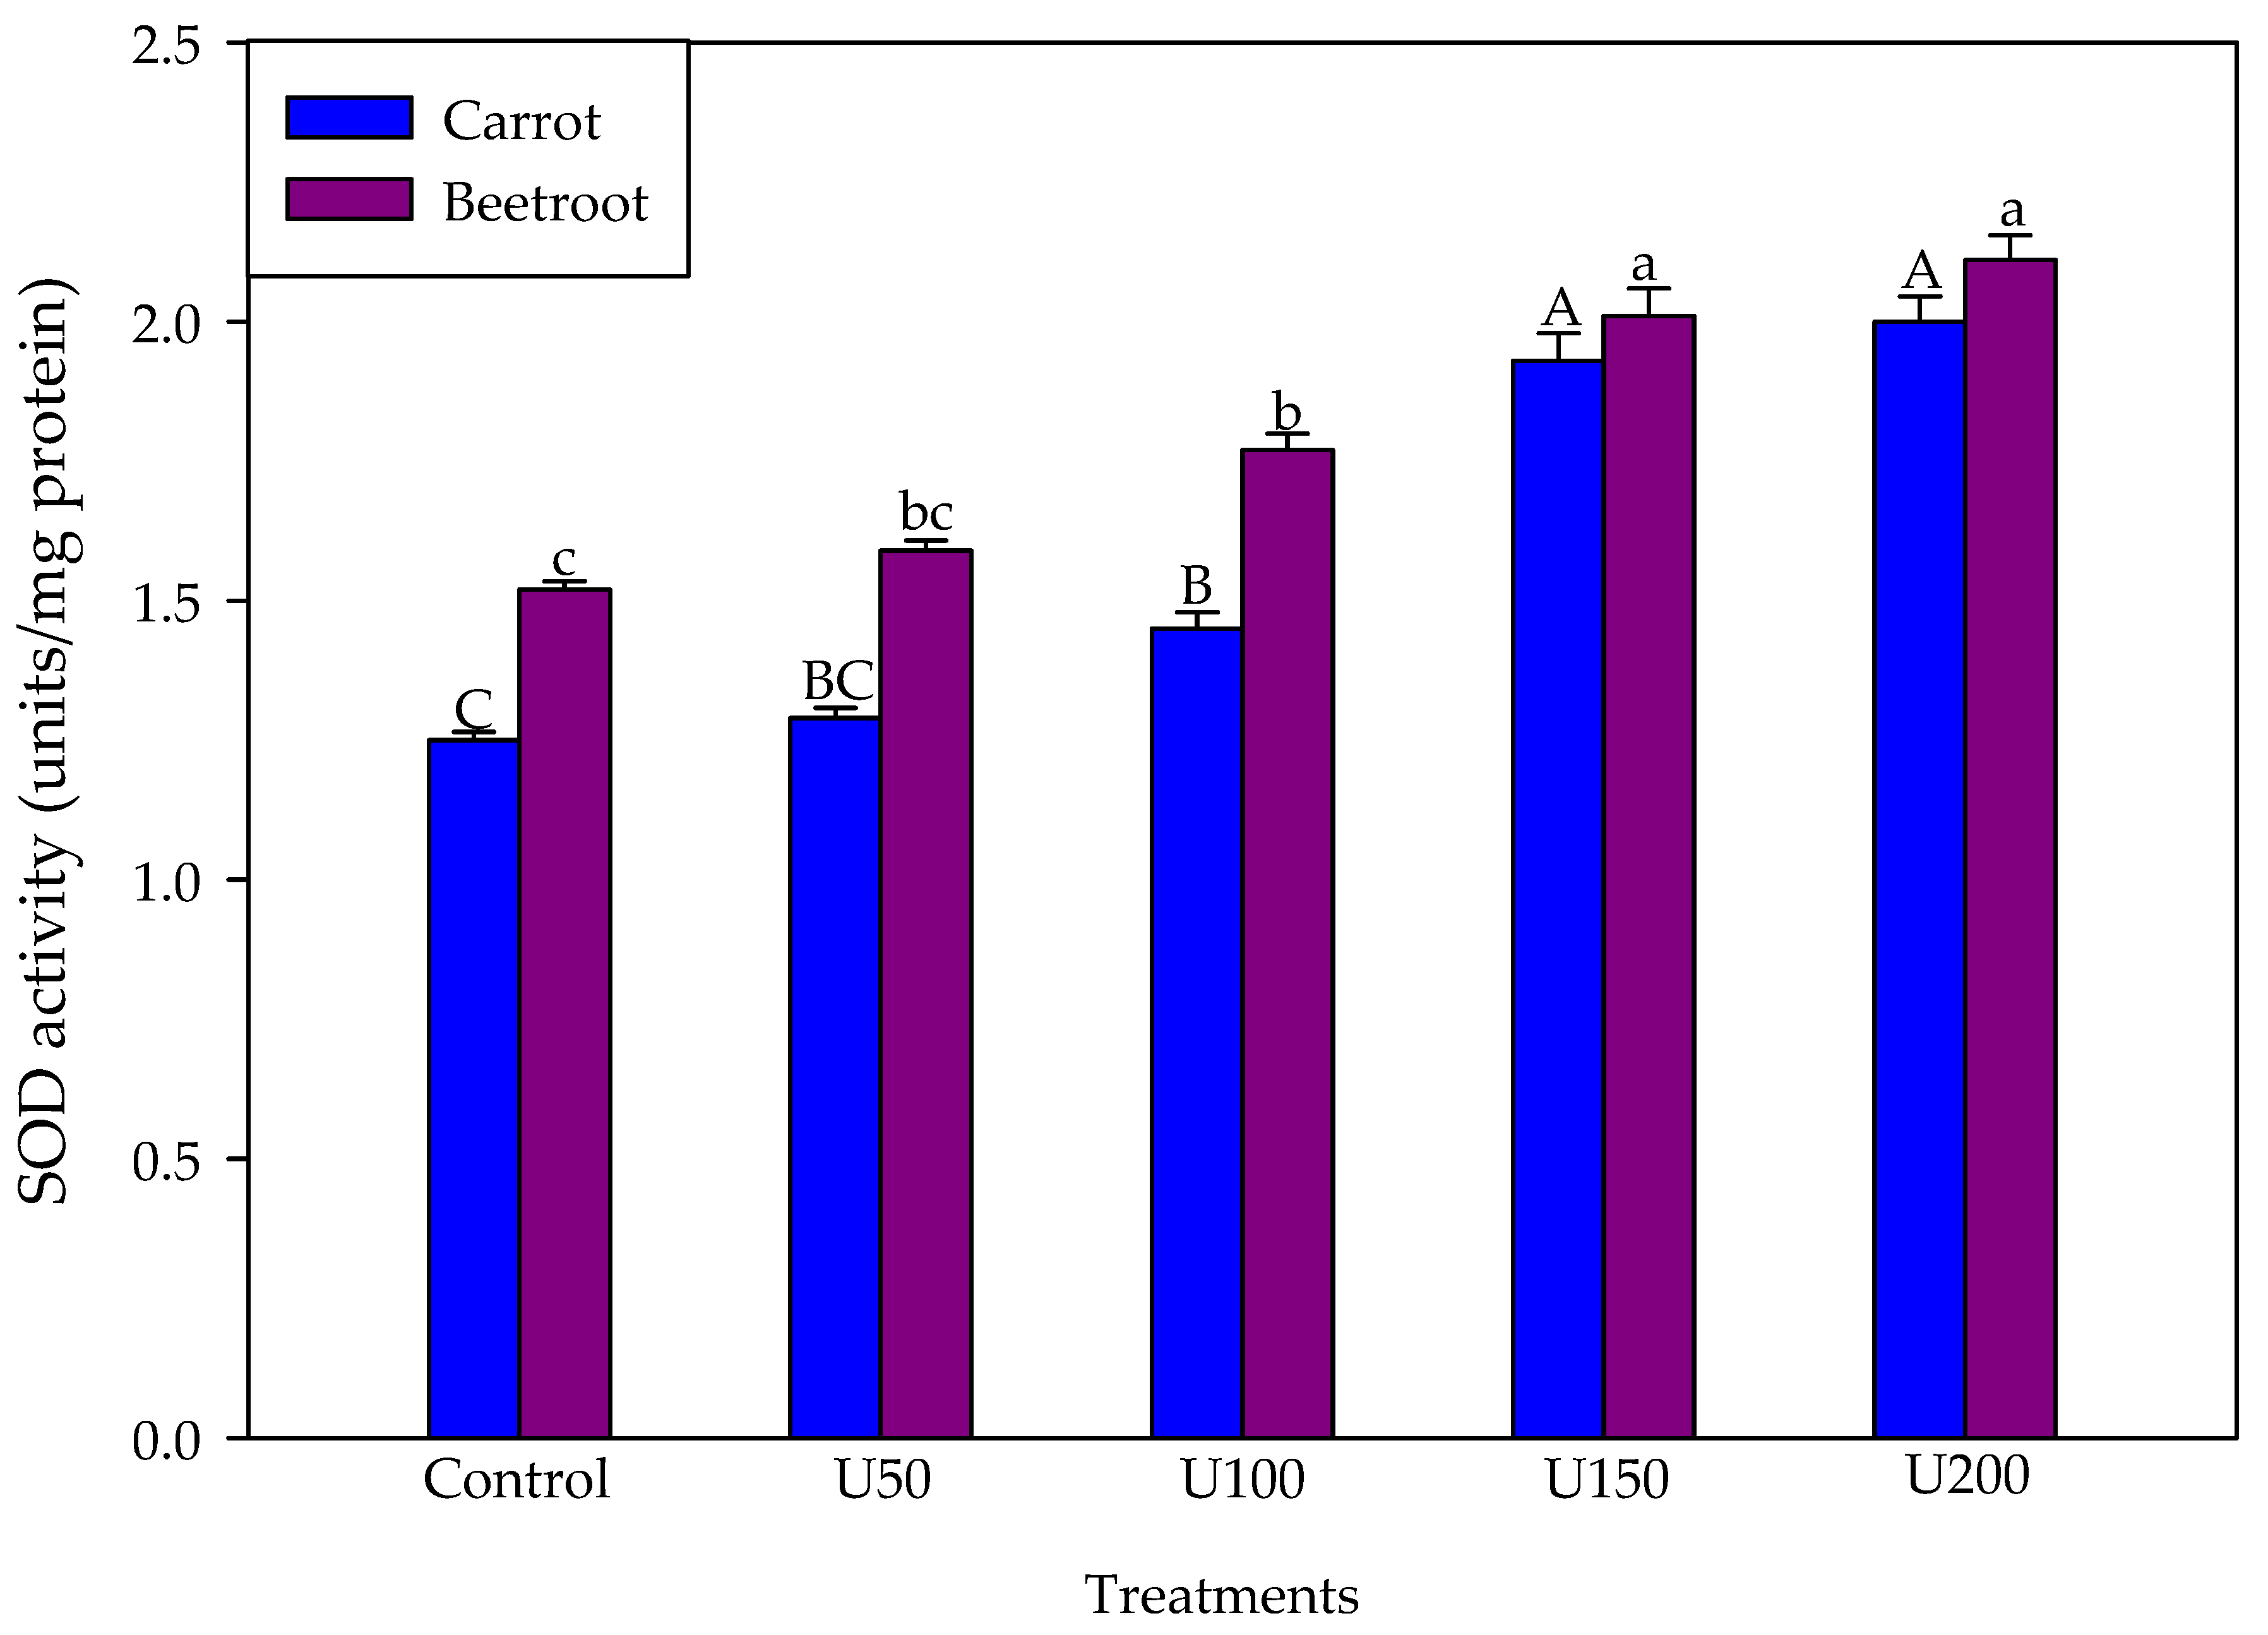
3.5. Effect of N on Superoxide Anions and SOD Activity of the Carrot and Beetroot

The basal application of N at U150 (436.71 mg/kg) significantly reduced the generation of superoxide radicals by 33.33% 30.0% in carrot and beetroot, as compared to their respective controls (Figure 7 and Figure 8). Superoxide dismutase (SOD) which is the principal enzyme of antioxidant defense in plants to scavenge the O2 radicals exhibited a significant enhancement 68.01% and 55.33% in carrot and beetroot as compared to their respective controls (Figure 9).

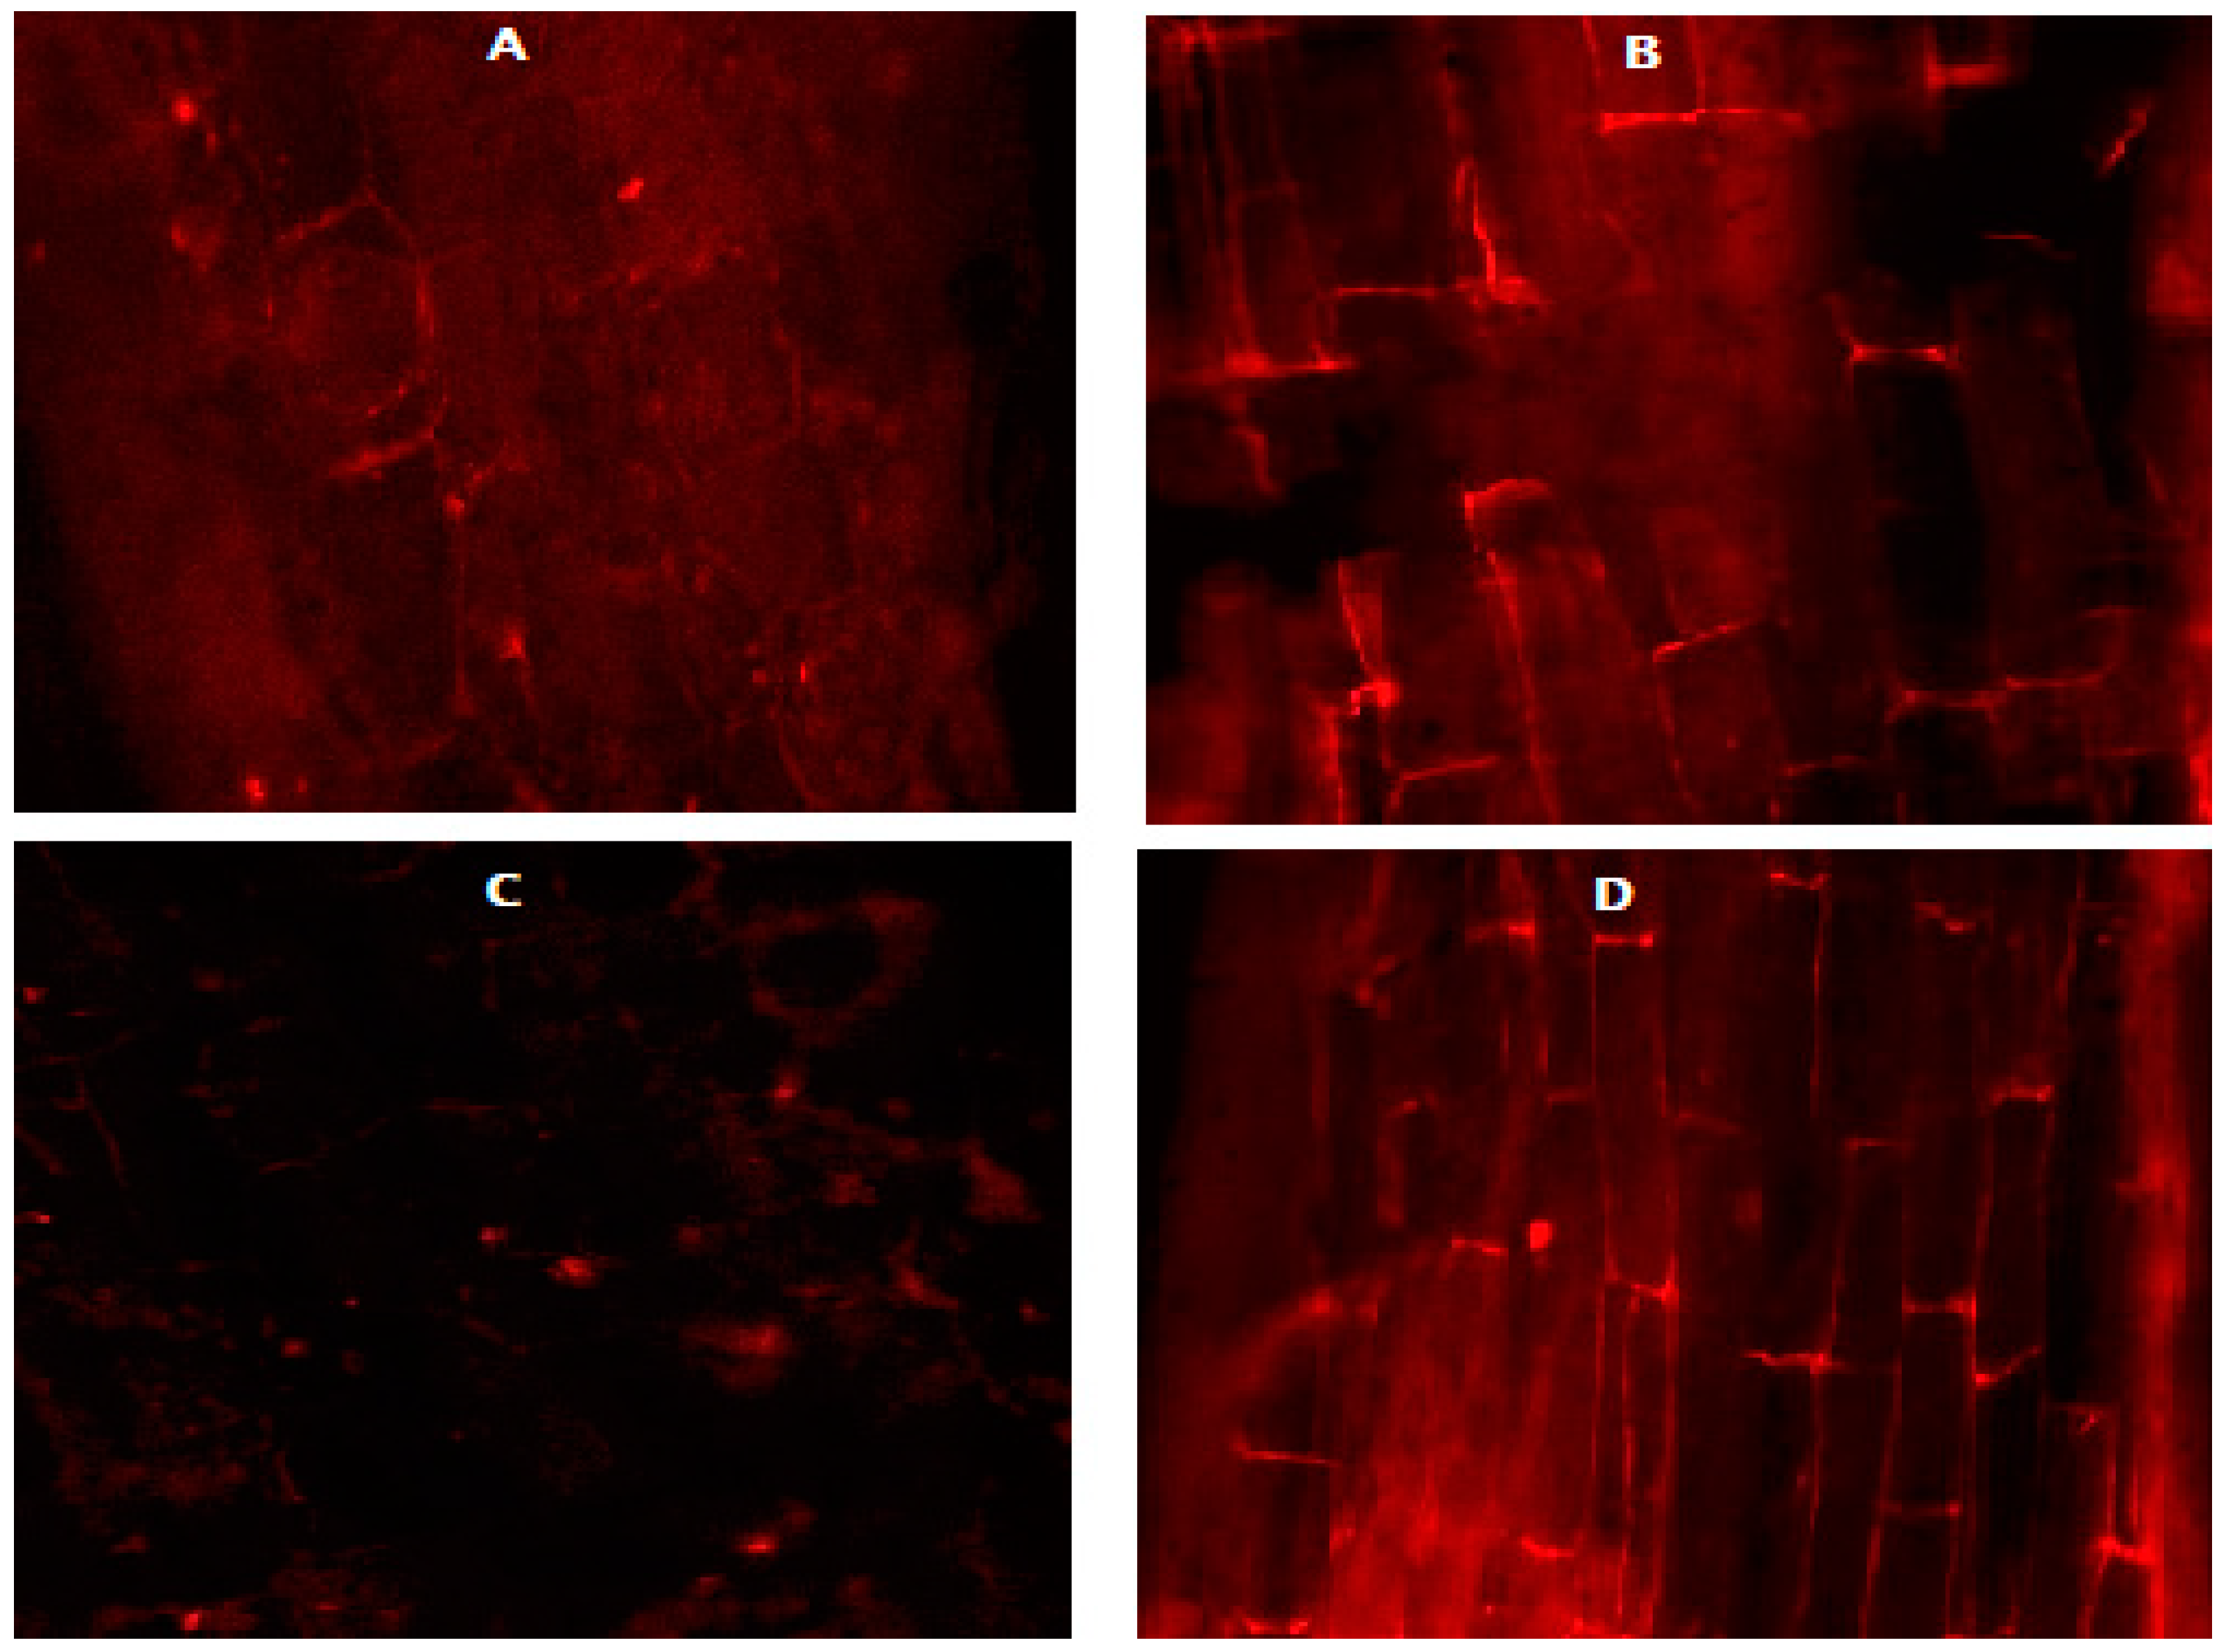
3.6. Effect of N on the Root Cell Viability of the Carrot and Beetroot

Cell viability could be examined visually by observing nucleic acid staining. Viability shows antagonistic effects with stained nuclei. In the present study, N application at U150 (436.71 mg/kg) level improves the viability of the cells for both carrot (Figure 10B) and beetroot (Figure 10D) as compared their respective controls (Figure 10A,C).

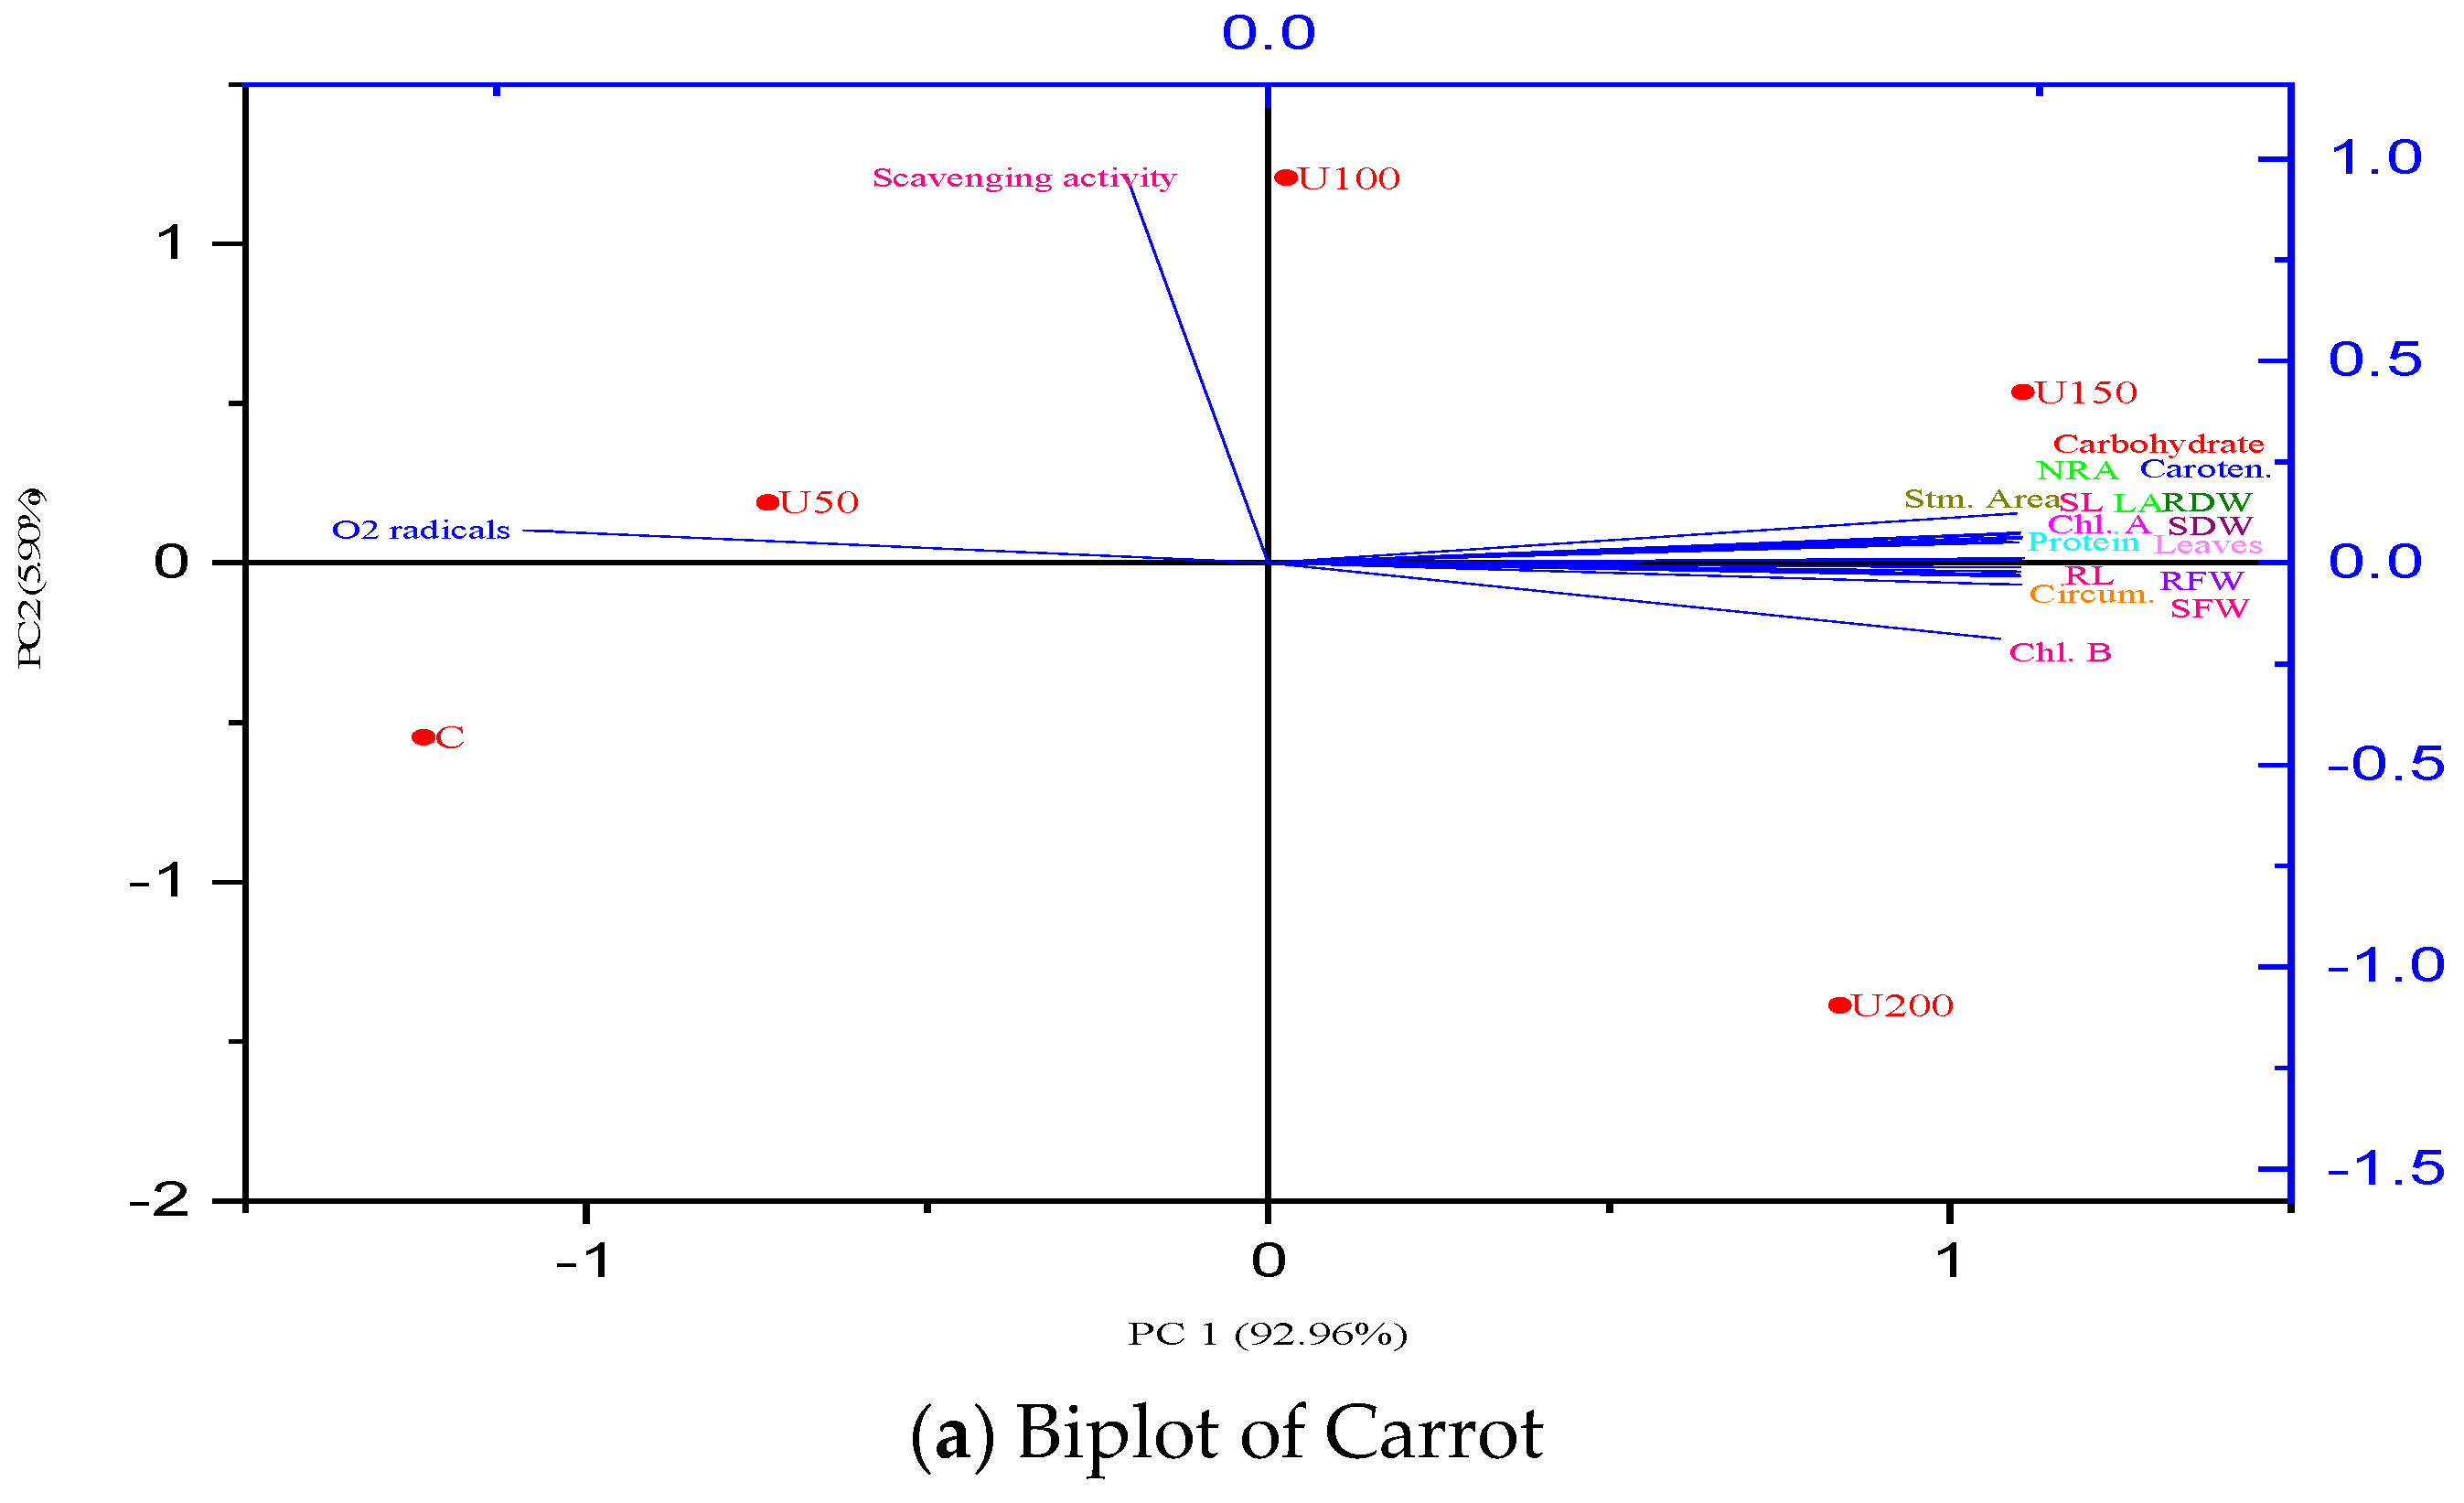
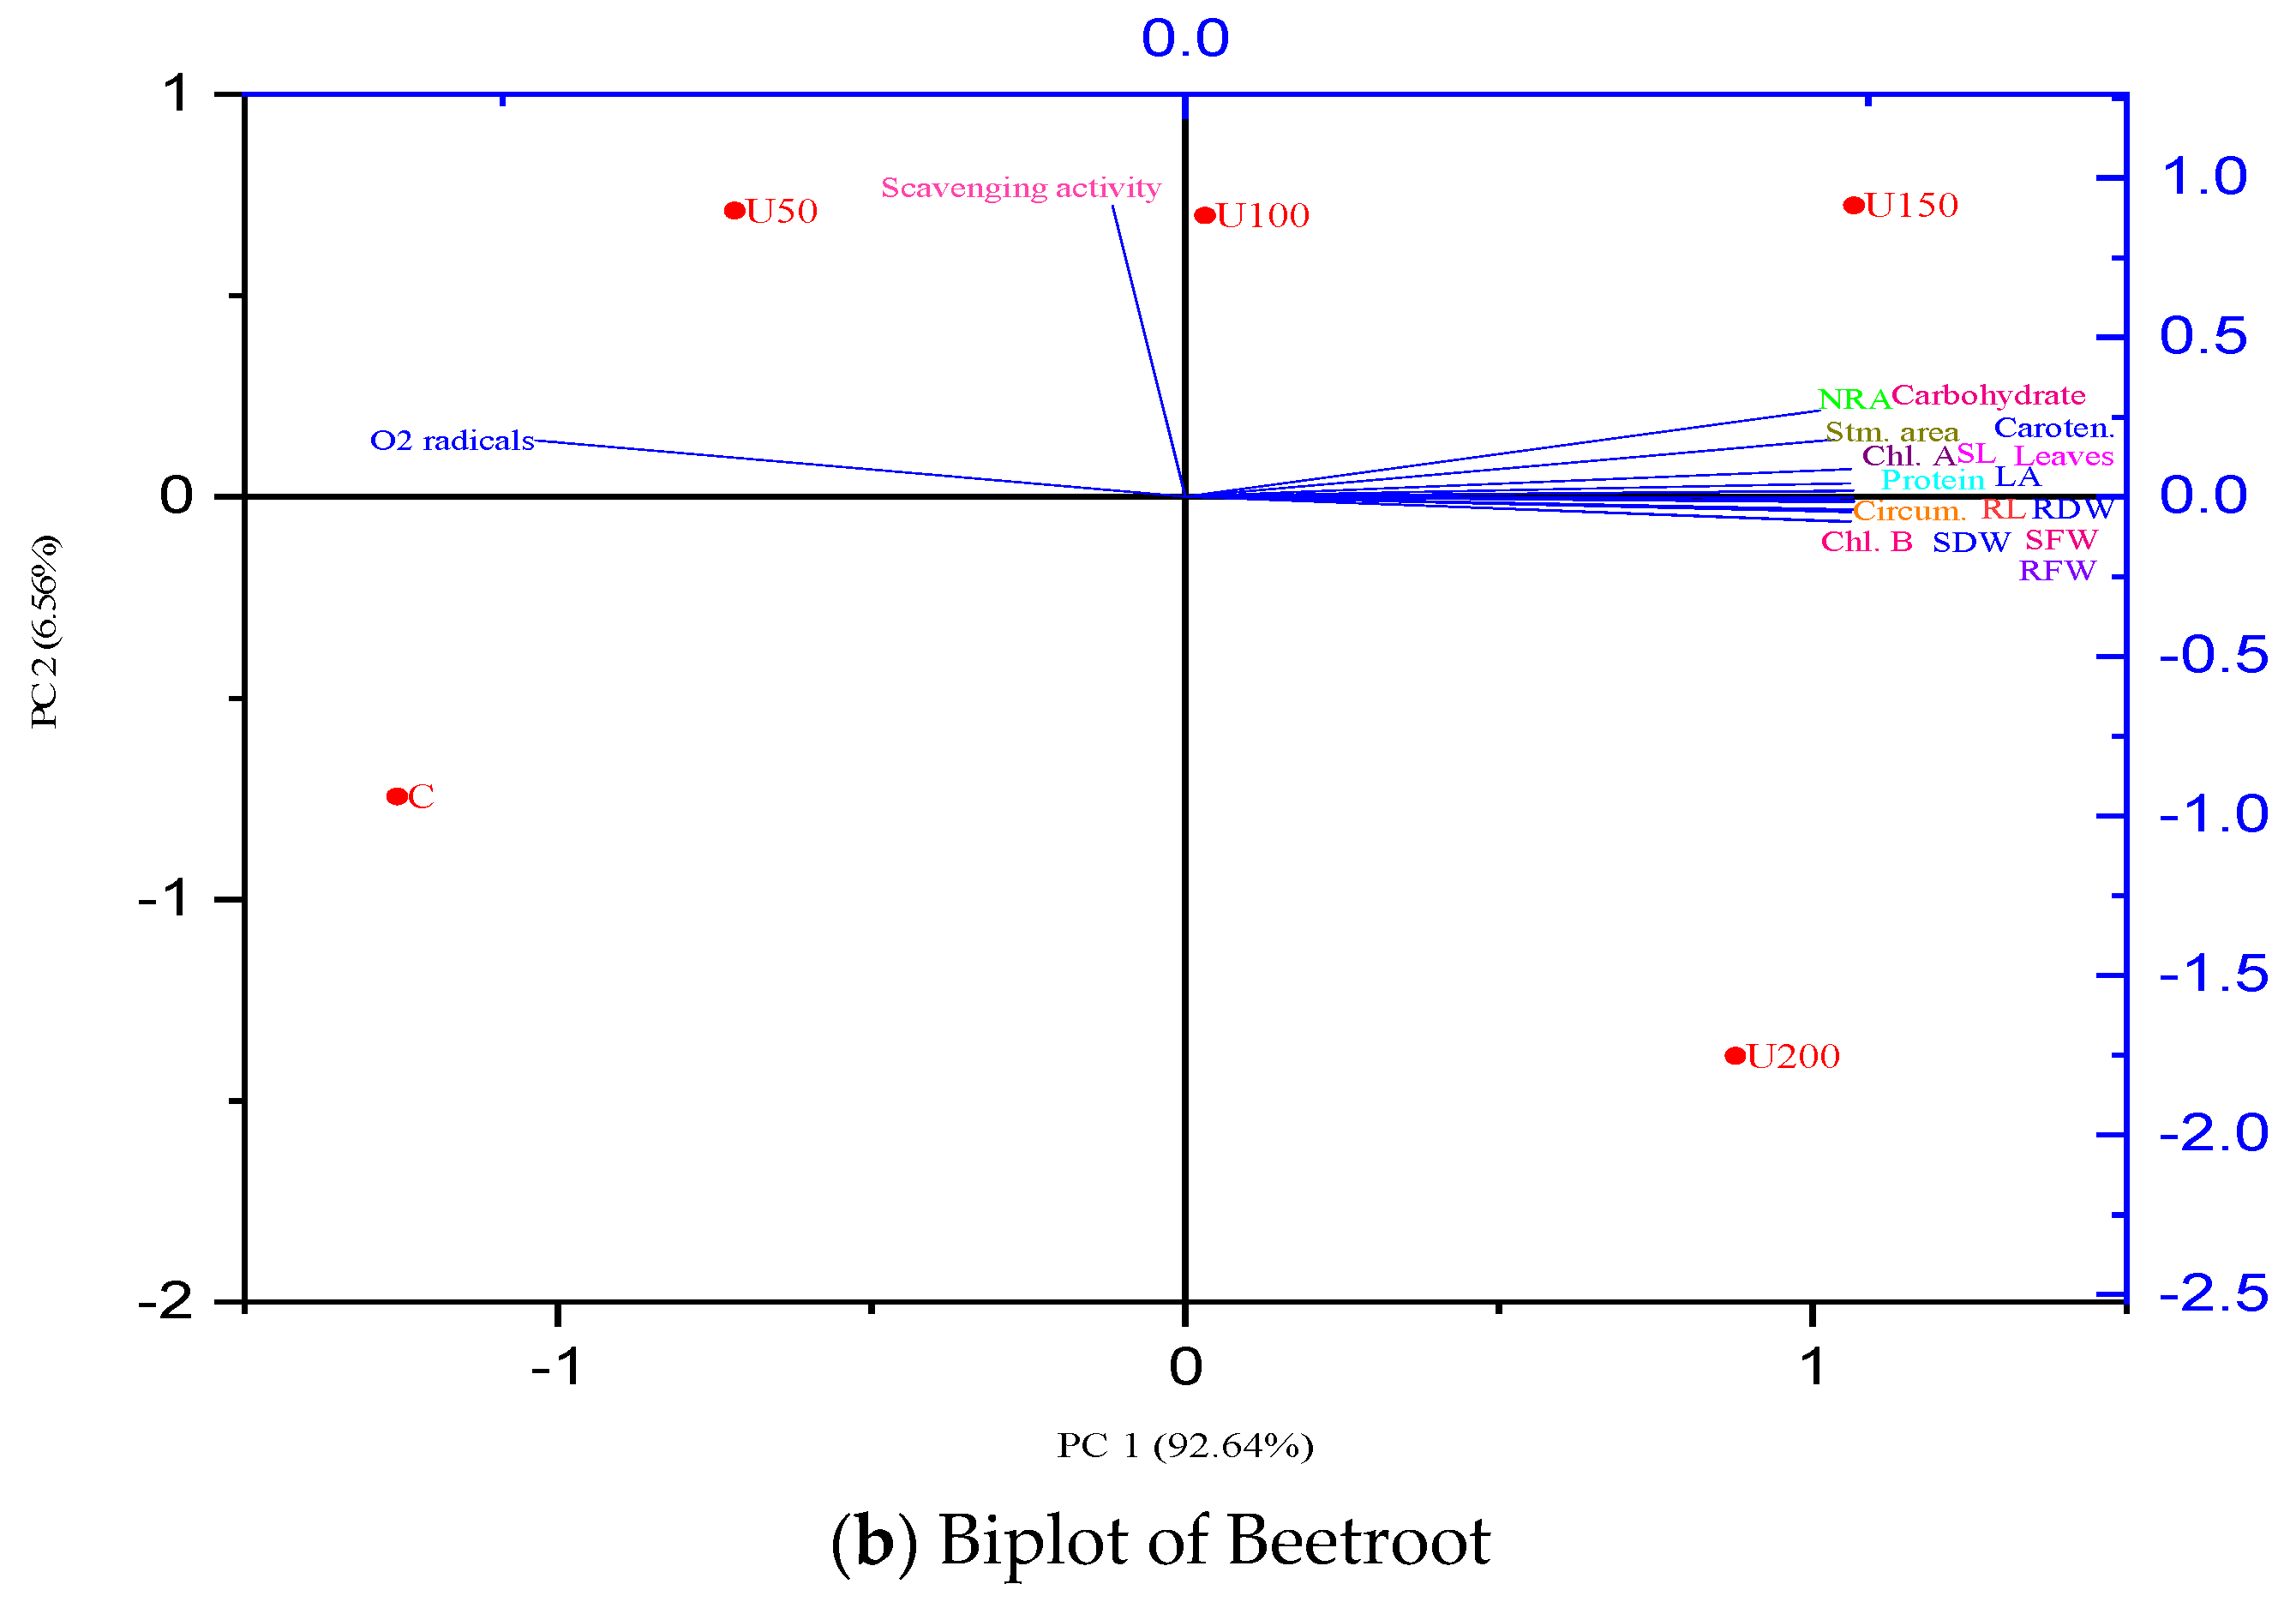
3.7. Principal Component Analysis

The principal component analysis demonstrates a total 98.86% variance (PC1 = 92.96%; PC2 = 5.90%) in the data of carrot and 99.2% variance (PC1 = 92.64; PC = 6.56) in the data of beetroot plants under the basal application of N fertilizer (Figure 11). The growth markers (shoot length, shoot fresh and dry weight, No. of leaves, leaf area, stomatal area), yield attributes (root length, root circumference, root fresh and dry weight), photosynthetic parameters (chlorophyll a and b, and carotenoids), and biochemical are clustered together, thus, exhibit a strong positive correlation the basal application of N in carrot and beetroot. Superoxide radicals showed a negative correlation with the basal application of N in carrot and beetroot. Scavenging activity showed an intermediate correlation with the basal application of N in both the root crops studied.

4. Discussion

Our results found that N supplied as a basal dose in the form of urea at the rate 36.71 mg/kg improved all the growth and yield attributes of carrot and beetroot. The possible reason for this improvement is that N supply increases the number and rate of dividing meristematic cells, leading to the growth of shoot and root systems in plants [36]. Moreover, N application is associated with increased cytokinin levels, which affects the cell wall extensibility to enhance cell division [37]. N also acts as a key constituent of several metabolites, proteins, enzymes, coenzymes, purines and pyrimidines [7]. Additionally, N improves the growth and yield indirectly by increasing the uptake of other nutrients from the soil [38]. It is, therefore, rational to establish the fact that N was engaged directly or indirectly in enhancing the rate of division of cells and production of new tissues, which in turn were responsible for the increase in growth and yield characteristics of carrot and beetroot. Among the different treatments of N used, U150 (N at the rate 436.71 mg/kg) was found as an optimum dose for both the vegetable crops. This is possibly due to the fact that the activity of nitrate reductase, which is the primary N fixing enzyme was found maximum at this concentration. Further increment in N concentration does not benefit the plants because of the saturation of nitrate reductase at U150 (N at the rate 436.71 mg/kg).
Our results also demonstrate a significant improvement in the photosynthetic pigments with the basal application of N at the rate 436.71 mg/kg in carrot and beetroot. This is attributed to the presence of N as a component of photosynthetic apparatus of green plants [39]. Moreover, N distinctly promotes the content of stromal and thylakoid proteins in leaves which results in the formation of active photosynthetic pigments [40]. N fertilizer promotes the formation of chloroplasts, which causes an increase in the lipid content of leaves and chloroplast constituents such as chlorophyll and carotene [41]. Our results are further strengthened by the approach of scanning electron microscopy, which showed that the basal application of N fertilizer at U150 (436.71 mg/kg) markedly enhanced the stomatal area of carrot and beetroot leaves as compared to the control (Figure 8).
Our results further demonstrate that basal application of N at the rate 436.71 mg/kg significantly enhanced the activity of NR and protein content in carrot and beetroot. This is because NR is a key enzyme that plays a vital role in nitrogen uptake and assimilation by plants. Its activity can directly reflect the status of plant nitrogen uptake and utilization [42]. We also observed a marked increment in the protein content of both crops at U150 (436.71 mg/kg) because the basal application of N improved the activity of NR, facilitating its prompt conversion into N precursors for the synthesis of amino acids and henceforth proteins [43]. N enters the food chain through plants mostly as nitrate (NO3) and ammonium ions (NH4+). The transport of NO3 into the root cells is mediated by an active process through H-ATPase. A proton gradient is generated across the plasma membrane that drives the uptake of nitrogen against a concentration gradient. Then, a multi-step, complex process occurs through which mineral N is assimilated by plants (Figure 12). In the first step, NO3 is reduced to NO2 (nitrite) by the enzyme nitrate reductase (NR) in the cytosol. In the second step, NO2 is reduced to ammonia by the enzyme nitrite reductase (NiR). The ammonium thus generated is converted into amino acids in a sequential process. First, glutamine synthetase combines NH4+ with glutamate to form glutamine. Further, glutamine is converted back to glutamate by the enzyme glutamate synthase or GOGAT (glutamine-2 oxoglutarate amino transferase) [44]. This glutamate is converted into other amino acids. Thus, NR activity is directly proportional to protein synthesis. Therefore, at optimum N level (436.71 mg/kg), NR activity is enhanced which consequently improved the protein content of carrot and beetroot.
The basal application of N at the rate 436.71 mg/kg showed a significant influence on the generation of superoxide radicals and antioxidant activity of both the crops (Figure 8, Figure 9 and Figure 10). This is because plants grown in soil with deficient nutrients exhibit increased generation of free radicals like superoxide anions (O2) [45]. An optimum supply of N significantly reduced the generation of O2 radicals by enhancing the antioxidant defense system such as SOD (superoxide dismutase) activity in carrot and beetroot (Figure 10). The enhancement in the antioxidant activity helps in the scavenging of superoxide anion radicals, therefore, localization of O2 radicals were found to be decreasing with increasing N concentrations. Our results are supported by the findings of Singh et al. [46], which demonstrate that N mediated improvement in antioxidant activity accelerates the scavenging of superoxide radicals (O2) from the photosynthetic and respiratory pathways.

5. Conclusions

This work recommends a uniform N dose (U150 = 436.71 mg/kg N) for different root vegetables that will benefit the uneducated agricultural sector of society who otherwise get confused with different N recommendations. Though N application has been studied on various crops and vegetables, this work brings novel insights by taking into consideration the ultrastructural studies through scanning electron microscopy and cell viability through confocal laser microscopy of the two root vegetables under different N levels.

Supplementary Materials

The following are available online at https://www.mdpi.com/article/10.3390/agriculture11080704/s1, Figure S1: Scanning electron micrograph and energy dispersive X-ray of the soil, Table S1: Carrot repeat experiment results, Table S2: Beetroot repeat experiment results.

Author Contributions

A.S. and K.R.H. wrote the manuscript, H.F.A., A.A.B. and N.M.A. revised the manuscript and A.A.K. planned the experiments. All authors have read and agreed to the published version of the manuscript.

Funding

This research received no external funding.

Institutional Review Board Statement

Not applicable.

Informed Consent Statement

Not applicable.

Data Availability Statement

Not applicable.

Acknowledgments

The authors are thankful to USIF, Aligarh Muslim University, India for providing access to Scanning Electron Microscope (SEM) and Energy Dispersive X-ray (EDX) facilities.

Conflicts of Interest

All the authors declare that there exists no conflict of interest.

References

  1. Zhang, X.; Davidson, E.A.; Mauzerall, D.L.; Searchinger, T.D.; Dumas, P.; Shen, Y. Managing nitrogen for sustainable development. Nature 2015, 528, 51. [Google Scholar] [CrossRef] [PubMed] [Green Version]
  2. Zhou, L.; Zhao, P.; Chi, Y.; Wang, D.; Wang, P.; Liu, N.; Cai, D.; Wu, N.; Zhong, N. Controlling the hydrolysis and loss of nitrogen fertilizer (urea) by using a nanocomposite favors plant growth. ChemSusChem 2017, 10, 2068–2079. [Google Scholar] [CrossRef] [PubMed]
  3. Dimkpa, C.O.; Fugice, J.; Singh, U.; Lewis, T.D. Development of fertilizers for enhanced nitrogen use efficiency—Trends and perspectives. Sci. Total Environ. 2020, 731, 139113. [Google Scholar] [CrossRef]
  4. Dong, N.Q.; Lin, H.X. Higher yield with less nitrogen fertilizer. Nature Plants 2020, 6, 1078–1079. [Google Scholar] [CrossRef]
  5. Zhang, Z.; Zhang, Y.; Shi, Y.; Yu, Z. Optimized split nitrogen fertilizer increase photosynthesis, grain yield, nitrogen use efficiency and water use efficiency under water-saving irrigation. Sci. Rep. 2020, 10, 1–14. [Google Scholar]
  6. Jiao, X.; Lyu, Y.; Wu, X.; Li, H.; Cheng, L.; Zhang, C.; Yuan, L.; Jiang, R.; Jiang, B.; Rengel, Z. Grain production versus resource and environmental costs: Towards increasing sustainability of nutrient use in China. J. Exp. Bot. 2016, 67, 4935–4949. [Google Scholar] [CrossRef]
  7. Marschner, H. Marschner’s Mineral Nutrition of Higher Plants; Academic Press: Cambridge, MA, USA, 2011. [Google Scholar]
  8. Aghavani, M.; Zaeimzadeh, A.; Savadkoohi, S.; Samiei, L. Salinity tolerance of Kentucky bluegrass as affected by nitrogen fertilization. J. Biol. Sci. 2017, 368, 20130164. [Google Scholar] [CrossRef]
  9. Chen, Y.; Xiao, C.; Wu, D.; Xia, T.; Chen, Q.; Chen, F.; Yuan, L.; Mi, G. Effects of nitrogen application rate on grain yield and grain nitrogen concentration in two maize hybrids with contrasting nitrogen remobilization efficiency. Eur. J. Agron. 2015, 62, 79–89. [Google Scholar] [CrossRef]
  10. Mu, X.; Chen, Q.; Chen, F.; Yuan, L.; Mi, G. A RNA-Seq analysis of the response of photosynthetic system to low nitrogen supply in maize leaf. Int. J. Mol. Sci. 2017, 18, 2624. [Google Scholar] [CrossRef] [Green Version]
  11. Rehman, M.; Yang, M.; Fahad, S.; Saleem, M.H.; Liu, L.; Liu, F.; Deng, G. Morpho-physiological traits, antioxidant capacity, and nitrogen metabolism in ramie under nitrogen fertilizer. Agron. J. 2020, 112, 2988–2997. [Google Scholar] [CrossRef]
  12. Yao, Z.; Wang, Z.; Fang, B.; Chen, J.; Zhang, X.; Luo, Z.; Huang, L.; Zou, H.; Yang, Y. Involvement of nitrogen in storage root growth and related gene expression in sweet potato (Ipomoea batatas). Plant Biol. 2020, 22, 376–385. [Google Scholar] [CrossRef]
  13. Fowler, D.; Coyle, M.; Skiba, U.; Sutton, M.A.; Cape, J.N.; Reis, S.; Sheppard, L.J.; Jenkins, A.; Grizzetti, B.; Galloway, J.N.; et al. The global nitrogen cycle in the twenty-first century. Philos. Trans. R. Soc. Lond. B Biol. Sci. 2013, 368, 1621. [Google Scholar]
  14. Hill, J.; Goodkind, A.; Tessum, C.; Thakrar, S.; Tilman, D.; Polasky, S.; Smith, T.; Hunt, N.; Mullins, K.; Clark, M.; et al. Air-quality-related health damages of maize. Nat. Sust. 2019, 2, 397–403. [Google Scholar] [CrossRef]
  15. Mu, X.; Chen, Y. The physiological response of photosynthesis to nitrogen deficiency. Plant Physiol. Biochem. 2020. [Google Scholar] [CrossRef]
  16. Department of Agriculture, Cooperation & Farmers Welfare, Ministry of Agriculture and Farmers Welfare, Govt. of India, Krishi Bhawan, New Delhi-110001. Annual Report (2016–2017). Available online: www.agricoop.nic.in (accessed on 17 December 2020).
  17. Singh, B.K.; Koley, T.K.; Maurya, A.; Singh, P.M.; Singh, B. Phytochemical and antioxidative potential of orange, red, yellow, rainbow and black coloured tropical carrots (Daucus carota subsp. sativus Schubl. & Martens). Physiol. Mol. Biol. Plants 2018, 24, 99–907. [Google Scholar]
  18. Venkataramanan, R.; Gunasekaran, S.; Sreekumar, C.; Anilkumar, R.; Iyue, M. Nutritional value and suitability of carrot whole top as green fodder. Ind. J. Veter. Anim. Sci. Res. 2015, 44, 49–52. [Google Scholar]
  19. Ahmad, T.; Cawood, M.; Iqbal, Q.; Arino, A.; Batool, A.; Tariq, R.M.S.; Azam, M.; Akhtar, S. Phytochemicals in Daucus carota and their health benefits. Foods 2019, 8, 424. [Google Scholar] [CrossRef] [PubMed] [Green Version]
  20. Kale, R.G.; Sawate, A.R.; Kshirsagar, R.B.; Patil, B.M.; Mane, R.P. Studies on evaluation of physical and chemical composition of beetroot (Beta vulgaris L.). Int. J. Chem. Stud. 2018, 6, 2977–2979. [Google Scholar]
  21. Panghal, A.; Virkar, K.; Kumar, V.; Dhull, S.B.; Gat, Y.; Chhikara, N. Development of probiotic beetroot drink. Curr. Res. Nutr. Food Sci. 2017, 24, 5. [Google Scholar] [CrossRef]
  22. Shakeel, A.; Khan, A.; Hakeem, K.R. Growth, biochemical, and antioxidant response of beetroot (Beta vulgaris L.) grown in fly ash-amended soil. SN Appl. Sci. 2020, 2, 1–9. [Google Scholar] [CrossRef]
  23. Priha, O.; Smolander, A. Nitrogen transformations in soil under Pinus sylvestris, Picea abies and Betula pendula at two forest sites. Soil Biol. Biochem. 1999, 31, 965–977. [Google Scholar] [CrossRef]
  24. Jackson, M.L. Soil Chemical Analysis; Prentice-Hall: New Delhi, India, 1958. [Google Scholar]
  25. Rayment, G.E.; Higginson, F.R. Australian Laboratory Handbook of Soil and Water Chemical Methods; Inkata Press Pty Ltd.: Mount Waverley, Australia, 1992. [Google Scholar]
  26. Kjeldahl, C. A new method for the determination of nitrogen in organic matter. Z. Anal. Chem. 1883, 22, 336. [Google Scholar]
  27. Dickman, S.R.; Bray, R.H. Colorimetric determination of phosphate. Ind. Eng. Chem. Anal. 1940, 12, 665–668. [Google Scholar] [CrossRef]
  28. Maclachlan, S.; Zalik, S. Plastid structure, chlorophyll concentration, and free amino acid composition of a chlorophyll mutant of barley. Can. J. Bot. 1963, 41, 1053–1062. [Google Scholar] [CrossRef]
  29. Jaworski, E.G. Nitrate reductase assay in intact plant tissues. Biochem. Biophys. Res. Commun. 1971, 43, 1274–1279. [Google Scholar] [CrossRef]
  30. Bradford, M.M. A rapid and sensitive method for the quantitation of microgram quantities of protein utilizing the principle of protein-dye binding. Anal. Biochem. 1976, 72, 248–254. [Google Scholar] [CrossRef]
  31. Hedge, J.E.; Hofreiter, B.T.; Whistler, R.L. Methods in Carbohydrate Chemistry; Academic Press: New York, NY, USA, 1962. [Google Scholar]
  32. Shimada, K.; Fujikawa, K.; Yahara, K.; Nakamura, T. Antioxidative properties of xanthan on the antioxidation of soybean oil in cyclodextrin emulsion. J. Agric. Food Chem. 1992, 40, 945–948. [Google Scholar] [CrossRef]
  33. Wu, G.L.; Cui, J.; Tao, L.; Yang., H. Fluroxypyr triggers oxidative damage by producing superoxide and hydrogen peroxide in rice (Oryza sativa). Ecotoxicology 2010, 19, 124–132. [Google Scholar] [CrossRef] [PubMed]
  34. Kaur, N.; Sharma, I.; Kirat, K.; Pati, P.K. Detection of reactive oxygen species in Oryza sativa L. (rice). Bio-Protocol 2016, 6, 2061. [Google Scholar] [CrossRef]
  35. Dhindsa, R.S.; Plumb-Dhindsa, P.; Throne, T.A. Leaf senescence: Correlated with increased levels of membrane permeability and lilpd peroxidation and decreased levels of superoxide dismutase and catalase. J. Exp. Bot. 1981, 32, 93. [Google Scholar] [CrossRef]
  36. Lawlor, D.W. Carbon and nitrogen assimilation in relation to yield mechanisms are the key to understanding production systems. J. Exp. Bot. 2002, 53, 773–787. [Google Scholar] [CrossRef] [PubMed]
  37. Kamada-Nobusada, T.; Makita, N.; Kojima, M.; Sakakibara, H. Nitrogen-dependent regulation of de novo cytokinin biosynthesis in rice: The role of glutamine metabolism as an additional signal. Plant Cell Physiol. 2013, 54, 18811893. [Google Scholar] [CrossRef] [PubMed] [Green Version]
  38. Bloom, A.J. The increasing importance of distinguishing among plant nitrogen sources. Curr. Opin. Plant Biol. 2015, 25, 10–16. [Google Scholar] [CrossRef]
  39. Basi, D.; Menossi, M.; Mattiello, L. Nitrogen supply influences photosynthesis establishment along the sugarcane leaf. Sci. Rep. 2018, 8, 2327. [Google Scholar] [CrossRef] [PubMed] [Green Version]
  40. Teixeira, F.; Andreotti, M.C.M.; Arf, S.B.M.; Eustaquio de Sa, M.O. Application times, sources and doses of nitrogen on wheat cultivars under no till in the Cerrado region. Cienc. Rural St. Maria 2011, 41, 1375–1382. [Google Scholar] [CrossRef]
  41. Hong, L.; Li, M.; Luo, J.; Cao, X.; Qu, L.; Gai, Y.; Jiang, X.; Liu, T.; Janz, H.; Bai, D.; et al. N fertilization has different effects on the growth, carbon and nitrogen physiology, and wood properties of slow- and fast growing Populus species. J. Exp. Bot. 2012, 63, 6173–6185. [Google Scholar]
  42. Li, Y.; Liu, K.; Zhu, J.; Jiang, Y.; Huang, Y.; Zhou, Z.; Chen, C.; Yu, F. Manganese accumulation and plant physiology behavior of Camellia oleifera in response to different levels of nitrogen fertilization. Ecotoxicol. Environ. Saf. 2019, 184, 109603. [Google Scholar] [CrossRef]
  43. Ahanger, M.A.; Qin, C.; Begum, N.; Maodong, Q.; Dong, X.X.; El-Esawi, M.; El-Sheikh, M.A.; Alatar, A.A.; Zhang, L. Nitrogen availability prevents oxidative effects of salinity on wheat growth and photosynthesis by up-regulating the antioxidants and osmolytes metabolism, and secondary metabolite accumulation. BMC Plant Biol. 2019, 19, 1–12. [Google Scholar] [CrossRef] [PubMed]
  44. Krapp, A. Plant nitrogen assimilation and its regulation: A complex puzzle with missing pieces. Curr. Opin. Plant Biol. 2015, 25, 115–122. [Google Scholar] [CrossRef]
  45. Karuppanapandian, T.; Moon, J.C.; Kim, C.; Manoharan, K.; Kim, W. Reactive oxygen species in plants: Their generation, signal transduction, and scavenging mechanisms. Aust. J. Crop Sci. 2011, 5, 709–725. [Google Scholar]
  46. Singh, M.; Singh, V.P.; Prasad, S.M. Nitrogen alleviates salinity toxicity in Solanum lycopersicum seedlings by regulating ROS homeostasis. Plant Physiol. Biochem. 2019, 141, 466–476. [Google Scholar] [CrossRef] [PubMed]
Figure 1. Impact of different N levels on the growth attributes of carrot and beetroot. Data from experiments are collected as the mean of three replicates ± standard error (SE). Different alphabets used indicate significant differences between treatments at p < 0.05, (n = 3).
Agriculture 11 00704 g001
Figure 2. Impact of different N levels on the yield attributes of carrot and beetroot. Data from experiments are collected as the mean of three replicates ± standard error (SE). Different alphabets used indicate significant differences between treatments at p < 0.05, (n = 3).
Agriculture 11 00704 g002
Figure 3. Scanning electron micrograph of carrot and beetroot leaves, showing the impact of different N levels on the stomatal aperture of carrot at control and U150 and stomatal aperture of beetroot at control and U150.
Agriculture 11 00704 g003
Figure 4. Impact of different N levels on the photosynthetic pigments of carrot and beetroot. Data from experiments are collected as the mean of three replicates ± standard error (SE). Different alphabets used indicate significant differences between treatments at p < 0.05, (n = 3).
Agriculture 11 00704 g004
Figure 5. Impact of different N levels on the biochemical attributes, and antioxidant activity of carrot and beetroot. Data from experiments are collected as the mean of three replicates ± standard error (SE). Data represent mean of three independent replicates ± standard error (SE).
Agriculture 11 00704 g005
Figure 6. Impact of different N levels on the N uptake by carrot and beetroot. Data from experiments are collected as the mean of three replicates ± standard error (SE).
Agriculture 11 00704 g006
Figure 7. Impact of different N levels on the generation of superoxide radicals (and their histochemical localization in the leaves of beetroot at control (a) and U150 (b) and carrot at control (c) and U150 (d).
Agriculture 11 00704 g007
Figure 8. Impact of different N levels on the generation of superoxide radicals (O2) in the leaves of carrot and beetroot.
Agriculture 11 00704 g008
Figure 9. Impact of different N levels on SOD activity of carrot and beetroot. Data from experiments are collected as the mean of three replicates ± standard error (SE).
Agriculture 11 00704 g009
Figure 10. Confocal micrographic images of the root cells of carrot at U150 (A) and its control (B) and root cells of beetroot at U150 (C) and its control (D).
Agriculture 11 00704 g010
Figure 11. The biplots of PCA for carrot (a) and beetroot (b) presenting the impact of different levels of N on the studied parameters of carrot and beetroot; SL = shoot length; SFW = shoot fresh weight; SDW = shoot dry weight; LA = leaf area; RL = root length; Circum. = root circumference; RFW = root fresh weight; RFW = root dry weight; Chl. A = chlorophyll a, Chl. B = chlorophyll b; Caroten. = carotenoids; NRA = nitrate reductase activity; O2- radicals = superoxide anion radicals.
Agriculture 11 00704 g011aAgriculture 11 00704 g011b
Figure 12. Schematic diagram showing the role of (NR) nitrate reductase in N assimilation by plants. NO3 is converted into NO2 by NR (nitrate reductase). NO2 is further converted into NH4+ by NiR (nitrite reductase). NH4+ is converted into amino acids by GS-GOGAT (glutamine synthetase, GS; glutamate-2-oxoglutarate aminotransferase).
Agriculture 11 00704 g012
Table 1. Physicochemical characteristics of the soil.
CharacteristicsTexturepHEC (μ mhos cm−1)Porosity (%)Water Holding Capacity (%)N (%)p (%)K (%)
ResultsSandy loam7.62278.4435.8740.671.531.9312.23
Publisher’s Note: MDPI stays neutral with regard to jurisdictional claims in published maps and institutional affiliations.

