Article

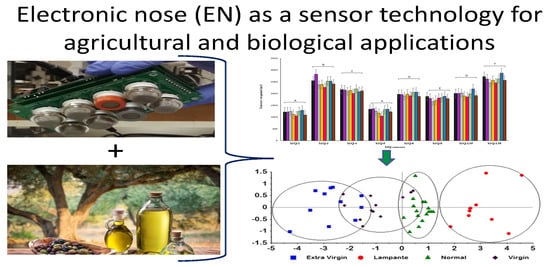
Identification and Quantification of Olive Oil Quality Parameters Using an Electronic Nose

Department of Agricultural Biotechnology, Faculty of Agricultural Sciences and Technology, Palestine Technical University-Kadoorie (PTUK), Tulkarm P.O. Box 7, Palestine
Agriculture 2021, 11(7), 674; https://doi.org/10.3390/agriculture11070674
Submission received: 10 June 2021 / Revised: 9 July 2021 / Accepted: 13 July 2021 / Published: 16 July 2021
(This article belongs to the Special Issue Applications of Sensor Technology to Agri-Food Systems)

Abstract

:
An electronic nose (EN), which is a kind of chemical sensors, was employed to check olive oil quality parameters. Fifty samples of olive oil, covering the four quality categories extra virgin, virgin, ordinary virgin and lampante, were gathered from different Palestinian cities. The samples were analysed chemically using routine tests and signals for each chemical were obtained using EN. Each signal acquisition represents the concentration of certain chemical constituents. Partial least squares (PLS) models were used to analyse both chemical and EN data. The results demonstrate that the EN was capable of modelling the acidity parameter with a good performance. The correlation coefficients of the PLS-1 model for acidity were 0.87 and 0.88 for calibration and validation sets, respectively. Furthermore, the values of the standard error of performance to standard deviation (RPD) for acidity were 2.61 and 2.68 for the calibration and the validation sets, respectively. It was found that two principal components (PCs) in the PLS-1 scores plot model explained 86% and 5% of EN and acidity variance, respectively. PLS-1 scores plot showed a high performance in classifying olive oil samples according to quality categories. The results demonstrated that EN can predict/model acidity with good precision. Additionally, EN was able to discriminate between diverse olive oil quality categories.

Graphical Abstract

1. Introduction

During the 2019/2020 agricultural season, the worldwide production of olive oil increased by about 15%. This increase represents about 3.67 million tons compared to 3.13 million tons in the previous year. The 10 top olive oil-producing countries are Spain, Greece, Italy, Tunisia, Portugal, The United States of America, Morocco, France, Turkey, and Australia. During the last 25 years, the consumption of olive oil has not been confined to countries in the Mediterranean area but has increased globally [1].
In Palestine, there are about 10 million olive trees, corresponding to approximately 67.3% of the total horticultural trees grown. Moreover, olive trees occupy more than 50% of the agricultural area, and the production of olive oil in Palestine has reached 19.5 thousand tons [2].
In recent years, quality assurance and food safety measures have been the major concern of the governmental bodies in Palestine. The olive oil producers’ sector has therefore had to validate the quality of their products to ensure high quality for consumers and to prevent fraud. The customer usually purchases a product based on subjective criteria such as colour and appearance. As the physical properties of olive oil resemble those of other oils that might be blended with it, the detection of potential consumer fraud is often very difficult [3,4].
The International Olive Council (IOC) classifies olive oil into four categories according to quality parameters, namely extra virgin olive oil, virgin olive oil, ordinary virgin, and lampante. Extra virgin olive oil is considered to have the highest quality, followed by virgin olive oil which is of good quality [5,6].
The quality of olive oil is usually examined by conventional chemical analyses, which are both costly and time-consuming. However, optical sensors have been used successfully in testing some quality parameters of olive oil [6,7,8].
One alternative for the evaluation of olive oil quality is the use of chemical sensors, such as an electronic nose (EN) system. An EN is a device that can distinguish between different gases/odours, where it synthesizes simulating the human nose. To mimic a biological olfactory system, the odour receptor cells are replaced by gas sensors and sensing materials. An artificial neural network, computing algorithm, and data analysis applications take the place of the neural network and brain [9]. Each sensor responds in a different way to an extensive range of volatile organic compounds (VOCs) [10,11,12]. The EN sensing system is thus an array of different sensing elements. It may contain numerous types of cross-sensitivity and low-selectivity sensors that relate to odour molecules to produce electronic signals. These signals are sent to a computer system, which employs multivariate data analysis (MVDA) methods (i.e., chemometrics) to reveal the signals and differentiate measured samples’ fingerprinting [9].
An EN has several advantages including low cost, no requirement for specialised expertise, high throughput sample detection, low detection time, and small size. The most common types of EN available on the market are metal-oxide semiconductors (MOS), which have several advantages such as sensitivity to a wide range of different chemicals, fast response, and long sensor life. They are inexpensive, robust, and semi-selective. However, they also have some limitations, notably susceptibility to poisoning and humidity, high sensor drift, limited range of coatings, and high-power consumption [9,13].
EN signals need analysis to ensure that it reveals the acquired signal. Therefore, MVDA represents an important part of EN signal interpretation to reach valuable and meaningful results. The information concealed in the signals can be revealed using MVDA. The latter includes a wide pattern of recognition and regression techniques [14,15,16,17].
EN with MOS has been used for testing olive oil quality parameters such as peroxide value, UV absorbance at 232 and 270 nm, and ΔK [18]. MOS sensors have also been able to detect adulteration in olive oil [19]. Bhandari et al. [20] used a gas sensor device, composed of an array of eight MOS sensors, to discriminate the geographical origins and quality of extra virgin olive oil. The results showed that the MOS sensors represent a fast and very useful handheld and non-destructive instrument for the online monitoring and evaluation of extra virgin olive oil quality and geographical origin. Haddi et al. [21] could discriminate between olive oil based on geographic origin through EN analysis using MOS sensors. Oates et al. [10] have also been able to distinguish between olive oil and pomace oil using an EN device based on a MOS sensor array.
The use of principal component analysis (PCA) has shown that the EN has been able to distinguish between the different quality of olive oils (lampante, ordinary, virgin, and extra virgin) [22]. Furthermore, Ordukaya and Karlik [23] built a PCA model to classify olive oil samples using EN with 32 sensors. Ghasemi-Varnamkhasti et al. [24] used an eight MOS sensor-based EN in an agricultural application to illustrate the freshness of strawberry.
To the best of the authors’ knowledge, no study has been conducted on a combination of identification and quantification of olive oil quality parameters with EN.
This study set out to assess the potential use of EN for identifying different olive oil quality groups and to quantify the quality parameters of olive oil. Eventually, this will help in introducing EN as a low cost, rapid, and robust measuring technique in the food sector.

2. Materials and Methods

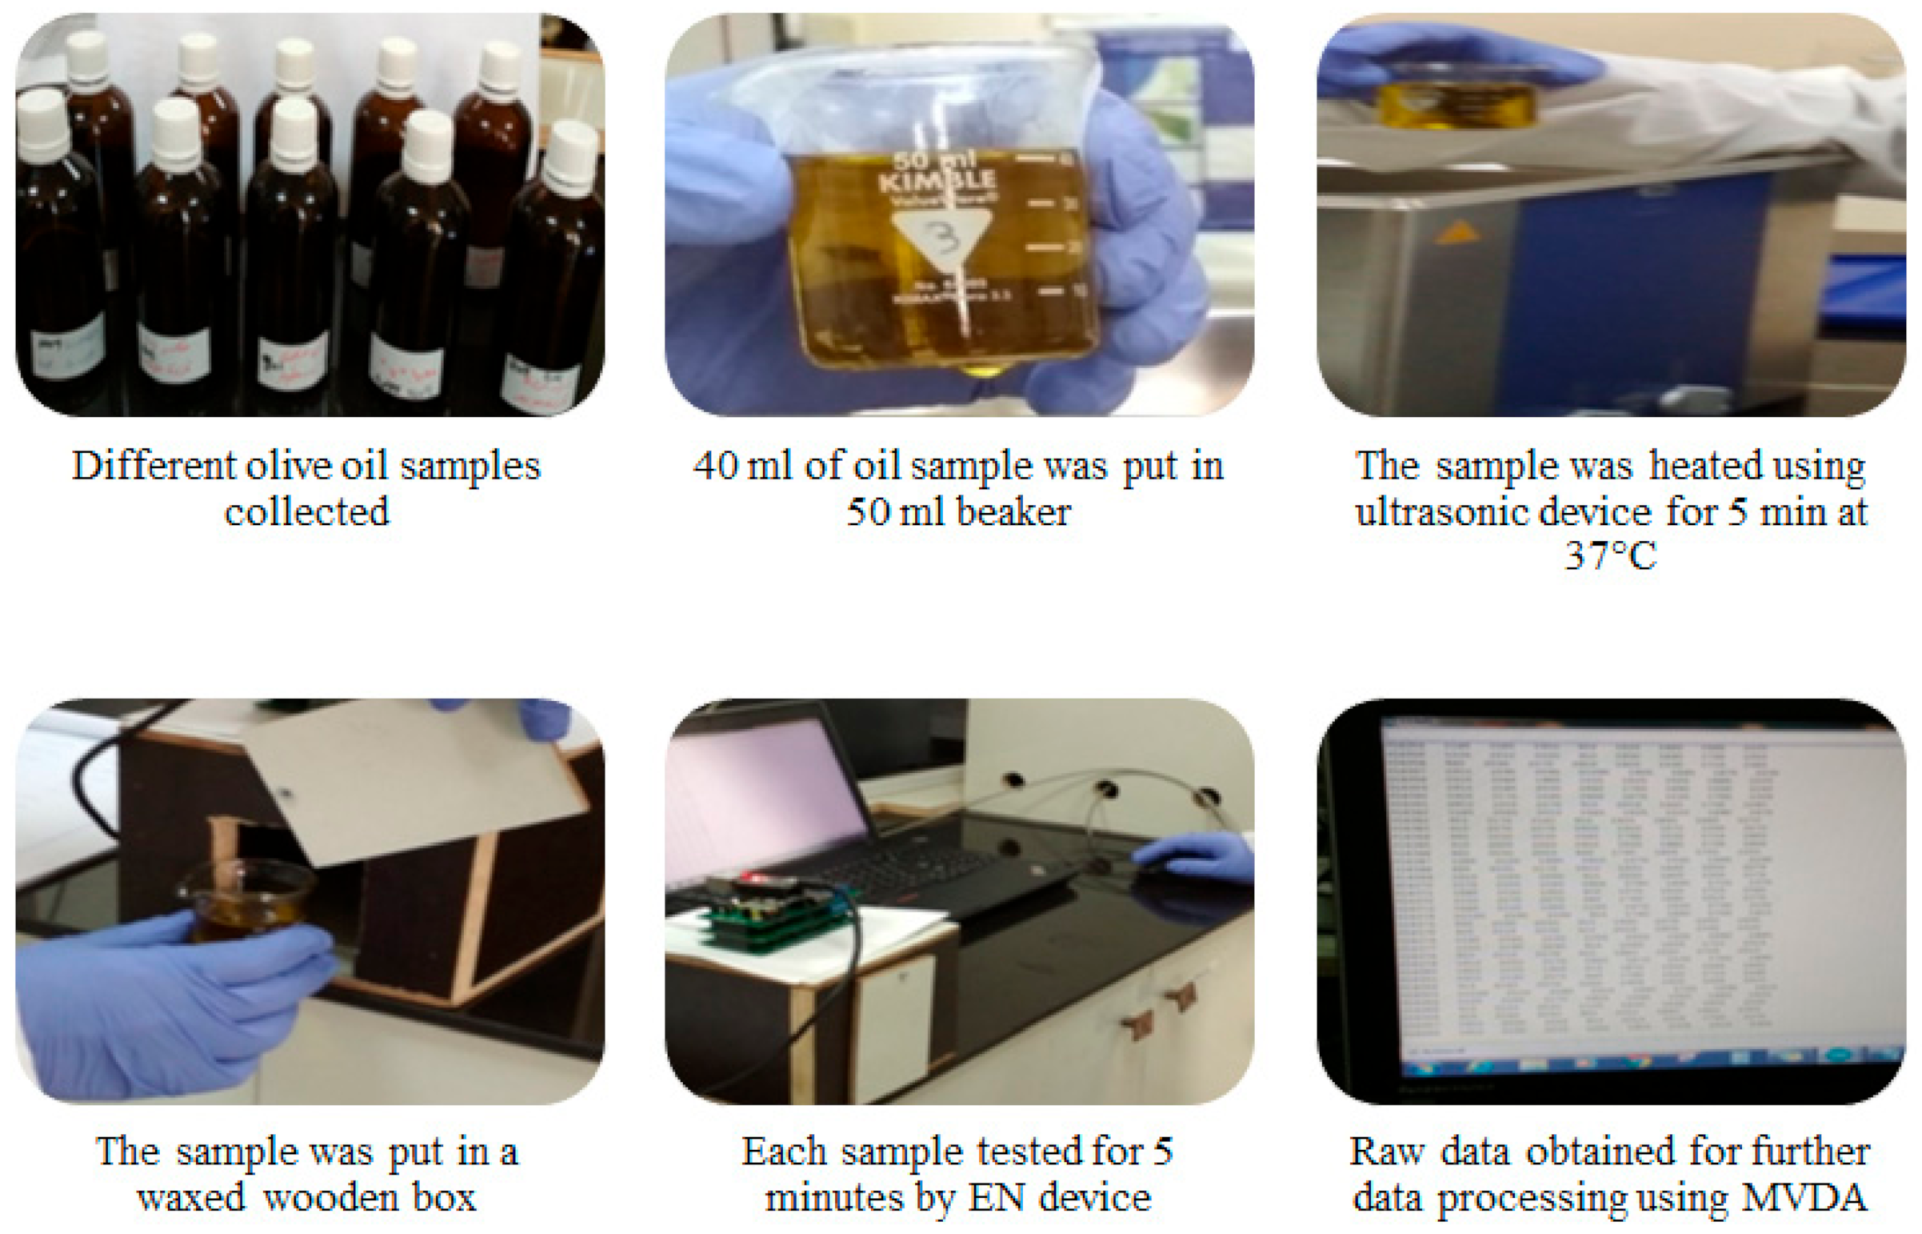
2.1. Collected Samples

Fifty samples were purchased from producers in various Palestinian governorates in October 2018 at the beginning of the olive season harvesting and production period in Palestine.
The samples were sealed in dark tubes in order to prevent oxidation. To prevent the deterioration of the olive oil, samples were stored at a temperature between 12–17 °C, as exposure to temperatures lower than 12 °C contributes to solidification and exposure to temperature greater than 17 °C leads to a rapid degradation in oil quality [25].

2.2. Chemical Analysis

Seven parameters were tested according to the international protocol. The chemical parameters measured were: acidity (i.e., 0.4–3.94%), peroxide (i.e., 8.0–25.3 mEq O2/kg), and K-values (including K232, K274, K266, K270 and ΔK) (i.e., 0–2.54 UV) [26,27,28]. Further details of chemical analysis methods are given by Abu-Khalaf and Hmidat [6].
According to the IOC classification, the 50 samples measured contained 11 extra virgin olive oil (EVOO), 12 virgin olive oil (VOO), 17 ordinary virgin olive oil (OVOO), and 10 lampante olive oil (LOO).

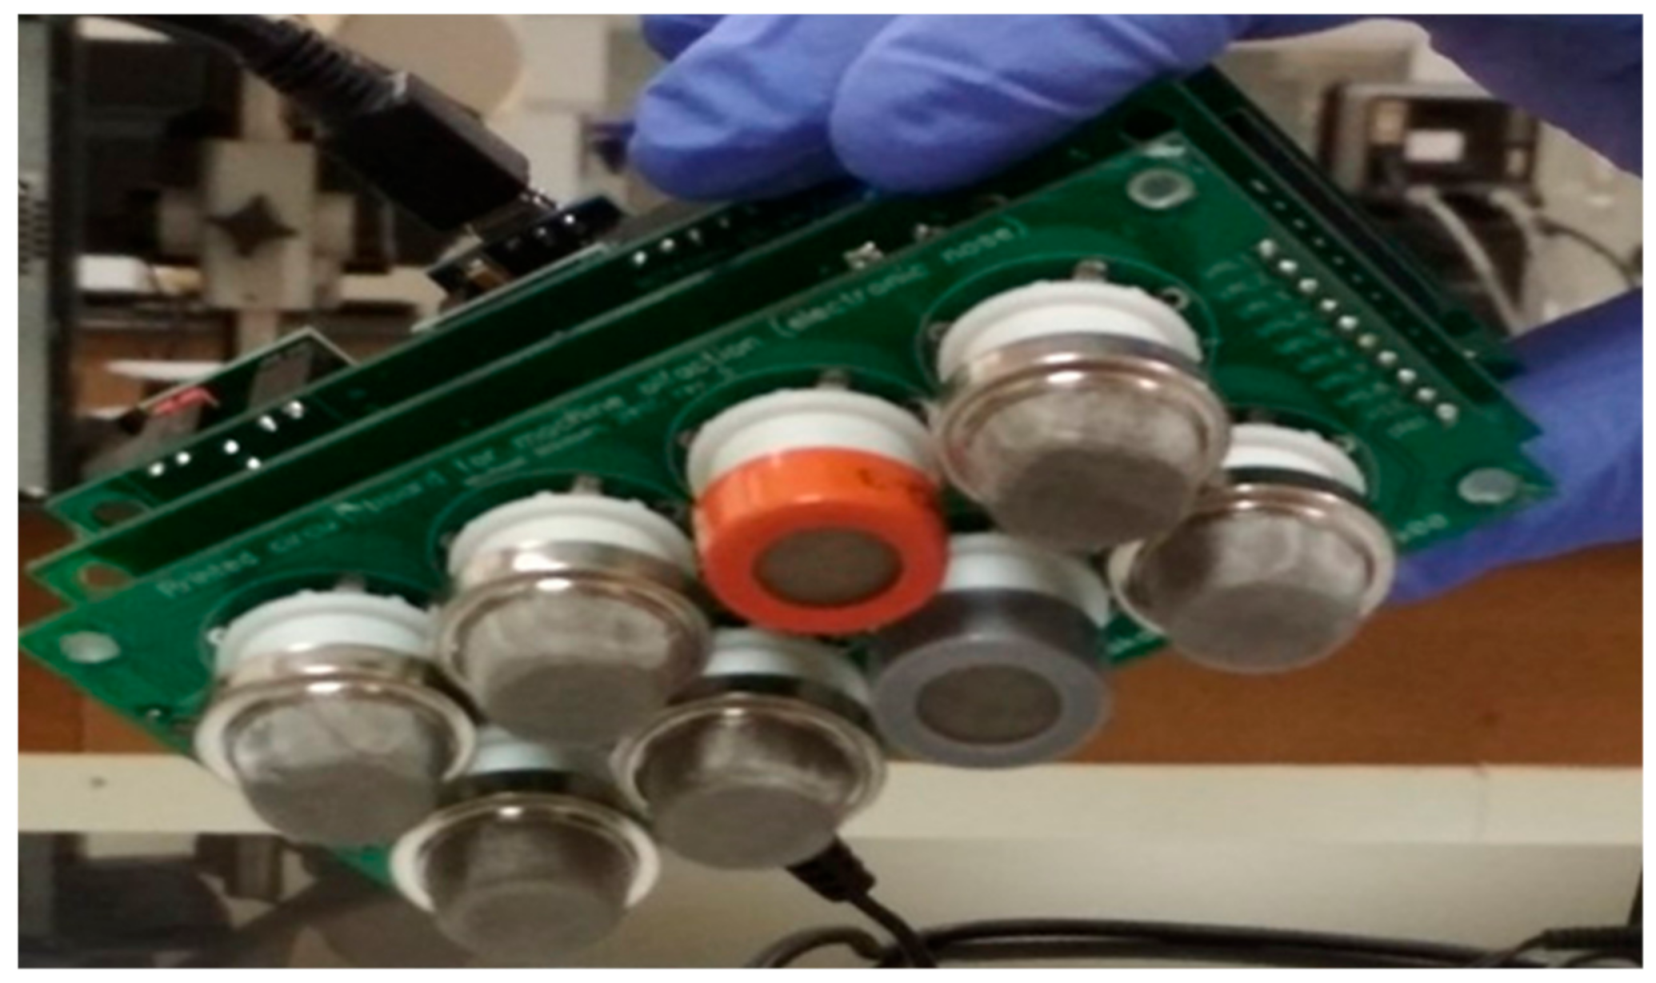
2.3. Electronic Nose (EN)

After completing the chemical tests of the samples, the quality parameters of the olive oils were tested using an EN device. The bottles were kept tightly closed during the chemical measurements to ensure that there was no external interference from the outside atmosphere that could directly affect the sensitivity of EN measurements. A prototype EN (Figure 1) with eight MOS (i.e., MQ-2, MQ-3, MQ-4, MQ-5, MQ-6, MQ-8, MQ-135, and MQ-138) (Hanwei Electronics Co., Ltd., Zhengzhou, China) was used for the measurement of olive oil quality parameters. The specifications of the MOS sensors are shown in Table 1. The prototype used in this research was mostly used in several applications related to olive oil applications [10,11].
In order to measure the samples using EN, a 40 mL oil sample was put in a 50 mL beaker. The samples were heated in an ultrasonic device for 5.0 min at 37 °C and each sample was then tested in triplicate for 5.0 min by EN device. A data processing unit (Arduino Nano ® microcontroller with USB serial connection version 1.8.5) was used to collect the signals. Figure 2 shows the steps for measuring samples using EN.

2.4. Multivariate Data

Raw data were collected and the signal values were exported from the Microsoft Excel program (Microsoft Office 2010). The scaled and normalized average values of each sample (with maximum coefficients of variation values of less than 1%) were then numerically processed with The Unscrambler X (version 10.3, Camo Software AS, Oslo, Norway).

2.5. Data Analysis

PLS-1 (i.e., one reference Y) calibration models were developed to investigate the feasibility of using EN signals through which the chemical parameters can be predicted. The X-matrix was set as EN signals and the Y-matrix was set as the chemical parameter.
The PLS-1 scores plot was used to investigate the potential grouping of the different samples’ grades (i.e., extra virgin, virgin, ordinary virgin, and lampante).
A test set validation was used in the PLS-1 model. Approximately 67% and 33% of the samples (i.e., 35 and 15 representing different grades) were used for calibration and validation sets, respectively. Further description of PLS model principles is given in Mudalal et al. [15].

2.6. Model Performance

In order to evaluate the PLS-1 model accuracy, the following parameters were used: the coefficient of correlation in calibration set (R2cal), the coefficient of correlation in the validation set (R2val), root mean square error of calibration set (RMSEcal), and root mean square error of validation set (RMSEval). The ratio performance deviation (RPD) and relative error (RE) values were calculated to indicate whether the PLS-1 model was accepted or rejected. RPD is defined as the ratio between the standard deviation of the response variable and RMSE.
In general, an RPD value less than 2.0 would not be an adequate prediction model, whereas a value between 2.0 and 3.0 is considered an acceptable model. A RPD value greater than 3 demonstrates an excellent prediction capability [29,30,31].
The following equation can be used to evaluate RE [15]:
RE (%) = RMSE/((Maximum + Minimum)/2)
The PLS model can be regarded as an acceptable model if it has a low number of PCs, low values of RME and RE, high R2, a RPD value greater than 2.0 and a low gap between the two sets (i.e., calibration and validation) [6].

3. Results and Discussion

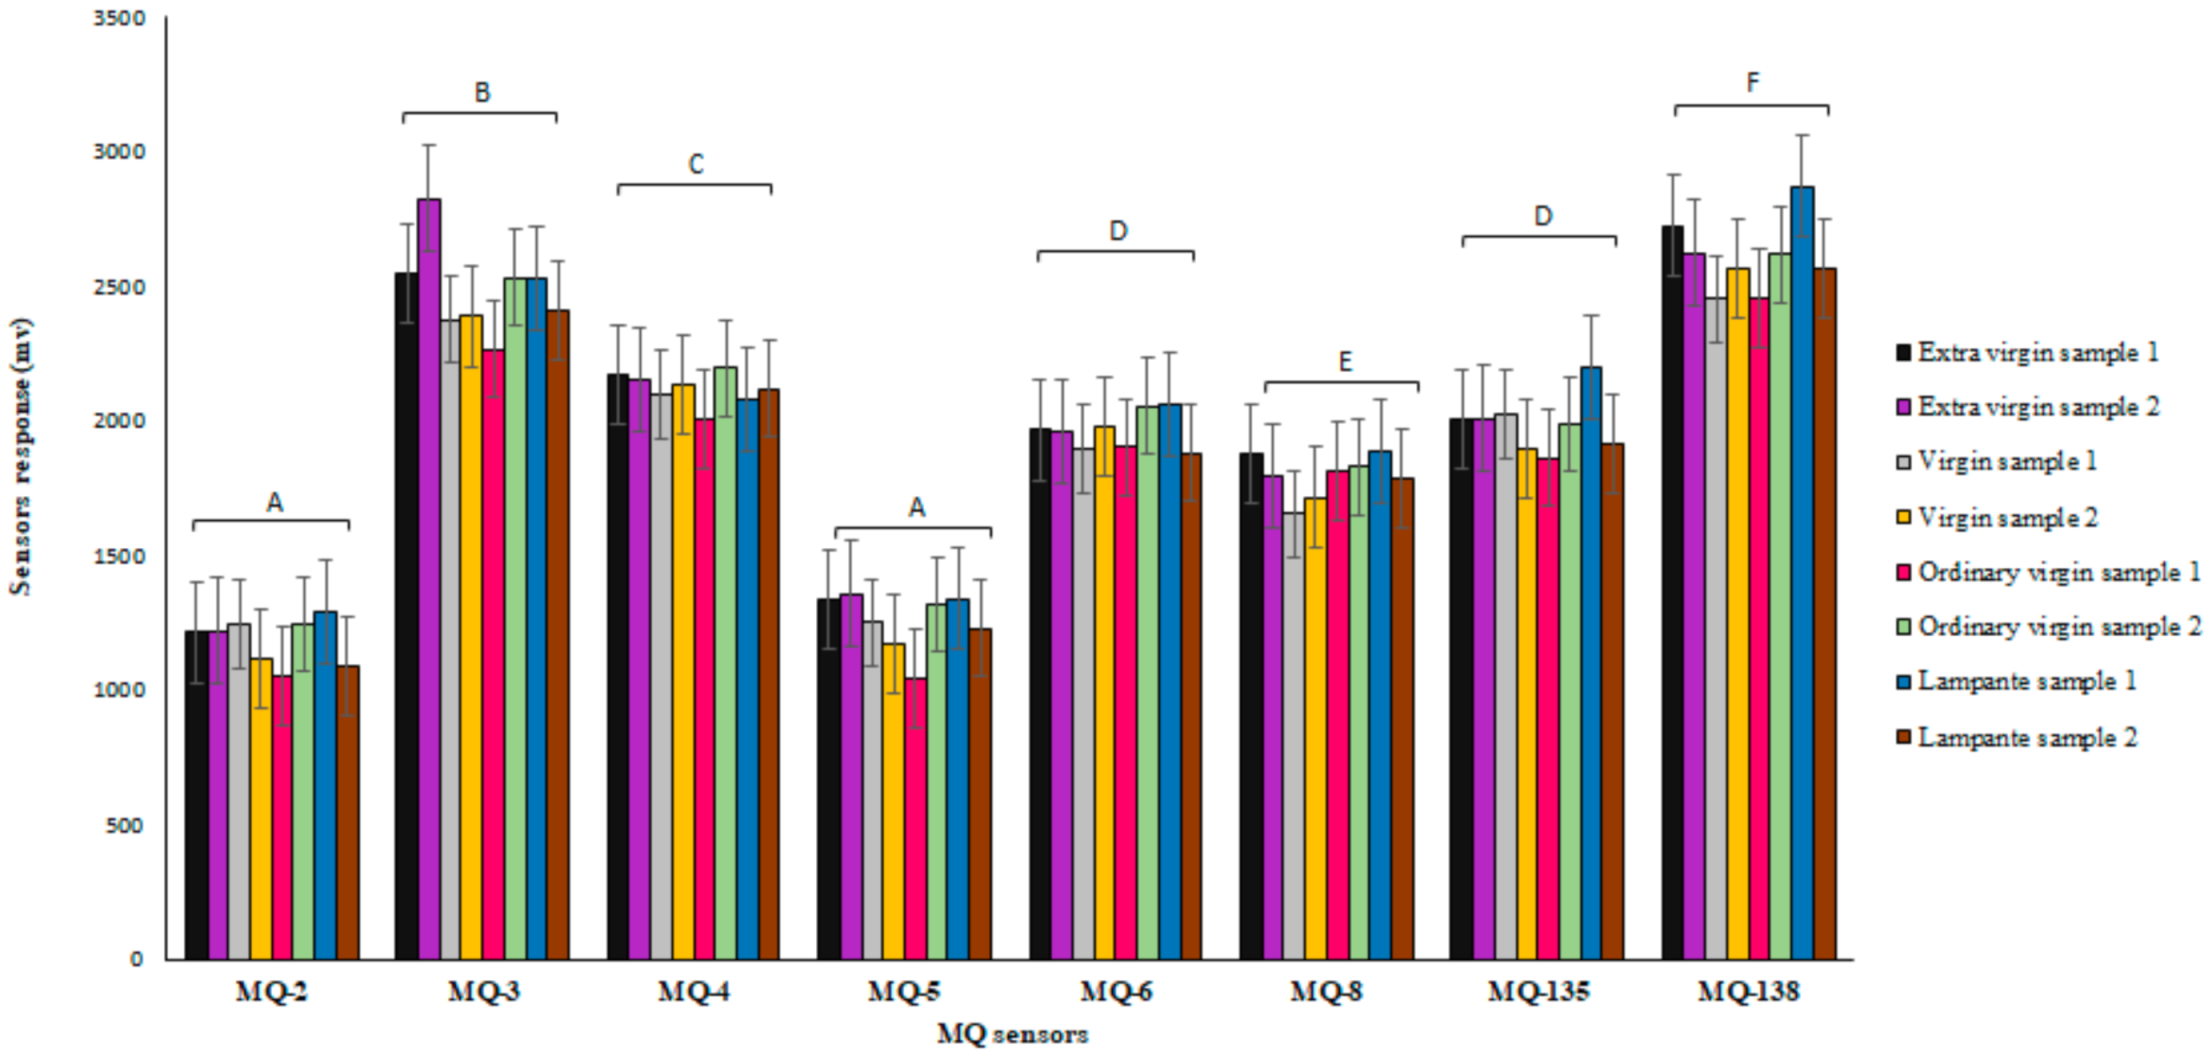
3.1. Sensors Response

The responses of eight sensors for four olive oil groups with two samples of each group are shown in Figure 3. Sensors show different signal responses for each group. To determine the significance of sensors’ signals, the sensors were separated using least significant differences (LSD; p < 0.05) found with the analysis of variance (ANOVA) procedure of the XLSTAT software package (Addinsoft, version 2020.1.3, Boston, MA, USA). There were five groups of sensors; A: MQ-2 and MQ-5, B: MQ-3, C: MQ-4, D: MQ-6 and MQ-135, E: MQ-8 and F: MQ-138.
Figure 3 may indicate that the sensors have low selectivity (i.e., low specificity) and high cross-sensitivity (i.e., sensitivity to any non-target gas) for the measured samples, which supports the idea of using EN for this application.

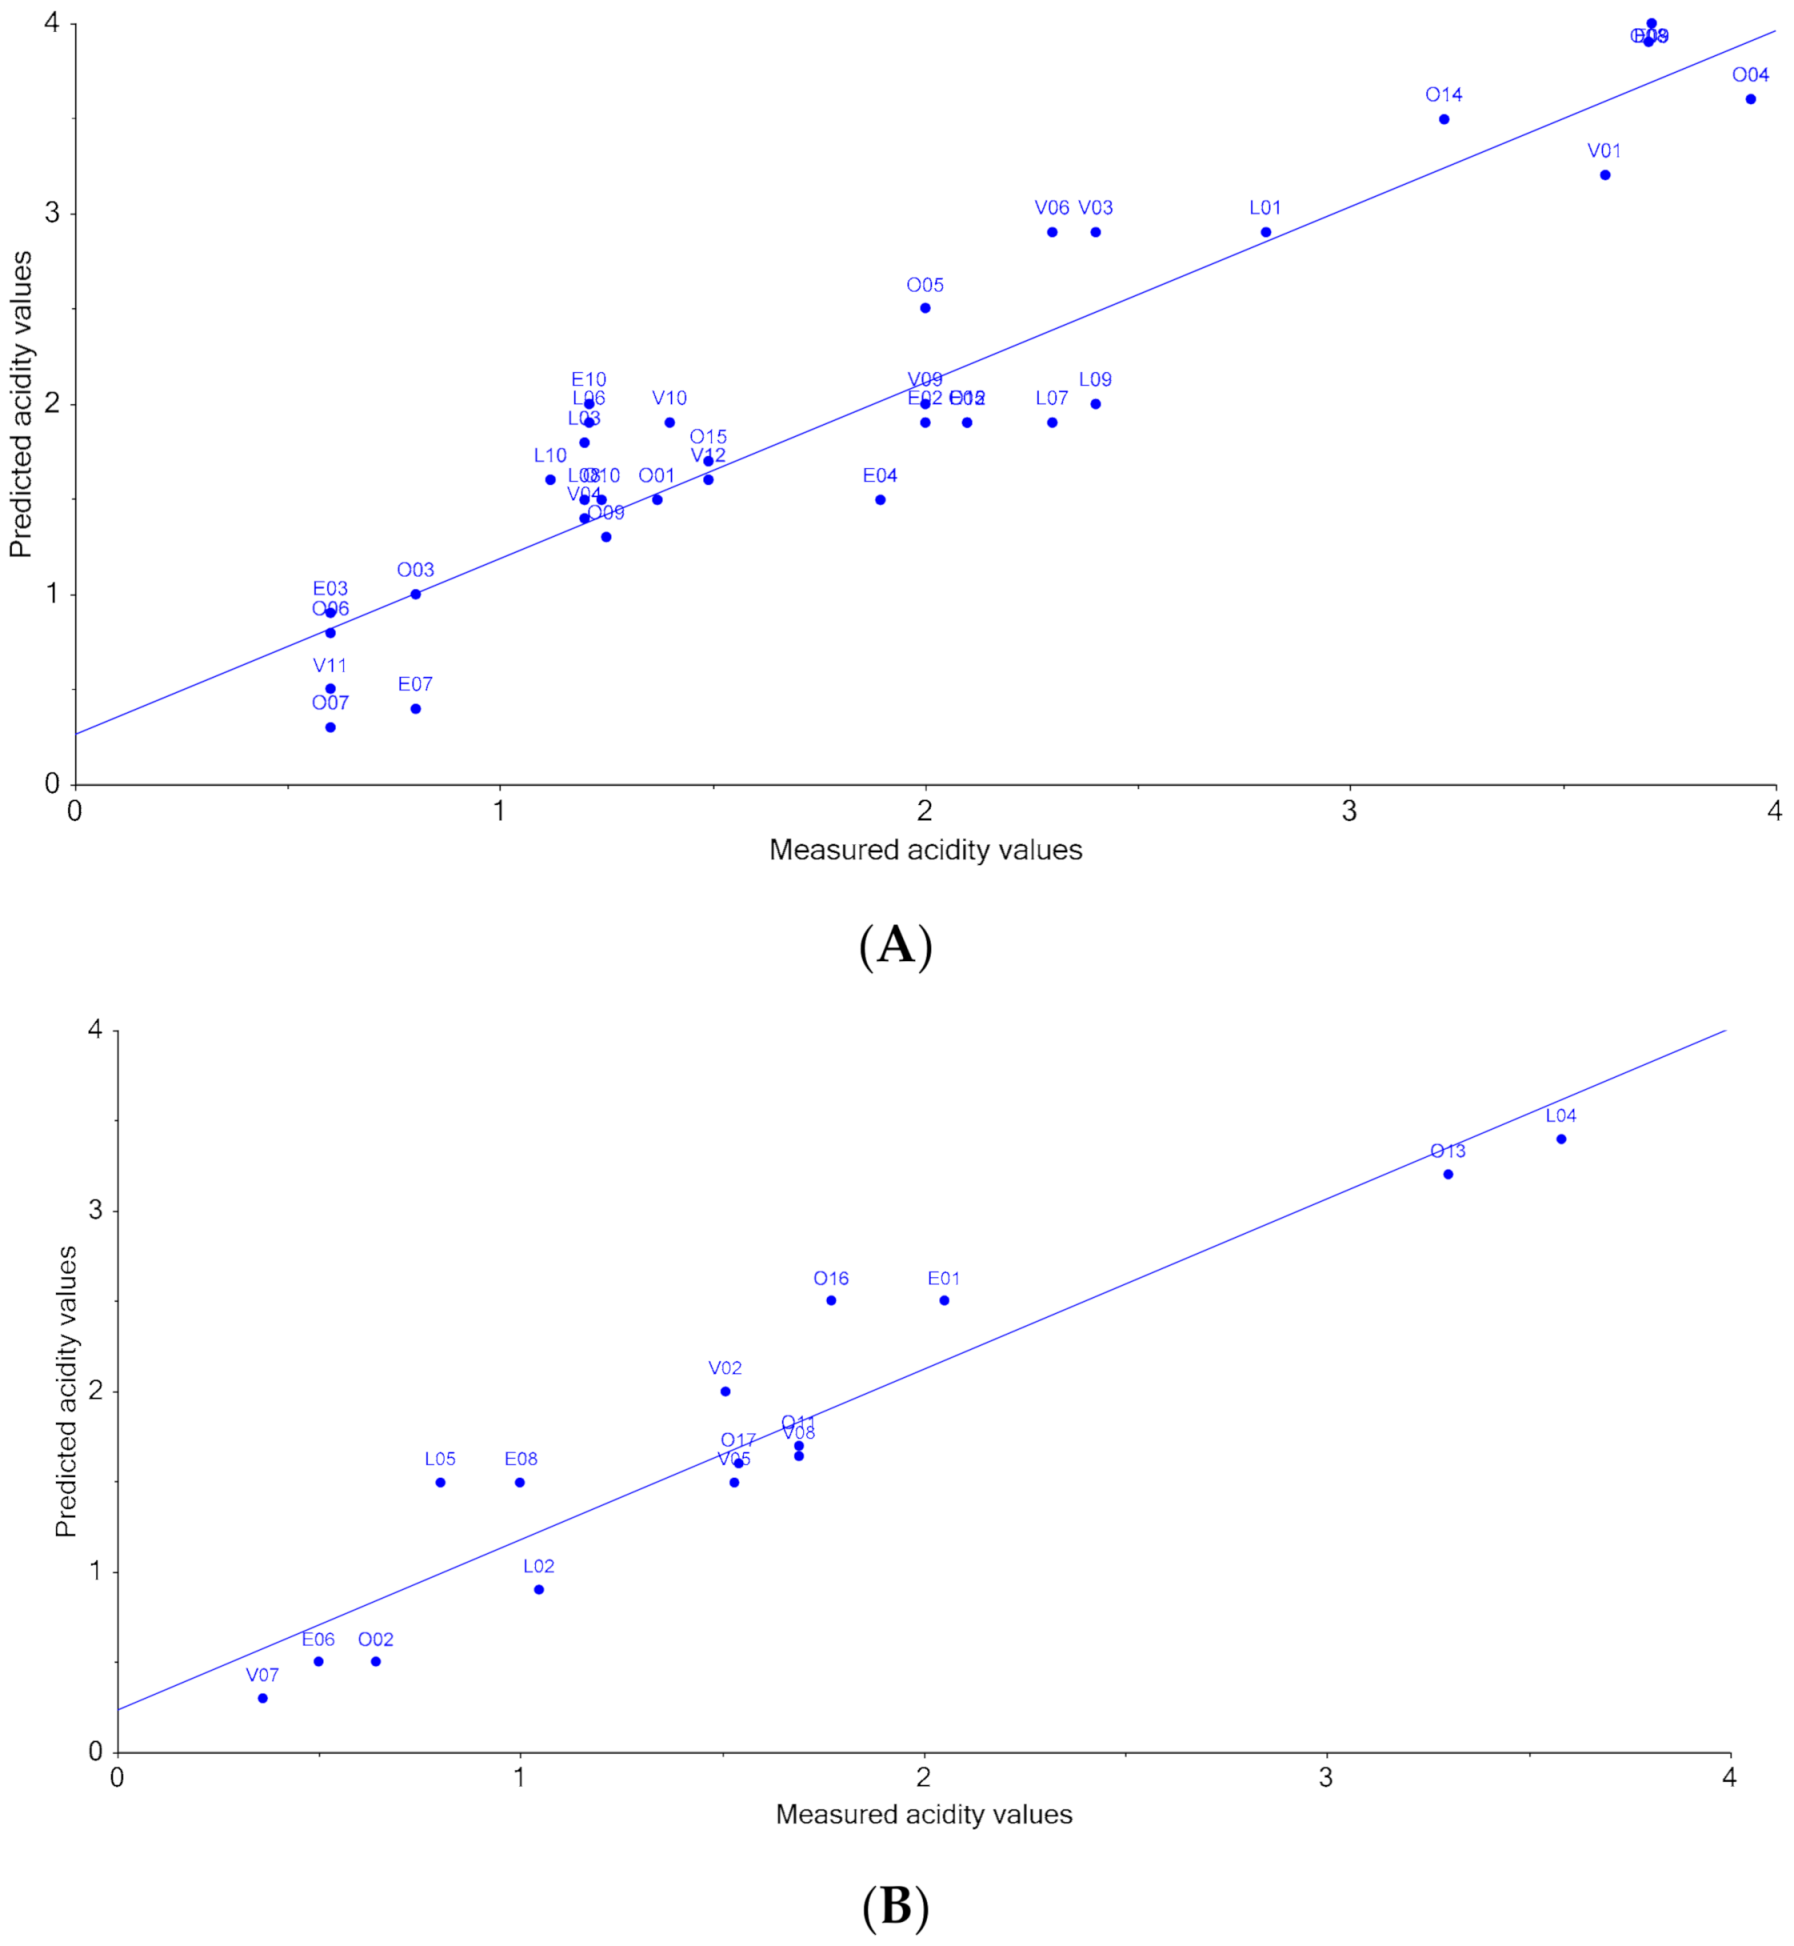
3.2. PLS Prediction Models

A PLS-1 model was created for each of the seven quality parameters. However, only the PLS-1 model for the acidity was acceptable according to the model efficiency criteria previously mentioned. The PLS-1 models for the remaining parameters were poor (i.e., low R2, high RME, high RE, low RPD, and large results divergences between sets). Table 2 shows the acidity PLS-1 model performance.
The correlation coefficients for the acidity PLS-1 model were correspondingly 0.87 and 0.88 for the calibration and validation sets. RPDs were about 2.61 and 2.68 for calibration and validation, respectively. For both sets, the RMSE was around 0.35, RE was less than 20% and the slope was greater than 0.92.
As the PLS-1 acidity model has good performance criteria, it may be considered as an acceptable and reliable model that can be used for prediction. Figure 4 shows the PLS-1 acidity models for both calibration and validation sets.

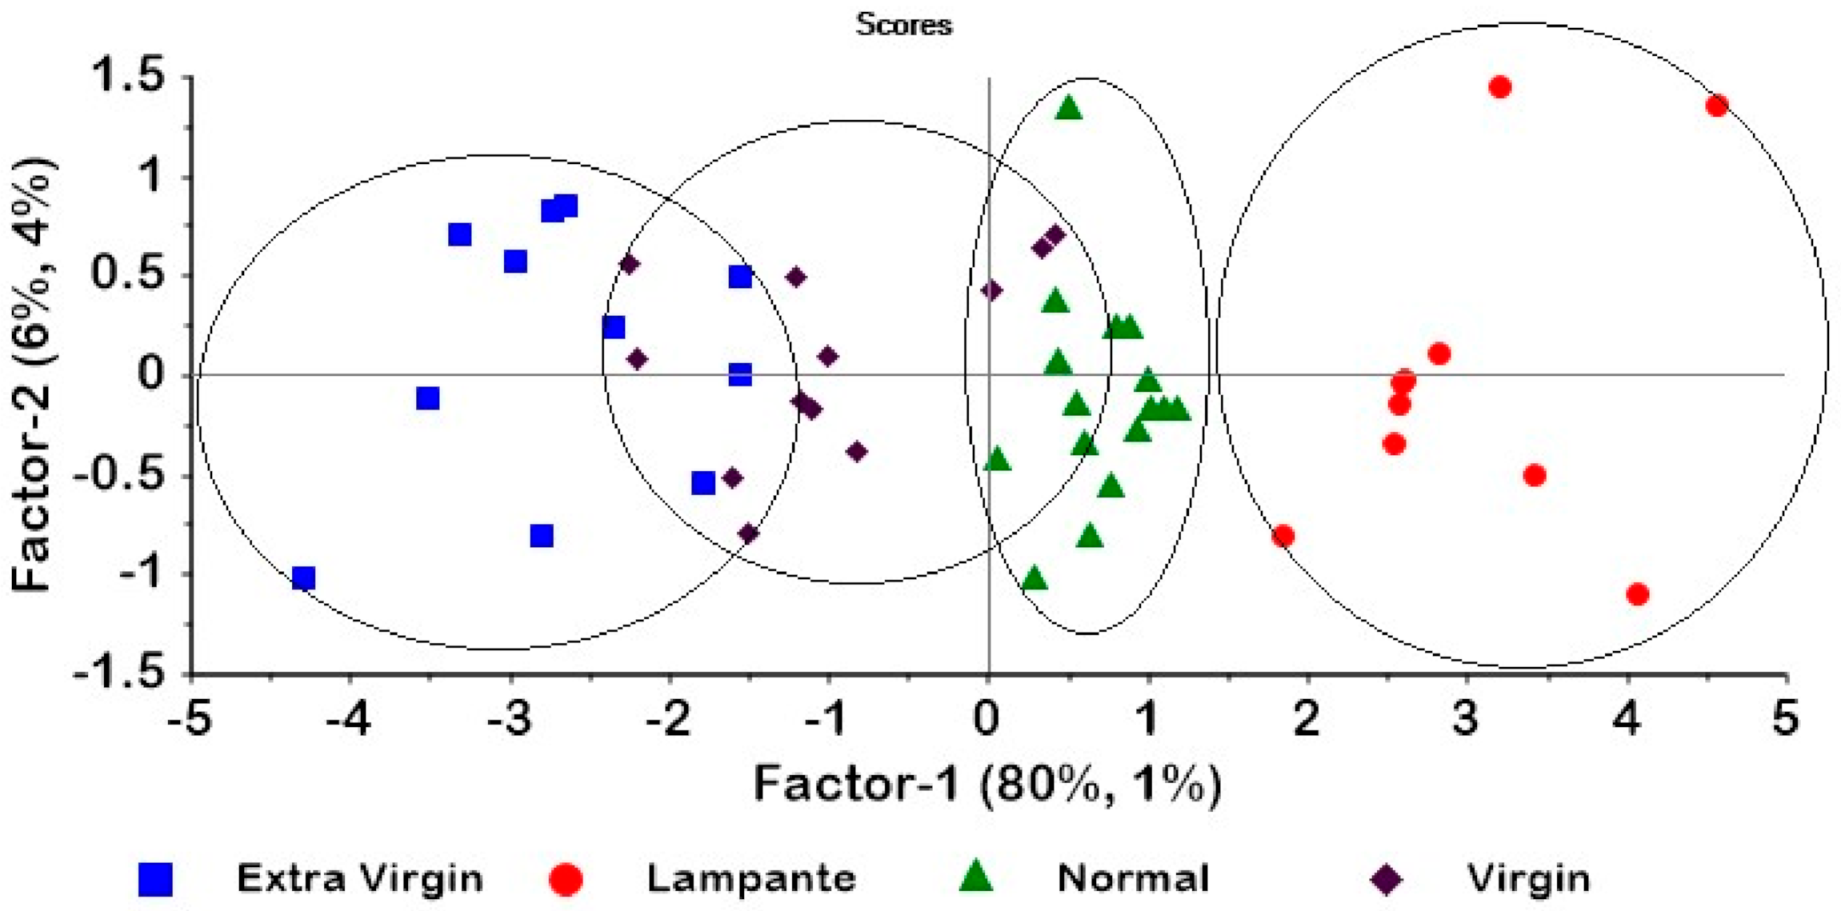
3.3. PLS-1 Scores Plot

PLS-1 scores plot for the acidity model (using full cross-validation) has shown the ability of EN to differentiate between the four groups (Figure 5). In this analysis, two PCs explained 86% and 5% of ET signals and acidity values variance, respectively. Our finding showed that the scores plot in PLS-1 had a high performance in separating between different groups. Thus, lampante is significantly classified from other groups, while the latter show a slight overlap between them. However, the classification result is promising for a more detailed identification of different olive oil groups.

4. Conclusions

The results of this research demonstrated that the EN was an appropriate tool to predict olive oil acidity. The acidity PLS-1 model showed a high prediction performance and had the characteristics of a good model. Likewise, the EN managed to classify different olive oil quality groups. Additionally, the study has gone some way towards enhancing our understanding of the use of EN in the food sector (e.g., olive oil production plants). Further study for the quantification of other quality parameters with other sensor arrays is needed.

Funding

This research received no external funding.

Institutional Review Board Statement

Not applicable.

Informed Consent Statement

Not applicable.

Data Availability Statement

Data available on request.

Acknowledgments

The author thanks Palestine Technical University—Kadoorie (PTUK) for its facilities and support.

Conflicts of Interest

The author declares that there are no conflict of interest regarding the publication of this paper.

References

  1. Passenger Port of Saint-Petersburg, Marine Façade. Available online: https://www.portspb.ru/ (accessed on 11 February 2021).
  2. Palestinian Central Bureau of Statistics. 2019; Agricultural Survey. Available online: Http://www.pcbs.gov.ps (accessed on 20 April 2021).
  3. Mailer, R.; Beckingham, C. Testing olive oil quality: Chemical and sensory methods. Profitable & Sustainable Primary Indus-tries. Primefact 2006, 231, 1–5. [Google Scholar]
  4. Casale, M.; Simonetti, R. Review: Near Infrared Spectroscopy for Analysing Olive Oils. J. Near Infrared Spectrosc. 2014, 22, 59–80. [Google Scholar] [CrossRef]
  5. Valli, E.; Bendini, A.; Berardinelli, A.; Ragni, L.; Riccò, B.; Grossi, M.; Toschi, T.G. Rapid and innovative instrumental approaches for quality and authenticity of olive oils. Eur. J. Lipid Sci. Technol. 2016, 118, 1601–1619. [Google Scholar] [CrossRef] [Green Version]
  6. Abu-Khalaf, N.; Hmidat, M. Visible/Near Infrared (VIS/NIR) spectroscopy as an optical sensor for evaluating olive oil quality. Comput. Electron. Agric. 2020, 173, 105445. [Google Scholar] [CrossRef]
  7. Casson, A.; Beghi, R.; Giovenzana, V.; Fiorindo, I.; Tugnolo, A.; Guidetti, R. Environmental advantages of visible and near infrared spectroscopy for the prediction of intact olive ripeness. Biosyst. Eng. 2020, 189, 1–10. [Google Scholar] [CrossRef]
  8. Kadiroglu, P.; Korel, F.; Pardo, M. Chemometric analysis of chemo-optical data for the assessment of olive oil blended with hazelnut oil. Riv. Ital. Sostanze Grasse 2019, 96, 123–130. [Google Scholar]
  9. Hsieh, Y.-C.; Yao, D.-J. Intelligent gas-sensing systems and their applications. J. Micromech. Microeng. 2018, 28, 093001. [Google Scholar] [CrossRef]
  10. Oates, M.; Madsen, M.; Cuenca Roca, O.; Ruiz-Canales, A. Preliminary results from olive oil classification system using a low cost electronic nose. In III National Symposium of Horticultural Engineering, Dedicated in This Edition to the “Use of Drones and Satellites in Agriculture”; Escola Politecnica Superio: Lugo, Spain, 2018. [Google Scholar]
  11. Oates, M.J.; Fox, P.; Sanchez-Rodriguez, L.; Carbonell-Barrachina, Á.A.; Ruiz-Canales, A. DFT based classification of olive oil type using a sinusoidally heated, low cost electronic nose. Comput. Electron. Agric. 2018, 155, 348–358. [Google Scholar] [CrossRef]
  12. Oates, M.; Abu-Khalaf, N.; Molina-Cabrera, C.; Ruiz-Canales, A.; Ramos, J.; Bahder, B. Detection of Lethal Bronzing Disease in Cabbage Palms (Sabal palmetto) Using a Low-Cost Electronic Nose. Biosensors 2020, 10, 188. [Google Scholar] [CrossRef]
  13. Sanaeifar, A.; ZakiDizaji, H.; Jafari, A.; de la Guardia, M. Early detection of contamination and defect in foodstuffs by electronic nose: A review. TrAC Trends Anal. Chem. 2017, 97, 257–271. [Google Scholar] [CrossRef]
  14. Abu-Khalaf, N.; Abu Rumaila, B. Electronic tongue and Box-PCR for categorization of different Fusarium strains. Plant Cell Biotechnol. Mol. Biol. 2020, 21, 121–128. [Google Scholar]
  15. Mudalal, S.; Zaid, A.; Abu-Khalaf, N.; Petracci, M. Predicting the quality traits of white striped turkey breast by visible/near infra-red spectroscopy and multivariate data analysis. Ital. J. Anim. Sci. 2020, 19, 676–686. [Google Scholar] [CrossRef]
  16. Sayara, T.; Khayat, S.; Saleh, J.; Abu-Khalaf, N.; van der Steen, P. Algal–bacterial symbiosis for nutrients removal from wastewater: The application of multivariate data analysis for process monitoring and control. Environ. Technol. Innov. 2021, 23, 101548. [Google Scholar] [CrossRef]
  17. Taha, H.; Abu-Khalaf, N. Quality control for herbal medicinal plants using a sensor array (an electronic tongue). In Proceedings of the the 7th International Conference of Biotechnology, Environment and Engineering Sciences, Stockholm, Sweden, 26 June 2020; SRO Media: Stockholm, Sweden, 2020; pp. 25–33. [Google Scholar]
  18. Cosio, M.S.; Benedetti, S.; Buratti, S.; Scampicchio, M.; Mannino, S. Application of the electronic nose in olive oil analyses. In Olives and Olive Oil in Health and Disease Prevention; Preedy, V.R., Watson, R.R., Eds.; Academic Press: Cambridge, MA, USA, 2010; pp. 553–559. [Google Scholar]
  19. Berna, A. Metal Oxide Sensors for Electronic Noses and Their Application to Food Analysis. Sensors 2010, 10, 3882–3910. [Google Scholar] [CrossRef] [PubMed] [Green Version]
  20. Bhandari, M.P.; Carmona, E.N.; Abbatangelo, M.; Sberveglieri, V.; Duina, G.; Malla, R.; Comini, E.; Sberveglieri, G. Discrimina-tion of Quality and Geographical Origin of Extra Virgin Olive Oil by S3 Device with Metal Oxides Gas Sensors. Proceedings 2018, 2, 1061. [Google Scholar] [CrossRef] [Green Version]
  21. Haddi, Z.; Amari, A.; Ali, A.O.; Bari, N.E.; Barhoumi, H.; Maaref, A.; Jaffrezic-Renault, N.; Bouchikhi, B.E.N.A. Discrimi-nation and identification of geographical origin virgin olive oil by an e-nose based on MOS sensors and pattern recognition techniques. Procedia Eng. 2011, 25, 1137–1140. [Google Scholar] [CrossRef]
  22. Gliszczyńska-Świgło, A.; Chmielewski, J. Electronic Nose as a Tool for Monitoring the Authenticity of Food. A Review. Food Anal. Methods 2016, 10, 1800–1816. [Google Scholar] [CrossRef] [Green Version]
  23. Ordukaya, E.; Karlik, B. Quality Control of Olive Oils Using Machine Learning and Electronic Nose. J. Food Qual. 2017, 2017, 9272404. [Google Scholar] [CrossRef] [Green Version]
  24. Ghasemi-Varnamkhasti, M.; Mohammad-Razdari, A.; Yoosefian, S.H.; Izadi, Z.; Rabiei, G. Selection of an optimized metal oxide semiconductor sensor (MOS) array for freshness characterization of strawberry in polymer packages using response surface method (RSM). Postharvest Biol. Technol. 2019, 151, 53–60. [Google Scholar] [CrossRef]
  25. Vanstone, N.; Moore, A.; Martos, P.; Neethirajan, S. Detection of the adulteration of extra virgin olive oil by near-infrared spectroscopy and chemometric techniques. Food Qual. Saf. 2018, 2, 189–198. [Google Scholar] [CrossRef] [Green Version]
  26. Cayuela, J.A. Rapid NIR determination of alkyl esters in virgin olive oil. Grasas y Aceites 2017, 68, 195. [Google Scholar] [CrossRef] [Green Version]
  27. Karabagias, I.K.; Badeka, A.; Casiello, G.; Longobardi, F.; Kontominas, M.G. Rapid screening of olive oil cultivar differentia-tion based on selected physicochemical parameters, pigment content and fatty acid composition using advanced chemomet-rics. Eur. Food Res. Technol. 2019, 245, 2027–2038. [Google Scholar] [CrossRef]
  28. Uncu, O.; Ozen, B. Importance of some minor compounds in olive oil authenticity and quality. Trends Food Sci. Technol. 2020, 100, 164–176. [Google Scholar] [CrossRef]
  29. Beghi, R.; Giovenzana, V.; Tugnolo, A.; Guidetti, R. Application of visible/near infrared spectroscopy to quality control of fresh fruits and vegetables in large-scale mass distribution channels: A preliminary test on carrots and tomatoes. J. Sci. Food Agric. 2018, 98, 2729–2734. [Google Scholar] [CrossRef]
  30. Escuredo, O.; Seijo-Rodríguez, A.; González-Martín, M.I.; Rodríguez-Flores, M.S.; Seijo, M.C. Potential of near infrared spectroscopy for predicting the physicochemical properties on potato flesh. Microchem. J. 2018, 141, 451–457. [Google Scholar] [CrossRef]
  31. Porep, J.U.; Kammerer, D.R.; Carle, R. On-line application of near infrared (NIR) spectroscopy in food production. Trends Food Sci. Technol. 2015, 46, 211–230. [Google Scholar] [CrossRef]
Figure 1. The prototype electronic nose (EN) used in the measurements. It is composed of eight metal-oxide semiconductors (MOS) sensors.
Agriculture 11 00674 g001
Figure 2. Steps for samples measurements by the electronic nose (EN) after chemical tests had been carried out.
Agriculture 11 00674 g002
Figure 3. Responses the sensors for two samples according to the different groups of olive oil quality. Least significant differences (LSD; p < 0.05) test showed that there were five groups of sensors according to their signal’s significance: A, MQ-2 and MQ-5; B, MQ-3; C, MQ-4; D, MQ-6 and MQ-135; E, MQ-8; and F, MQ-138.
Agriculture 11 00674 g003
Figure 4. Acidity partial least squares-1 (PLS-1) models using electronic nose (EN) signals (X-matrix) and acidity (Y-matrix) using a test set validation. (A) Calibration set (35 samples) and (B) validation set (15 samples). E, extra virgin; V, virgin; OV, ordinary virgin; and L, lampante.
Agriculture 11 00674 g004
Figure 5. Scores plot of the partial least squares-1 (PLS-1) model between electronic nose (EN) (X-matrix) and acidity (Y-matrix) for all 50 samples of olive oil using full cross-validation. Two principal components (PCs) explained 86% and 5% of the variance of EN signals and acidity values, respectively.
Agriculture 11 00674 g005
Table 1. Application of metal-oxide semiconductors (MOS) sensors, target gas sensitivity, and typical detection ranges according to the manufacturer.
Sensor NameTarget Gas SensitivityTypical Detection Ranges (ppm)
MQ-2General combustible gas200–5000 liquefied petroleum gas (LPG) and propane,
300–5000 butane,
5000–20,000 methane,
300–5000 hydrogen (H2),
100–2000 Alcohol.
MQ-3Alcohol vapour10–300.
MQ-4Natural gas and methane200–10,000 CH4, natural gas.
MQ-5LPG, natural gas and coal gas200–10,000 LPG, liquefied natural gas (LNG), natural gas, iso-butane, propane and town gas.
MQ-6LPG, propane200–10,000 LPG, iso-butane, propane, LNG.
MQ-8Hydrogen 100–10,000.
MQ-135Air quality control (NH3, benzene, alcohol, smoke)10–10,000.
MQ-138Formaldehyde, benzene, aldehyde, ketone
and ester
10–1000 benzene, 1–1000 alcohol, 10–3000 NH3.
Table 2. Acidity partial least squares-1 (PLS-1) model results for the calibration (cal) and validation (val) sets. Total sample number: 50, with 35 and 15 for calibration and validation, respectively. X-matrix, EN signals; Y-matrix, acidity; PCs, principal components; R2, correlation; RMSE, root mean square error; RPD, ratio performance deviation; RE, relative error.
PLS-1 ParametersAcidity
Number of PCs used2
X variance explained86%
Y variance explained5%
R2cal0.87
RMSEcal0.37
RPDcal2.61
REcal17%
Slopecal0.92
R2val0.88
RMSEval0.35
RPDval2.68
REval18%
Slopeval0.94
Publisher’s Note: MDPI stays neutral with regard to jurisdictional claims in published maps and institutional affiliations.

