
Effects of Nitrogen Rate and Cover Crop on Cotton (Gossypium hirsutum L.) Yield and Soil Water Content


Abstract
:1. Introduction
2. Materials and Methods
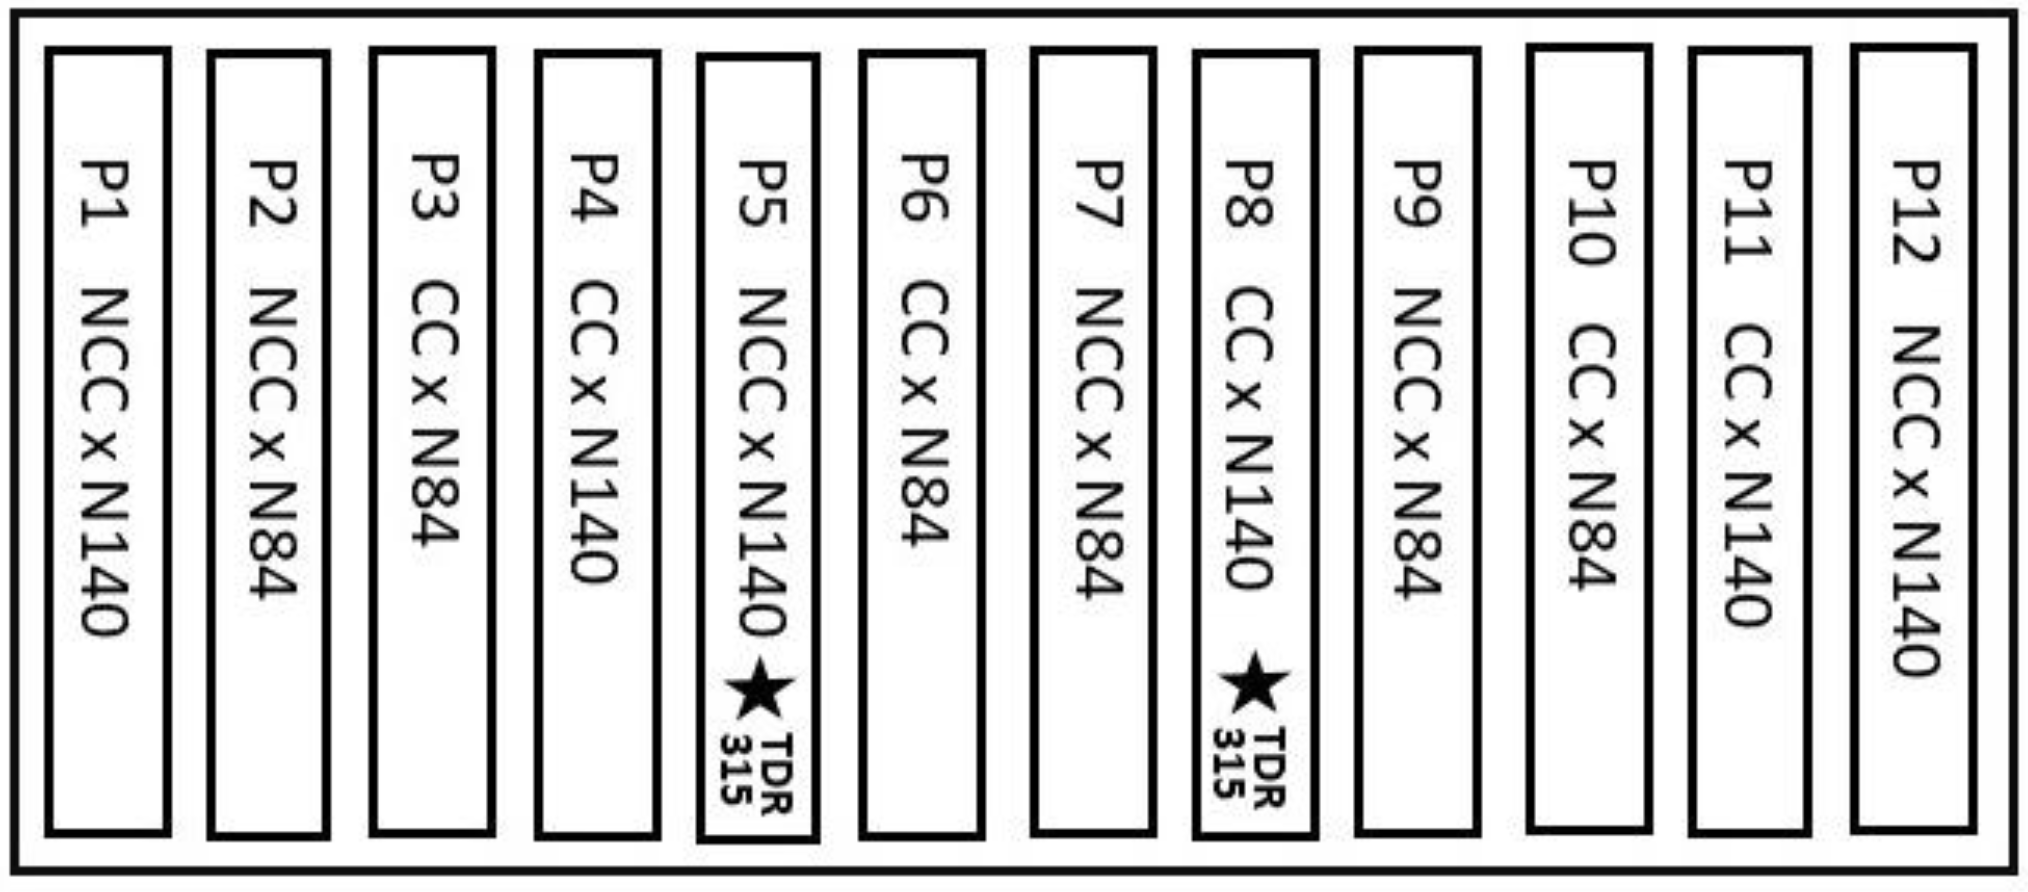
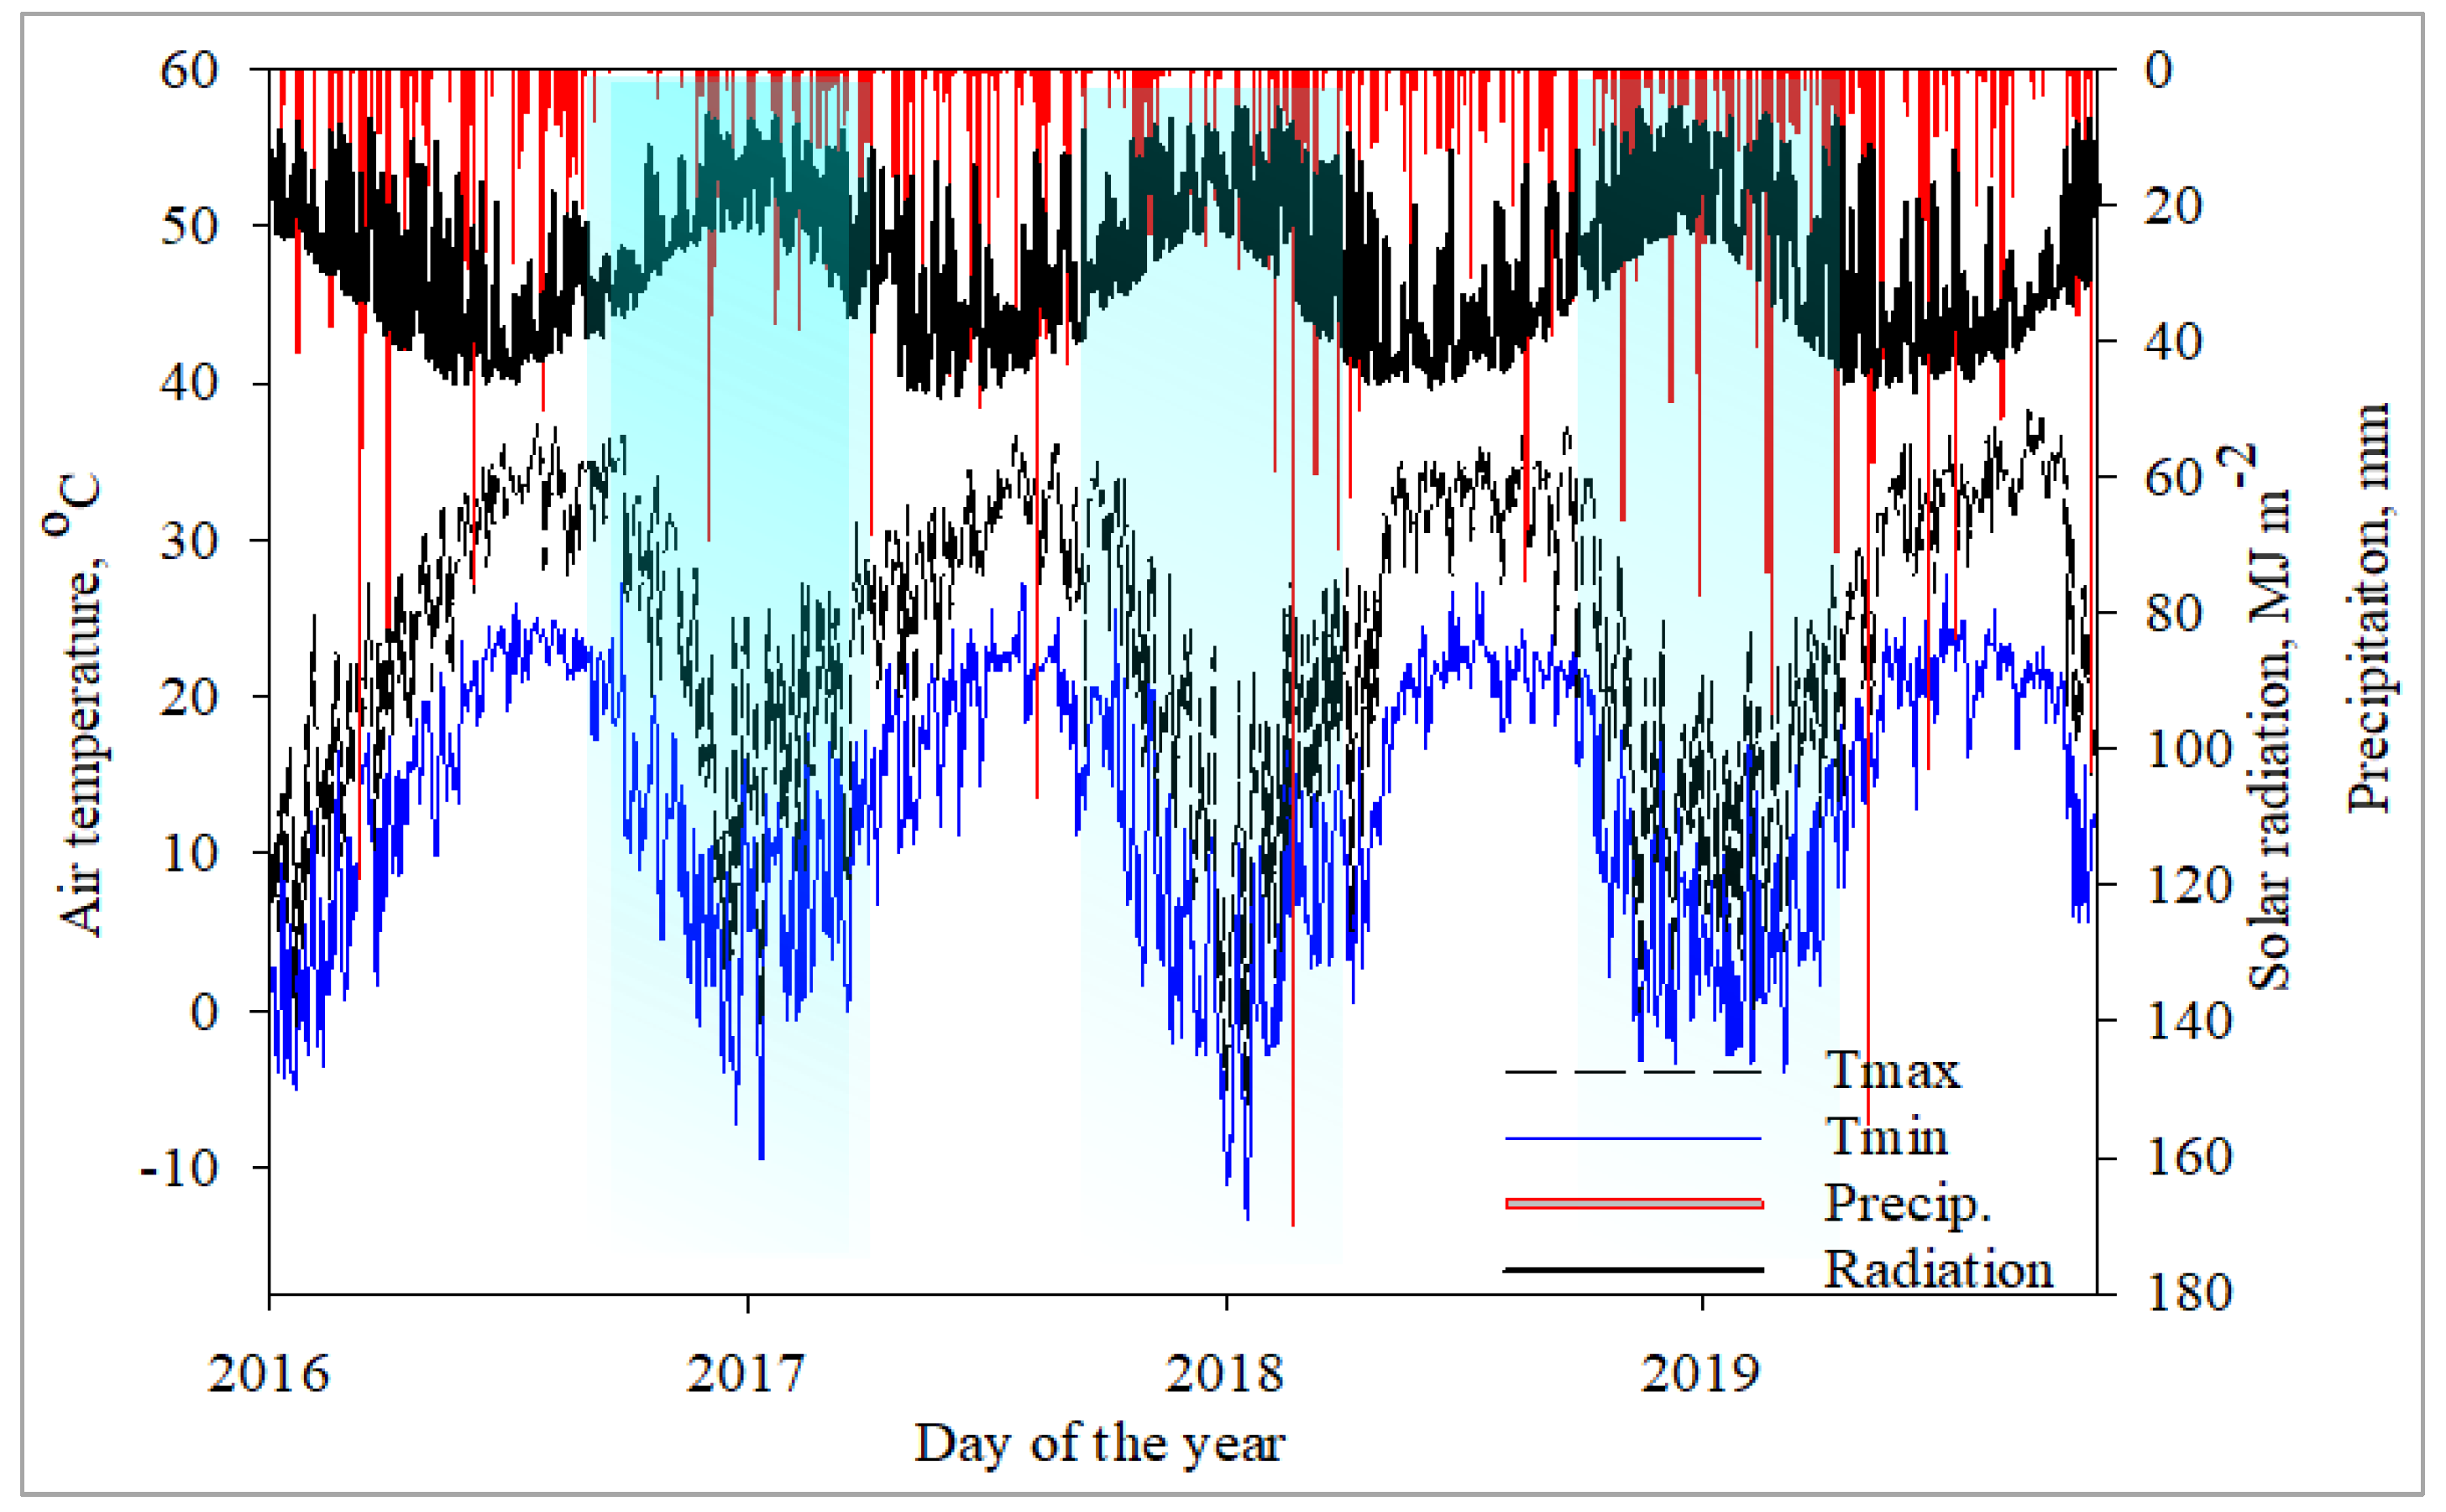
2.1. Experimental Site Description
2.2. Crop Management
2.3. Soil Water
2.4. Data Collection and Analysis
3. Results and Discussion
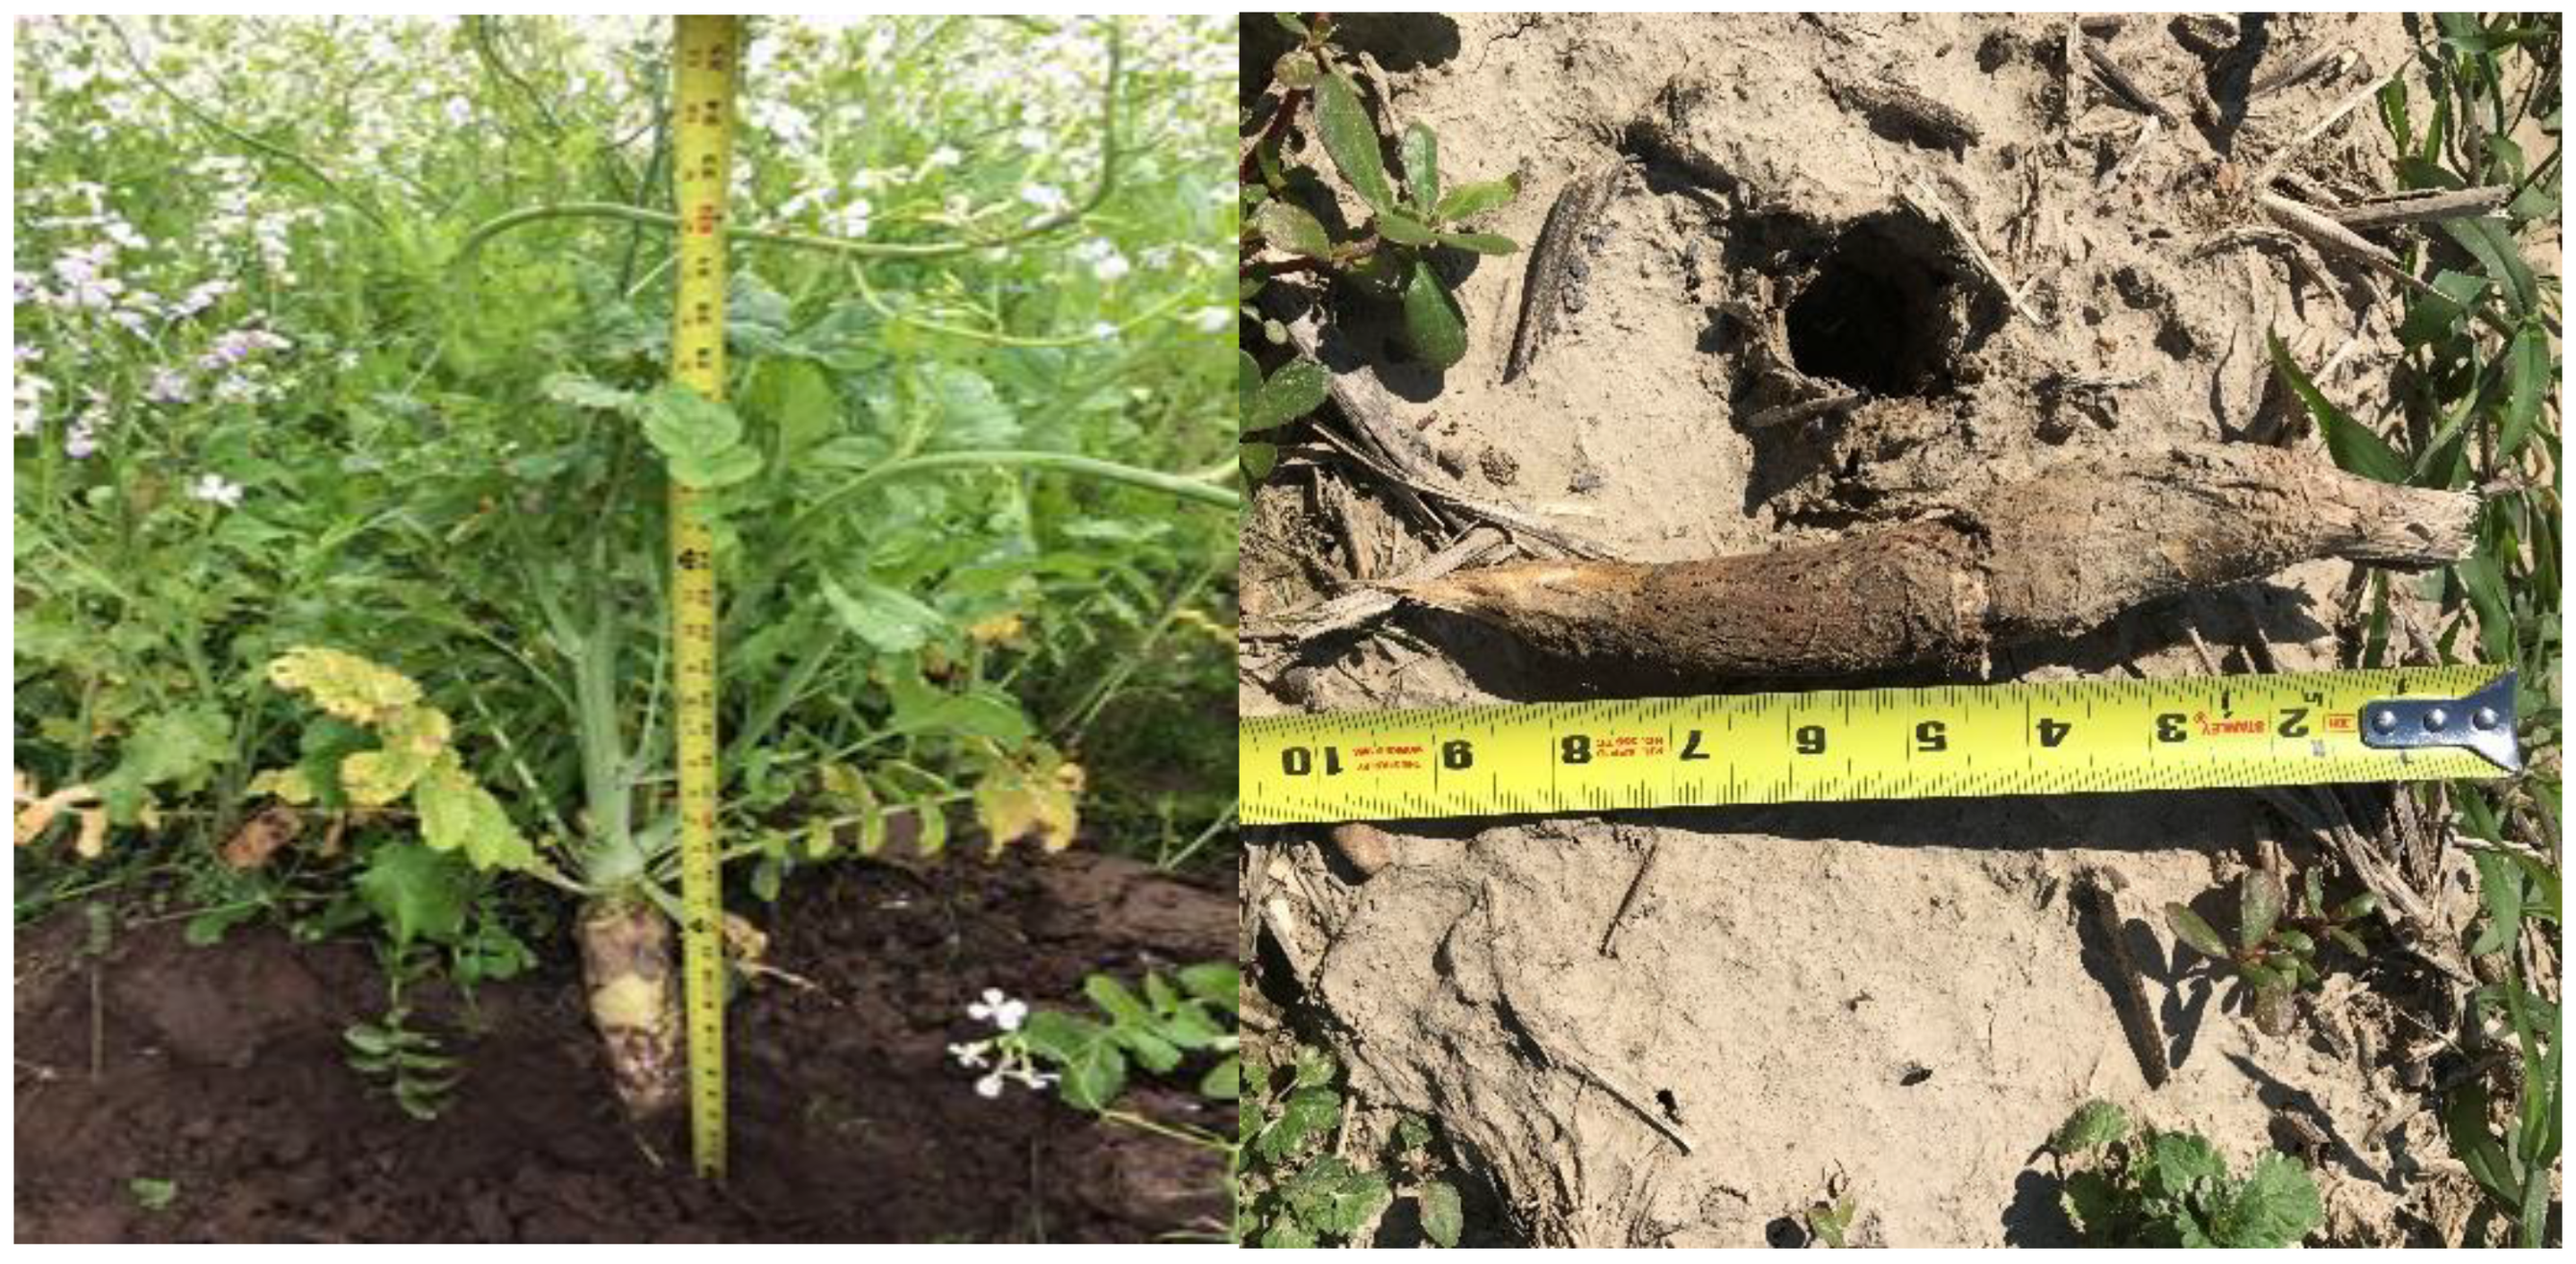
3.1. Cover Crop
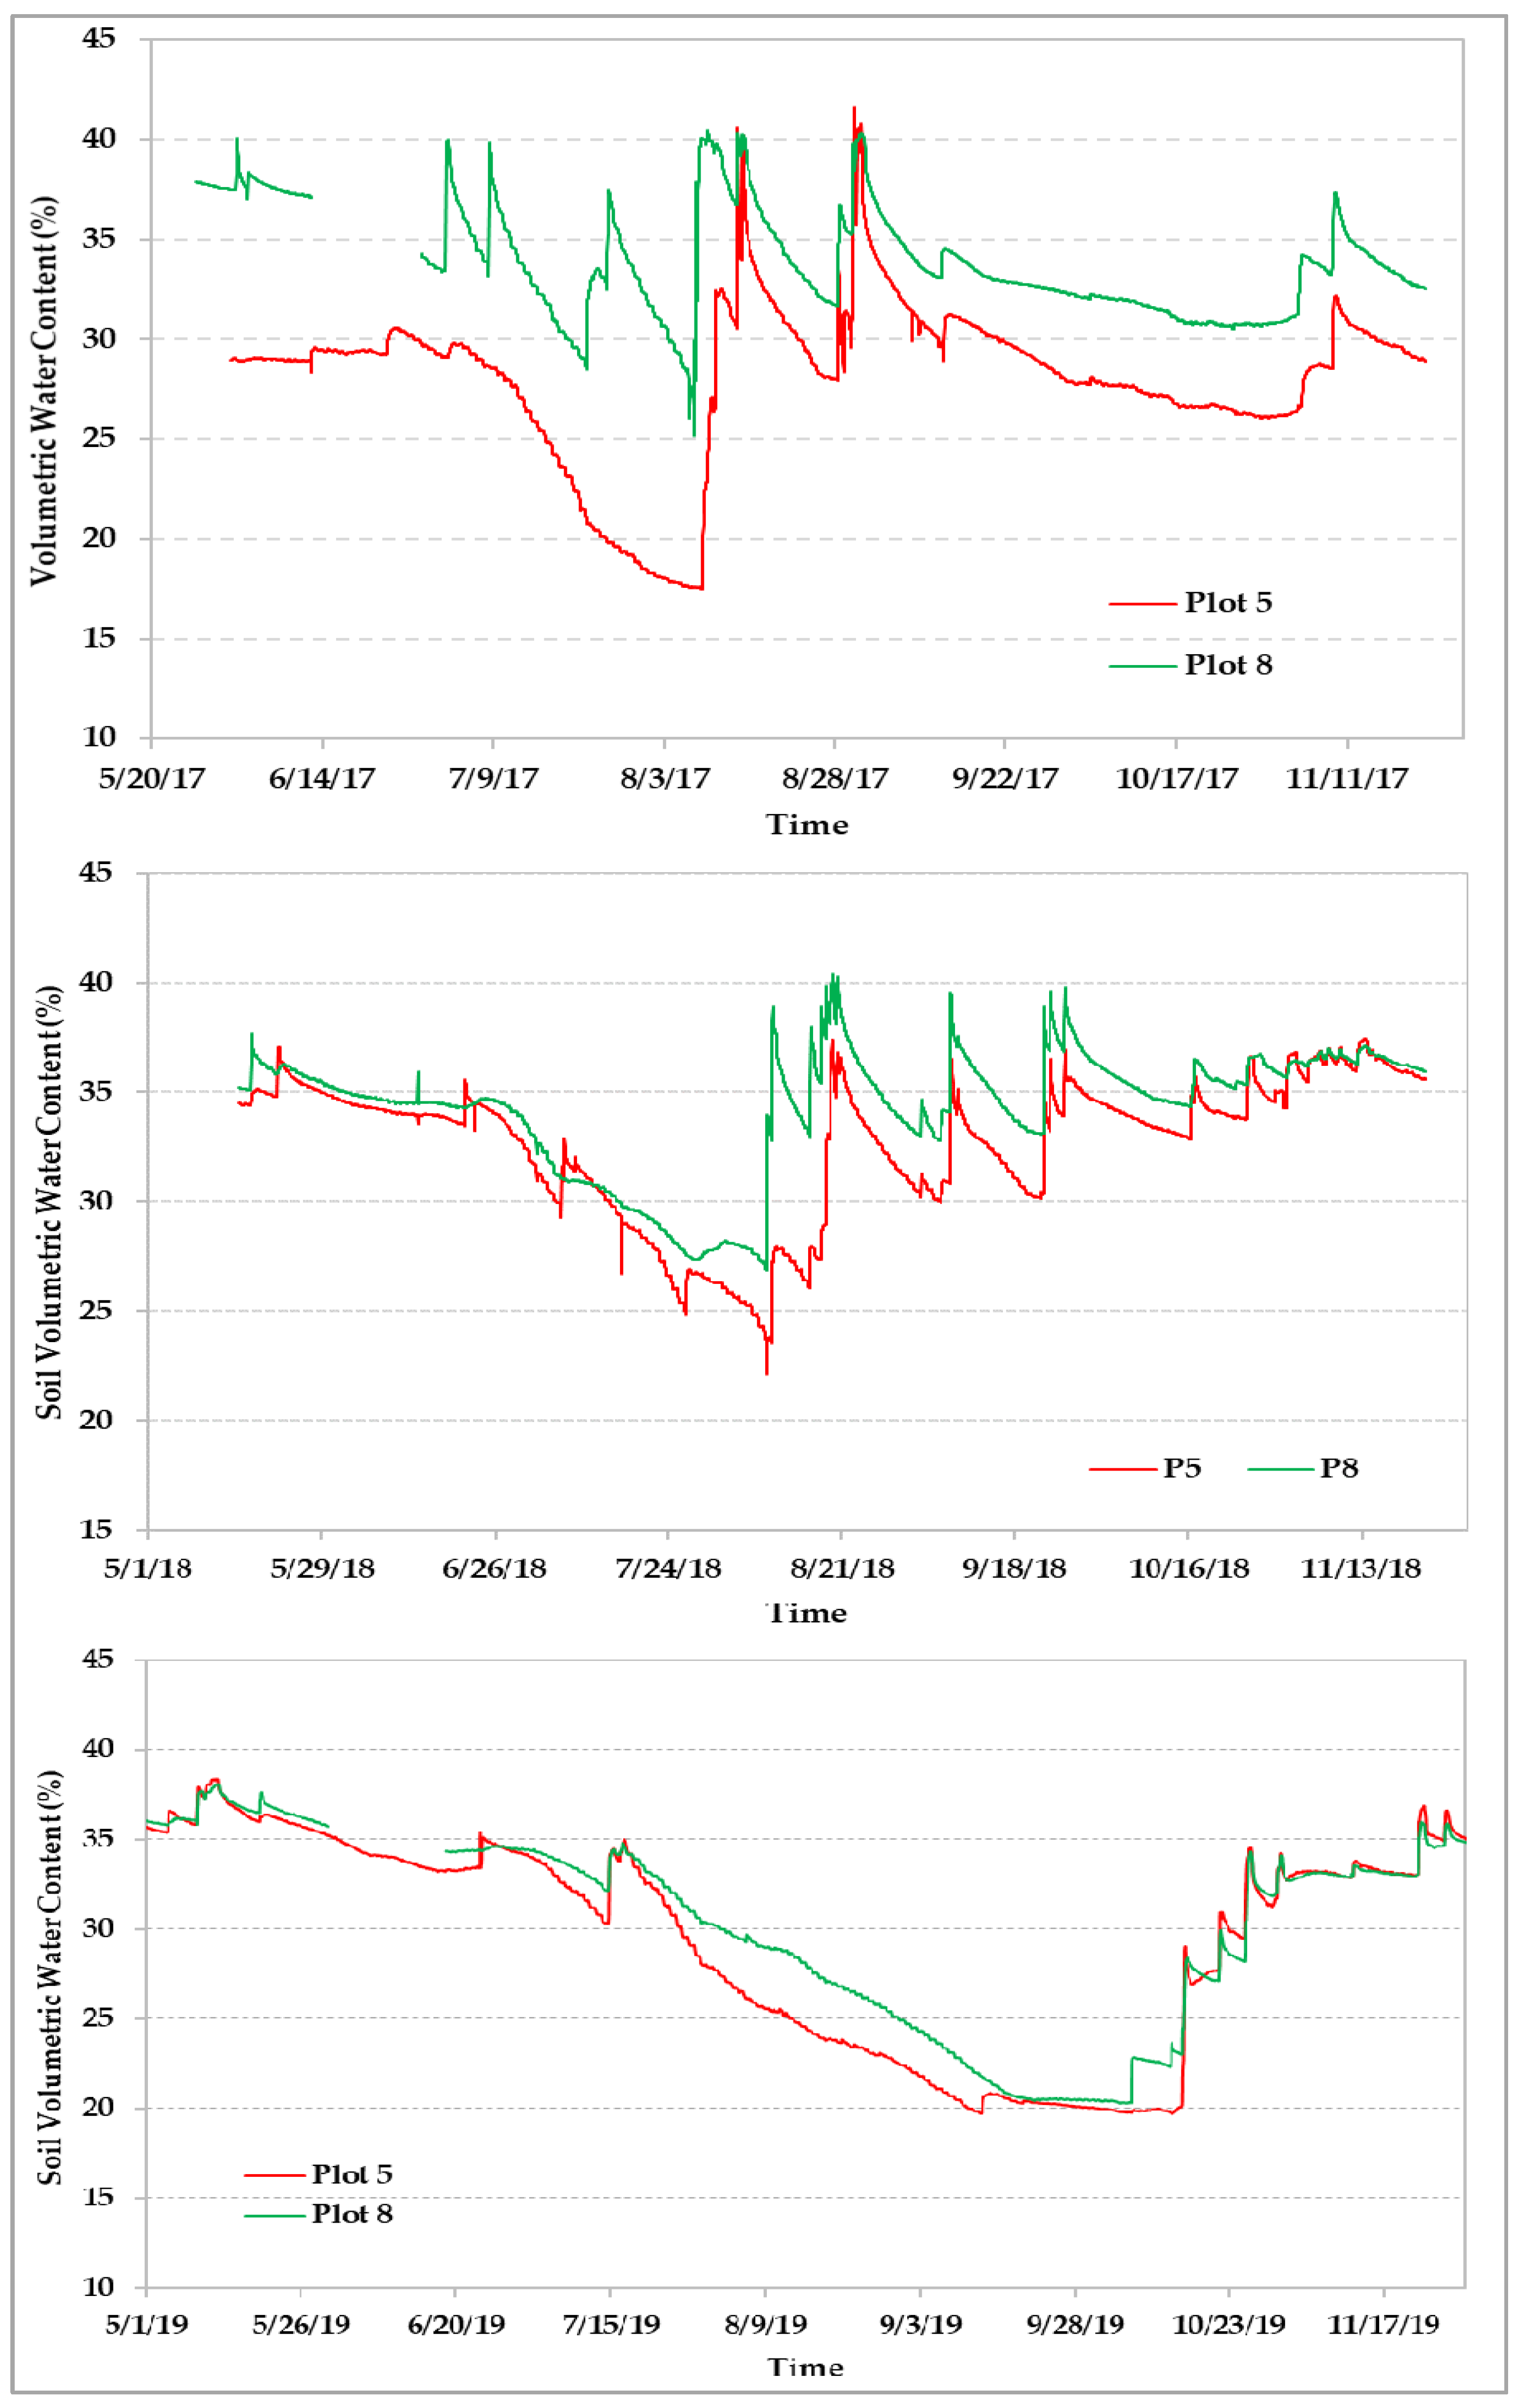
3.2. Soil Water
3.3. Cotton Lint Yield
4. Conclusions
Author Contributions
Funding
Institutional Review Board Statement
Informed Consent Statement
Data Availability Statement
Acknowledgments
Conflicts of Interest
Disclaimer
References
- U.S. Department of Agriculture (USDA). Economic Research Service. Cotton and Wool: Overview. 2020. Available online: https://www.ers.usda.gov/topics/crops/cotton-wool/ (accessed on 3 February 2021).
- Bauer, P.J.; Roof, M.E. Nitrogen, aldicarb, and cover crop effects on cotton yield and fiber properties. Agron. J. 2004, 96, 369–376. [Google Scholar] [CrossRef]
- Girma, K.; Teal, R.K.; Freeman, K.W.; Boman, R.K.; Raun, W.R. Cotton lint yield and quality as affected by applications of N, P, and K fertilizers. J. Cotton Sci. 2007, 11, 12–19. [Google Scholar]
- Fernandez, C.J.; McInnes, K.J.; Cothren, J.T. Water status and leaf area production in water- and nitrogen stressed cotton. Crop Sci. 1996, 36, 1224–1233. [Google Scholar] [CrossRef]
- Gerik, T.J.; Oosterhuis, D.M.; Torbert, H.A. Managing cotton nitrogen supply. Adv. Agron. 1998, 64, 115–147. [Google Scholar]
- Sui, R.; Byler, R.K.; Delhom, C.D. Effect of nitrogen application rate on yield and quality in irrigated and rainfed cotton. J. Cotton Sci. 2017, 21, 113–121. [Google Scholar]
- Gerik, T.J.; Jackson, B.S.; Stockle, C.O.; Rosenthal, W.D. Plant nitrogen status and boll load of cotton. Agron. J. 1994, 86, 514–518. [Google Scholar] [CrossRef]
- Cisneros, J.J.; Godfrey, L.D. Mid-season pest status of the cotton aphid (Homoptera: Aphididae) in California cotton: Is nitrogen a key factor? Environ. Entomol. 2001, 30, 501–510. [Google Scholar] [CrossRef] [Green Version]
- Howard, D.D.; Gwathmey, C.O.; Essington, M.E.; Roberts, R.K.; Mullen, M.D. Nitrogen fertilization of no-till cotton on loess-derived soils. Agron. J. 2001, 93, 157–163. [Google Scholar] [CrossRef] [Green Version]
- Tewolde, H.; Fernandez, C.J. Vegetative and reproductive dry weight inhibition in nitrogen- and phosphorus-deficient Pima cotton. J. Plant Nutr. 1997, 20, 219–232. [Google Scholar] [CrossRef]
- Van Groenigen, J.W.; Huygens, D.; Boeckx, P.; Kuyper, T.W.; Lubbers, I.M.; Rütting, T.; Groffman, P.M. The soil N cycle: New insights and key challenges. Soil 2015, 1, 235–256. [Google Scholar] [CrossRef] [Green Version]
- Khan, A.; Tan, D.K.Y.; Afridi, M.Z.; Luo, H.; Tung, S.A.; Ajab, M.; Fahad, S. Nitrogen fertility and abiotic stresses management in cotton crop: A review. Environ. Sci. Pollut. Res. 2017, 24, 14551–14566. [Google Scholar] [CrossRef] [PubMed]
- Snipes, C.; Nichols, S.P.; Poston, D.H.; Walker, T.W.; Evans, L.P.; Robinson, H.R. Current Agricultural Practices of the Mississippi Delta; Mississippi Agricultural & Forestry Experiment Station, Bulletin 1143; Mississippi State University: Mississippi State, MS, USA, 2005; p. 21. [Google Scholar]
- Clark, B.R.; Hart, R.M.; Gurdak, J.J. Groundwater Availability of the Mississippi Embayment: U.S; Geological Survey Professional Paper 1785; US Geological Survey: Reston, VA, USA, 2011; 62p.
- Unger, P.W.; Vigil, M.F. Cover crop effects on soil water relationships. J. Soil Water Conserv. 1998, 53, 200–207. [Google Scholar]
- Dabney, S.M.; Delgado, J.A.; Reeves, D.W. Using winter cover crops to improve soil and water quality. Commun. Soil Sci. Plant Anal. 2001, 32, 1221–1250. [Google Scholar] [CrossRef]
- Kaspar, T.C.; Kladivko, E.J.; Singer, J.W.; Morse, S.; Mutch, D.R. Potential and limitations of cover crops, living mulches, and perennials to reduce nutrient losses to water sources from agricultural fields in the upper Mississippi River Basin. In UMRSHNC (Upper Mississippi River Sub-basin Hypoxia Nutrient Committee). Final Report: Gulf Hypoxia and Local Water Quality Concerns Workshop; ASABE: St. Joseph, MI, USA, 2008; pp. 127–148. [Google Scholar]
- Zablotowicz, R.M.; Reddy, K.N.; Krutz, L.J.; Gordon, R.E.; Jackson, R.E.; Price, L.D. Can leguminous cover crops partially replace nitrogen fertilization in Mississippi Delta cotton production? Int. J. Agron. 2011, 2011, 135097. [Google Scholar] [CrossRef] [Green Version]
- Nouria, A.; Leea, J.; Yin, X.; Tylerc, D.D.; Saxtond, A.M. Thirty-four years of no-tillage and cover crops improve soil quality and increase cotton yield in Alfisols, Southeastern USA. Geoderma 2019, 337, 998–1008. [Google Scholar] [CrossRef]
- Weil, R.R.; White, C.M.; Lawley, Y. Forage Radish: New Multi-Purpose Cover Crop for the Mid-Atlantic. Fact Sheet 824. Maryland Cooperative Extension, University of Maryland 2009. Available online: https://www.researchgate.net/publication/233861705_Forage_radish_A_New_Multi-Purpose_Cover_Crop_for_the_Mid-Atlantic (accessed on 27 January 2021).
- Chen, G.; Weil, R.R. Penetration of cover crop roots through compacted soils. Plant Soil 2010, 331, 31–43. [Google Scholar] [CrossRef]
- Goolsby, D.A.; Battaglin, W.A. Long-term changes in concentrations and flux of nitrogen in the Mississippi River Basin, USA. Hydrol. Process 2001, 15, 1209–1226. [Google Scholar] [CrossRef]
- Potter, A.R.; Atwood, J.D.; Goss, D.W. Modeling regional and national non-point source impacts from US agriculture. ASAE Paper No. 012191. In Proceedings of the 2001 ASAE Annual Meeting, Sacramento, CA, USA, 30 July–1 August 2001. [Google Scholar] [CrossRef]
- Bakhsh, A.; Kanwar, R.S.; Bailey, T.B.; Cambardella, C.A.; Karlen, D.L.; Colvin, T.S. Cropping system effects on NO3-N loss with subsurface drainage water. Trans. ASAE 2002, 45, 1789–1797. [Google Scholar] [CrossRef] [Green Version]
- NRCS (Natural Resources Conservation Service). United States Department of Agriculture. Web Soil Survey 2021. Available online: https://websoilsurvey.sc.egov.usda.gov/ (accessed on 8 March 2021).
- Catchot, A. 2016 Insect Control Guide for Agronomic Crops. Mississippi State University Ext. Service 2015. Publ. 2471. Available online: https://www.mississippi-crops.com/2015/12/16/2016-insect-control-guide-now-available/ (accessed on 19 March 2021).
- Mississippi Weed Science Committee (MWSC). 2016 Weed Control Guidelines for Mississippi. Mississippi State University Ext. Service 2016, Publ. 1532. Available online: http://extension.msstate.edu/publications/weed-control-guidelines-for-mississippi (accessed on 19 March 2021).
- Bond, J.A.; Dodds, D.M.; Golden, B.R.; Irby, J.T.; Larson, E.J.; Lawrence, B.H.; Sarver, J.M. 2018 Weed Management Suggestions for Mississippi Row Crops 2017, Publ. 3171. Available online: https://www.mssoy.org/uploads/files/weed-cont-guide-miss-soy-2018_1.pdf (accessed on 19 March 2021).
- Sui, R. Irrigation scheduling using soil moisture sensors. J. Agric. Sci. 2018, 10, 1–11. [Google Scholar] [CrossRef]
- Lewis, K.L.; Burke, J.A.; Keeling, W.S.; McCallister, D.M.; DeLaune, P.B.; Keeling, J.W. Soil benefits and yield limitations of cover crop use in Texas High Plains cotton. Agron. J. 2018, 110, 1616–1623. [Google Scholar] [CrossRef]
- Chen, G.; Weil, R.R.; Hill, R.L. Effects of compaction and cover crops on soil least limiting water range and air permeability. Soil Tillage Res. 2014, 136, 61–69. [Google Scholar] [CrossRef]
- Haruna, S.I.; Nkongolo, N.; Anderson, S.H.; Eivazi, F. In situ infiltration as influenced by cover crop and tillage management. J. Soil Water Conserv. 2018, 73, 164–172. [Google Scholar] [CrossRef]
- Kornecki, T.S.; Price, A.J.; Balkcom, K.S. Cotton population and yield following different cover crops and termination practices in an Alabama no-till system. J. Cotton Sci. 2015, 19, 375–386. [Google Scholar]
- McDonald, M.D.; Lewis, K.L.; Ritchie, G.L. Short term cotton lint yield improvement with cover crop and no-tillage implementation. Agronomy 2020, 10, 994. [Google Scholar] [CrossRef]
- USDA Agricultural Marketing Service. Cotton Price Stat. 2021, 102, 11.


| Year | Source | DF | Mean Square | F Value | Pr > F |
|---|---|---|---|---|---|
| 2017 | Cover Crop | 1 | 2408 | 2.39 | 0.1607 |
| N rate | 1 | 1925 | 1.91 | 0.2042 | |
| Cover Crop × N rate | 1 | 6533 | 6.48 | 0.0344 | |
| 2018 | Cover Crop | 1 | 9690 | 0.69 | 0.4309 |
| N rate | 1 | 32137 | 2.28 | 0.1694 | |
| Cover Crop × N rate | 1 | 3234 | 0.23 | 0.6447 | |
| 2019 | Cover Crop | 1 | 31416 | 2.75 | 0.1361 |
| N rate | 1 | 90828 | 7.94 | 0.0226 | |
| Cover Crop × N rate | 1 | 4563 | 0.4 | 0.5453 |
| Effect | Comparison | 2017 | 2018 | 2019 | |||
|---|---|---|---|---|---|---|---|
| Mean * | SD | Mean | SD | Mean | SD | ||
| CC | CC–NCC | 1292 e | 54 | 1429 e | 100 | 983 e | 148 |
| NCC | 1264 e | 20 | 1486 e | 140 | 1085 e | 124 | |
| N84 | N84–N140 | 1266 e | 27 | 1405 e | 118 | 947 a | 123 |
| N140 | 1291 e | 52 | 1509 e | 105 | 1121 b | 102 | |
| CC × N84 | CC × N84–CC × N140 | 1256 a | 39 | 1393 e | 109 | 876 e | 137 |
| CC × N140 | 1328 b | 43 | 1464 e | 97 | 1089 e | 45 | |
| NCC × N84 | NCC × N84–NCC × N140 | 1275 e | 9 | 1417 e | 151 | 1018 e | 61 |
| NCC × N140 | 1253 e | 23 | 1554 e | 111 | 1153 e | 145 | |
| CC × N84 | CC × N84–NCC × N84 | 1256 e | 39 | 1393 e | 109 | 876 e | 137 |
| NCC × N84 | 1275 e | 9 | 1417 e | 151 | 1018 e | 61 | |
| CC × N140 | CC × N140–NCC × N140 | 1328 c | 43 | 1464 e | 97 | 1089 e | 45 |
| NCC × N140 | 1253 d | 23 | 1554 e | 111 | 1153 e | 145 | |
Publisher’s Note: MDPI stays neutral with regard to jurisdictional claims in published maps and institutional affiliations. |
© 2021 by the authors. Licensee MDPI, Basel, Switzerland. This article is an open access article distributed under the terms and conditions of the Creative Commons Attribution (CC BY) license (https://creativecommons.org/licenses/by/4.0/).
Share and Cite
Sui, R.; Anapalli, S.S. Effects of Nitrogen Rate and Cover Crop on Cotton (Gossypium hirsutum L.) Yield and Soil Water Content. Agriculture 2021, 11, 650. https://doi.org/10.3390/agriculture11070650
Sui R, Anapalli SS. Effects of Nitrogen Rate and Cover Crop on Cotton (Gossypium hirsutum L.) Yield and Soil Water Content. Agriculture. 2021; 11(7):650. https://doi.org/10.3390/agriculture11070650
Chicago/Turabian StyleSui, Ruixiu, and Saseendran S. Anapalli. 2021. "Effects of Nitrogen Rate and Cover Crop on Cotton (Gossypium hirsutum L.) Yield and Soil Water Content" Agriculture 11, no. 7: 650. https://doi.org/10.3390/agriculture11070650
APA StyleSui, R., & Anapalli, S. S. (2021). Effects of Nitrogen Rate and Cover Crop on Cotton (Gossypium hirsutum L.) Yield and Soil Water Content. Agriculture, 11(7), 650. https://doi.org/10.3390/agriculture11070650