Article

Effects of Main Meteorological Indicators on Eating Quality of Rice in Lower Reaches of the Huai River

Jiangsu Key Laboratory of Crop Genetics and Physiology, Jiangsu Co-Innovation Center for Modern Production Technology of Grain Crops, Yangzhou University, Yangzhou 225009, China
*
Author to whom correspondence should be addressed.
Agriculture 2021, 11(7), 618; https://doi.org/10.3390/agriculture11070618
Submission received: 23 May 2021 / Revised: 27 June 2021 / Accepted: 28 June 2021 / Published: 30 June 2021

Abstract

:
The main meteorological indicators affecting the eating quality of rice (Oryza sativa L.) in the lower reaches of Huai river were studied and the optimal sowing time range for obtaining good eating quality was put forward. Compared with solar radiation, rainfall, and humidity, temperature is the primary meteorological factor affecting the eating quality of rice in the lower reaches of the Huai river. Sowing the rice on different dates altered the heading and maturity dates of rice, and the difference between the mean daily temperature (Tmean) from the heading to maturity stage reached 4.6–5.0 °C. The Tmean from heading to maturity for all treatments was less than 23.5 °C. When the temperature was lower than 20.2 °C during the grain filling period, the value of the comprehensive evaluation of eating quality (CEQ) of the three types of rice decreased significantly. The medium-maturing japonica soft rice varieties (SMR), late-maturing japonica soft rice varieties (SLR), and late-maturing japonica non-soft rice varieties (LR) varieties that were subjected to low temperatures had a higher amylose content and protein content. Overall, the eating quality of rice in the lower reaches of the Huai river was affected by the low Tmean after the heading stage. The mean daily temperature (Tmean) range from the heading to maturity stages of SMR, SLR, and LR varieties that produced relatively high CEQ were 20.2–23.3 °C, 20.2–22.1 °C, and 20.3–22.1 °C, respectively. The optimal sowing date ranges of SMR, SLR, and LR were 16 May to 1 June, 16 to 18 May, and 16 to 20 May, respectively.

1. Introduction

The rice planting area along the lower reaches of Huai River accounts for about 45% of the rice planting area in Jiangsu Province [1]. Since 1960, the yield per unit area of rice in this region has significantly increased [2], primarily due to improvements in rice varieties and innovative cultivation techniques [3,4,5,6]. As people’s living standards have improved, the demand for good-quality rice has increased more than the demand for high-yield rice, and the demand for high-quality japonica rice is growing rapidly in the Yangtze River Basin, especially in coastal cities [7]. Therefore, it is extremely important to improve rice quality and increase the supply of high-quality, high-yield rice [8]. Grain quality includes several parameters such as grain shape, amylose content, aroma, and other attributes [9]. The eating quality of rice is controlled by its genes and is also affected by environmental factors during the grain-filling period [10,11]. Much research has been performed on the effects of temperature and solar radiation (T and R) on rice production. Previous studies can typically be divided into two categories: the first is to use an artificial climate chamber or incubator with different temperatures and light environments during a key growth stage of rice to study how temperature and light influence the formation of rice yield or quality [12]; the second is to study the influence of single factor of temperature or light on rice yield and quality through open active warming or shading, which has little influence on other environmental factors on farmland [13,14]. However, it is difficult to study the effects of temperature and light on rice yield and quality for several reasons. First, the environmental factors are complex and diverse, including temperature, radiation, humidity, and rainfall [15]; second, environmental factors change significantly during the growth process of rice, making them difficult to predict [16]. The results of previous studies differ due to different test varieties and research methods [17,18]. In this study, seven different environmental treatments were used to grow rice to study the effects of temperature and light on the yield and quality of high-quality rice, which represent the actual field growth conditions of rice. Sufficient light and heat resources help maximize the likelihood of cultivating high-quality rice [19,20]. Starch and protein are major components in rice endosperm. Previous studies have demonstrated that temperature affects the activities of enzymes related to amylose synthesis and decomposition, and indirectly affects amylose content (AC) [21,22]. Previous studies have also found that the effect of temperature on AC is related to the AC of the variety itself [23,24]. Most studies found that high temperatures increased the activity of protein enzymes in the stem, sheath, and leaves, and that more soluble nitrogen (N) compounds were transported to the grains, which increased the protein content (PR) in grains [25,26]. Solar radiation also affects rice quality during the grain-filling period. As solar radiation decreases, the ability of the plant to synthesize carbohydrates weakens and the number of carbohydrates transferred to the grain decreases, while the amount of N and protein transferred to the grain per unit increases [27].
However, previous studies primarily focused on a single meteorological factor. Due to the differences between tested varieties and treatments, no uniform suitable temperature range has been identified in which to grow high-quality rice [28,29]. There have been few reports assessing how complex environmental factors affect rice eating quality.
From seed to cooked rice, rice has gone through production, processing, and consumption. Rice growers look for ways to reduce costs and increase rice yields. Rice processing enterprises pay more attention to the commodity quality of rice, while rice consumers pay more attention to the edible and tasting quality of rice. Our previous research had shown that among many meteorological factors, temperature was the key factor affecting yield formation [30]. Rice yield was more easily affected by the temperature before heading when they were planted along the lower reaches of Huai river. The excessively high temperature before heading reduced the number of panicles per unit area of rice. Moreover, the sowing times of mid maturity and late maturity varieties from 15 to 31 May and 15 to 18 May were beneficial to high yield. Rice quality is formed after heading. Our research investigates how the temperature after the heading stage influences the formation of better rice quality under the optimum sowing period for high yields. We explored the temperature requirements during the rice filling period to obtain better processing and appearance quality [31]. With regard to the effects of temperature and solar radiation on the rice commodity quality, we believed that early sowing was beneficial to improve the head milled rice rate of early maturing varieties under appropriate early sowing conditions, but early sowing was not conducive to improve the head milled rice rate of late maturing varieties. For appearance quality, our study suggested that a lower temperature during grain filling was beneficial for reducing the chalky grain rate. However, superior milling quality and appearance quality were not equal to superior eating and tasting quality. We studied the response of rice eating quality to environmental factors. It was found that the response of rice yield, eating quality, and milling or appearance quality to rice temperature or solar radiation were not identical. Moreover, our previous studies on the influence of temperature on the physical and chemical indexes (amylose content, protein content, etc.) affecting rice eating quality had not been clarified. In this study, we analyzed how meteorological indicators affects rice quality in Jiangsu Province by sowing different rice varieties at seven different times. The purpose of this study is to (1) clarify the meteorological characteristics of high-quality rice in the lower reaches of the Huai river to obtain better eating quality and (2) propose a suitable sowing time range for the production of high yield, high-quality rice in this area.

2. Materials and Methods

2.1. Plant Materials and Experimental Design

Field experiments were conducted at the research farm of Yangzhou University in Jiangsu Province, China (33°35′ N, 118°51′ E) in 2017 and 2018 during rice cropping seasons. The soil of the field was muddy with 1.59 g kg−1 total nitrogen, 21.42 g kg−1 organic matter, 48.22 mg kg−1 available phosphorus, and 98.28 mg kg−1 available potassium. The rice materials and sowing dates were listed in Table 1. The transplanting density was 27.8 × 10⁴ hills per hectare (12 cm × 30 cm), with four seedings in each hill. The size of each subplot was 20 m2 (4 m × 5 m), and three replicates were planted for each variety.
A total of 270 kg ha−1 N was applied as urea in three stages: 94.5 kg ha−1 N before transplanting, 94.5 kg ha−1 N at 7 days after transplanting, and 81 kg ha−1 N at 65 days after transplanting. A total of 135 kg ha−1 calcium superphosphate (P2O5 content: 12%) was applied at the per-transplanting stage. Similarly, 135 kg ha−1 potassium chloride (K2O content: 60%) was applied at 7 days and 65 days after transplanting. Water, weeds, insects, and disease were controlled as required, to avoid yield loss.

2.2. Sampling and Measurements

All rice plants were harvested by hand. The moisture of the grain yield was determined to be 14%. During the maturity stages, three bundles of representative plants with the average number of tillers in their respective blocks were selected. The panicles were subjected to high-temperature desiccation at 105 °C for 30 min and then dried at 80 °C to a constant weight. The dry weights were then measured.
Amylose content (AC) was determined by assessing the absorption at 620 nm by scanning the iodine absorption spectrum from 400 to 900 nm with a spectrophotometer (Ultrospec 6300 pro, Amershan Biosciences, Cambridge, Sweden). The values were converted to AC, referencing a standard curve prepared from rice.
Rice starch viscosity characteristics were evaluated using an RVA (Model no. RVA-3D; Newport Scientific, Sydney, Australia), as described by Zhu et al. [32]. Viscosity values were recorded as centipoises (cP). A Kjelec™ 8400 equipment (Infratec 1241, FOSS, Copenhagen, Denmark) was used to determine the N content of the panicles and the N content of milled rice, while the protein content (PC) was obtained by multiplying the product of N content by 5.95 [33].
STA1 A (Satake, Hiroshima, Japan) was used to assess the taste value of the rice grains. The taste value is a comprehensive evaluation of cooked rice and includes appearance, hardness, viscosity, and degree of balance. The primary function of this test was to convert the various physicochemical parameters of rice into a comprehensive evaluation of eating quality (CEQ).
The effective accumulated temperature (EAT) is the sum of the mean daily temperatures during each phenological stage in which the mean daily temperature is above 10 °C each day [6].
The cumulative solar radiation (CSR) in the determined growth duration, expressed as MJ m−2, was calculated as:
CSR = ∑Q × Growth duration
Q Q 0 = a + b × S S 0
where Q is global solar radiation (MJ m−2 d−1), Q0 is the extraterrestrial solar radiation (MJ m−2 d−1), S is the actual sunshine hours of a day, and S0 is the potential sunshine hours of a day.
Relative CEQ = CEQ Ti CEQ Tn , where CEQTi represents the CEQ of rice under Ti treatment, CEQTn represents the CEQ under treatment that allows the rice to reach full maturity [34,35], and SMR: n = 7, SLR: n = 4, LR: n = 4.

2.3. Statistical Analysis

Data were analyzed using analysis of variance (ANOVA) with SPSS 13.0. Means were compared using the least significant difference (LSD) test at the 0.05 probability level. Graphs were prepared using SigmaPlot 10.0.

3. Results

3.1. Characteristics of Meteorological Indicators
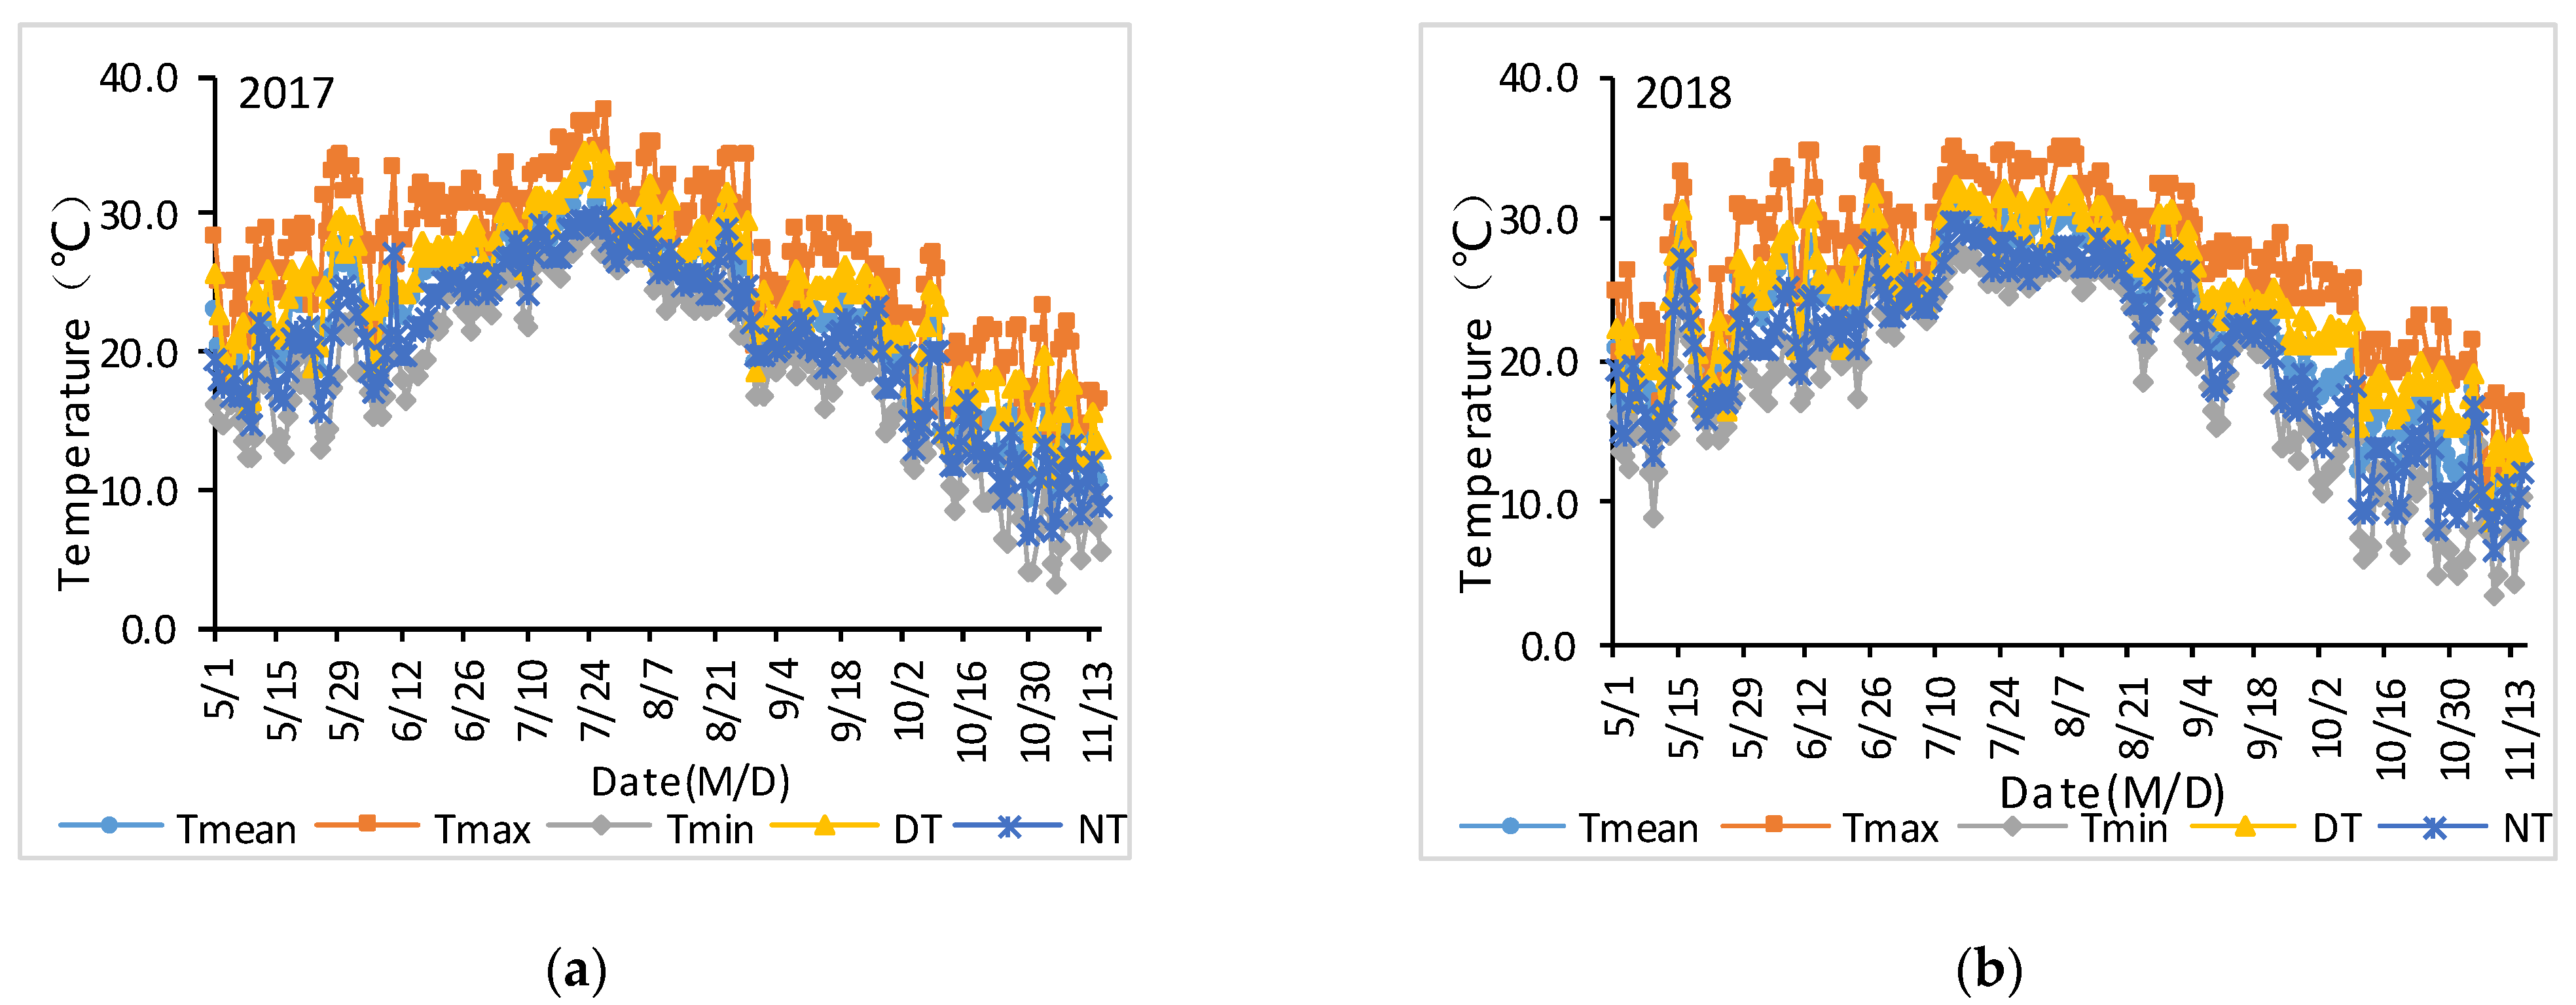
3.1.1. Temperature

The mean daily temperature (Tmean), maximum temperature (Tmax), minimum temperature (Tmin), day temperature (DT), and night temperature (NT) had similar variation characteristics during the rice growing season (Figure 1). The five temperature indicators showed a gradually increasing trend since 1 May, reached the maximum value in late July, then showed a slowly decreasing trend, and reached the lowest value in early November.

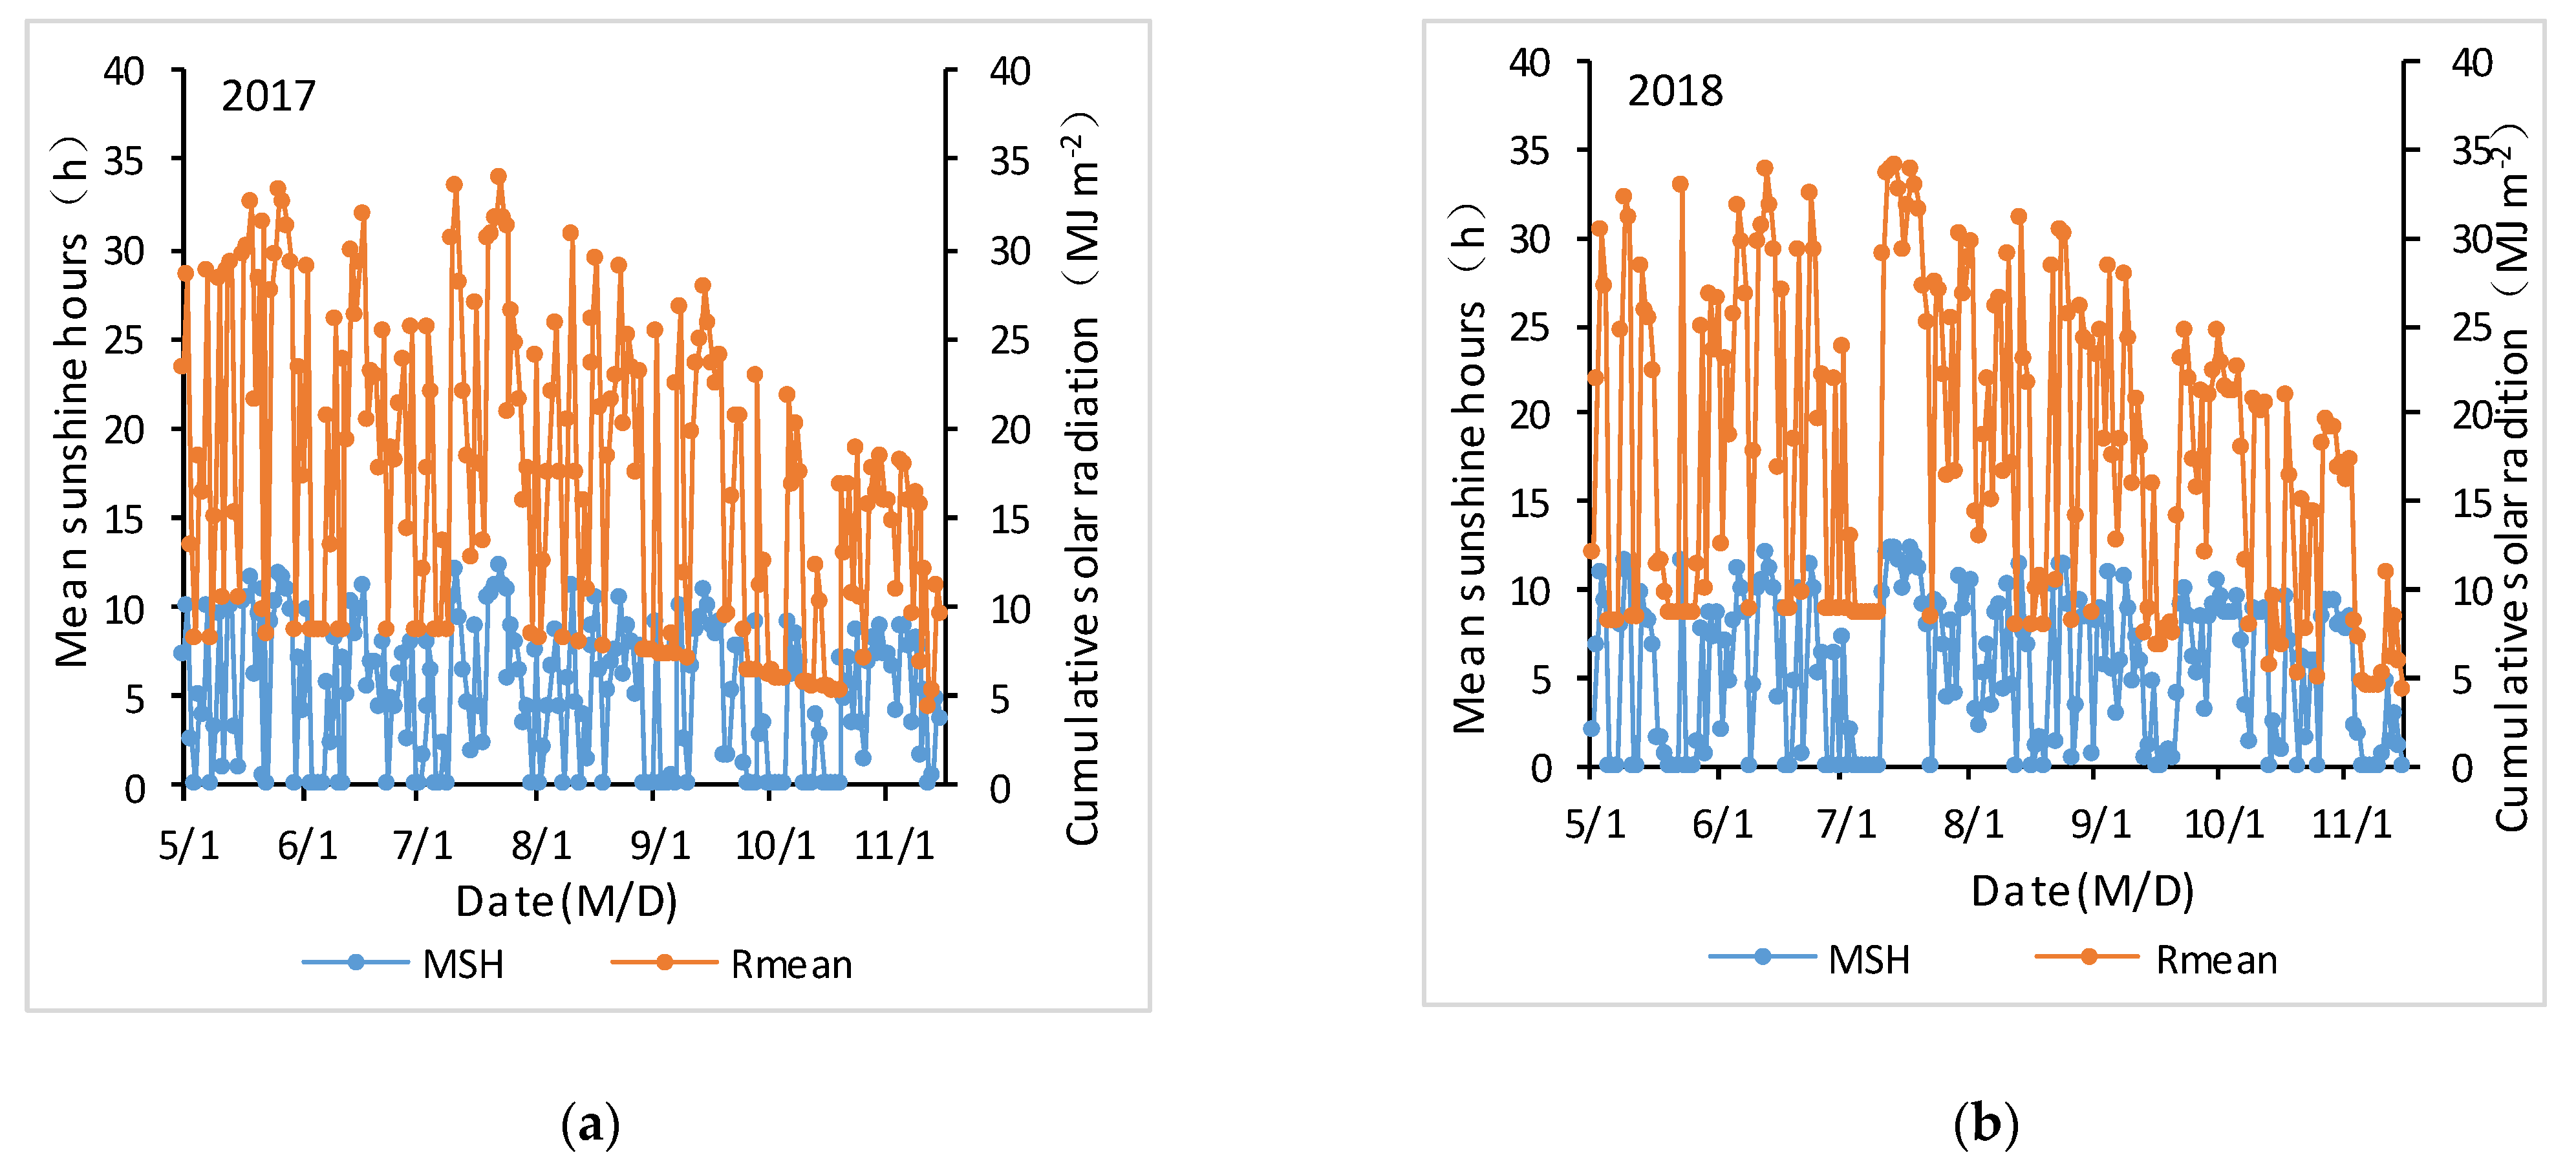
3.1.2. Sunshine Hours and Solar Radiation

In this study, the widely used Angstrom-Prescott (AP) model was used to convert the number of sunshine hours into daily total solar radiation (photosynthetically active radiation). Therefore, the mean sunshine hours (MSH) and mean daily solar radiation Rmean in the rice growing season showed similar variation characteristics (Figure 2). The Rmean showed an overall trend of decreasing day by day, and the change law was consistent in the two years.

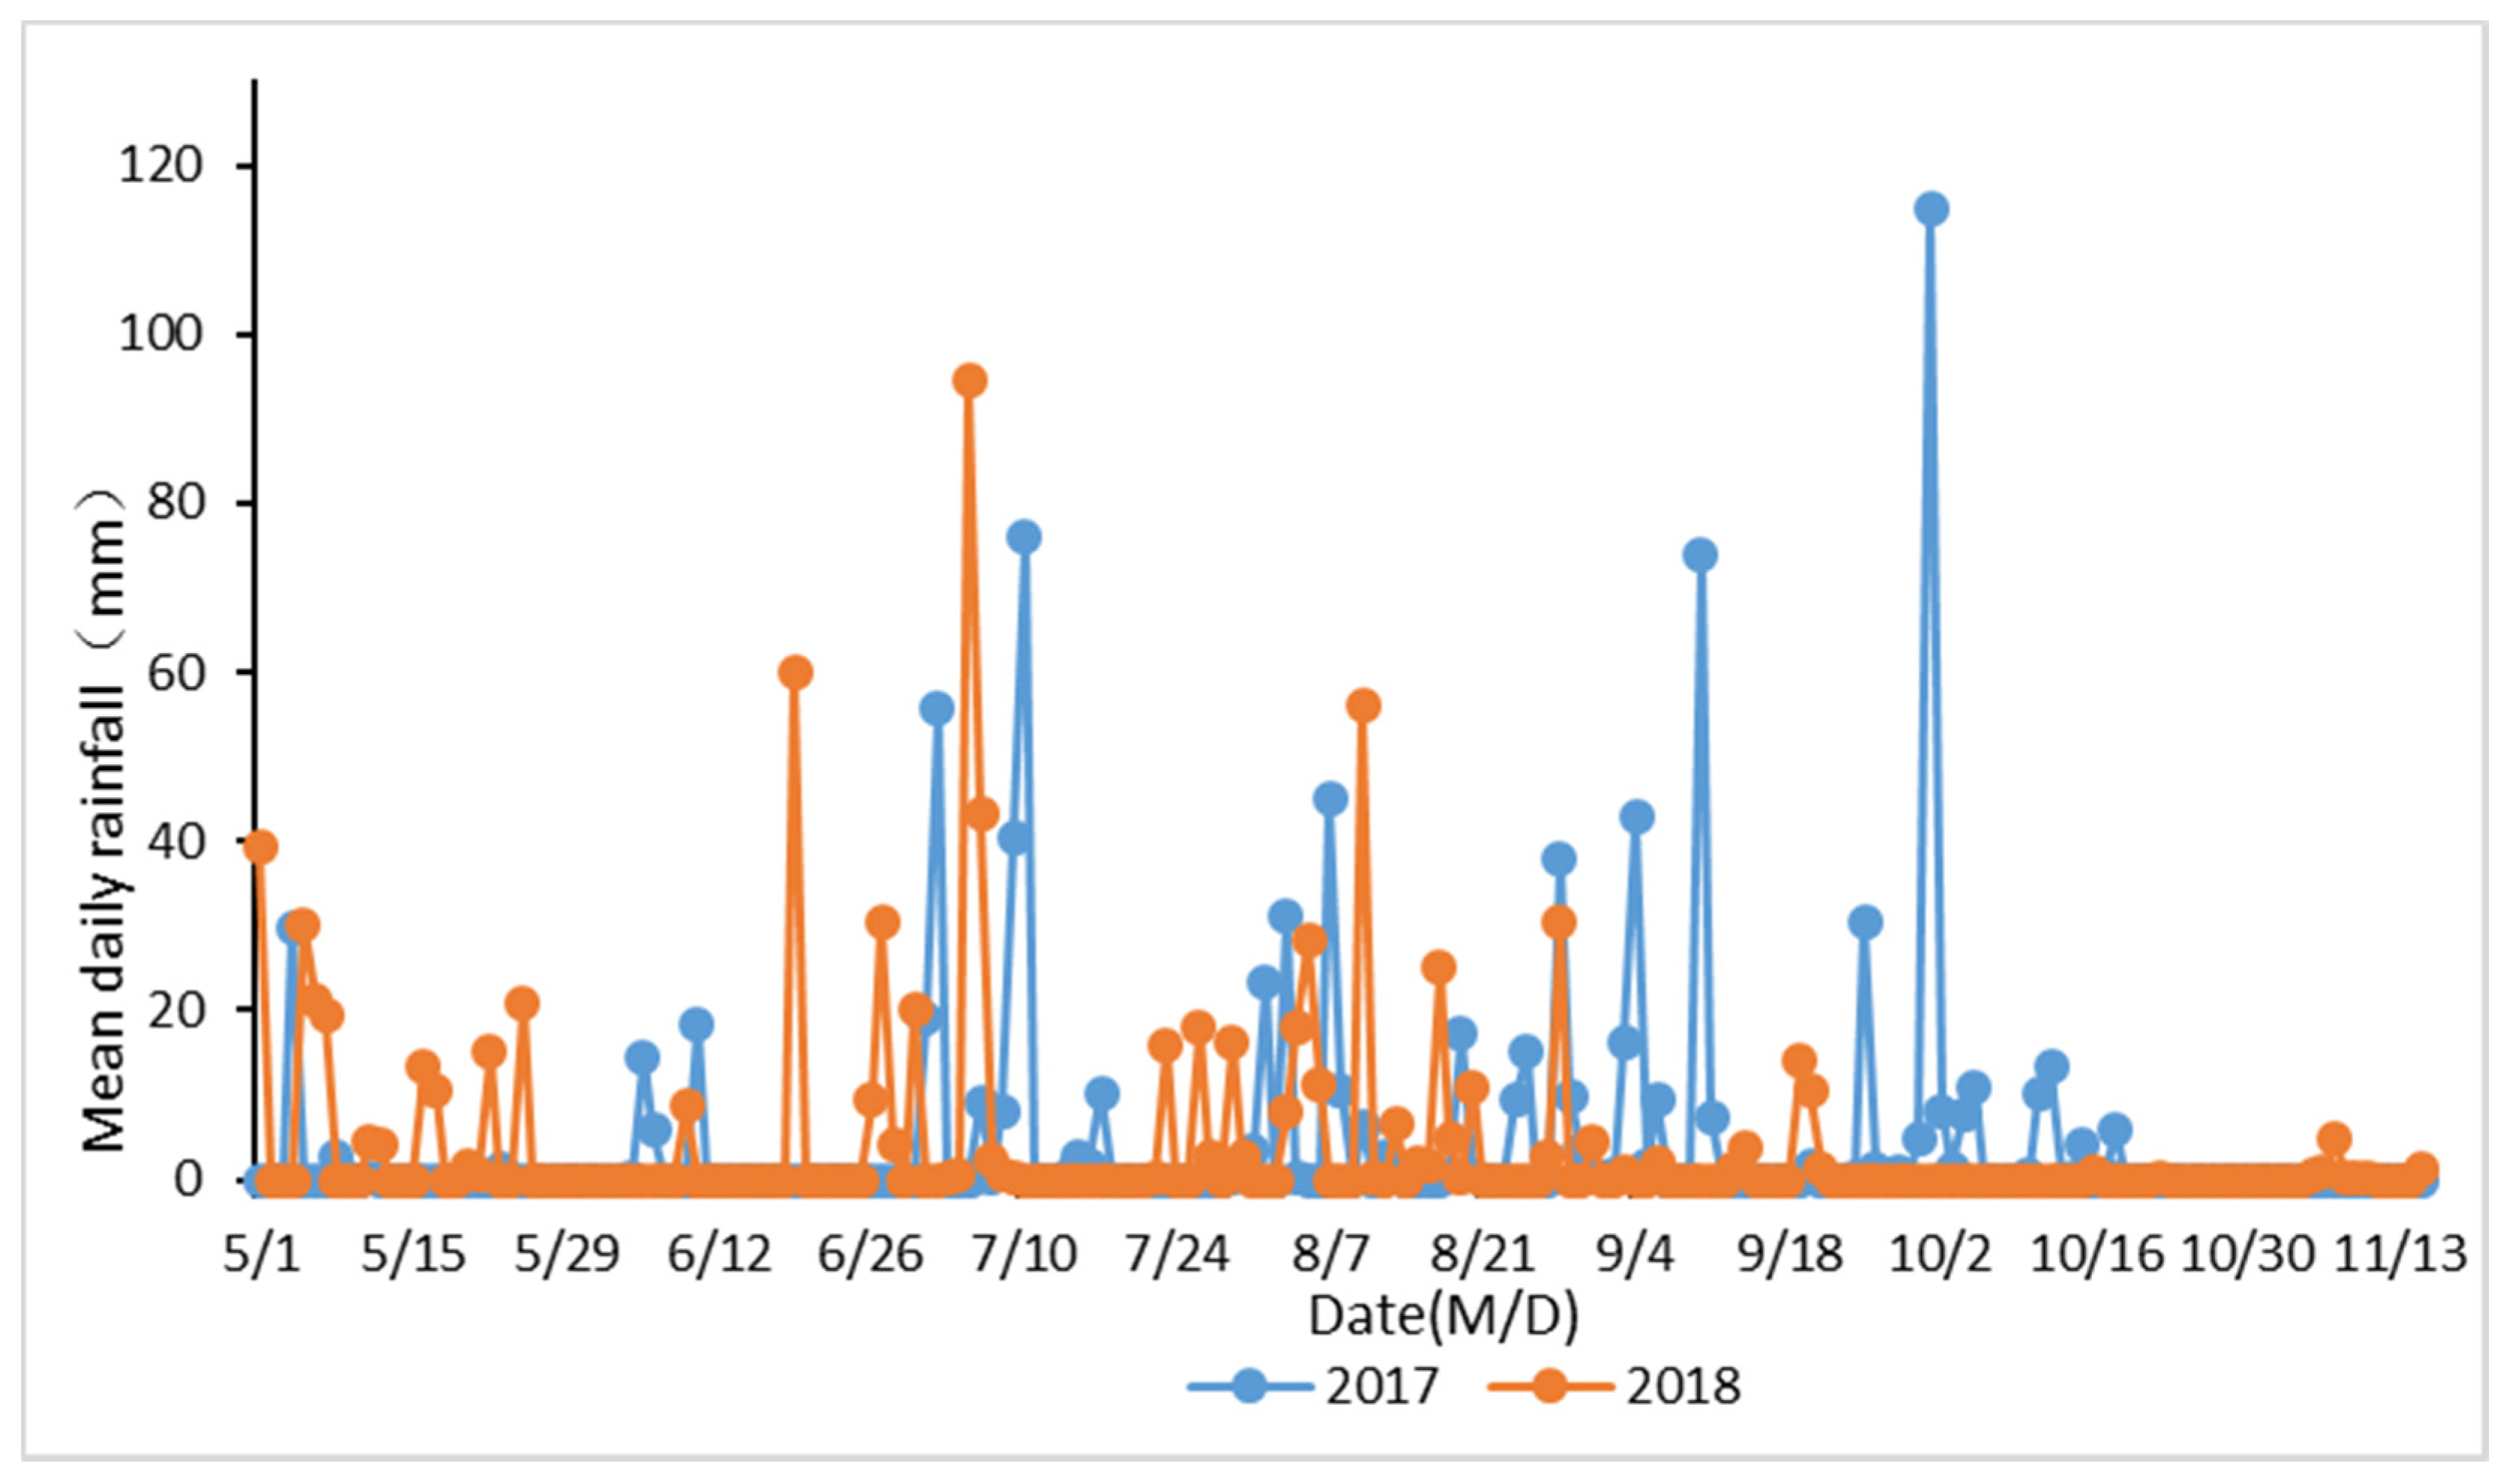
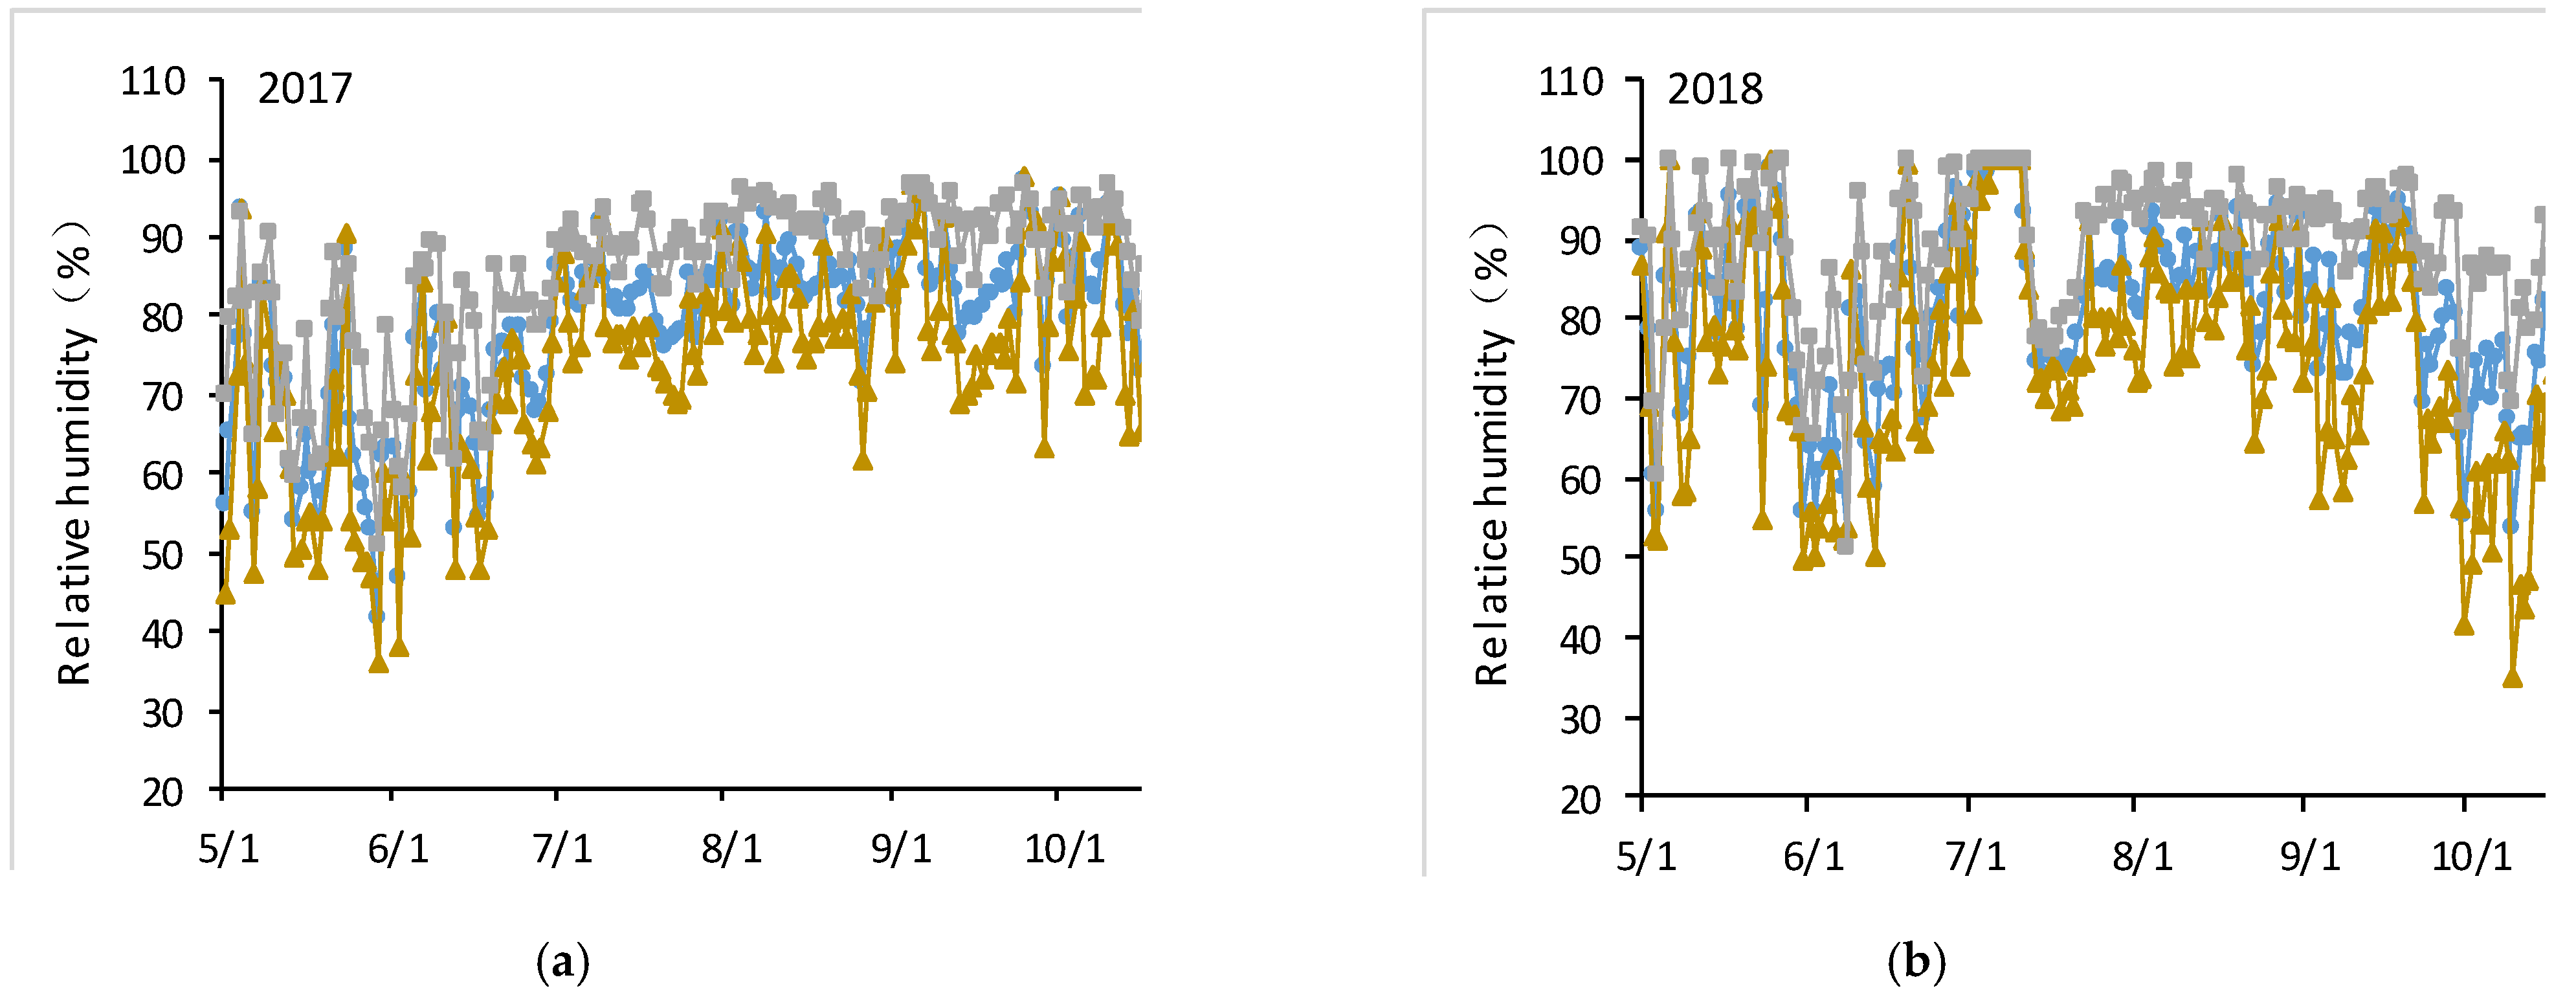
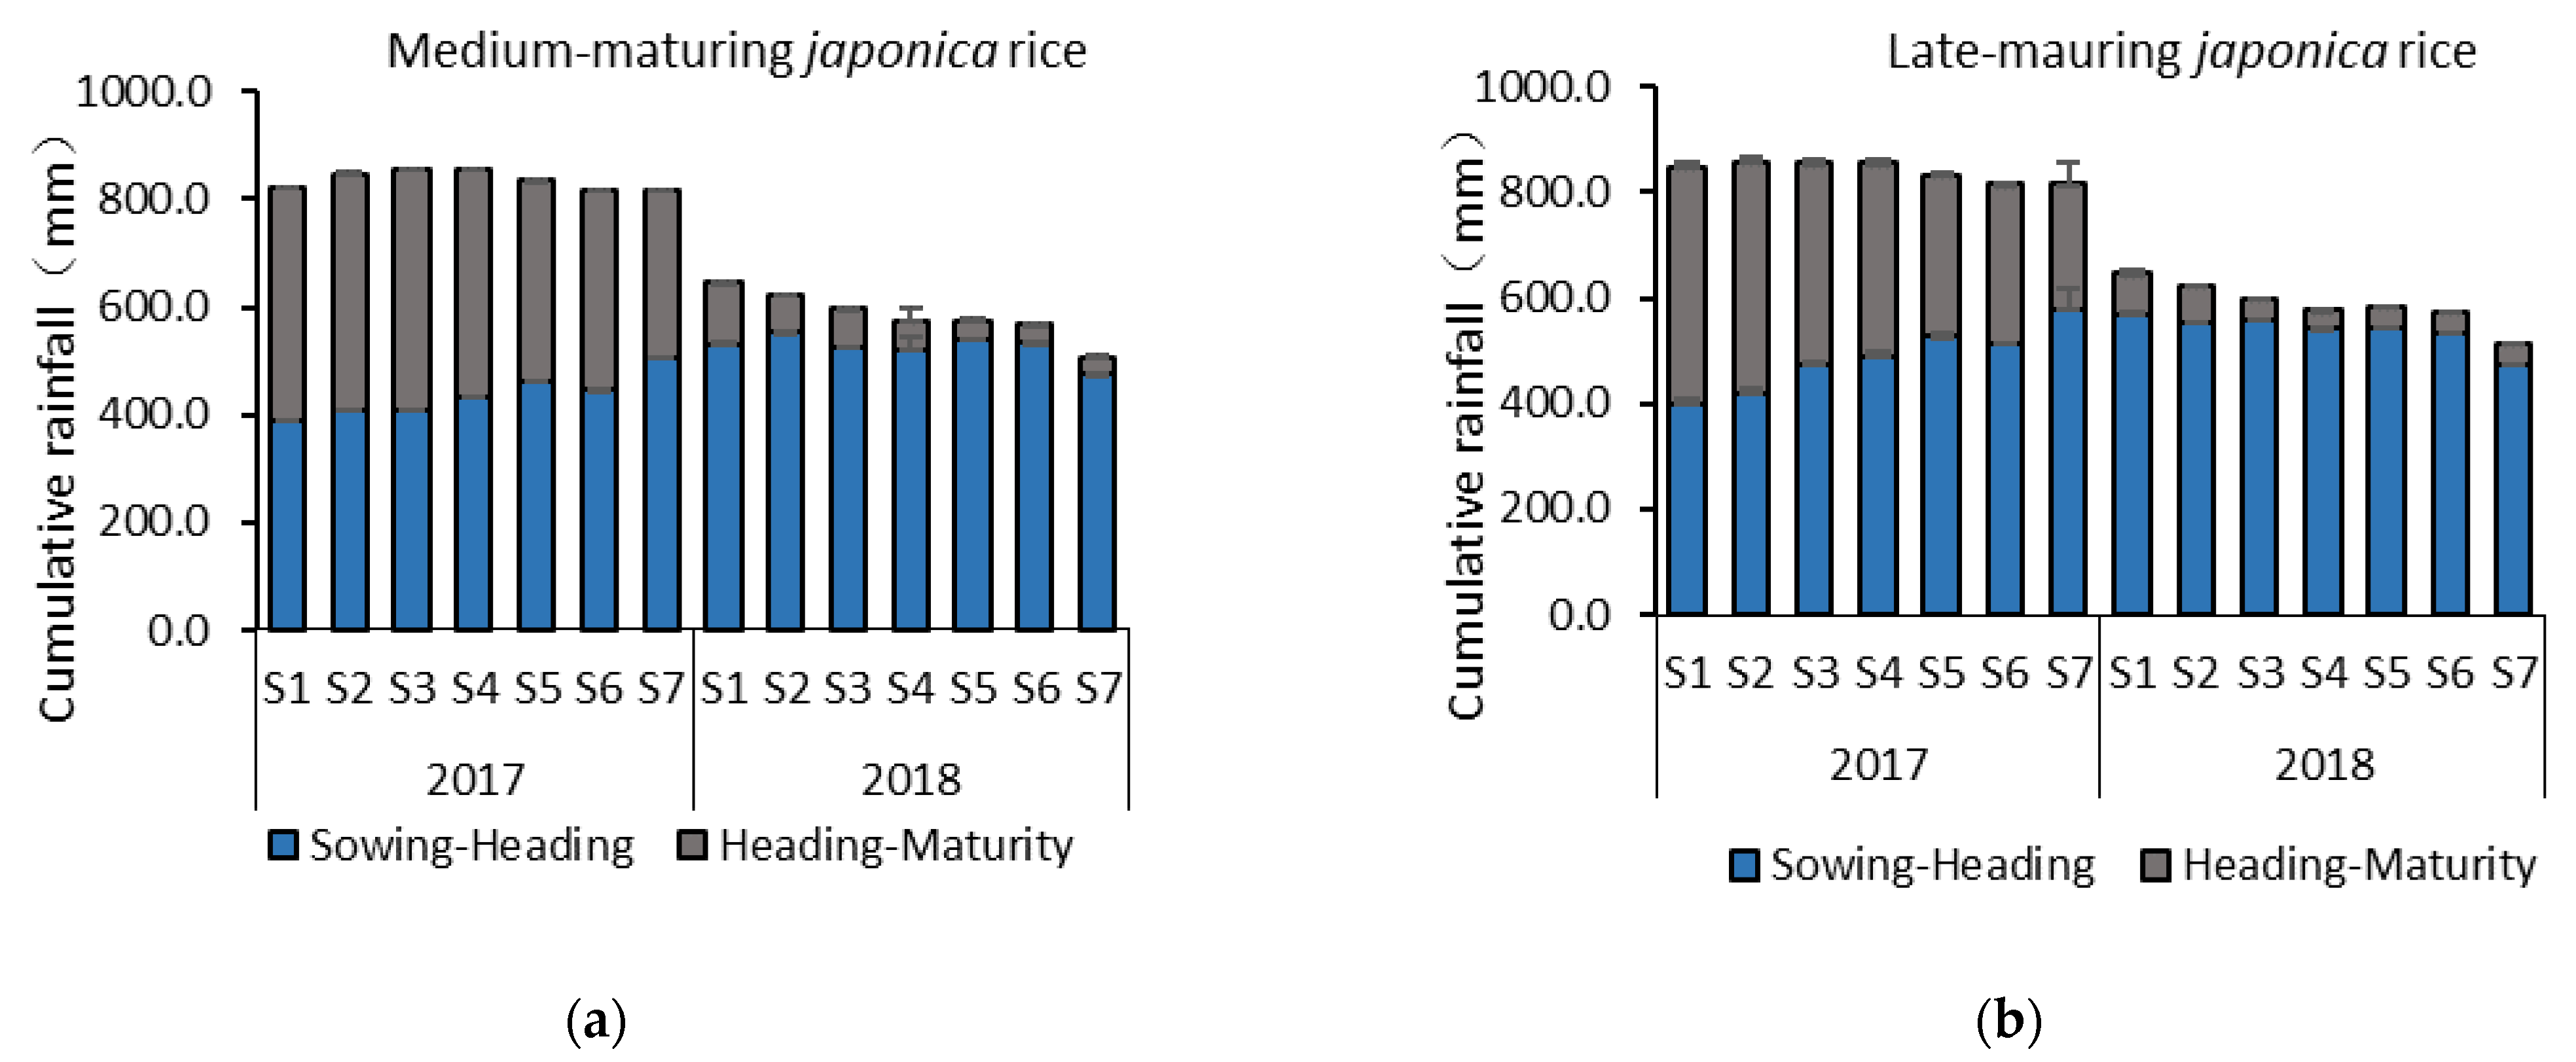
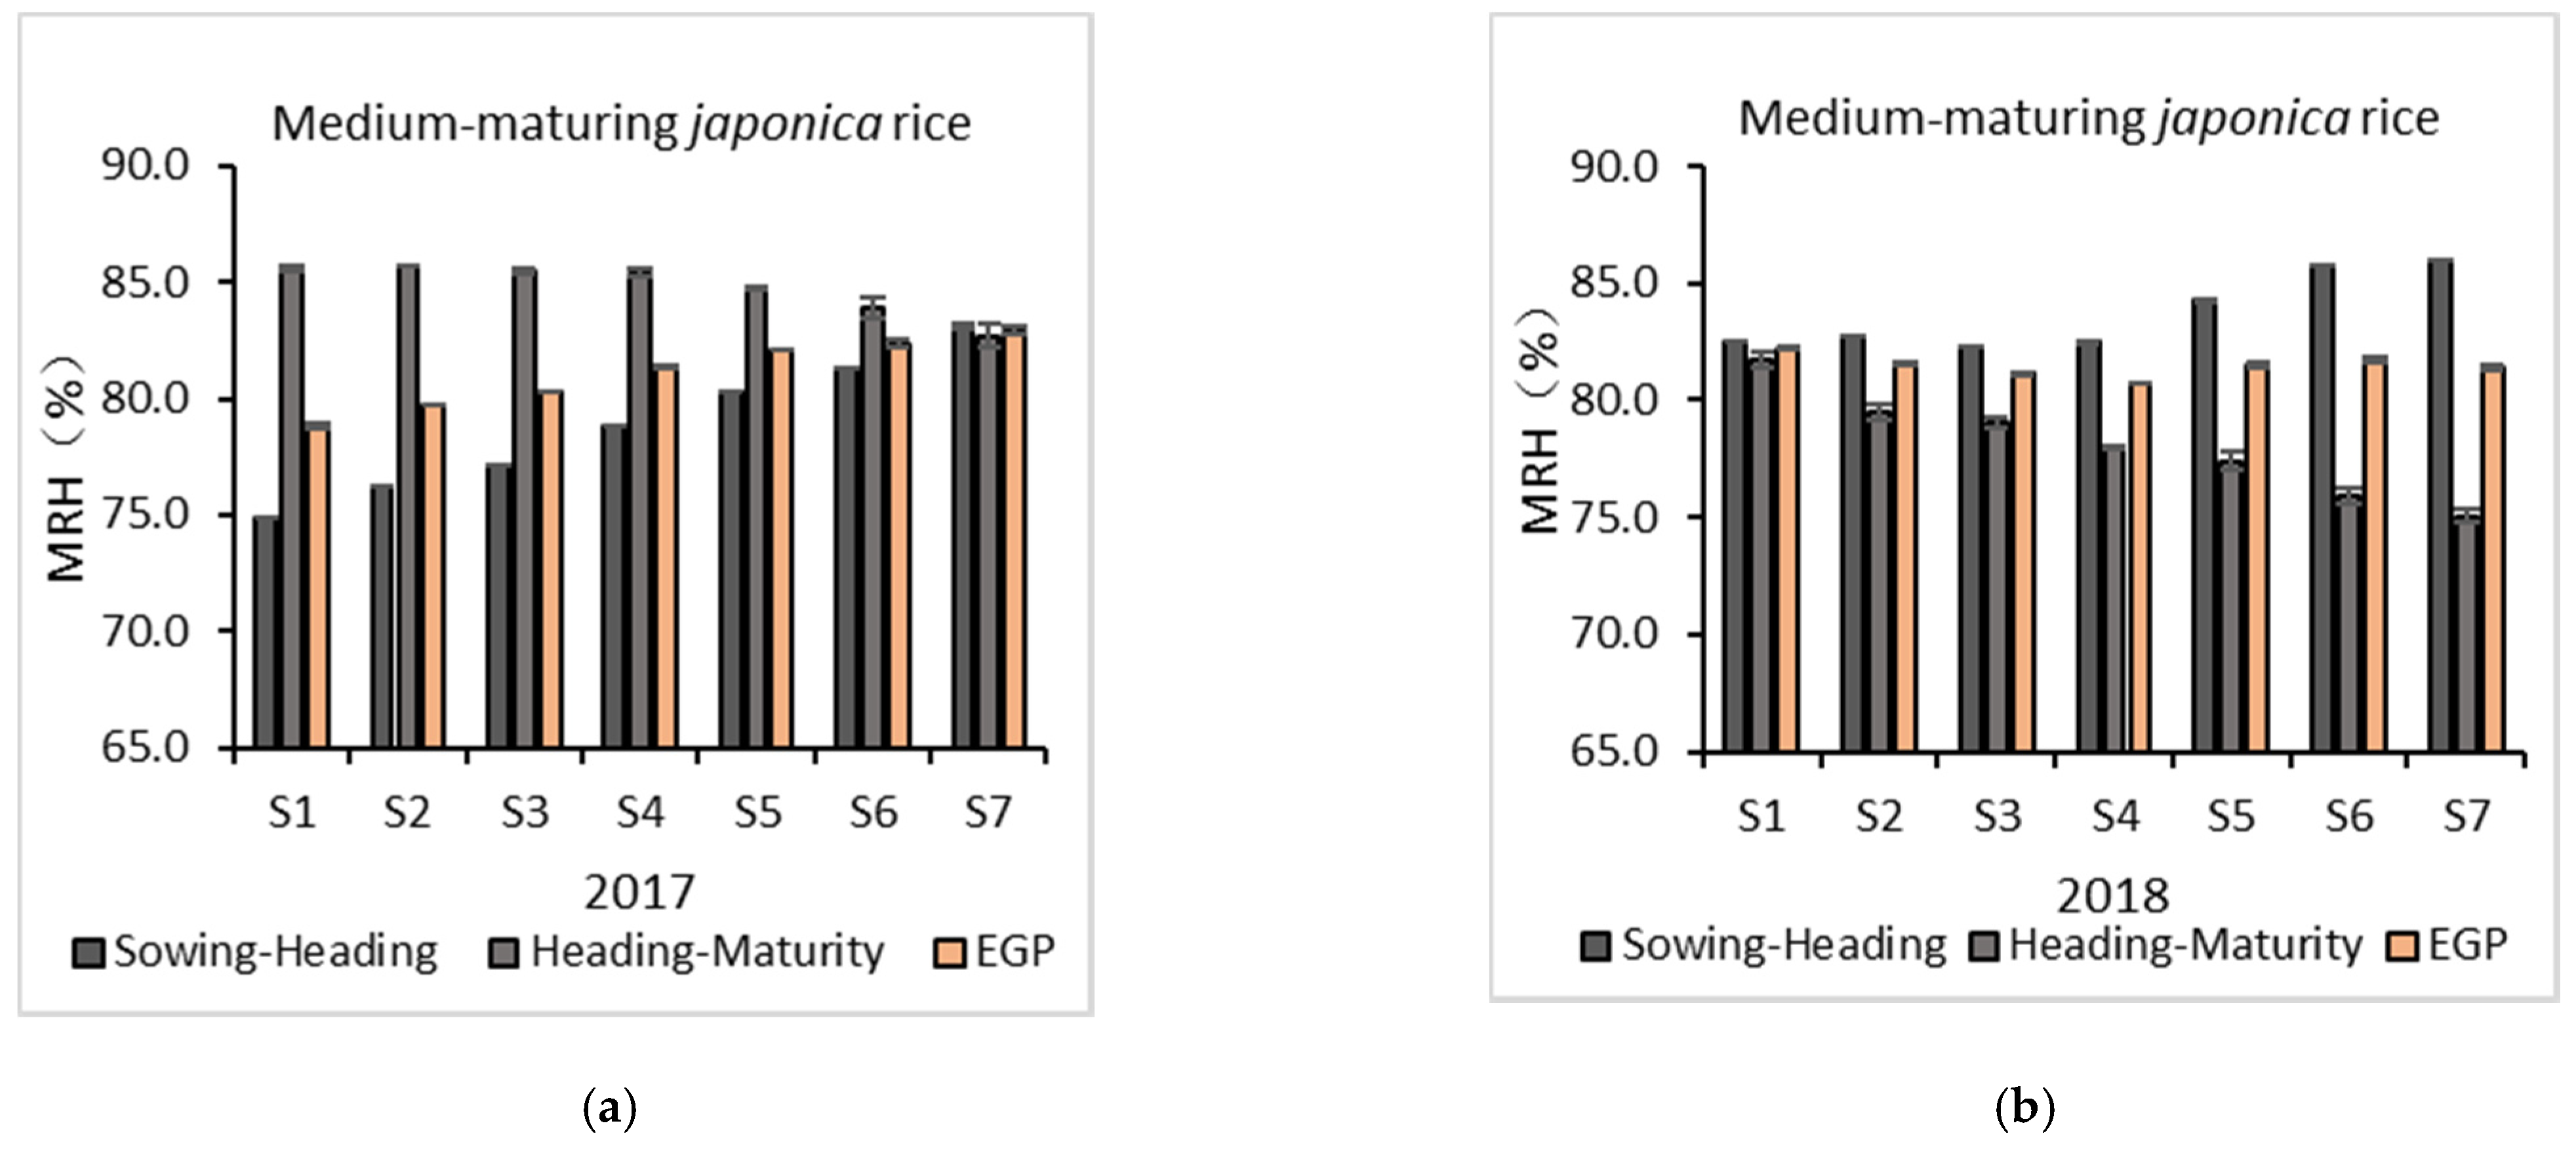
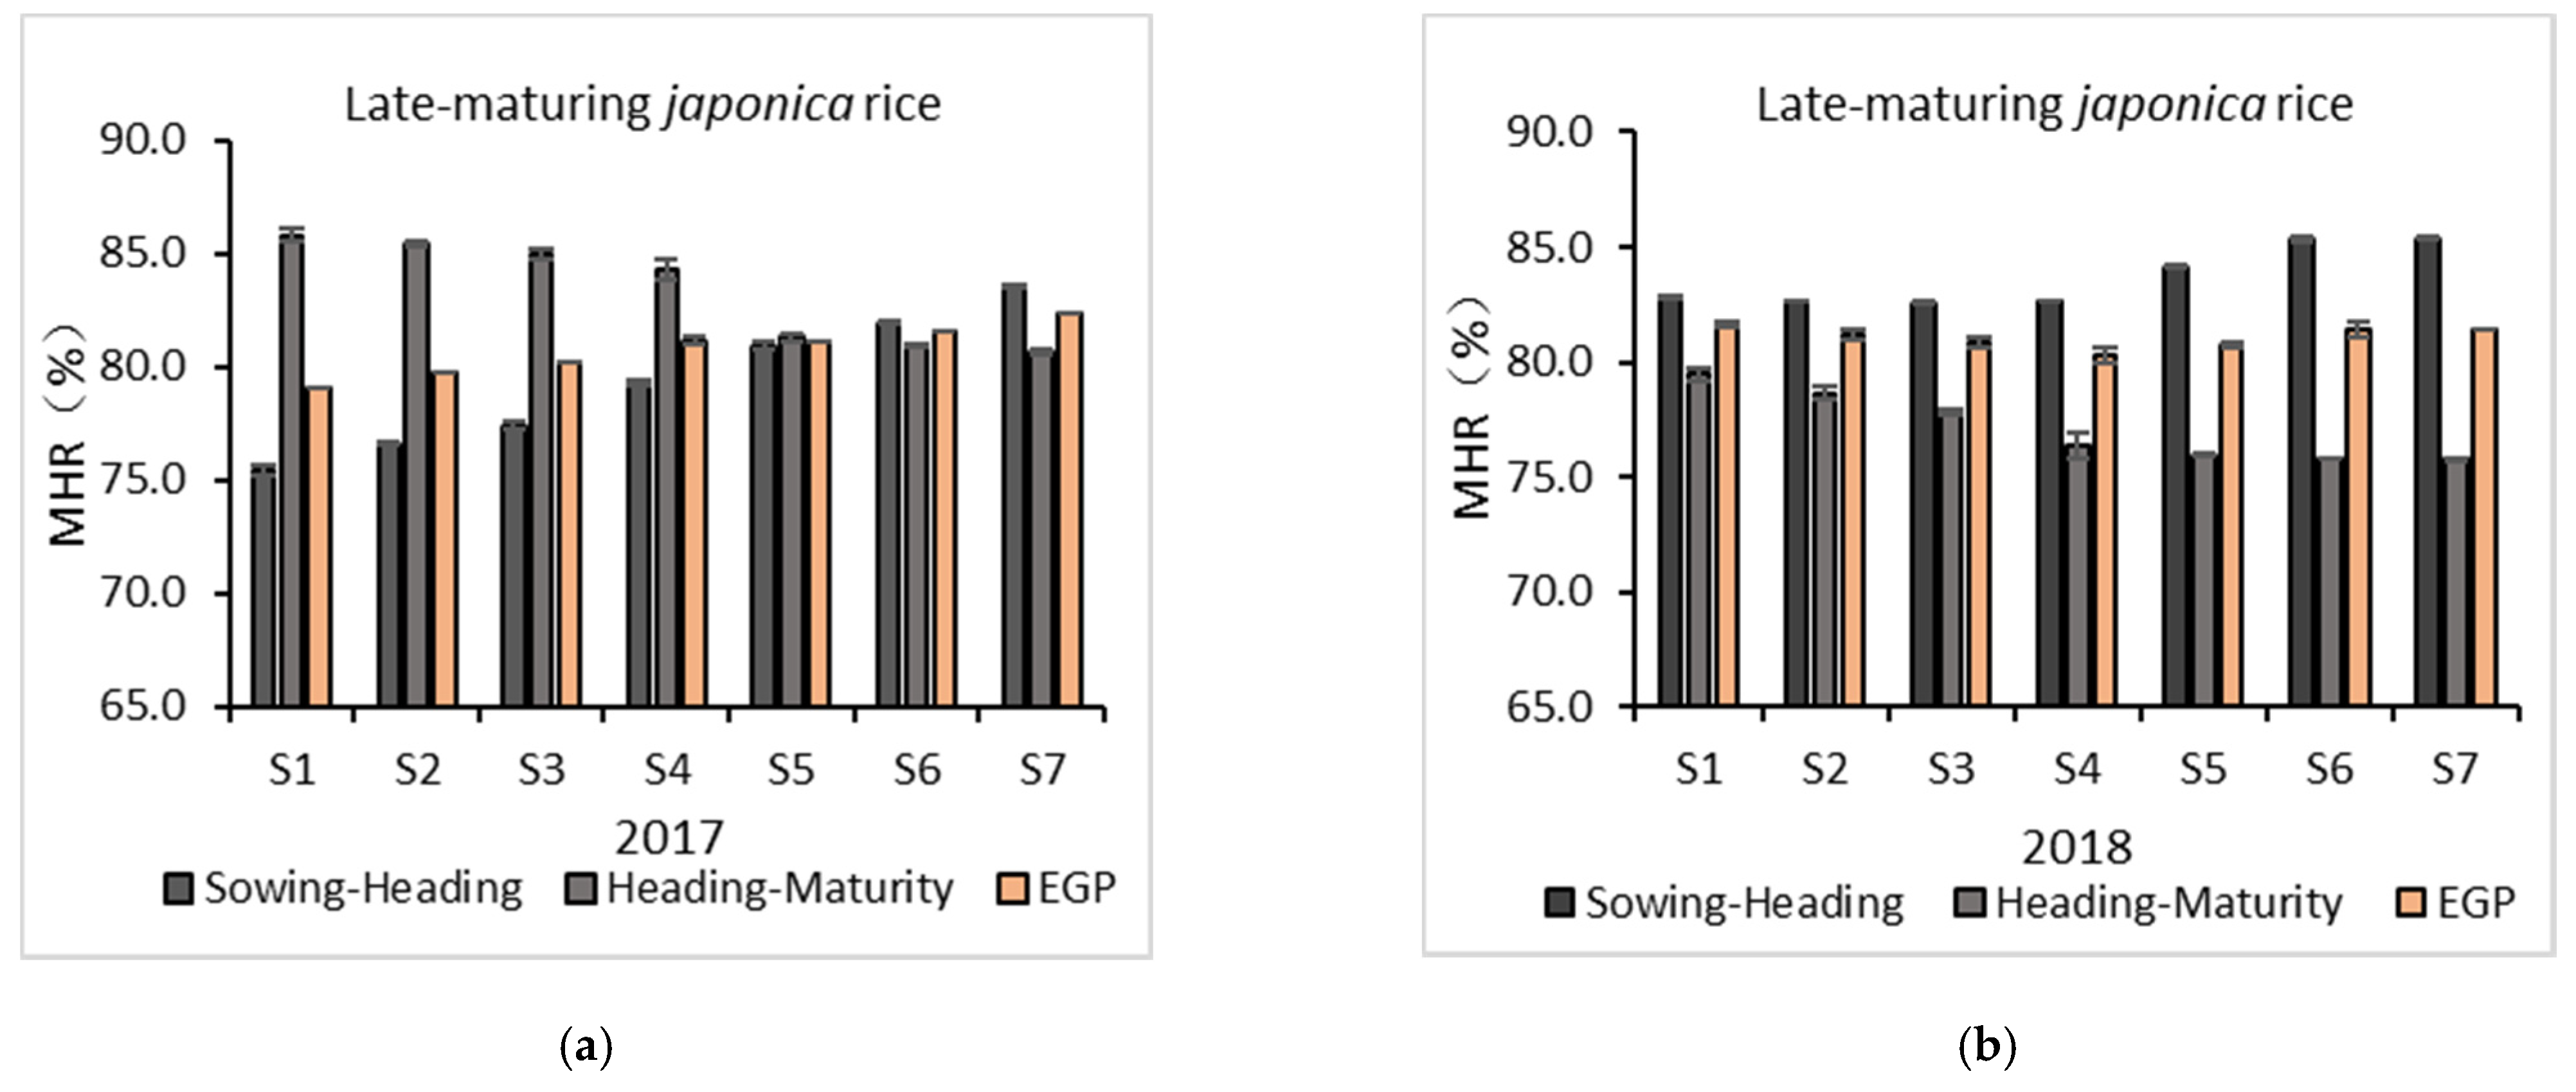
3.1.3. Rainfall and Relative Humidity

The rainfall in the growing season of rice was mainly concentrated in July and August, and the monthly rainfall were different in different years (Figure 3). Due to the differences in mean daily rainfall (MDR), the annual changes of mean relative humidity (MRH), daytime relative humidity (DH) and night relative humidity (NH) were different. The relative humidity from July to September were slightly higher than that in other months in the rice growing season (Figure 4).

3.2. Difference of Main Meteorological Indicators in Different Growth Stages of Rice

According to the variation characteristics of Tmean, Tmax, Tmin, DT, NT, MSH, Rmean, MRH, DH, NH, and MDR, we selected four meteorological indicators, Tmean, Rmean, MRH, and MDR, as the main meteorological indicators to study the differences of meteorological indicators in rice growth stages under seven sowing time treatments.
The late-maturing japonica soft rice (SLR) and late-maturing japonica non-soft rice (LR) had similar phenological periods under the same sowing time treatment. Both the SLR and LR failed to fully mature in varieties T5, T6, and T7. The harvest date (November 8) was considered the deadline for rice growth and was used to calculate the Tmean, effective accumulated temperature (EAT), Rmean, and cumulative solar radiation (CSR). In the analysis of meteorological indicators, SLR and LR were analyzed as the same growth type. The linear model demonstrated that the Tmean, EAT, Rmean, and CSR from the heading to maturity stages of medium-maturity japonica soft rice (SMR) decreased by 1.0–1.1 °C, 53.2–55.1 °C, 0.5–0.6 MJ m−2, and 16.9–24.1 MJ m−2, respectively, when the sowing date was delayed by 10 days. The Tmean, EAT, Rmean, and CSR of late-maturing japonica rice decreased by 1.1 °C, 51.0–51.8 °C, 0.1–0.9 MJ m−2, and 6.6–25.5 MJ m−2, respectively, when the sowing date was delayed by 10 days [30,31]. The data of the above were published in a study. However, rice quality includes milling quality, appearance quality, and eating quality, and different rice quality indexes have different responses to meteorological factors. The demand of meteorological indicators for forming the best eating quality of rice in this area is still not clear. In this work, we mainly studied the influence of meteorological factors on rice eating quality that consumers are most concerned about.
The rainfall in the grain filling stage of different types of rice showed a great difference between the two years, and the rainfall in 2017 was significantly higher than that in 2018 (Figure 5). In general, rainfall indicators vary greatly from year to year. The average humidity from heading to maturity varies greatly from year to year, which may be related to the different rainfall days (Figure 6 and Figure 7).

3.3. Effects of T and R on Rice Eating Quality and Physicochemical Indicators of Rice

An analysis of the comprehensive evaluation of the eating quality (CEQ) of the three types of rice showed that CEQ decreased as both T and R decreased at the heading to maturity stages (Table 2). The CEQ of SMR, SLR, and LR in T2–T7 was 2.17–23.92%, 1.27–17.66%, and 1.02–24.32% lower than in T1, respectively. Under the same T and R treatments, the CEQ of SLR and SMR were both higher than the CEQ of LR.
The amylose content (AC) in three rice varieties increased as T and R decreased (Table 3). The AC of SMR, SLR, and LR in the T2–T7 stages were 0.76–26.96%, 1.88–28.20%, and 1.45–18.76% higher than in the T1 stages, respectively. The protein content (PR) of three types of rice increased as T and R decreased, and the PR of SMR, SLR, and LR in the T2–T7 stages were 2.04–17.60%, 1.13–11.32%, and 2.27–13.83% higher than in the T1 stage, respectively.
Under the same T and R conditions, the AC of SMR was lower than that of SLR and LR. The PR of SLR was slightly lower than that of SMR and LR. Correlation analysis demonstrated that there was a significant negative correlation between the CEQ, PR, and AC of SMR, SLR, and LR (Table 4).

3.4. Effect of T and R on N Content in Rice

The methods currently used to determine the PR of foods, including the Kjeldahl and Dumas methods, depend on the determination of N. As T and R decreased, variations in the N content of the rice grain of the SMR, SLR, and LR varieties was consistent with the increasing PR observed in milled rice by the Kjeldahl method (Table 5). The analysis of rice yield and N accumulation in ears at the maturity stage demonstrated that the rice yield of SMR, SLR, and LR in the T2–T7 stages decreased by 2.15–28.35%, 2.02–33.30%, and 2.20–32.93%, respectively, compared with the T1 stage. Compared with T1, the N accumulation in the spikes of SMR and SLR in the T2–T7 stage decreased by 1.82–22.87% and 0.11–33.81%, respectively. In 2017, N accumulation in the spikes of LR in T2–T7 stages decreased by 1.66–29.08% compared with T1. In 2018, N accumulation in the spikes of T2 was the highest, and the N accumulation in the T3–T7 stages was 3.54%, 7.90%, 18.55%, 25.04%, and 28.90% lower than in the T2 stage, respectively. The primary reason for the increase in both N content and PR was that N accumulation in panicles at the maturity stage decreased less than the rice yield.

3.5. Effects of T and R on RVA of Rice

A Rapid Visco Analyzer (RVA) was used to assess the pasting properties of rice flour [36]. The characteristics of rice as determined by RVA analysis were significantly different under different T and R conditions (Table 6). The SLR, SMR, and LR rice varieties all had higher peak viscosity, trough viscosity, final viscosity, pasting temperatures, and smaller setbacks in the T1–T3 stages. Therefore, decreases in T and R from the heading stage to the maturity stage deteriorated the pasting properties of rice and decreased eating quality. The characteristic values of the RVA parameters of different types of rice differ under the same T and R conditions. Compared with the LR, the SMR and SLR with low AC have both a larger peak viscosity and a larger final viscosity, a smaller trough viscosity, and lower breakdown, setback, and consistence values.

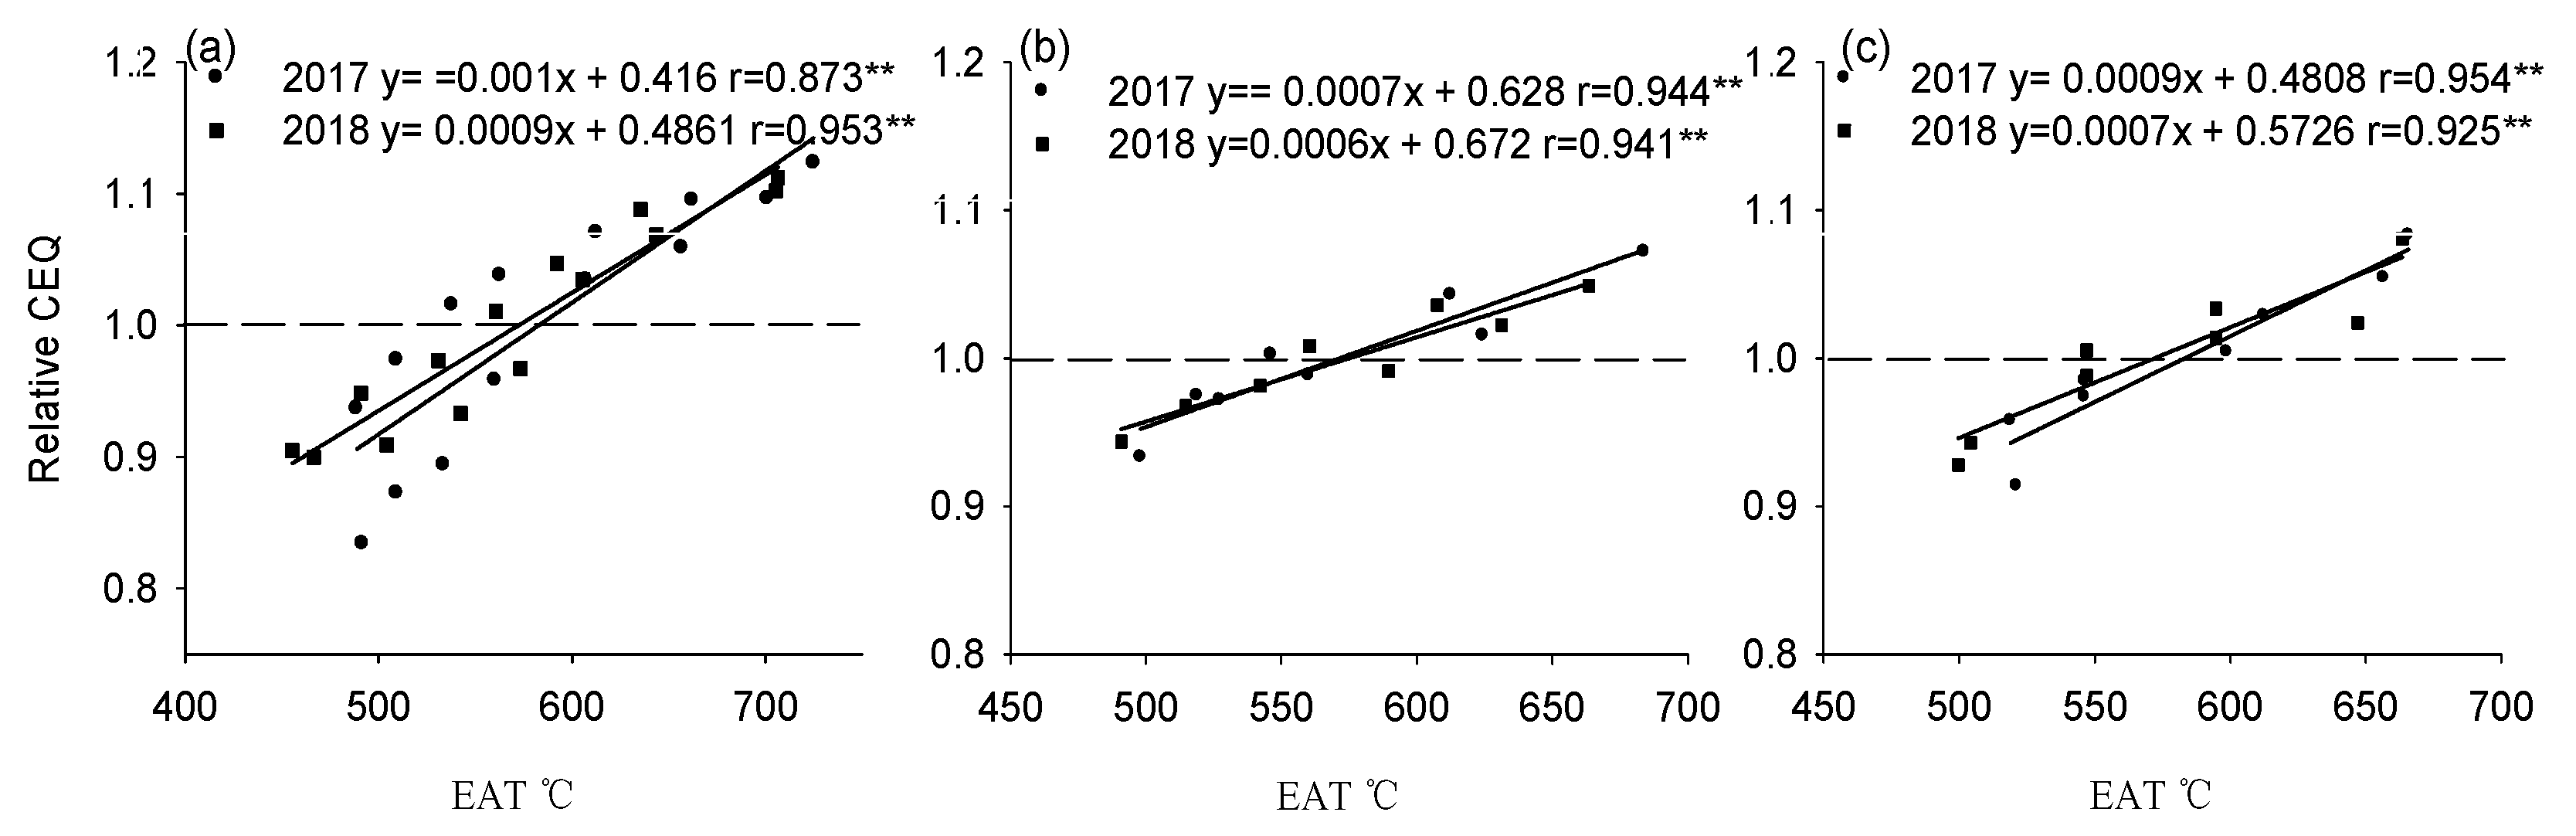
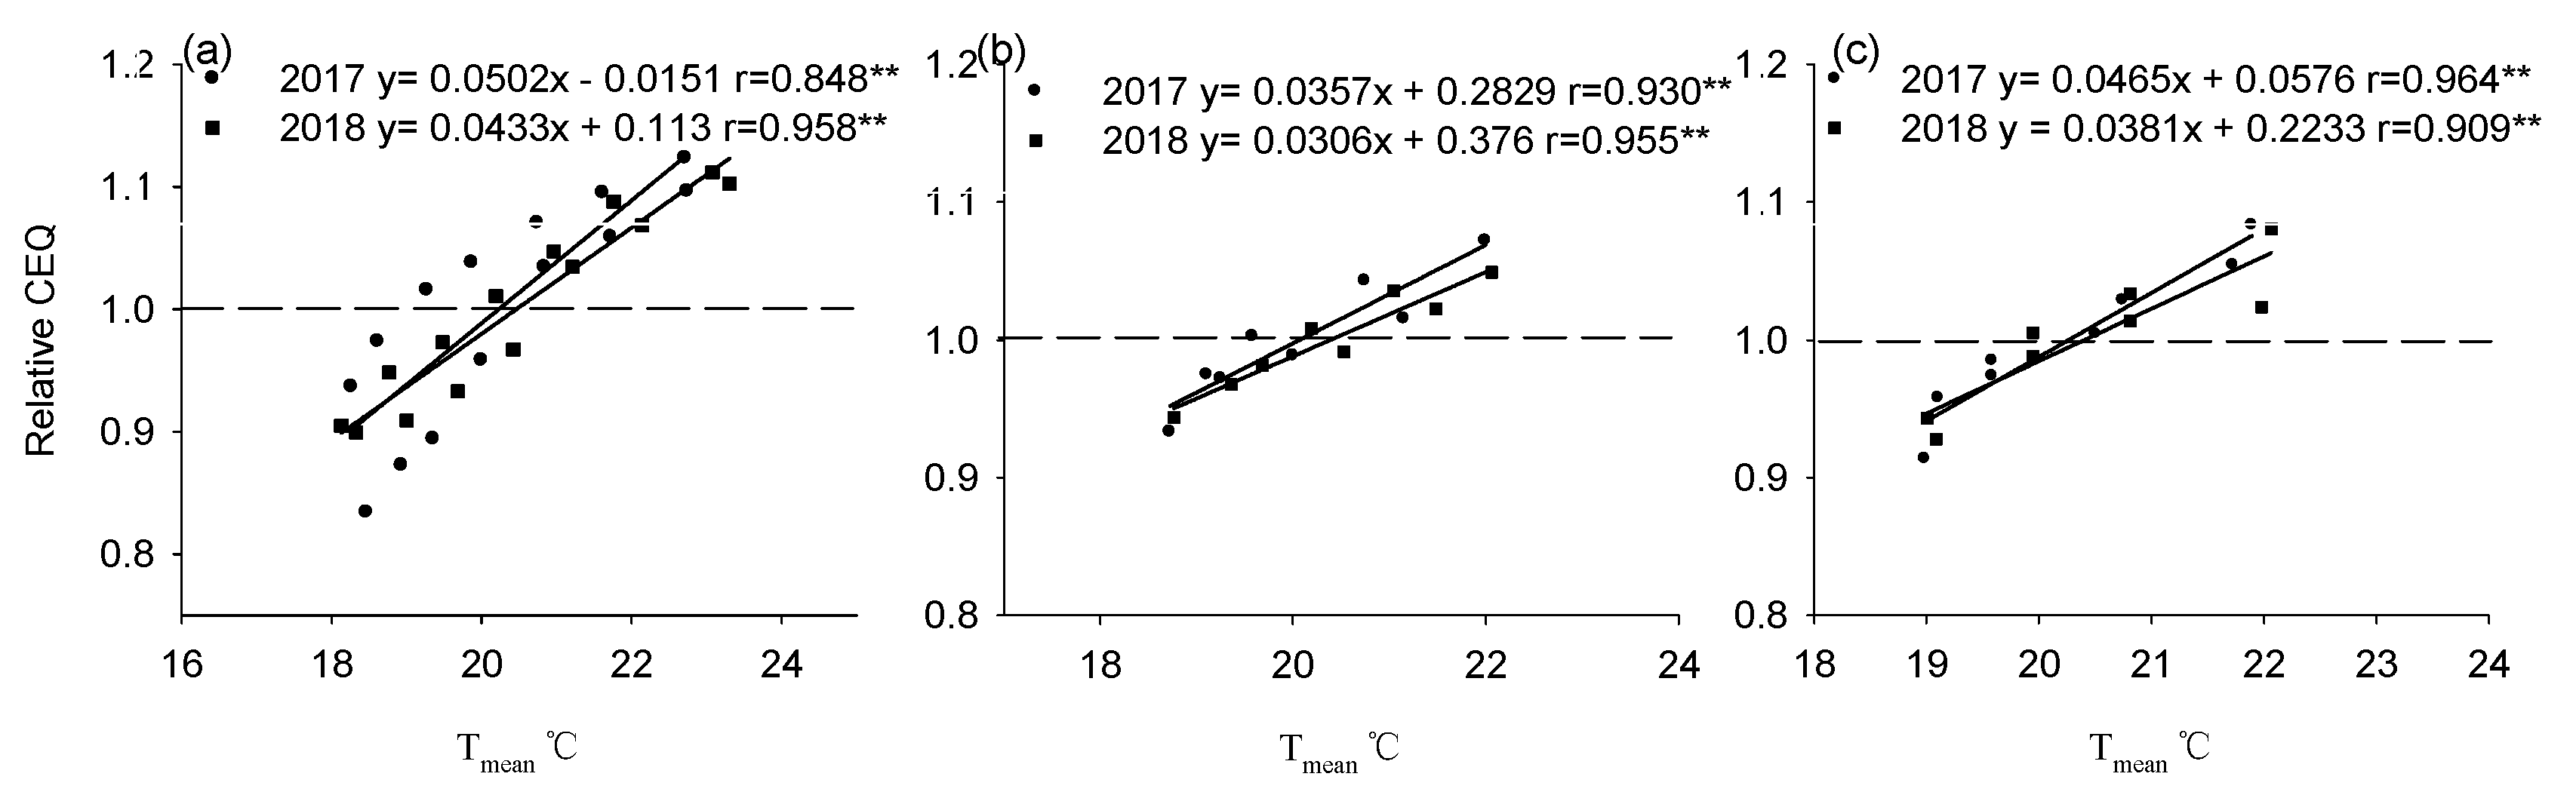
3.6. Correlation between Eating Quality and T and R from the Heading to Maturity Stages

Correlation analysis demonstrated that the CEQ of the SMR, SLR, and LR rice varieties was significantly positively correlated with the Tmean, EAT, CR, and MRH from the heading to maturity stages (Table 7). There was a significant positive correlation between CEQ and Rmean, and CSR and SMR. However, for SLR and LR, there was no significant correlation between CEQ and solar radiation. The correlation coefficient between CEQ and temperature from the heading to maturity stages of SMR, SLR, and LR rice varieties were higher than the correlation coefficients between CEQ and solar radiation, rainfall, and relative humidity. This indicates that the temperature affects the eating quality of rice more than other meteorological indictors. This region has abundant solar radiation resources and rainfall, meaning that they are not a limiting factor affecting the production of rice with good CEQ.

3.7. Temperature Characteristics and Optimal Sowing Date Range for Producing Rice with High Eating Quality

If the CEQ of rice under a certain temperature condition exceeds the average CEQ of the rice variety under fully mature treatments, then the rice is considered to have good eating quality under that temperature. Under fully mature conditions, the CEQs of SMR, SLR, and LR were significantly positively correlated with Tmean and EAT from the heading to maturity stages (Figure 8 and Figure 9). The range of Tmean and EAT for the relative CEQs of SMR, SLR, and LR from the heading to maturity stages according to the linear equation are listed in Table 8 when the relative eating value exceeds 1.0. The temperature demand from the heading to maturity stages was higher for SMR rice than for the SLR and LR varieties.
The temperature characteristics of 2011, 2014, and 2015 are different from those of other years, which have been analyzed in detail in a separate paper [31]. This indicates that the remaining seven years of T and R conditions are normal. The optimal date ranges for sowing rice to obtain relatively high yields and good eating quality are listed in Table 9. The earliest suitable sowing date for SMR, SLR, and LR rice varieties to obtain high yield and good eating quality was May 15, and the latest optimal sowing dates for SMR, SLR, and LR were June 1, May 18, and May 20, respectively.

4. Discussion

4.1. Effects of T and R on Rice Eating Quality

In this study, the CEQ of all rice varieties tested was highest in the T1 stage. Compared with T1, the appearance and viscosity of cooked rice in the T2–T7 stages worsened and hardness increased. A lower coefficient of correlation was observed between CEQ and solar radiation than between CEQ and temperature. There was a significant positive correlation between CEQ and CR, but the CR from heading to maturity of rice in 2017 was 200–350 mm more than that in 2018, and the annual difference was much greater than that in different sowing time treatments. The differences in relative humidity between years were also greater than that in different sowing time treatments. Therefore, we believe that the CR and relative humidity under sowing time treatments were not the meteorological factors limiting the increase of CEQ, and temperature was the primary environmental factor affecting the eating quality of rice in the lower reaches of the Huai river.
The eating quality of rice is affected by AC and PR [8,37,38], and the grain-filling stage is the most important period affecting the physicochemical properties of rice [16,19]. The AC of three types of rice increased as temperatures decreased in the heading to maturity stages. A significant negative correlation between the AC and CEQ of rice was observed, which was consistent with the conclusion of previous studies: that reducing amylose improved eating quality [11]. The results of the RVA analysis of rice are closely related to AC. Most varieties with good eating quality had large breakdowns and small setbacks [39]. The peak viscosity, trough viscosity, final viscosity, and pasting temperature of all three varieties decreased as temperatures decreased, while the setback and consistence increased, which was similar to the results of previous studies [23,33]. Therefore, sowing early can increase temperatures from the heading to maturity stages, reduce AC, and improve the eating quality of rice. Under the same T and R conditions, the setback and consistence values of the SMR and SLR varieties were both lower in the LR variety. Selecting varieties with low AC can improve eating quality.
Rice PR is used to measure the nutritional quality of rice [40], and is an important factor affecting the eating quality of rice [25]. Previous studies have suggested that increases in PR slow the water absorption rate of rice, reduce the amount of water absorbed, insufficiently gelatinize rice, and increase the hardness of cooked rice [41,42]. The N content of milled rice was measured using the Kjeldahl method and converted into PR. The N content of the panicle and the PR of milled rice for all rice varieties increased as Tmean decreased from the heading to maturity stages, which was not consistent with the positive correlation between PR and temperature identified by most studies [21,25]. In this study, the Tmean (17.3–21.2 °C) in T3–T7 from the heading to maturity stages was lower than the optimal temperature (21.7–26.7 °C) of the rice-filling stage [28]. Lower temperatures decreased rice yield more than that the N accumulation decreased in the panicle, which caused both the grain N content and PR in milled rice to increase. Increases in PR eventually reduced the eating quality of rice.

4.2. Temperature Characteristics and Suitable Sowing Dates to Cultivate High-Quality Rice in the Lower Reaches of the Huai River

Researchers have improved the yield and quality of rice by breeding varieties, changing cropping systems, and adjusting cultivation and management measures [15,43,44,45,46]. This study found significant differences in the eating quality of rice under different temperature conditions. Under relatively high yield conditions, the Tmean range from the heading to maturity stages of the SMR, SLR, and LR varieties that produced relatively high CEQ values were 20.2–23.3 °C, 20.2–22.1 °C, and 20.3–22.1 °C, respectively. These ranges were lower than the optimal temperatures identified by previous studies. The different temperature ranges are related to differences between the varieties used in this experiment [47], as well as the different T and R resources of the test site [16].
Winter wheat in the lower reaches of the Huai river is typically harvested from 1 to 15 June [48]. After assessing the time of harvesting and other agricultural factors, the earliest optimal sowing date for rice in this region is 16 May. The sowing date ranges for SMR, SLR, and LR under a rice-wheat double-cropping system are 16 May–1 June, 16–18 May, and 16–20 May, respectively. If SMR, SLR, and LR rice varieties are sown earlier than 15 May, there is a risk of low temperatures, and thus cold-temperature damage during the seedling period.

5. Conclusions

Temperature is the primary environmental factor affecting the eating quality of rice in the lower reaches of the Huai river. The lower temperature from the heading to maturity stage reduced the amylose content and protein content of rice, and the viscosity and hardness of cooked rice decreased; CEQ also decreased. An analysis of the different types of temperature and meteorological conditions in 2007–2016 found that the Tmean ranges from the heading to maturity stages of the SMR, SLR, and LR varieties that produced relatively high CEQ values were 20.2–23.3 °C, 20.2–22.1 °C, and 20.3–22.1 °C, respectively. The optimal date ranges for sowing the SMR, SLR, and LR varieties under a rice-wheat double-cropping system were 16 May–1 June, 16–18 May and 16–20 May, respectively. This study proposed a suitable temperature range for growing three types of rice, which will help mitigate the adverse effects of future climate change impacts on the eating quality of rice in the lower reaches of the Huai river. The suitable temperature range and sowing date identified by this study are only applicable to rice with carpet seedlings sown by mechanical transplanting; whether they are applicable to planting rice using other methods, such as direct seeding, requires additional research.

Author Contributions

Conceptualization, H.W.; methodology, H.Z.; validation, N.Z. and H.W.; formal analysis, N.Z.; investigation, N.Z.; resources, H.W.; data curation, N.Z. and Q.S.; writing—original draft preparation, N.Z.; writing—review and editing, N.Z.; supervision, H.Z.; project administration, H.W.; funding acquisition, H.W. All authors have read and agreed to the published version of the manuscript.

Funding

This research was funded by the National Key Research Program (grant number 2016YFD0300503); the National Rice Industry Technology System (grant number CARS0127); the National Natural Science Foundation of China (grant number 31971841); the Key Research Program of Jiangsu Province (grant number BE2018355); the Earmarked Fund for Jiangsu Agricultural Industry Technology System, China (grant number JATS[2020]450); and the Project Funded by the Priority Academic Program Development of Jiangsu Higher Education Institutions, China.

Institutional Review Board Statement

Not applicable.

Informed Consent Statement

Not applicable.

Data Availability Statement

The data presented in this study are openly available in [repository name e.g., FigShare] at [doi], reference number [reference number].

Acknowledgments

We fully appreciate the editors and all anonymous reviewers for their constructive comments on this manuscript.

Conflicts of Interest

The authors declare no conflict of interest. The funders had no role in the design of the study; in the collection, analyses, or interpretation of data; in the writing of the manuscript, or in the decision to publish the results.

References

  1. Nai, J.; Zhang, H.C.; Lu, J.F. Regional pattern changes of rice production in thirty years and its influencing factors in Jiangsu Province. Sci. Agric. Sin. 2012, 45, 3446–3452. [Google Scholar]
  2. Du, Y.L.; Zhang, W.J.; Wu, X.R.; Li, G.H.; Wang, S.H.; Liu, Z.H.; Tang, S.; Ding, Y.F. The characteristics of spatial and temporal change of rice yield in Jiangsu Province. J. Nanjing Agric. Univ. 2014, 37, 7–12. [Google Scholar]
  3. Xiong, J.; Chen, G.L.; Wang, S.H.; Ding, Y.F. The difference in grain yield and plant type among typical japonica varietes in different years in Jiangsu Province. J. Nanjing Agric. Univ. 2011, 34, 1–6. [Google Scholar]
  4. Zhang, H.C.; Zhang, J.; Gong, J.L.; Chang, Y.; Li, M.; Gao, H.; Dai, Q.G.; Huo, Z.Y.; Xu, K.; Wei, H.Y. The productive advantages and formation mechanisms of “Indica rice to Japonica rice”. Sci. Agric. Sin. 2013, 46, 686–704. [Google Scholar]
  5. Zhang, Z.J.; Chu, G.; Liu, L.J.; Wang, Z.Q.; Wang, X.M.; Zhang, H. Mid-season nitrogen application strategies for rice varieties differing in panicle size. Field Crops Res. 2013, 150, 9–18. [Google Scholar] [CrossRef]
  6. Xing, Z.P.; Wu, P.; Zhu, M.; Qian, H.J.; Hu, Y.J.; Guo, B.W.; Wei, H.Y.; Xu, K.; Huo, Z.Y.; Dai, Q.G.; et al. Temperature and solar radiation utilization of rice for yield formation with different mechanized planting methods in the lower reaches of the Yangtze River. China. J. Integr. Agric. 2017, 16, 1923–1935. [Google Scholar] [CrossRef] [Green Version]
  7. Yu, G.P.; Xu, C.C.; Wu, Y.W.; Xiu, X.J.; Tong, H.H. Thoughts on the supply side reform of China’s rice industry. Chin. J. Agric. Resour. Reg. Plan. 2020, 41, 53–62. [Google Scholar]
  8. Xi, M.; Ji, Y.L.; Wu, W.G.; Xu, Y.Z.; Sun, X.Y.; Zhou, Y.J. Research progress and prospects of factors affecting rice eating quality. Chin. Agric. Sci. Bull. 2020, 36, 159–164. [Google Scholar]
  9. Ishimaru, T.; Nakayama, Y.; Aoki, N.; Ohsumi, A.; Suzuki, K.; Umemoto, T.; Yoshinaga, S.; Kondo, M. High temperature and low solar radiation during ripening differentially affect the composition of milky-white grains in rice (Oryza sativa L.). Plant Prod. Sci. 2018, 21, 370–379. [Google Scholar] [CrossRef] [Green Version]
  10. Zhong, L.J.; Cheng, F.M.; Wen, X.; Sun, Z.X.; Zhang, G.P. The deterioration of eating and cooking quality caused by high temperature during grain filling in early-season indica rice cultivars. J. Agron. Crop Sci. 2005, 191, 218–225. [Google Scholar] [CrossRef]
  11. Cheng, F.M.; Ding, Y.S.; Zhu, B.Y. The formation of amylose content in rice grain and its relation with field temperature. Acta Ecol. Sin. 2000, 20, 646–652. [Google Scholar]
  12. Zhang, C.X.; Guo, B.W.; Tang, J.; Xu, F.F.; Xu, K.; Hu, Y.J.; Xing, Z.P.; Zhang, H.C.; Dai, Q.G.; Huo, Z.Y.; et al. Combined effects of low temperature and weak light at grain-filling stage on rice grain quality. Acta Agron. Sin. 2019, 45, 1208–1220. [Google Scholar]
  13. Ren, W.J.; Yang, W.Y.; Xu, J.W.; Fan, G.Q.; Ma, Z.H. Effect of low light on grains growth and quality in rice. Acta Agron. Sin. 2003, 29, 785–790. [Google Scholar]
  14. Dou, Z.; Tang, S.; Chen, W.Z.; Zhang, H.X.; Li, G.H.; Liu, Z.H.; Ding, C.Q.; Chen, L.; Wang, S.H.; Zhang, H.C.; et al. Effects of open-field warming during grain-filling stage on grain quality of two japonica rice cultivars in lower reaches of Yangtze River delta. J. Cereal Sci. 2018, 81, 118–126. [Google Scholar] [CrossRef]
  15. Bai, H.Z.; Xiao, D.P.; Zhang, H.; Tao, F.L.; Hu, Y.H. Impact of warming climate, sowing date, and cultivar shift on rice phenology across China during 1981–2010. Int. J. Biometeorol. 2019, 63, 1077–1089. [Google Scholar] [CrossRef]
  16. Li, X.K.; Wu, L.; GENG, X.; Xia, X.H.; Wang, X.H.; Xu, Z.J.; Xu, Q. Deciphering the environmental impacts on rice quality for different rice cultivated areas. Rice 2018, 11, 7. [Google Scholar] [CrossRef] [Green Version]
  17. Ferrari, S.; Pagliari, P.; Trettel, J. Optimum sowing date and genotype testing for upland rice production in Brazil. Sci. Rep. 2018, 8, 8227. [Google Scholar] [CrossRef] [Green Version]
  18. Yang, T.T.; Sun, Y.N.; Zeng, Y.H.; Huang, S.; Zhang, J.; Tan, X.M.; Zeng, Y.J.; Pan, X.H. Effect of post-anthesis warming on the grain yield and quality of double-cropped high-quality rice cultivars. J. Nucl. Agric. Sci. 2019, 33, 0583–2591. [Google Scholar]
  19. Chen, C.; Huang, J.I.; Zhu, L.Y.; Shah, F.; Nie, L.X.; Cui, K.H.; Peng, S.B. Varietal difference in the response of rice chalkiness to temperature during ripening phase across different sowing dates. Field Crops Res. 2013, 151, 85–91. [Google Scholar] [CrossRef]
  20. Xi, M.; Du, X.B.; Wu, W.G.; Kong, L.C.; Chen, J.H.; Yue, W.; Xu, Y.Z.; Zhou, Y.J. Effects of late sowing of two season crops on annual yield and resource use efficiency in rice-wheat double cropping system. Chin. J. Appl. Ecol. 2020, 31, 165–172. [Google Scholar]
  21. Wu, H.B.; Liu, D.H.; Zhong, M.; Wang, Y.Y. Research progress of climate factor on quality formation and influence mechanism in rice. Hubei Agric. Sci. 2019, 58, 13–18. [Google Scholar]
  22. Okpala, N.E.; Potcho, M.P.; An, T.; Ahator, S.D.; Duan, L.X.; Tang, X.R. Low temperature increased the biosynthesis of 2-AP, cooked rice elongation percentage and amylose content percentage in rice. J. Cereal Sci. 2020, 93, 102980. [Google Scholar] [CrossRef]
  23. Cheng, F.M.; Zhong, L.J. Variation of rice quality traits under different climate conditions and its main affected factors. Chin. J. Rice Sci. 2001, 15, 187–191. [Google Scholar]
  24. Zhang, H.D.; Huang, M.; Wei, Y.J.; Chen, J.N.; Shan, S.L.; Cao, F.B.; Chen, G.H.; Zou, Y.B. Amylose content and starch granule size in rice grains are affected by growing season. Phyton 2019, 88, 403–412. [Google Scholar] [CrossRef] [Green Version]
  25. Lu, K.; Zhao, Q.Y.; Zhou, L.H.; Zhao, C.F.; Zhanf, Y.D.; Wang, C.L. Research progress on the relationship between rice protein content and eating quality and the influence factors. Jiangsu J. Agric. Sci. 2020, 36, 1305–1311. [Google Scholar]
  26. Tang, X.R.; Yu, T.Q. Effects of temperature on rice quality and come biological and physiological properties in milking ripening period. J. Hunan Agric. Coll. 1991, 17, 1–9. [Google Scholar]
  27. Meng, X.F.; Feng, S.X.; Zeng, T.; Peng, J.; Wu, X.; Zhang, S.D.; Hu, H.D.; Zhou, L.L.; Xiong, Y.T.; Shi, B.Z.; et al. Effect of air temperature during frain filling stage on rice quality. J. Mt. Agr. Biol. 2019, 38, 8–12. [Google Scholar]
  28. Cheng, F.M.; Zhang, S.W. The dynamic change of rice quality during the grain filling stage and effects of temperature upon it. J. Zhejiang Univ. Sci. A 1999, 25, 347–350. [Google Scholar]
  29. Man, Y.; Wang, B.; Wang, J.X.; Slany, M.; Yan, H.Y.; Li, P.; El-Naggar, A.; Shaheen, S.M.; Rinklebe, J.; Feng, X.B. Use of biochar to reduce mercury accumulation in Oryza sativa L: A trial for sustainable management of historically polluted farmlands. Environ. Int. 2021, 153, 106527. [Google Scholar] [CrossRef]
  30. Zhou, N.B.; Zhang, J.; Fang, S.L.; Wei, H.Y.; Zhang, H.C. The effects of temperature and solar radiation on yield in good eating-quality rice grown in the lower reaches of the Huai River Basin. J. Integr. Agric. 2021, 7, 1762–1774. [Google Scholar] [CrossRef]
  31. Zhou, N.B.; Wei, H.Y.; Zhang, H.C. Response of milling and appearance quality of rice with good eating quality to temperature and solar radiation in lower reaches of Huai River. Agronomy 2021, 11, 77. [Google Scholar] [CrossRef]
  32. Zhu, D.W.; Zhang, H.C.; Guo, B.W.; Xu, K.; Dai, Q.G.; Wei, H.Y.; Gao, H.; Hu, Y.J.; Cui, P.Y.; Huo, Z.Y. Effects of nitrogen level on yield and quality of japonica soft super rice. J. Integr. Agric. 2017, 16, 1018–1027. [Google Scholar] [CrossRef]
  33. Hu, Y.J.; Li, L.; Tian, J.Y.; Zhang, C.X.; Wang, J.; Yu, E.W.; Xing, Z.P.; Guo, B.W.; Wei, H.Y.; Huo, Z.Y.; et al. Effects of dynamic low temperature during the grain filling stage on starch morphological structure, physicochemical properties, and eating quality of soft japonica rice. Cereal Chem. 2020, 97, 540–550. [Google Scholar] [CrossRef] [Green Version]
  34. Chen, R.S.; Ersi, K.; Yang, J.P.; Lu, S.H.; Zhao, W.Z. Validation of five global radiation models with measured daily data in China. Energy Convers. Manag. 2004, 45, 1759–1769. [Google Scholar] [CrossRef]
  35. Tu, D.B.; Jiang, Y.; Liu, M.; Zhang, L.J.; Chen, L.L.; Cai, M.L.; Ling, X.X.; Zhan, M.; Li, C.F.; Wang, J.P.; et al. Improvement and stabilization of rice production by delaying sowing date in irrigated rice system in central China. J. Sci. Food Agric. 2020, 100, 595–606. [Google Scholar] [CrossRef] [PubMed]
  36. Sui, J.M.; Li, M.; Yan, S.; Yan, C.J.; Zhang, R.; Tang, S.Z.; Lu, J.F.; Chen, Z.X.; Gu, M.H. Studies on the rice RVA profile characteristics and its correlation with the quality. Sci. Agric. Sin. 2005, 38, 657–663. [Google Scholar]
  37. Zhao, C.F.; Yue, H.L.; Huang, S.J.; Zhou, L.H.; Zhao, L.; Zhang, Y.D.; Chen, T.; Zhu, Z.; Zhao, Q.Y.; Yao, S.; et al. Eating quality and physicochemical properties in Nanjing rice varieties. Sci. Agric. Sin. 2019, 52, 909–920. [Google Scholar]
  38. Huang, F.S.; Sun, Z.X.; Hu, P.S.; Tang, S.Q. Present situations and prospects for the research on rice grain quality forming. Chin. J. Rice Sci. 1998, 12, 172–176. [Google Scholar]
  39. Asante, M.D.; Offei, S.K.; Gracen, V.; Adu-Dapaah, H.; Danquah, E.Y.; Bryant, R.; Mcclung, A. Starch physicochemical properties of rice accessions and their association with molecular markers. Starch Starke 2013, 65, 1022–1028. [Google Scholar] [CrossRef]
  40. Martin, M.; Fitzgeraid, M.A. Proteins in rice grains influence cooking properties. J. Cereal Sci. 2002, 36, 285–294. [Google Scholar] [CrossRef]
  41. Tang, Y.L.; Wang, N.; Zhang, X.; Zhang, X.; Cui, J.; Sun, Y.; Su, J.P.; Wang, S.J.; Liu, X.J.; Cui, Z.Q. Study on the main factors affecting the palatability characteristics of Japanese high quality rice. J. Tianjin Agric. Coll. 2019, 26, 20–26. [Google Scholar]
  42. Zhou, C.C.; Huang, Y.C.; Jia, B.Y.; Wang, Y.; Wang, Y.; Xu, Q.; Li, R.F.; Wang, S.; Dou, F.G. Effects of cultivar, nitrogen rate, and planting density on rice-grain quality. Agronomy 2018, 8, 246. [Google Scholar] [CrossRef] [Green Version]
  43. Bian, J.L.; Xu, F.F.; Han, C.; Qiu, S.; Ge, J.L.; Xu, J.; Zhang, H.C.; Wei, H.Y. Effects of planting methods on yield and quality of different types of japonica rice in northern Jiangsu plain, China. J. Integr. Agric. 2018, 17, 2624–2635. [Google Scholar] [CrossRef]
  44. Patindol, J.A.; Siebenmorgen, T.J.; Wang, Y.J. Impact of environmental factors on rice starch structure: A review. Starch Starke 2015, 67, 42–54. [Google Scholar] [CrossRef]
  45. Deng, N.Y.; Ling, X.X.; Sun, Y.; Zhang, C.D.; Fahad, S.; Peng, S.B.; Cui, K.H.; Nie, L.X.; Huang, J.L. Influence of temperature and solar radiation on grain yield and quality in irrigated rice system. Eur. J. Agron. 2015, 64, 37–46. [Google Scholar] [CrossRef]
  46. Hu, X.Y.; Huang, Y.; Sun, W.J.; Yu, L.F. Shifts in cultivar and planting date have regulated rice growth duration under climate warming in China since the early 1980s. Agric. For. Meteorol. 2017, 247, 34–41. [Google Scholar] [CrossRef]
  47. Sanchez, B.; Rasmussen, A.; Porter, J.R. Temperatures and the growth and development of maize and rice: A review. GCB Bioenergy 2014, 20, 408–417. [Google Scholar] [CrossRef]
  48. Ji, H.J.; Shi, G.Y. Characteristics and High-yielding cultivation techniques of super late sowing wheat in northern Jiangsu Province. Bull. Agric. Sci. Technol. 2018, 2, 178–180. [Google Scholar]
Figure 1. Daily temperature variation during the rice growing season. Tmean, The mean daily temperature; Tmax, maximum temperature; Tmin, minimum temperature; DT, day temperature; NT, night temperature. (a): 2017; (b): 2018.
Agriculture 11 00618 g001
Figure 2. Variation of mean sunshine hours during rice growing season. MSH: mean sunshine hours; Rmean: mean daily solar radiation; (a): 2017; (b): 2018.
Agriculture 11 00618 g002
Figure 3. Mean daily rainfall in the rice growing season.
Agriculture 11 00618 g003
Figure 4. Variation of relative humidity during rice growing season. MRH, mean relative humidity; DH, daytime relative humidity; NH, night relative humidity. (a): 2017; (b): 2018.
Agriculture 11 00618 g004
Figure 5. Difference of the accumulated rainfall (CR) under different sowing dates. (a): Medium-maturing japonica rice; (b): Late-maturing japonica rice.
Agriculture 11 00618 g005
Figure 6. Difference of mean relative humidity (MRH) of medium-maturing japonica rice under different sowing dates: (a) 2017; (b) 2018.
Agriculture 11 00618 g006
Figure 7. Difference of mean relative humidity (MRH) of late-maturing japonica rice under different sowing dates: (a) 2017; (b) 2018.
Agriculture 11 00618 g007
Figure 8. Correlation between relative CEQ and EAT at the stage from heading to maturity. (a): SMR, n = 14, (b): SLR n = 8, (c): LR, n = 8, (the immature treatment including T5, T6 and T7 were removed from SLR and LR). **, p < 0.01, respectively.
Agriculture 11 00618 g008
Figure 9. Correlation between relative CEQ and Tmean at the stage from heading to maturity. (a): SMR, n = 14, (b): SLR n = 8, (c): LR, n = 8. **, p < 0.01, respectively.
Agriculture 11 00618 g009
Table 1. The rice varieties and sowing dates.
TypesMaterialsSowing Date (Month/Day)
T1T2T3T4T5T6T7
medium-maturing japonica soft riceNangeng 27285/105/175/245/316/76/146/21
Nangeng 505
late-maturing japonica soft riceNangeng 9108
Fenggeng 1606
late-maturing japonica non-soft riceFenggeng 3227
Wuyungeng 80
Table 2. Influence of T and R on the eating quality of different types of rice 1.
TypeTreatmentAppearanceHardnessViscosityDegree of
Balance
CEQ
2017
SMRT16.7 a6.7 e7.4 a6.9 a71.6 a
T26.6 b6.8 de7.0 b6.7 b69.5 b
T36.2 c6.9 cd6.8 b6.4 c67.9 c
T45.6 d7.1 c6.1 c6.0 d64.4 d
T55.3 e7.3 b5.7 d5.5 e61.6 e
T64.8 f7.4 b5.4 e4.9 f59.5 f
T74.7 a7.8 a5.1 f4.6 g57.1 g
SLRT17.2 b6.3 d7.9 a7.3 a75.0 a
T26.8 b6.5 c7.6 b7.1 a73.0 b
T36.7 b6.7 b7.3 c6.7 b70.9 c
T46.7 c6.9 b6.5 d6.3 c68.5 d
T56.2 d6.9 b6.4 de6.2 c66.7 e
T65.8 e6.9 b6.2 e5.9 d65.6 e
T75.3 a7.1 a5.6 f5.3 e62.0 f
LRT15.6 a7.1 d6.4 a5.8 a64.9 a
T25.8 b7.1 c6.6 b5.9 b66.0 b
T34.9 c7.4 c5.4 c4.9 c59.5 c
T45.6 d7.3 b5.8 d5.3 d62.6 d
T54.2 e7.6 b4.5 e4.2 d54.9 e
T64.7 f7.4 a5.4 e4.9 e59.3 f
T73.7 g7.9 a4.1 f3.4 f51.5 g
2018
SMRT17.6 a6.3 e8.0 a7.6 a76.3 a
T27.3 b6.6 d7.9 b7.3 b74.3 b
T36.9 c6.9 c7.6 c6.9 c71.8 c
T46.3 d7.1 b7.1 d6.3 d68.2 d
T55.9 e7.2 b6.5 e5.9 e65.7 e
T65.7 f7.2 b6.1 f5.7 f64.0 ef
T75.3 g7.5 a6.0 f5.3 g62.2 f
SLRT17.8 a6.0 e8.1 a7.9 a78.0 a
T27.5 b6.2 d7.9 a7.6 b76.3 ab
T37.3 c6.3 cd7.7 b7.4 c74.9 b
T46.8 d6.3 cd7.1 c7.0 d72.0 c
T56.6 e6.5 bc6.7 d6.8 e69.5 d
T66.2 f6.6 b6.2 e6.2 f67.1 e
T76.0 g6.9 a6.0 f5.8 g65.3 f
LRT16.3 a6.8 d7.1 a6.5 a69.2 a
T26.0 b6.8 cd6.6 b6.1 b67.3 b
T35.8 c7.0 bc6.4 c5.6 c65.5 c
T45.5 d7.0 b5.8 d5.6 c61.5 d
T54.6 e7.5 a5.5 e4.9 d58.8 e
T64.6 e7.6 a5.0 f4.4 e57.2 f
T74.3 f7.7 a4.5 g4.3 e54.8 g
Year (Y)**********
Type (T)**********
Sowing date (S)**********
Y × T**********
Y × S********ns
T × S*********
Y × T × S********ns
1 SMR: medium-maturing japonica soft varieties, SLR: late-maturing japonica soft varieties, LR: late-maturing japonica non-soft rice varieties, CEQ: comprehensive evaluation of eating quality. Different letters indicate statistical significance at the p = 0.05 level within the same column. ns: not significant at the p = 0.05 level. * Significant at the p = 0.05 level. ** Significant at the p = 0.01 level.
Table 3. Effect of T and R on AC and PR in rice 1.
TypeTreatmentAC (%) PR (%)
2017201820172018
SMRT17.96 d8.31 c7.36 d7.22 e
T28.02 d8.45 c7.51 d7.41 e
T38.57 c8.43 c7.84 cd7.63 d
T48.70 c8.92 b8.11 bc7.81 cd
T59.38 b9.15 b8.31 abc7.96 c
T610.05 a9.19 b8.44 ab8.28 b
T710.11 a9.54 a8.61 a8.49 a
SLRT19.72 e8.97 c6.81 d6.80 c
T210.15 d9.14 c7.00 cd6.88 c
T310.61 c9.38 c7.15 bc6.92 c
T411.19 b10.32 b7.28 abc7.18 b
T511.53 ab11.18 a7.42 ab7.26 b
T611.79 a11.37 a7.53 a7.49 a
T711.90 a11.50 a7.58 a7.50 a
LRT115.49 e14.49 e6.91 d6.82 e
T215.71 e15.21 d7.13 c6.97 d
T316.13 d15.69 c7.19 bc7.10 d
T416.21 d15.82 c7.26 bc7.37 c
T516.81 c15.89 c7.38 b7.57 b
T617.25 b16.46 b7.58 a7.70 ab
T717.73 a17.21 a7.75 a7.76 a
Year (Y)** **
Type (T)** **
Sowing date (S)** **
Y×T** ns
Y×Sns ns
T×S** ns
Y×T×S** ns
1 AC: amylose content, PR: protein content. Different letters indicate statistical significance at the p = 0.05 level within the same column. ns: Not significant at the p = 0.05 level. ** Significant at the p = 0.01 level.
Table 4. Correlation of the CEQ with AC and PR 1.
Quality TraitSMRSLRLR
PRACPRACPRAC
CEQ−0.908 **−0.653 **−0.925 **−0.965 **−0.848 **−0.900 **
1. ** Significant at the p = 0.01 level. r0.01 = 0.478.
Table 5. Effects of T and R on rice yield and N accumulation of different types of rice 1.
TypeTreatmentYield (t ha−1)N Accumulation in Rice Grain (kg ha−1)N content in Rice Grain (%)
201720182017201820172018
SMRT19.92 a10.05 a132.51 a132.29 a1.26 d1.24 d
T29.71 ab9.82 ab129.84 ab129.89 a1.26 d1.25 d
T39.37 bc9.51 bc126.22 ab125.98 ab1.26 d1.28 c
T49.10 c9.20 c124.90 b124.60 ab1.28 cd1.29 bc
T58.32 d8.49 d113.65 c114.96 bc1.30 c1.29 bc
T67.62 e7.87 e107.49 cd107.83 cd1.34 b1.31 b
T77.11 e7.27 f102.64 d102.04 d1.37 a1.35 a
SLRT110.23 a10.47 a124.66 a125.57 a1.13 d1.13 d
T210.02 ab10.16 ab124.53 a124.79 a1.14 cd1.14 d
T39.54 b9.66 bc118.29 ab119.58 a1.15 c1.15 cd
T48.97 c9.10 c113.48 b115.29 a1.19 b1.18 bc
T58.20 d8.25 d101.07 c101.08 b1.20 b1.19 b
T67.47 e7.58 de91.88 cd94.28 bc1.21 a1.21 ab
T76.83 f6.98 e82.51 d86.95 c1.22 a1.23 a
LRT110.38 a10.38 a130.37 a130.50 a1.14 d1.14 d
T210.05 ab10.15 a128.20 a131.23 a1.14 cd1.14 d
T39.56 b9.70 b124.07 ab126.59 ab1.15 cd1.16 c
T48.99 c9.10 c117.03 b120.86 b1.16 c1.18 c
T58.04 d8.18 d105.17 c106.89 c1.20 b1.20 b
T67.48 e7.58 e99.11 cd98.37 d1.22 ab1.22 a
T76.97 e6.96 f92.46 d93.30 d1.24 a1.23 a
Year (Y)*nsns
Type (T)ns****
Sowing date (S)******
Y × Tnsnsns
Y × Snsnsns
T × Snsns**
Y × T × Snsnsns
1. Different letters indicate statistical significance at the p = 0.05 level within the same column. ns: Not significant at the p = 0.05 level. * Significant at the p = 0.05 level, ** Significant at the p = 0.01 level.
Table 6. Influence of T and R on RVA parameters of different types of rice 1.
TypeTreatmentPeak Viscosity (cP)Trough Viscosity (cP)Breakdown (cP)Final Viscosity (cP)Setback (cP)Consistence (cP)Peak Time (min)Pastingte Temperature (°C)
2017
SMRT13012 a1060 ab1620 a1951 a−1392 b560 a5.19 c81.30 a
T23075 a1137 a1716 a1938 a−1359 b579 a5.23 bc80.90 ab
T32692 b1063 ab1634 a1629 b−1058 a571 a5.32 abc81.23 a
T42666 b1092 ab1645 a1574 b−1021 a553 a5.36 abc80.46 bc
T52611 b1077 ab1657 a1534 b−954 a580 a5.38 abc80.34 bc
T62626 b1054 ab1625 a1573 b−1002 a571 a5.45 ab80.18 bc
T72549 b1024 b1613 a1525 b−936 a589 a5.50 a79.76 c
SLRT12759 a1470 a2067 a1289 a−692 c597 cd6.05 abc72.24 b
T22525 b1345 abc1939 ab1180 cd−585 b595 cd6.12 ab71.20 bc
T32606 b1379 ab2040 ab1227 ab−566 b662 ab6.03 abc71.81 b
T42567 b1407 ab1995 ab1160 ab−572 b588 d6.12 ab71.58 b
T52505 b1300 bcd1932 ab1206 bcd−573 b632 bc6.12 a70.43 c
T62365 c1211 cd1892 ab1154 abc−473 a681 a5.97 c78.34 a
T72297 c1171 d1878 b1127 cd−420 a707 a6.00 bc78.91 a
LRT12699 a1612 a2693 a1087 d−6 e1081 bc6.20 ab72.19 bc
T22652 a1584 a2665 a1068 a13 e1081 bc6.20 ab72.63 bc
T32695 a1612 a2712 a1083 a17 de1101 ab6.13 b71.40 c
T42699 a1625 a2739 a1074 a40 cd1114 ab6.13 b71.41 c
T52537 a1524 a2598 a1013 b61 c1074 bc6.18 ab73.01 b
T62572 a1654 a2664 a919 d92 b1010 cd6.28 a73.00 b
T72391 a1417 a2549 a974 c158 a1132 a6.08 b79.53 a
2018
SMRT13234 a1256 a1783 a1977 a−1451 d526 ab5.07 b82.21 a
T23137 a1248 a1755 a1889 a−1382 d507 bc5.08 b82.11 a
T32806 b1201 b1691 b1605 b−1115 c490 cd5.28 a80.94 b
T42780 b1188 b1704 b1592 b−1076 bc517 ab5.27 a80.54 bc
T52656 c1154 cd1679 b1502 bc−977 ab525 ab5.35 a79.94 cd
T62633 c1098 d1606 c1535 bc−1027 abc508 bc5.27 a79.71 d
T72574 c1114 d1645 d1460 c−929 a531 a5.38 a79.35 d
SLRT12822 a1478 a2074 a1344 a−748 c596 d5.83 c72.40 a
T22555 c1309 b1889 de1247 b−666 b581 d5.88 c70.80 c
T32616 b1401 cd2022 b1216 bc−594 b622 c6.02 a70.36 c
T42525 c1336 cd1930 cd1188 bcd−595 b594 d5.93 bc71.43 b
T52425 d1276 d1970 c1149 cde−455 a694 a5.95 ab69.43 d
T62314 e1178 e1851 e1136 de−463 a673 b5.92 bc69.43 d
T72300 e1205 e1894 d1095 e−407 a688 ab6.00 a69.23 d
LRT12816 a1579 ab2542 a1237 a−274 e963 b6.10 bc73.40 a
T22703 b1554 b2552 ab1149 b−151 d998 b6.10 bc71.98 b
T32677 b1639 a2631 b1038 c−46 c992 b6.22 a72.99 a
T42524 c1527 b2593 b997 c70 b1067 a6.15 b71.79 b
T52322 d1351 c2421 c971 cd98 b1070 a6.02 d71.06 c
T62310 d1401 c2479 d910 de169 a1078 a6.07 cd70.81 c
T72229 e1336 c2414 d892 e186 a1078 a6.07 bc70.84 c
Year (Y)nsns*ns********
Type (T)****************
Sowing date (S)****************
Y × T******nsns**ns**
Y × S***ns**********
T × S***************
Y × T × Snsnsnsns********
1. Different letters indicate statistical significance at the p = 0.05 level within the same column. ns: Not significant at the p = 0.05 level. * Significant at the p = 0.05 level, ** Significant at the p = 0.01 level.
Table 7. Correlation between CEQ and meteorological indicators 1.
Type20172018
TmeanEATRmeanCSRCRMRHTmeanEATRmeanCSRCRMRH
SMR0.848 **0.873 **0.663 **0.602 *0.818 **0.737 **0.958 **0.953 **0.920 **0.878 **0.873 **0.937 **
SLR0.935 **0.963 **0.317−0.1180.937 **0.895 **0.964 **0.967 **0.957 **0.716 **0.733 **0.929 **
LR0.978 **0.974 **0.458−0.0930.938 **0.924 **0.963 **0.959 **0.947 **0.696 **0.777 **0.944 **
1 * Significant at the p = 0.05 level. ** Significant at the p = 0.01 level. SMR: r0.01 = 0.661; r0.05 = 0.533, SLR and LR: r0.01 = 0.478; r0.05 = 0.374.
Table 8. Characteristics of temperature in the grain filling stage for good eating quality rice (°C).
TemperatureSMRSLRLR
EAT
Yield580.6 (±4.2)–724.9 (±13.2)574.7 (±2.0)–673.8 (±14.4)575.7 (±0.6)–673.8 (±14.4)
CEQ577.7 (±7.6)–715.6 (±13.2)572.7 (±2.5)–673.8 (±14.4)579.1 (±5.7)–664.8 (±1.6)
Tmean
Yield20.4 (±0.2)–23.0 (±0.4)20.3 (±0.1)–22.1 (±0.1)20.3 (±0.1)–22.1 (±0.1)
CEQ20.4 (±0.2)–23.0 (±0.4)20.3 (±0.2)–22.1 (±0.1)22.0 (±0.1)–22.0 (±0.1)
Table 9. The range of suitable sowing dates over the years was deduced according to the requirement of EAT in the grain filling stage for rice to obtain good eating quality 1.
YieldESDSMRSLRLR
LSDLSDLSD
201720182017201820172018
20075/105/296/15/215/215/205/22
20085/155/306/15/205/225/205/22
20094/286/16/25/205/225/195/24
20105/146/46/65/225/245/225/25
20115/235/265/28----
20124/185/306/15/185/205/185/21
20134/276/46/55/235/245/235/25
20145/65/195/215/65/8-5/8
20154/235/175/205/35/55/15/6
20164/265/316/25/165/185/165/20
1 ESD: earliest suitable sowing date; LSD: latest suitable sowing date.
Publisher’s Note: MDPI stays neutral with regard to jurisdictional claims in published maps and institutional affiliations.

