Article

Evolution in Configuration and Productivity of New Zealand Hill Country Sheep and Beef Cattle Systems

by
Januarius Gobilik
1,*,
Stephen Todd Morris
2 and
Cory Matthew
2
1
Faculty of Sustainable Agriculture, Universiti Malaysia Sabah, Locked Bag 3, 90509 Sandakan, Sabah, Malaysia
2
School of Agriculture and Environment, Massey University PN433, Private Bag 11 222, Palmerston North 4442, New Zealand
*
Author to whom correspondence should be addressed.
Agriculture 2021, 11(6), 531; https://doi.org/10.3390/agriculture11060531
Submission received: 18 May 2021 / Revised: 3 June 2021 / Accepted: 5 June 2021 / Published: 8 June 2021
(This article belongs to the Section Farm Animal Production)

Abstract

:
Metabolic energy budgeting (MEB) was used to evaluate evolution over 30 years (1980–1981 to 2010–2011) in New Zealand southern North Island ‘hill country’ sheep and beef cattle systems. MEB calculates energy required by animals for body weight maintenance, weight gain or loss, pregnancy, and lactation to estimate the system feed demand and thereby provide a basis for calculating feed conversion efficiency. Historic production systems were reconstructed and modeled using averaged data from industry surveys and data from owners’ diaries of three case-study farms and reviewed for patterns of change over time. The modeling indicated that pasture productivity was 11% lower and herbage harvested was 14% lower in 2010–2011 than in the early 1980s. This productivity decline is attributable to warmer, drier summer weather in recent years. However, primarily through increased lambing percentage, feed conversion efficiency based on industry data improved over the study period from 25 to 19 kg feed consumed per kg lamb weaned, while meat production rose from 137 to 147 kg per ha per year. Similar improvements were observed for the three case farms. The New Zealand MEB model was found effective for analysis of tropical beef production systems in Sabah, Malaysia.

Graphical Abstract

1. Introduction

A primary aim of this study was to understand key details of how system configurations of pastoral production systems utilizing hill land grazed by sheep and beef cattle in New Zealand’s southern North Island have evolved over the last 30 years. This information will provide a basis for pastoral farm managers internationally to evaluate and compare the configuration, productivity, and ecological or environmental sustainability status of their own systems with those described here. In New Zealand, the hill land pastoral systems are locally referred to as ‘hill country farms’, but they share many of the characteristics of rangeland and differ from the intensive pastoral systems of the river plains and terraces for which New Zealand is well known. They face slope-imposed limitations, including a lower soil fertility status than intensively managed farms on flatter land and slope-induced drought arising from loss of precipitation to surface run-off before it can infiltrate into the soil for use by plants. As a result, the majority of land in these hill grazing systems is typically never cultivated and since establishment by European settlers over a century ago has developed permanent, specialized, locally adapted plant communities comprising different combinations of European and New Zealand native grasses, forbs, and legumes [1]. These plant communities are adapted to grazing but are spatially variable in species composition, reflecting factors such as aspect-related differences in diurnal temperature, spatial variability in animal dung and urine return, and variation in soil properties linked to topographic factors.
Metabolic energy budgeting (MEB) is an ideal methodology for the proposed study, as MEB is able to infer the quantity of feed eaten by animals in a production system (including recreation by computer simulation of historic production systems where the numbers and body weights of animals are known) and thereby provide a basis for calculating conversion efficiency (kg forage dry matter consumed per kg carcass produced) in order to compare performance of the different production systems evaluated. The theoretical framework for MEB derives from animal calorimetry research, which was a part of the agricultural research effort in the second half of the 20th century, especially in the three decades following World War 2, and it resulted in the publication of livestock energy demand tables by national research organizations in a number of countries, for example Australia and the UK [2,3].
The application of MEB has evolved differently in different countries depending on the socio-political context and production patterns. In southeast Australia and New Zealand, animal production is largely from pasture-based systems where comparatively little feed is imported and producers do not receive government subsidies. In this context, MEB is used by land holders and their professional advisors for computer simulation of the systems to optimize the product generated from the feed that can be naturally grown on each property [4,5]. By contrast, in the UK, owners receive comparatively large subsidies in return for managing their grazing lands in an environmentally sensitive way and the provision of ecosystem services such as hiking access to the wider public. In this context, MEB is more often used by researchers to evaluate the environmental impact of pastoral activities or alternative production system configurations [6]. In the USA, meat production systems tend to be either extensive rangeland systems where herbage utilization is less intense and MEB therefore less often practiced, or they involve feedlots or housed animals where a greater part of the feed is imported. In this context, system modeling must not only consider the energy needs of the animals but also the balance of carbohydrate, fiber, protein, and other nutritive components of the feed [7].
To quantify the cumulative impact of incremental system configuration changes in New Zealand, this study aimed to assess the feed conversion efficiency change in New Zealand sheep and beef cattle hill country production systems of the southern North Island that had occurred in the 30-year period from the 1980s to 2010/2011. International application of the findings is also discussed.

2. Materials and Methods

The study focuses on New Zealand southern North Island hill country sheep and beef cattle production systems of medium slope, which are categorized by the producer organization ‘Beef + Lamb NZ’ (B+LNZ) as ‘Class IV’ systems. New Zealand has a Land Use Capability (LUC) classification system in which mapped land units are classed on a 1–8 scale (1 most versatile, 8 most limited). In this context, hill country is defined to include all lowland and montane hill and steeplands of slope >15°, which is classified as belonging to LUC Classes 5, 6, or 7 [8]. B+LNZ Class IV systems are essentially those comprised predominantly of LUC Classes 5 and 6, with those on predominantly steeper land identified by B+LNZ as ‘Class III’. B+LNZ Class IV systems are the most common category of sheep and beef cattle production system in the southern North Island of New Zealand, and their placement in LUC Class 5 and Class 6 indicates significant land use limitations. The above-cited [1] describes species composition in three slope classes (0–12°, 13–25°, >25°) in a representative Class IV system.
The approach used was to carry out MEB using a self-built model in Microsoft Excel (hereafter the ‘Excel MEB’ model). MEB uses information on animal numbers on a production farm as well as their body weights, weight change, pregnancy status, and other physiological factors to calculate the animals’ energy demand over a given period. From energy demand, feed demand (i.e., herbage harvested by animals within the production system) can be deduced, often to an accuracy of ±5% [5], and then, system performance in terms of feed conversion efficiency can be assessed [9]. The Excel MEB model was used to assess the changes from the 1980s to 2010/2011 in system performance of a national ‘average system’ (hereafter the ‘Average System’), as defined by survey data collated by B+LNZ. To gain specific additional insight into the evolution of production system configurations, calculations for the Average System were cross-checked against actual data for three case-study or specific production systems (Farms A, B, and C), as described below.
To validate the Excel MEB model, data for Farm C were evaluated in a commercially available MEB model, Farmax®Lite (www.farmax.co.nz, accessed on 19 November 2013), which is a commercial feed budgeting software package widely used in New Zealand (hereafter referred to as FARMAX; for an example of FARMAX use in systems research, see e.g., [10]). To determine if any time trends in herbage harvested detected by the Excel MEB model might be attributable to change in weather patterns between 1980 and 2010, a third model, GROW [11], which uses weather and soil data to predict potential pasture grown (i.e., herbage (or feed) supply, when there are no imported feeds or supplements in the system) on New Zealand sheep and beef cattle production systems was run in parallel with the MEB modeling of herbage harvested by animals. The ratio between herbage harvested calculated by the Excel MEB model and calculated herbage grown using GROW is also an estimate of the level of herbage utilization by animals in the production system. To summarize, the Excel MEB model was the primary tool for evaluation of system changes over the study period for the Average System and Farms A, B, and C. An alternative model (FARMAX) was also used for Farm C data as a ‘model calibration’ to confirm that the self-built Excel MEB model was working as expected. Four data points from the model comparison were submitted to an ANOVA using the ‘GLM’ command of Minitab Version 10.51 to determine p-values of year and model differences. The ANOVA on the four data had one degree of freedom each for model, year, and error terms. A third model (GROW) was used to test whether change with time in calculated herbage harvested could be explained by change in weather patterns through the study period.

2.1. Data Collection for the Beef + Lamb NZ Class IV Average System

The initial plan was to model the feed demand and supply of the systems every five years from 1980. However, since data were unavailable for some years, the seasons studied were re-selected to match years for which necessary data were available. For the Average System, the farming seasons studied were 1980–1981, 1985–1986, 1992–1993, 1999–2000, 2003–2004, and 2010–2011. Averaged data on numbers of animals by type and age class from B+LNZ surveys of Class IV farms were obtained for 1980–1981, 1985–1986, 1992–1993, and 1999–2000 farming seasons from the Supplement to the New Zealand Sheep and Beef Farm Survey [12,13,14] and the New Zealand Sheep and Beef Farm Survey [15,16,17,18,19,20,21,22,23,24,25,26,27,28,29]. Since this publication series was discontinued from 2002, the equivalent data held by B+LNZ in their archives were obtained from them by email correspondence, to model the 2003–2004 and 2010–2011 seasons. Further details are given by [30].

2.2. Data Collection for the Case-Study Production Systems: Farm A, Farm B, and Farm C

Farms A, B, and C were located in the southeast North Island, New Zealand, at 40.346° S (latitude)/175.618° E (longitude), 40.653° S/176.128° E, and 40.842° S/175.618° E, respectively. Farms A and B have been operated by the current owners over the past 25 and 30 years, respectively. Farm C (Riverside) has been operated by Massey University since 1979 [31]. These farms are also B+LNZ Class IV systems, and they were selected based on recommendations from a professional consultant familiar with properties in the region. All three farms were performing above the national average in terms of effective area and animal stock units (SU) per hectare at the time the records were collected. (Note: in New Zealand, an SU is defined as one female sheep rearing a lamb to weaning, and represents approximately 600 kg feed DM consumed per year.) For Farm A, the seasons studied were 1985–1986, 1999–2000, 2003–2004, and 2010–2011. For Farm B, the seasons were the same as those studied for the Average System. For Farm C, the seasons included were 1980–1981, 1985–1986, and 2010–2011. Data equivalent to those of the Average System from the B+LNZ survey were obtained from historic diaries kept by the owners. For Farm C, the data were extracted from reports [31,32] and from the annual feed budgets prepared by the farm manager for the period 2009–2011.

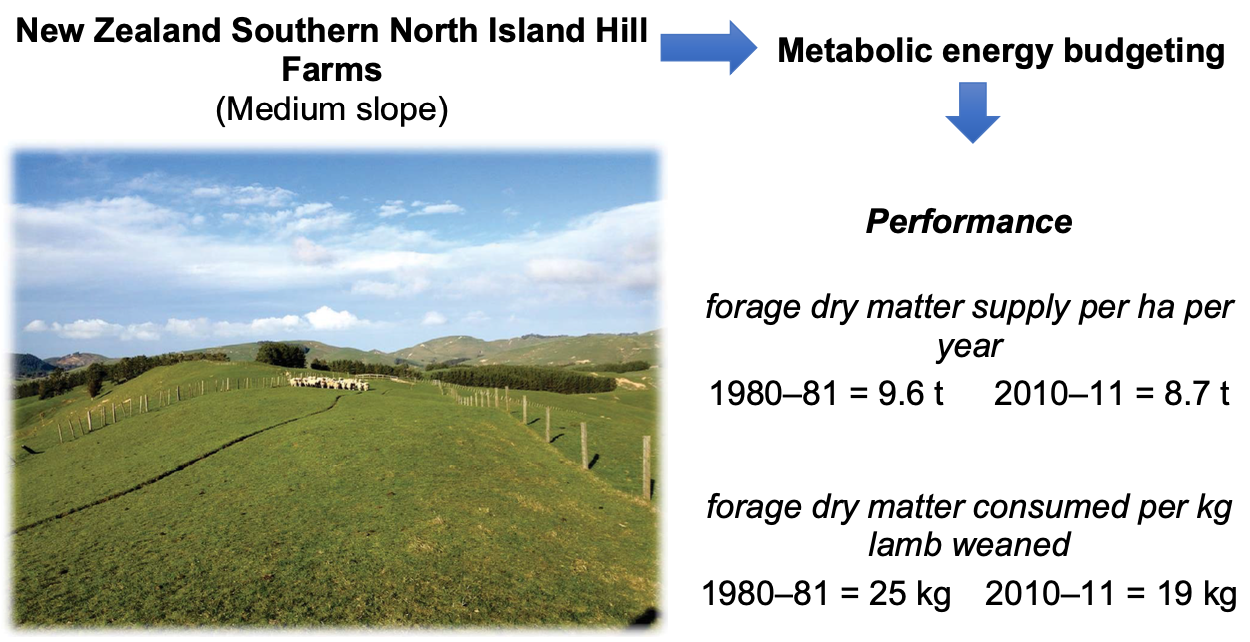
2.3. Modeling of Animal Feed Demand by MEB

Monthly animal body weight data (Supplementary Table S1), retrieved from previous reports by New Zealand researchers and from the owners’ diaries of Farms A, B, and C, and reviewed by an expert professional consultant, were the primary input to the calculation of animal metabolic energy requirements. The Excel MEB utilized for the calculations was modified from a standard Microsoft Excel® template developed at Massey University over the last 15 years [5,9] and similar to the approach of [33]. Animal requirements were calculated following [34] (Supplementary Table S2), but three adjustments were made. First, the authors of [34] propose that above a threshold dietary metabolizable energy value of 10.5 MJ ME kg dry matter (DM)−1 (or 11 MJ ME kg DM−1 for lactating ewes), body maintenance energy should be reduced by 7% (or 10% for lactating ewes) compared to body maintenance energy at lower herbage ME. In this study, we did not assume a sudden change in body maintenance energy requirement at a threshold herbage ME value, but instead, we calculated the change as a gradual transition (%) using the formula: (|Monthly herbage ME—herbage ME threshold|) ÷ herbage ME threshold × 100. Second, the energy cost of weight gain for adult steers and bulls was taken to be 70 MJ ME per kg body weight gain rather than 55 MJ ME per kg body weight gain as assumed by [34]. This second adjustment can be justified because weight gain in larger cattle is mainly adipose tissue, for which 70 MJ kg−1 is theoretically a more reasonable energy value. Thirdly, energy recovered during weight loss of sheep was decreased by 10 MJ ME per kg body weight to 20 MJ ME per kg body weight lost, based on advice from an industry expert that the ratio of fat to protein in weight loss of New Zealand breeding ewes is likely lower than that assumed in published figures.
The conversion of animal energy requirements to feed demand was based on assumed monthly values for ME content of mixed-species pastures containing browntop (Agrostis capillaris L.), ryegrass (Lolium spp.), and various clovers (Trifolium spp.), which are commonly present in these particular New Zealand systems. For periods before 2005–2006, the ME of herbage on the Massey University ‘Tuapaka’ hill farm reported by [35] was used (Supplementary Table S3). For 2005–2006 and later periods, the ME of herbage reported by [36] on the same property was used (Supplementary Table S3). These data were used because the ME of herbage is rarely measured on these New Zealand systems and thus, using known information from a similar system is acceptable for forecasting feed demand [33]. As cattle generally graze behind the sheep mob, the ME content of the herbage grazed by the cattle would be lower than that grazed by the sheep [37]; thus, for the Average System and for Farms B and C, the ME of herbage for finishing cattle was assumed to be lower than that for sheep (Supplementary Table S3). However, for Farm A, the ME of herbage for finishing cattle was assumed to be the same as that for sheep, because this farm did not prioritize sheep over cattle for feed access during grazing. For Farms B and C, the ME of herbage was assumed to be the same as that of the Average System. In summary, we considered herbage ME to have increased over time by 0.56 MJ ME kg DM−1 for cattle and by 0.7 MJ ME kg DM−1 for sheep between 1980–1981 and 2010–2011, as indicated by the reports of [35,36]. We also considered herbage ME to be constant across systems or farms in the same year.

2.4. Modeling of Herbage Supply Using GROW

The herbage supply (also known as herbage accumulation or pasture growth) in the production systems was modeled in GROW for the same periods as those used to calculate feed demand in the Excel MEB model. GROW was designed and calibrated to reproduce published herbage accumulation data for various New Zealand regions [11]. GROW uses precipitation, temperature, and soil fertility data as the main inputs and other parameters relevant to soil water storage as minor inputs. In this study, the default settings of the model were used, except for herbage composition (‘ryegrass–white clover–browntop’ was selected), soil fertility (Olsen P = 10), soil type (moderate clay loam), and defoliation interval (28 days). For the B+LNZ Average System, temperature and precipitation data were obtained from the New Zealand National Institute of Water and Atmospheric Research (NIWA) ‘Cliflo’ service [38] for weather stations distributed across the study area, and these data were averaged to obtain the model inputs as recorded in Supplementary Table S4. For Farms A and B, the data were obtained from the owners’ diaries. For Farm C, the data were obtained from [31,32,39,40] and from [38] for 2010–2011 data (Supplementary Table S4).

2.5. Feed Conversion Efficiency

The feed conversion efficiency of the systems was estimated only for the 1980–1981 and 2010–2011 farming seasons. Feed conversion efficiency was expressed as the calculated amount of feed required (kg DM) per farm of product (kg carcass of sheep + cattle, kg sheep carcass, lamb weight and number of lambs weaned, kg cattle carcass, and calf weight and number of calves weaned). The annual carcass weight data were obtained from [12,13,14,41]. Additional carcass weight data were obtained from the owners’ diaries (Farms A and B) and from 31,32] (Farm C). The body weight to carcass weight conversion rates used were 40% and 51% for sheep and cattle, respectively, based on historic meat company records provided by the owner of Farm A.

3. Results

3.1. Key Changes in System Configuration Over Time in the Average System

The New Zealand Class IV hill country Average System had a 25% larger total production area and 21% higher effective area in 2010 than 30 years before (Table 1). The hay and silage area increased by 50% during the same period but remained less than 2% of the total area (Table 1). The total fertilizer application for the Average System increased from 122 kg ha−1 in the 1980s to 215 kg ha−1 in the 2000s, and the highest fertilizer application was recorded during the 2000–2001 season (Table 1). Fertilizer nutrients are not reported separately in the B+LNZ data (Table 1), but it can be assumed that sulfur, phosphorus, and potassium were typically applied together as superphosphate with a proportion of KCl added. Nitrogen fertilizer use had the greatest percentage increase over time with 0.55 kg ha−1 applied in 1985–1986 versus 6.19 kg ha−1 in 2010–2011 for the Average System. The total animal SU per ha (in this context, the number of animals overwintered) decreased by 20% (Table 1). The number of sheep decreased by 19%, but the number of cattle increased by 37%. The ratio of sheep to cattle SU decreased from 70:30 to 58:42. The lambing percentage averaged 100% for the two years reported in the 1980s and 121% for the two years reported in the 2000s, whereas calving percentage showed a small decreasing trend of about 3% (Table 1).

3.2. Key Changes of System Configuration Over Time for the Case-Study Production Systems

The effective area of Farms A and B was 138% and 61% larger in 2010–2011, respectively, compared to the area in the 1980s (Table 2). By contrast, for Farm C, the increase in effective area between 1980–1981 and 2010–2011 was only 1% (Table 2). Owners of Farms A and B did not use or produce hay or silage since the 1980s, while the manager of Farm C reduced the area (–48%) allocated for hay or silage production in 2010–2011.
Compared to the 1980s, Farms A and B had slightly increased phosphorus use in 2010–2011, whereas Farm C did not use any phosphorous fertilizer in 2010–2011. However, all three farms had higher Olsen P soil tests in 2010–2011 than in the 1980s, indicating enhancement of soil fertility from ongoing fertilizer application, and all three farms were using nitrogen fertilizer in 2010–2011 but had not been using any in the 1980s (Table 2). The use of lime in these systems is occasional, so no trends should be inferred from the data on lime use (Table 2).
The total stocking rate was 6% lower on Farm A and 12% lower on Farm B in 2010–2011 than in the 1980s (Table 2), reflecting the same trend but a smaller decrease than in the Average System. By contrast, Farm C had the highest stocking rate among the three case-study systems in the 1980s but the lowest in 2010–2011, with a decline in stocking rate of 40% over the study period reflecting a planned de-intensification of animal production on this farm. The data for Farms A and B show system configuration preferences of the individual owners. On Farm A, the sheep/cattle ratio on a SU (feed demand) basis was 34:66 in 2010–2011, compared with 57:43 in 1985–1986 (Table 2), and this trend toward an increased proportion of cattle was coupled with a policy of having no breeding cattle on Farm A, but focusing on body weight gain of weaned steers and bulls purchased in late summer–early autumn. On Farm B, the sheep/cattle ratio was near 80:20 in 2010–2011 compared with 69:31 in 1980–1981 (Table 2), and this evolving focus on lamb breeding and finishing was coupled with a policy of grazing 800–900 dry replacement ewe hoggets off the farm from August to December in more recent production seasons to allow more feed to be allocated to ewes and lambs during peak lactation. On Farm C, the sheep/cattle ratio was 81:19 in 2010–2011 compared with 90:10 in 1980–1981, and a specialization on this farm involved the purchase of dairy heifers in June that will be sold as pregnant rising 2-year-old heifers to dairy farmers.
The trends in lambing percentage between the 1980s and 2010–2011 differed between farms. Farm A moved from 22% below to 5% above the Average System performance; Farm B recorded 123% lambing in both 1980–1981 and 2010–2011 seasons, which was 22% above the performance of the Average System in the 1980s but only 7% higher than that of the Average System in 2010–2011. On Farm C, lambing percentage was 4% higher than the Average System in 1980–1981 and 15% higher in 2010–2011. Farms B and C both improved their calving percentage between 1980–1981 and 2010–2011.
In terms of animal breed and breeding policy, the farmers and the manager of the case farms had identified the best practice for their farms. Farmer A stated that he had used Romney sheep since 1985, and prior to the 1980s, his father purchased Friesian steer and bull calves for farming and selling, and he (Farmer A) maintained this policy throughout the period studied. Farmer B had moved from Romney to Romney × Coopworth sheep and from raising Hereford or Angus suckler cows to Hereford or Angus × Charolais terminal sire for a better slaughter weight. On Farm C, Romney and a number of terminal sire breeds used Hereford x Friesian sucklers cows mated to Charolais bulls.

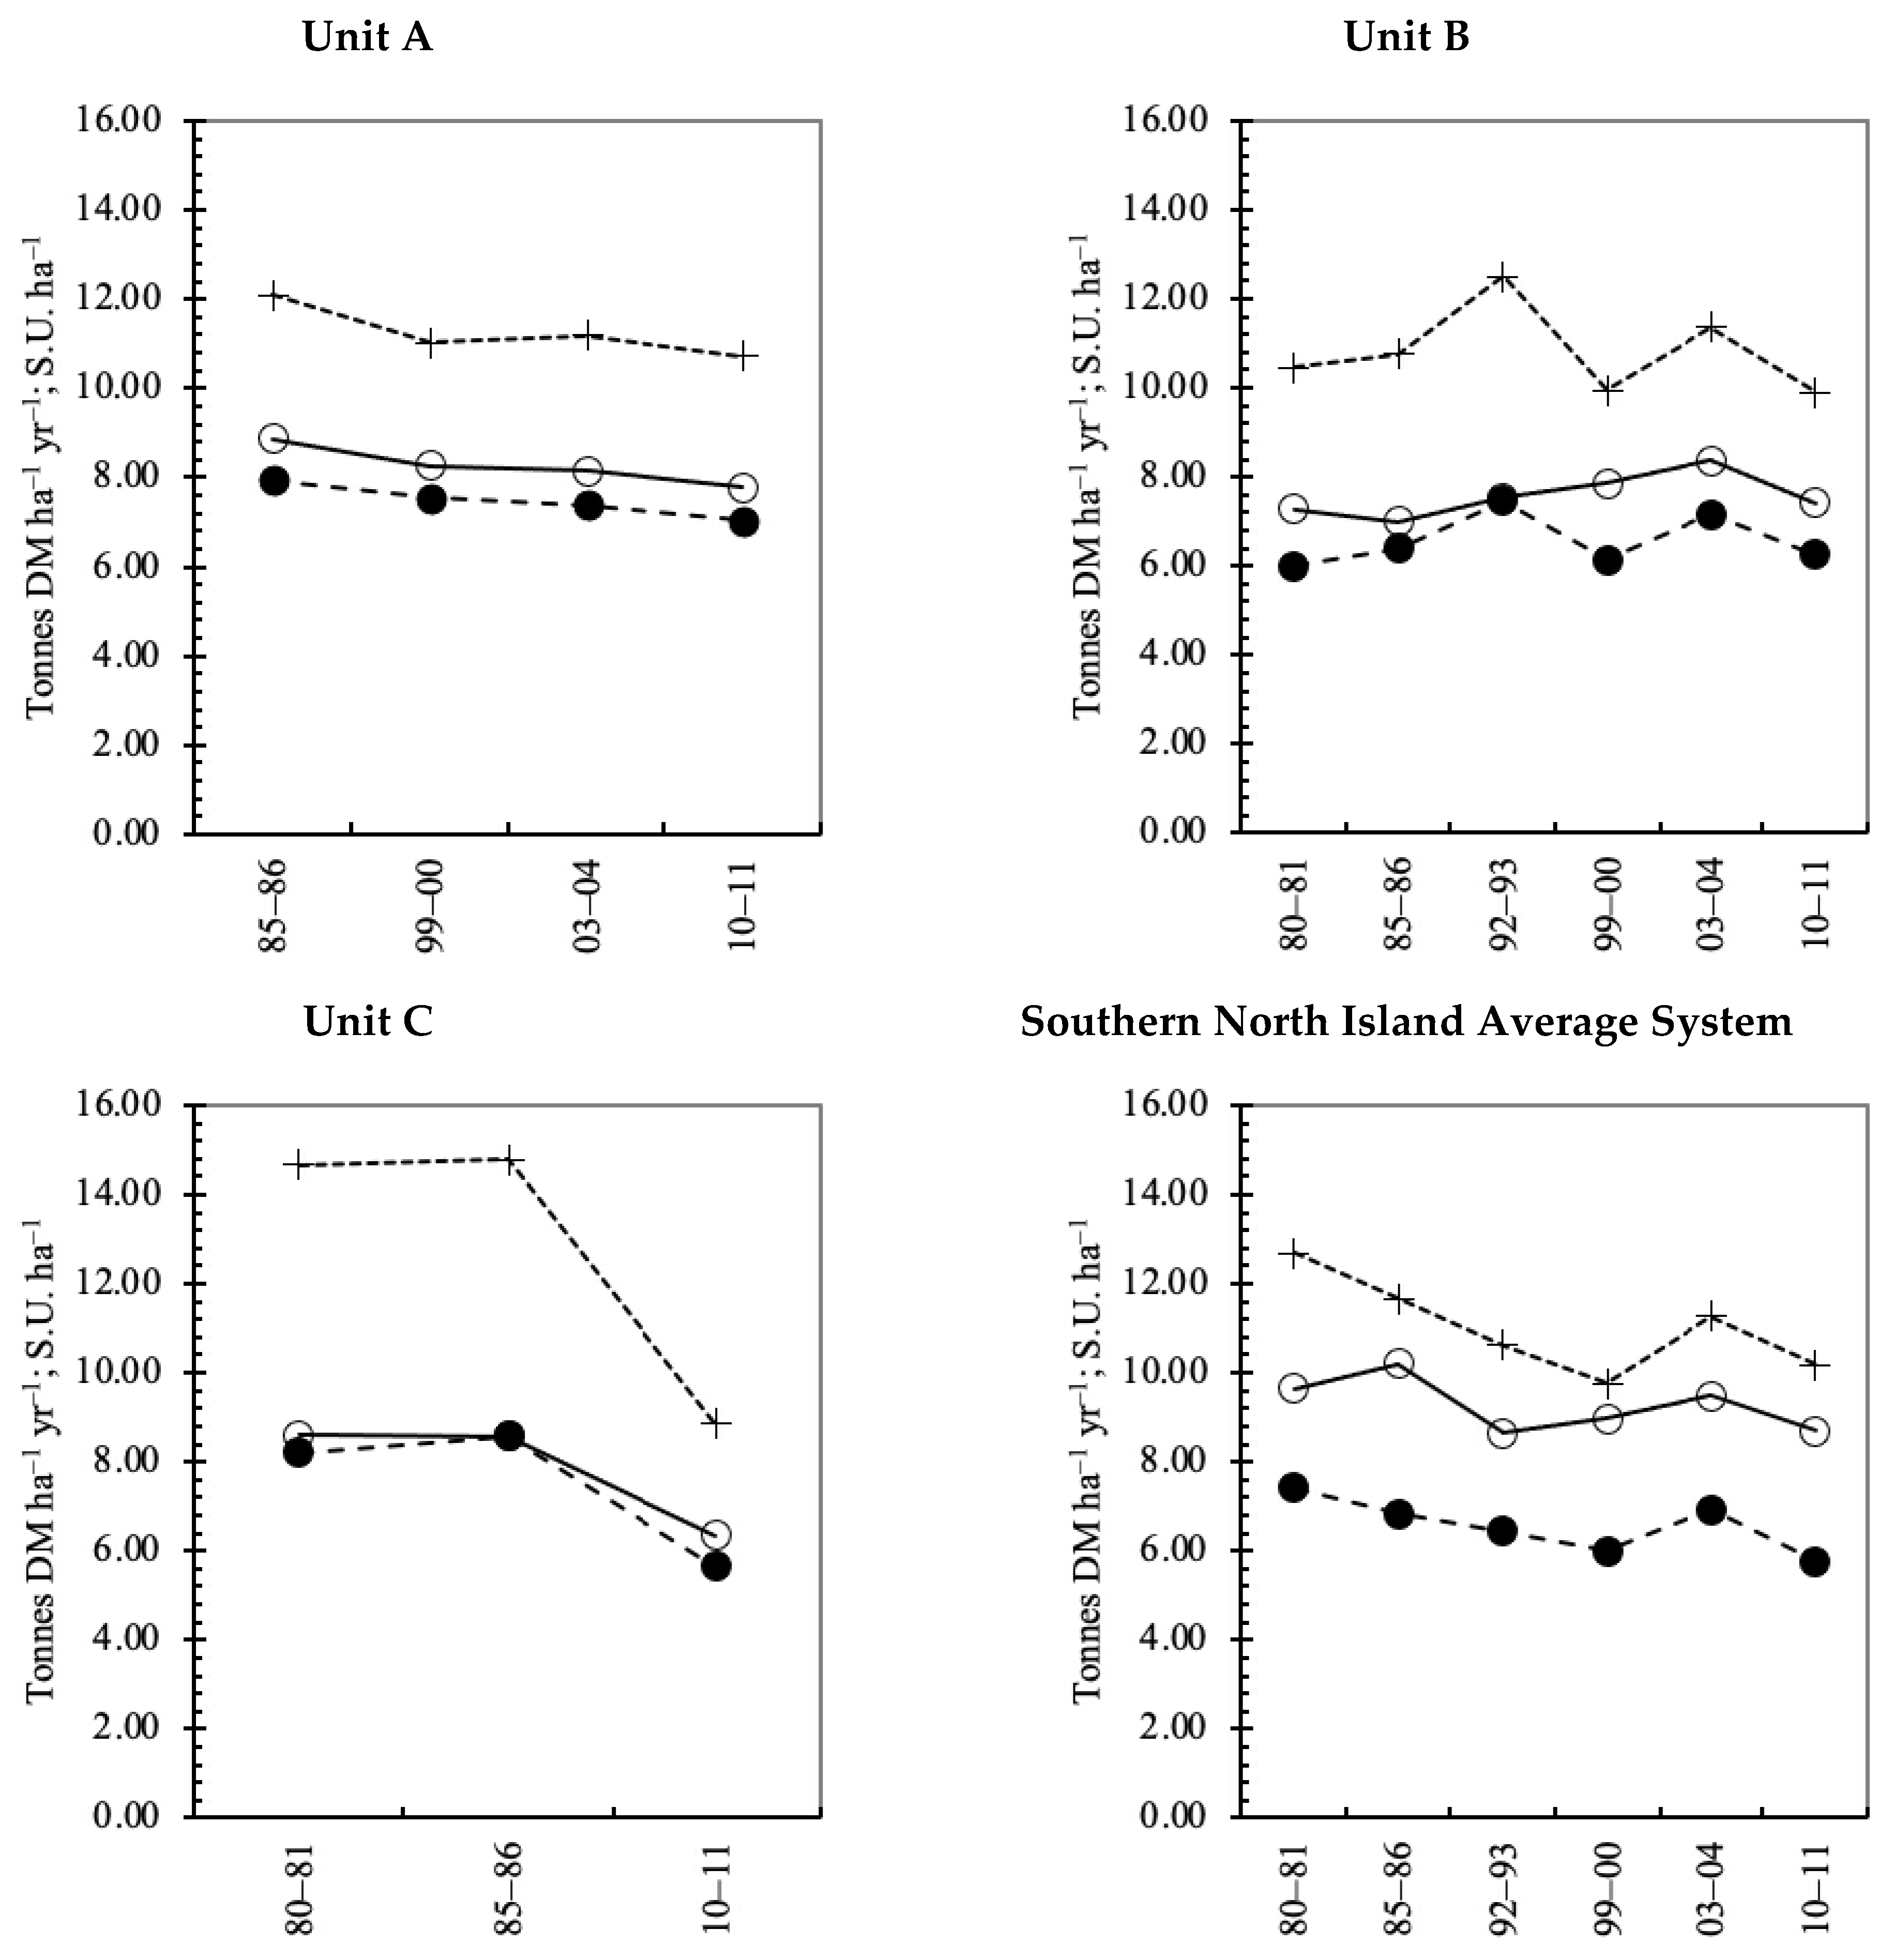
3.3. Changes over Time in Feed Demand, Herbage Supply, and Herbage Utilization

Feed demand per ha, as calculated by the Excel MEB model, decreased by 10% on the Average System and by 26% on Farm C between 1980–1981 and 2010–2011, and by 12% on Farm A between 1985–1986 and 2010–2011. Only on Farm B was feed demand per ha maintained over time. Apparent time trends for herbage supply calculated using the GROW model based on local weather records displayed a similar pattern, with reductions of 23%, 31%, and 11% on the Average System, Farm C, and Farm A, respectively, and a calculated gain of 4% on Farm B (Figure 1; Table 3). Based on the regular scoring of pasture herbage mass of ungrazed paddocks, herbage supply on Farm C was reported by the manager to be 5.41 t DM ha−1 yr−1 in 2010–2011, which was slightly lower than the 6.34 t DM ha−1 yr−1 determined by the GROW model.
When feed demand estimated by the Excel MEB model and herbage supply estimated using the GROW model were compared, both models showed a declining trend across the study period, and the calculated herbage utilization of the Average System was 77% in 1980–1981 and fell by 11% to 66% in 2010–2011, but herbage utilization averaged for the three case-study farms was 89% in 1980–1981 (or 1985–6 for Farm A) and almost unchanged at 88% in 2010–2011 (Table 3). On Farm B, feed was effectively purchased by grazing ewe hoggets off-farm in late spring–early summer resulting in overall herbage consumption being increased by 0.57–0.66 t DM ha−1 yr−1 (Table 3).

3.4. Changes over Time in Feed Conversion Efficiency and Meat Production per ha

For the combined production of sheep and beef carcass, feed conversion efficiencies of the B+LNZ Average System and on the three case-study farms all improved (i.e., less feed was required per kg of product produced) between the 1980s and 2010–2011, although the improvement was only marginal on Farm B (Table 4). These data represent an average improvement in feed conversion efficiency of 28% (range 2% on Farm B to 50% on Farm C, with the B+LNZ Average System improving by 28%).
Feed conversion efficiency gains expressed per kg lamb weaned were similar for the B+LNZ Average System and the case-study farms (24% and 27%, respectively), but they were greater for sheep carcass production (28% and 39%, respectively) than for cattle carcass production, the latter averaging 4% across all farms or 23% if an anomalous result for Farm B is excluded (Table 4).
A second factor targeted by managers aiming to achieve higher feed conversion efficiencies in recent years has been the sale of offspring at heavier weights. Such a trend is evident in the lamb and steer carcass weight data (Table 5). Averaged across all farms, kg feed demand per kg lamb or calf carcass weaned between 1980 and 2010 decreased, respectively, by 26% and 13%, indicating improved conversion efficiency, but corresponding per animal feed demand decreased by only 3% and 8% respectively (Table 4). This data pattern is as expected when lambs and calves are kept longer on the farm and sold off at higher weights.
Interestingly, when the data are considered on a per ha basis (Table 5), the gains in feed conversion efficiency have resulted in increased annual sheep + cattle carcass production per ha on all farms (range 7% to 52%, Table 5), despite reducing feed supply (Table 3; Figure 1). However, the farms differ in whether the production gains were achieved in the sheep or cattle component of the system (Table 5), reflecting differences between farms in how the ratio of sheep/cattle SU changed between the 1980s and 2010–2011 (Table 1 and Table 2).

3.5. Comparison of Feed Demand Estimates from the Excel MEB Model and FARMAX

As noted above, one case-study farm (Farm C) was chosen for validating or calibrating the authors’ self-built MEB model in Excel against a commercial software MEB package, FARMAX. The MEB model in Excel and FARMAX produced highly similar estimates of annual feed harvested per ha. Compared with the values from MEB of 8.21 and 5.64 t DM ha−1 yr−1 in 1980–1981 and 2010–2011, respectively (Table 3), corresponding estimates by FARMAX were 8.14 and 5.58 t DM ha−1 yr−1, indicating a 1% difference between models and a 32% decline between 1980–1981 and 2010–2011 years. ANOVA on these four values for difference between models (Excel MEB and FARMAX) and years (1980–1981 and 2010–2011) is technically valid and returns p-values of 0.049 and 0.001, respectively, for the model and year effects. Compared with FARMAX, the Excel MEB model gave higher feed demand estimates for winter (+0.51 kg DM ha−1 d−1) and spring (+3.48 kg DM ha−1 d−1), while it gave lower estimates for summer (−1.11 kg DM ha−1 d−1) and autumn (−2.04 kg DM ha−1 d−1).

4. Discussion

4.1. System Feed Conversion Efficiency, System Energy Requirement, and MEB as a Tool for Their Calculation

Since data on herbage intake of animals in more extensive pastoral systems are rare, and MEB as used here provides a calculation of energy requirement of animals, from which feed consumption can be calculated, this study was able to provide a seldom calculated, or possibly unique estimate, of improvement in production system feed conversion efficiency over time. The feed-to-meat conversion ratio in the early 1980s for Farms A, B, and C, respectively, was 44, 44, and 62 kg feed DM per kg sheep + cattle carcass. In 2010–2011, corresponding values for Farms A and C were 32 and 31 kg feed DM per kg sheep + cattle carcass, respectively (Table 4), showing a feed conversion efficiency improvement of around 27–50%. Farm B made only a marginal gain to 43 kg feed DM per kg sheep + cattle carcass in 2010–2011. This can be partly attributed to the fact that sheep fecundity was already high in 1980–1981, leaving no opportunity for further improvement, as occurred on other farms (Table 2). A second potentially relevant factor is that the expansion in area from 670 to 1081 ha (Table 2) was onto adjacent land of greater slope, which would have had intrinsically lower productive capacity, and likely an increased presence of grass species of lower nutritional value such as browntop, which was not recognized in model assumptions. Hence, the maintenance of production efficiency statistics in the context of expansion onto inferior land was effectively also an improvement in system performance.
For the lamb production component of the systems, the average feed conversion on Farms A, B, and C in the 1980s was 23 kg feed DM per kg lamb weaned, and this was decreased to 16.7 kg feed DM per kg lamb weaned by 2010–2011. Clearly, the fecundity gain on Farms A and B (Table 2) was a major factor.
Other calculated feed conversion efficiencies for New Zealand systems are scarce in the literature, and those located by the authors also used MEB methodology. One study [44] reported feed conversion efficiencies of 29–38 kg DM feed per kg carcass for model New Zealand sheep and beef cattle production systems, while another [45] reported 27 kg feed DM per kg lamb weaned for a farm in the northern North Island with similar system configuration to Farms A–C.
For performance analyses of pasture-based systems where pasture productivity or herbage harvested is not known, researchers need to devise different criteria to assess efficiency; for example, [46] discussed production system ‘eco-efficiency’ changes (i.e., meat and fiber production per farm of nitrogen leached to the environment) over the preceding 20 years for North Island ‘hard hill country’ systems (i.e., greater slope and lower herbage production and stocking rate than systems considered in our study), without quantifying feed conversion efficiency, as there was no measure of feed supply available to them. Clearly, a comparison of the eco-efficiency of different production systems would be enhanced by parallel consideration of feed conversion efficiency. If not estimated by MEB, herbage consumed by grazing animals must be directly measured by pre- and post-grazing herbage cuts as in the study of [47] or estimated by techniques such as the measurement of differential concentrations of indigestible markers in herbage eaten and feces, for example n-alkanes [48]. Both of these techniques are logistically challenging to implement, and neither can be applied to historic systems without physical samples of the feed on offer. Therefore, these techniques are unsuitable for investigations of more extensive systems or reconstruction of historic systems such as in this study.
More generally, information on system energy requirements and feed conversion efficiencies provides a basis for comparison across a diverse range of animal production systems and is also relevant to land use planning and the design of environmentally sustainable future grazing systems, enabling informed choice about planning food supply options for future human populations. For example, the research of [49] in Ireland examined records of 5172 growing beef animals fed a total mixed ration and reported energy conversion ratios of 81–108 MJ per kg body weight gain, which at 9.51 MJ ME/kg DM (Supplementary Table S3) corresponds to 8.5–11.4 kg feed DM per kg animal body weight produced. This feed conversion performance can be compared with the 14–19 kg feed DM per kg lamb weaned observed in these hill country systems (Table 4), and along with information on other factors such as opportunity cost of the land use and environmental impacts in each case, it can be used to identify preferred future meat production systems. Similarly, it is likely that as global population increases, the human carrying capacity of land now regarded as recreational or wilderness will need to be estimated by planners, and information on the energy capture of grazing systems on that land will be useful for this purpose. The unique capability of MEB as a tool to perform such calculations is well demonstrated in this study.

4.2. System Configuration Drivers of Feed Conversion Efficiency

The configurations of New Zealand sheep and beef cattle production systems have evolved over time, and they have been driven by various factors, including financial necessity to meet the lifestyle aspirations of the landowner’s family. MEB does not provide a comprehensive road map for all facets of system optimization, but it does quantify the proportion of energy in the form of feed that is being allocated by the system to unproductive activities such as animal body maintenance. It is likely that over the 30-year study period, breeding selection decisions by farmers would have resulted in some genetic gain in feed conversion efficiency at the animal physiology level. Our study design does not allow us to elucidate the magnitude of this effect, but if efficiency gains at the animal physiology level were biologically important, we would expect to see effects such as stocking rates increasing over time, all else unchanged, or a gradual emergence of discrepancies between model predictions and farmer observation. These models have been extensively used across the industry since the 1980s, and in wide experience with the models, the authors are unaware of any such indications being reported either in the research literature or anecdotally among farmers and farm consultants, and we conclude that the increase in lambing percentage is the driver of the feed conversion efficiency gains identified in our study. Thus, a principle of production system configuration that emerges from the data is that an increase in lambing percentage or an increase in sale weights will act as a major driver of feed conversion efficiency. This is intuitively logical, since the mother’s annual body maintenance, which is a major feed cost in producing a lamb, increases little if she carries twins or if lambs are sold at a higher weight. A similar link between lambing percentage and system feed conversion efficiency was also illustrated in the study of [46].
In the present study, the higher lambing percentage in 2010–2011 compared to the 1980s for the Average System (Table 1) and for Farms A and C can be attributed to mating policies aimed at increased fecundity as well as to changes in management that better allocate feed to animal demand. (Farm B had already achieved 123% lambing in 1980–1981.) Owners of Farms A and B (personal communication) both advised that scanning of ewes in early-mid pregnancy to identify twin- or triplet-bearing ewes for differential feeding in late pregnancy had been key to preventing deaths of young lambs and increasing lambing percentage. Moreover, across all the case-study farms, there was a proportional increase in lamb weight weaned per ewe averaged 65% (Table 5), whereas the proportional historical increase in lambing percentage was 21% (Table 1 and Table 2). Therefore, it can be inferred that a general increase in lamb weight at sale from the 1980s to 2010–2011 across the farms studied has been more important than any increase in lambing percentage to the observed increases in system feed conversion efficiencies, although the two factors acting together account for the greater movement over time in feed conversion efficiency of lamb production than of beef production. This principle of setting system configurations to increase feed allocation to growing animals would be widely applicable to other systems elsewhere. In terms of contribution of breed and genetic improvement to system feed conversion efficiency, owners of Farms A and B and the manager of Farm C had identified the best sheep and beef cattle breeds to farm as early as the 1980s and continued that selection policy throughout the period studied. The contribution of genetic improvement at least for the case farms was already in place when the present study was carried out, and without overlooking the importance of this factor, the impressive feed conversion efficiency during the 30-year period studied was likely attributable to the farm system configuration setup discussed in this paper.
With respect to stocking rate, balancing animal feed demand against a seasonally variable herbage supply (with additional interannual variability) is necessary to ensure high system feed conversion efficiency and profitability. Profitability is adversely affected by non-utilization of feed grown (lost production opportunity) when animal demand in a system is too low relative to herbage supply. Equally, profitability is generally decreased when system animal demand exceeds herbage supply and animals are underfed. Hence, in these systems, setting the stocking rate to optimally balance feed demand with herbage supply is an important determinant of system performance. The reduction in stocking rate of the Average System over the study period recorded (Table 1) is well known in industry circles, and it is anecdotally assumed to be a consequence of managers positioning their systems to increase the per-animal intake to improve performance indicators such as lambing percentage, which will increase the number of offspring for sale. However, investigation of the data shows otherwise. System annual feed allocation per SU can be calculated by dividing feed demand or supply (Table 3) by stocking rate (Table 1 and Table 2). For this calculation, averaged across all case-study farms from the 1980s to 2010–2011, the feed consumption per SU increased by 5% (range –4% for the Average System to 14% for Farm C), and the feed supply per SU increased by 10% (range –1% on Farm A to 22% on Farm C). Meanwhile, the stocking rate (SU ha−1) fell on average 19% in the same period (range 6% on Farm B to 40% on Farm C). Therefore, this research shows unexpectedly that a trend of reducing feed supply (shown by the GROW model to be attributable to weather change) is also a driver of falling stocking rates. We assume that stocking rate adjustment occurs through managers intuitively assessing their farm’s feed supply/demand balance each season as part of the decision process on whether to maintain, raise, or lower animal numbers for the next season. For the future, an ongoing temperature increase trend is expected with a resultant increase in potential evaporation demand [50], but the projected impact on precipitation varies regionally with increases predicted in the south and west and decreases in the north and east of the country. Contrary to some popular reports, global demand for red meat is predicted to increase over the next decade [51]. However, while these factors bring uncertainty, there is general confidence that the industry will adapt production strategies and find new markets as required. Current indications are that the trends in farm systems changes identified in our study for the period from the 1980–1981 farming season to the 2010–2011 farming season is continuing. For example, for the 2018–19 season, the reported statistics for a Class IV Average Farm include [52]: effective ha 444 (1% increase on 2010–2011), total sheep + cattle SU 3889 (1.8% decrease on 2010–2011, with sheep/cattle ratio slightly increased to 62:38) and lambing percentage 133.5% (10.8% increase on the average for 2005–2006 and 2010–2011). The exploitation of recycled by-products from the human food chain such as vegetable or fruit pomace [53] is currently occurring in more intensive New Zealand dairy farming systems but is unlikely to occur on the farms in this study, because the studied Class IV hill farms are typically situated much further from population centers where such materials might be available for purchase, and with larger numbers of animals more dispersed over larger areas of sloping terrain and managed by only 1.79 labor units on the average Class IV farm [52]. Hence, the logistics of supplementary feeding are currently uneconomic and likely to remain so. The emerging change trend that presents the greatest threat to the future of these farming systems is the purchase of sheep and beef farms for conversion to forestry, which is driven by the income that can be earned from carbon credits even without harvesting the trees.

4.3. Significance of Change over Time in Supplementary Feed, Fertilizer Use, and Sheep:Cattle Ratio

With its temperate oceanic climate, the southern North Island of New Zealand has some natural herbage accumulation in winter, and the provision of supplementary feed such as hay or silage is expensive compared to pasture grown and grazed in situ, so it forms only a small component of the total annual feed supply in these systems. On many farms, winter feed supply is supplemented by a rationed release of stockpiled autumn-grown standing pasture through rotational grazing [54]. Hence, the reported increase of hay and silage areas for the Average System (Table 1) is superficial compared to the total forage supply in these production systems and is not a significant contributing factor to system feed conversion efficiency.
Fertilizer application is important to the maintenance of pasture productivity, and it represents a comparatively inexpensive way to generate additional feed in the system [55,56]. The fertilizer usage data in Table 1 and Table 2 are not amenable to detailed evaluation or economic analysis because of the lack of detail on forms of fertilizer used, but they do reveal that use of phosphorous fertilizer has been greater post-2000 than pre-2000, and that for all case-study farms, nitrogen fertilizer was introduced during the study period. In these systems, phosphorous fertilizer application is aimed at generally increasing herbage production in the system [56] so as to sustain or increase the stocking rate, while nitrogen fertilizer is applied tactically in periods of high animal feed demand not matched by high herbage accumulation, such as early lactation where parturition occurs before the spring herbage accumulation flush. Phosphorous fertilizer also encourages legumes in the sward, which in turn supply additional nitrogen to the soil-plant system and likely also increase average herbage ME. Therefore, it is likely that without the ongoing fertilizer use and increased soil fertility status indicated in Table 1 and Table 2, the observed herbage productivity decline in the study period would have been even greater, and it would have been more difficult for managers to provide animals with additional spring feed to support the evolving higher lambing percentages over the study period. With respect to future projections for fertilizer use, it is now clear that there is a conflict between the economic optimum use of fertilizer and the environmental optimum. There is growing recognition in New Zealand of the environmental impacts of dairy farming [57]. As a result, regulatory authorities in New Zealand are currently working with farmers to reduce fertilizer application so as to reduce losses of N in particular, from farm systems to the environment. In the meantime, it appears that pursuit of the economic optimum is a primary driver for farmers, as recent statistics for Class IV farms [52] show total N + P + K + S fertilizer applications as 29.6 T farm−1 yr−1 in 2018–2019, compared to 19.2 T farm−1 yr−1 in 2010–2011 (Table 1). Almost certainly, sheep and beef farmers will in the future face scrutiny of the environmental impacts of their operations similar to that [57] now directed at more intensive dairy farming activities.
Lastly, although sheep/cattle ratios vary between the case-study farms (Table 1 and Table 2), these changes do not appear to have any major direct effect on system performance. Beef cattle are important for controlling pasture quality, and cattle have typically been reared as a breeding herd, together with sheep, since European settlement in New Zealand, with the ratio of sheep/cattle varying with landowners’ individual preferences, local trading opportunities, and fluctuations in returns from each class of stock. More intensive beef production with the purchase of young stock from other landowners has capital implications and can be less profitable if the landowners use only high-quality herbage [37], but it has received a boost as sheep and beef producers recognized the potential feed conversion efficiencies of rearing male calves from the dairy industry for beef production, so avoiding the feed cost of the mother’s body maintenance [58].

4.4. Model Performance

Clearly, independent validation of the self-built Excel MEB model is required in a study of this type, and as noted above, we addressed this in the first instance by comparing the Excel MEB model and FARMAX outputs for Farm C for 1980–1981 and 2010–2011. FARMAX was originally launched as STOCKPOL, following some years of development [59]. Since rebranding as FARMAX, there has been ongoing development [4], and FARMAX is currently used by many New Zealand sheep and beef cattle producers and professional consultants to adjust production system configuration for improved profitability, and it is also used as a research tool where an estimation of system productivity is required to fulfill research objectives [60]. The agreement of the self-built model and FARMAX in this study to within 1% for the calculation of annual feed demand is probably as close as could ever be achieved by two independent grazing systems models, and it is better than the 5% reported by [9] when output from a similar self-built MEB model in Excel was compared with that from the widely used fertilizer management model Overseer™, which has animal MEB equations built into the nutrient balance calculations and can output the herbage consumption of animals in the system [61]. As equations in FARMAX are not visible to users, we could not ascertain the reasons for the seasonal variance between FARMAX and the Excel MEB model noted in our results, but these differences would be consistent with a higher energy allocation to the growth of large beef animals increasing winter–spring predicted feed demand and a lower energy allocation to the growth of lambs decreasing summer feed demand in the Excel MEB model (as outlined above), compared to FARMAX.
The coincidence of the declining trend with time in the herbage production and consumption estimates of the GROW and Excel MEB models (Table 3) provides a second indirect validation of the Excel MEB model, and the finding of the GROW model that the decline in herbage production through the study period can be attributed to a trend toward warmer drier summers in recent years is also corroborated by the long-term trend of a climate-based pasture growth index (PGI), as reported by NIWA (Supplementary Figure S1). The NIWA PGI index utilizes a methodology very similar to the GROW model, but it draws on a much larger body of climate data. The NIWA PGI index indicated that the pasture growth potential of New Zealand production systems had decreased steadily (with interannual fluctuations) from an arbitrary value of 0.48–0.49 in 1980 to 0.42–0.43 in 2010 (i.e., around 10–14% reduction) (Supplementary Figure S1). MEB also allows insight into seasonal feed supply–demand variation. For example, in a drier summer (2010–2011), feed supply was greatly decreased in contrast to a wet summer (1980–1981) (Supplementary Figure S2), and impact of the drought-decreased summer feed supply in a system with increased lamb production emphasis (2010–2011) was a large negative late-spring/early-summer feed balance, which was larger than the winter feed deficit (July) (Supplementary Figure S3). It is salutary to note that the owner of Farm B has already made changes to his system to mitigate the emerging seasonal feed deficit of this putative climate change effect by arranging off-farm grazing for ewe hoggets in early summer to prioritize feed allocation to weight gain of lambs.
It is useful to note here that traditional measures of animal intake in research on grazing systems require either a pre- and post-grazing measure of herbage mass to determine herbage removed (not possible in continuously grazed rangeland systems) or some kind of fecal marker technique, meaning that measurement is generally intermittent. By contrast, MEB calculations capture and integrate the complete energy demand of the production system over the budget period when the number of animals and their weights and pregnancy details are known, and the uncertainties or errors associated with MEB are generally less than the errors in direct measurement of herbage removal or use of fecal markers. Thus, MEB is a sensitive measure of any year-to-year variation in annual herbage harvested by animals in a grazing system [54], and it deserves to be more widely used in management and policy formulation for grazing systems worldwide. It is a confirmation of the versatility of MEB that the self-built Excel-MEB model reported here was subsequently successfully applied to analyze tropical beef production systems in Sabah, Malaysia [30,62], with analyses performed for a cut-and-carry feedlot system, a pasture grazing system, and an oil-palm-integrated system.

4.5. Herbage Utilization

With respect to estimation of herbage utilization, values for herbage supply from GROW were typically 0.4 to 1.0 t DM/ha (5–13%) above the annual feed demand calculated in the Excel MEB model, with the gap somewhat larger for the Average System. These relativities are intuitively as expected for well-run systems of this type and if taken at face value provide estimates of the average herbage utilization of 90% (Farm A), 84% (Farm B), and 92% (Farm C) for the three case-study farms and approximately 72% for the Average System, as noted in our results. The case-study farm utilization percentages are at the upper end of the 70–95% herbage utilization on New Zealand beef cattle and sheep hill production systems reported by [33], and a lower herbage utilization value for the Average System than for the case-study farms would be expected.

5. Conclusions

This work demonstrates the successful application of MEB to the quantification of change over a 30-year study period in the feed conversion efficiency of New Zealand southern North Island hill land sheep and cattle grazing systems. The methodology is universally relevant for quantifying the herbage consumption of animals in pasture or rangeland systems, and this work demonstrates that MEB can be carried out successfully with a self-built model using generic animal energy equations and does not require commercial software tuned to a specific system. The findings provide insight into the ongoing evolution of system configuration and management practice of the studied systems and show (unexpectedly) that a change in weather patterns reduced herbage production in these systems by about 10% over the study period. However, through the increased lambing percentage and the sale of lambs for slaughter at heavier weights in the sheep component of the systems, the average feed conversion efficiency increased by 24%, and meat output per ha increased by 7%. The power of MEB to describe the energy capture of grazing systems is highly relevant for the formulation of environmentally sustainable future pasture and rangeland systems and for land use planning where the food supply potential of present wilderness areas may be useful information for exploring the sustainability of systems or determining ecosystem service values of farmed land in a wider geographic region.

Supplementary Materials

The following are available online at https://www.mdpi.com/article/10.3390/agriculture11060531/s1, Table S1: Liveweights by stock classes used in the model for the calculation of energy requirements of animals in New Zealand North Island (Class IV) sheep and beef cattle production systems in the 1980s and 2010–2011a, Table S2: Energy equations and constants used in the Excel MEB model to calculate energy requirements of animals in New Zealand North Island (Class IV) sheep and beef cattle production systems, Table S3: Herbage metabolizable energy content used in the Excel MEB model for the calculation of energy requirements of animals in New Zealand North Island (Class IV) sheep and beef cattle production systems, Table S4: Mean precipitation (P, mm) and temperature (°C) data used in the modeling of herbage supply using GROW, Figure S1: Annual Pasture Growth Index (average in red line) for New Zealand from 1977 to 2011 (redrawn from NZXAGRI, 2012). “The national pasture growth index has a more stable long-term trend, although there has been significant downward movement in the past decade. The low PGI over the last few years is due mainly to drier than normal conditions.”—NIWA (NZXAGRI, 2012), Figure S2: Seasonal herbage accumulation rates in the 1980s (○) and 2010–2011 (●) based on actual data of case-study Farms A, B, and C and on statistics of the New Zealand southern North Island Average System (B+LNZ Class IV, medium slope, New Zealand southern North Island hill country sheep and beef cattle production systems), Figure S3: Feed balance (feed supply minus feed demand) in the 1980s (○) and 2010–2011 (●) of case-study Farms A, B, and C and southern North Island Average System (B+LNZ Class IV, medium slope, New Zealand southern North Island hill country sheep and beef cattle production systems).

Author Contributions

Conceptualization, C.M. and S.T.M.; methodology, J.G. and C.M.; data collection, J.G.; excel output validation with FARMAX, J.G.; formal analysis, J.G.; investigation, J.G.; resources, C.M. and S.T.M.; data curation, J.G.; writing—original draft preparation, J.G.; writing—review and editing, C.M.; scientific proofreading, C.M. and S.T.M.; supervision, C.M. and S.T.M.; project administration, C.M.; funding acquisition for air fare, C.M.; publication fee, S.T.M. All authors have read and agreed to the published version of the manuscript.

Funding

This study was supported by a PhD scholarship to J.G. from the Government of Malaysia through Universiti Malaysia Sabah and the Ministry of Higher Education of Malaysia. J.G. received financial support from the New Zealand Grassland Association to attend the New Zealand Grassland Conferences in Tauranga, Alexandra, and Masterton, New Zealand.

Institutional Review Board Statement

Not applicable.

Data Availability Statement

The data presented in this study are available within the article and in Supplementary Materials stated above.

Acknowledgments

We thank the owners of Farms A and B and the manager of Farm C for sharing their diaries and knowledge about farming activities on their lands and for actively participating in this study. We also thank Tony Rhodes for verifying various points of system information and Rob Gibson of B+LNZ for providing the statistical data for New Zealand hill country sheep and beef cattle production systems.

Conflicts of Interest

The authors declare no conflict of interest.

References

  1. Lopez, I.F.; Valentine, I.; Lambert, M.G.; Hedderley, D.I.; Kemp, P.D. Plant functional groups in a heterogeneous environment. J. Agric. Res. 2006, 49, 439–450. [Google Scholar] [CrossRef]
  2. ARC. The Nutrient Requirements of Ruminant Livestock; Commonwealth Agricultural Bureaux: Slough, UK, 1980. [Google Scholar]
  3. AFRC. Energy and Protein Requirements of Ruminants; CAB International: Wallingford, UK, 1993. [Google Scholar]
  4. Frater, P.; Howarth, S.; McEwen, G.J. Livestock feed intake assumptions in decision support tools; A stocktake of the current science and assumptions used by livestock models. J. N. Z. Grassl. 2015, 77, 19–22. [Google Scholar] [CrossRef]
  5. Duranton, C.; Matthew, C. Impact of introducing a herb pasture area into a New Zealand sheep and beef hill country farm system: A modelling analysis. Front. Agric. Sci. Eng. 2018, 5, 87–97. [Google Scholar] [CrossRef] [Green Version]
  6. Carswell, A.M.; Gongadze, K.; Misselbrook, T.H.; Wu, L. Impact of transition from permanent pasture to new swards on the nitrogen use efficiency, nitrogen and carbon budgets of beef and sheep production. Agric. Ecosyst. Environ. 2019, 283, 106572. [Google Scholar] [CrossRef] [PubMed]
  7. Rotz, C.A.; Kamphuis, G.H.; Karsten, H.D.; Weaver, R.D. Organic dairy production systems in Pennsylvania: A case study evaluation. J. Dairy Sci. 2007, 90, 3961–3979. [Google Scholar] [CrossRef] [PubMed]
  8. Basher, L.R.; Botha, N.; Dodd, M.B.; Douglas, G.B.; Lynn, I.; Marden, M.; McIvor, I.R.; Smith, W. Hill Country Erosion: A Review of Knowledge on Erosion Processes, Mitigation Options, Social Learning and Their Long-term Effectiveness in the Management of Hill Country Erosion; Landcare Research New Zealand Ltd.: Palmerston North, New Zealand, 2008. [Google Scholar]
  9. Matthew, C.; Horne, D.J.; Baker, R.D. Nitrogen loss: An emerging issue for the ongoing evolution of New Zealand dairy farming systems. Nutr. Cycl. Agroecosyst. 2010, 88, 289–298. [Google Scholar] [CrossRef]
  10. White, T.A.; Snow, V.O.; King, W.M. Intensification of New Zealand beef farming systems. Agric. Syst. 2010, 103, 21–35. [Google Scholar] [CrossRef]
  11. Butler, B.M.; Matthew, C.; Heerdegen, R.G. The greenhouse effect—What consequences for seasonality of pasture production. Weather Clim. 1990, 10, 55–60. [Google Scholar] [CrossRef]
  12. Supplement to the New Zealand Sheep and Beef Farm Survey. The Economic Service Publication No. 1873 (1980–81); New Zealand Meat and Wool Boards’ Economic Service: Wellington, New Zealand, 1983. [Google Scholar]
  13. Supplement to the New Zealand Sheep and Beef Farm Survey. The Economic Service Publication No. 1893 (1981–82); New Zealand Meat and Wool Boards’ Economic Service: Wellington, New Zealand, 1984. [Google Scholar]
  14. Supplement to the New Zealand Sheep and Beef Farm Survey. The Economic Service Publication No. 1979 (1985–86); New Zealand Meat and Wool Boards’ Economic Service: Wellington, New Zealand, 1988. [Google Scholar]
  15. New Zealand Sheep and Beef Farm Survey. The Economic Service Publication No. 1989; New Zealand Meat and Wool Boards’ Economic Service: Wellington, New Zealand, 1988. [Google Scholar]
  16. New Zealand Sheep and Beef Farm Survey. The Economic Service Publication No. 2006; New Zealand Meat and Wool Boards’ Economic Service: Wellington, New Zealand, 1989. [Google Scholar]
  17. New Zealand Sheep and Beef Farm Survey. The Economic Service Publication No. 2020; New Zealand Meat and Wool Boards’ Economic Service: Wellington, New Zealand, 1990. [Google Scholar]
  18. New Zealand Sheep and Beef Farm Survey. The Economic Service Publication No. 2041; New Zealand Meat and Wool Boards’ Economic Service: Wellington, New Zealand, 1991. [Google Scholar]
  19. New Zealand Sheep and Beef Farm Survey. The Economic Service Publication No. 2052; New Zealand Meat and Wool Boards’ Economic Service: Wellington, New Zealand, 1992. [Google Scholar]
  20. New Zealand Sheep and Beef Farm Survey. The Economic Service Publication No. 2075; New Zealand Meat and Wool Boards’ Economic Service: Wellington, New Zealand, 1993. [Google Scholar]
  21. New Zealand Sheep and Beef Farm Survey. The Economic Service Publication No. 2093; New Zealand Meat and Wool Boards’ Economic Service: Wellington, New Zealand, 1994. [Google Scholar]
  22. New Zealand Sheep and Beef Farm Survey. The Economic Service Publication No. 2109; New Zealand Meat and Wool Boards’ Economic Service: Wellington, New Zealand, 1995. [Google Scholar]
  23. New Zealand Sheep and Beef Farm Survey. The Economic Service Publication No. 2126; Meat and Wool Economic Service of New Zealand: Wellington, New Zealand, 1996. [Google Scholar]
  24. New Zealand Sheep and Beef Farm Survey. The Economic Service Publication No. G2135; Meat and Wool Economic Service of New Zealand: Wellington, New Zealand, 1997. [Google Scholar]
  25. New Zealand Sheep and Beef Farm Survey. The Economic Service Publication No. G2150; Meat and Wool Economic Service of New Zealand: Wellington, New Zealand, 1998. [Google Scholar]
  26. New Zealand Sheep and Beef Farm Survey. The Economic Service Publication No. G2170; Meat and Wool Economic Service of New Zealand: Wellington, New Zealand, 1999. [Google Scholar]
  27. New Zealand Sheep and Beef Farm Survey. The Economic Service Publication No. G2201; The Economic Service: Wellington, New Zealand, 2000. [Google Scholar]
  28. New Zealand Sheep and Beef Farm Survey. The Economic Service Publication No. G2235; The Economic Service: Wellington, New Zealand, 2001. [Google Scholar]
  29. New Zealand Sheep and Beef Farm Survey. The Economic Service Publication No. G2275; Meat and Wool Innovation, Economic Service: Wellington, New Zealand, 2002. [Google Scholar]
  30. Gobilik, J. Considerations of Feed Demand and Supply for the Evolution and Expansion of Beef Cattle Farming in Sabah, East Malaysia. Ph.D. Thesis, Massey University, Palmerston North, New Zealand, 20 April 2017. [Google Scholar]
  31. Parker, W.J.; Lowe, K.I. Riverside Annual Review 1/7/80–30/6/81; Massey University: Palmerston North, New Zealand, 1981. [Google Scholar]
  32. Parker, W.J. Riverside Annual Review 85/86; Massey University: Palmerston North, New Zealand, 1986. [Google Scholar]
  33. Webby, R.W.; Bywater, A.C. Principles of feed planning and management. In Pasture and Supplements for Grazing Animals; Rattray, P.V., Brookes, I.M., Nicol, A.M., Eds.; New Zealand Society of Animal Production: Wellington, New Zealand, 2007; Volume 14, pp. 189–220. [Google Scholar]
  34. Nicol, A.M.; Brookes, I.M. The metabolisable energy requirements of grazing livestock. In Pasture and Supplements for Grazing Animals; Rattray, P.V., Brookes, I.M., Nicol, A.M., Eds.; New Zealand Society of Animal Production: Wellington, New Zealand, 2007; Volume 14, pp. 151–172. [Google Scholar]
  35. McRae, A.F. Tuapaka Beef Farm: Seasons Three and Four (and a New Direction); Massey University: Palmerston North, New Zealand, 1987. [Google Scholar]
  36. Machado, C.F.; Morris, S.T.; Hodgson, J.; Fathalla, M. Seasonal changes of herbage quality within a New Zealand beef cattle finishing pasture. N. Z. J. Agric. Res. 2005, 48, 265–270. [Google Scholar] [CrossRef]
  37. Morris, S.T.; Smeaton, D. Profitable Farming of Beef Cows; Meat and Wool New Zealand: Hamilton, New Zealand, 2009. [Google Scholar]
  38. National Institute of Water and Atmospheric Research (NIWA). New Zealand’s National Climate Database. Available online: https://cliflo.niwa.co.nz (accessed on 1 August 2013).
  39. Radcliffe, J.E., VII. Masterton (Wairarapa) and Maraekakaho (Hawke’s Bay). N. Z. J. Exp. Agric. 1975, 3, 259–265. [Google Scholar] [CrossRef] [Green Version]
  40. Thompson, C.S. The Weather and Climate of the Wairarapa Region; New Zealand Meteorological Service: Wellington, New Zealand, 1982. [Google Scholar]
  41. Beef + Lamb New Zealand Ltd. Annual Report 2011–2012. Available online: https://beeflambnz.com/sites/default/files/content-pages/2011-12-blnz-annual-report.pdf (accessed on 2 February 2014).
  42. Morris, S.T. Sheep and beef cattle production systems. In Ecosystem Services in New Zealand—Conditions and Trends; Dymond, J.R., Ed.; Manaaki Whenua Press: Lincoln, New Zealand, 2013; pp. 79–84. [Google Scholar]
  43. Morris, S.T. The New Zealand beef cattle industry—Presidential address 2012. In Proceedings of the New Zealand Society of Animal Production; New Zealand Society of Animal Production: Hamilton, New Zealand, 2013; Volume 73, pp. 1–4. Available online: http://www.nzsap.org/system/files/proceedings/ab13001.pdf (accessed on 10 October 2013).
  44. Morris, S.T.; Brookes, I.M.; Parker, W.J.; McCutcheon, S.N. Biological efficiency: How relevant is this concept to beef cows in a mixed livestock, seasonal pasture supply context? In Proceedings of the New Zealand Society of Animal Production; New Zealand Society of Animal Production: Palmerston North, New Zealand, 1994; Volume 54, pp. 333–336. Available online: http://www.nzsap.org/system/files/proceedings/1994/ab94082.pdf (accessed on 21 August 2013).
  45. Brookes, I.M.; Lowe, K.I.; Garrick, D.J. Modelling the feed requirements of cross-bred sheep. In Proceedings of the New Zealand Society of Animal Production; New Zealand Society of Animal Production: Palmerston North, New Zealand, 1998; Volume 58, pp. 161–164. Available online: http://www.nzsap.org/system/files/proceedings/1998/ab98048.pdf (accessed on 6 April 2013).
  46. Mackay, A.D.; Rhodes, A.P.; Power, I.; Wedderburn, M.E. Has the eco-efficiency of sheep and beef farms changed in the last 20 years? In Proceedings of the New Zealand Grassland Association; New Zealand Grassland Association: Gore, New Zealand, 2012; Volume 74, pp. 11–16. Available online: https://www.grassland.org.nz/publications/nzgrassland_publication_2263.pdf (accessed on 10 June 2013).
  47. Da Silva, S.C.; Hodgson, J.; Matthew, C.; Matthews, P.N.P.; Holmes, C.W. Herbage production and animal performance on perennial ryegrass/white clover dairy pastures under alternative spring grazing managements. J. Agric. Sci. Camb. 2004, 142, 97–108. [Google Scholar] [CrossRef]
  48. Dove, H.; Mayes, R.W. The use of plant wax alkanes as marker substances in studies of the nutrition of herbivores: A review. Aust. J. Agric. Res. 1991, 42, 913–952. [Google Scholar] [CrossRef]
  49. Kelly, D.N.; Murphy, C.; Sleator, R.D.; Judge, M.M.; Conroy, S.B.; Berry, D.P. Feed efficiency and carcass metrics in growing cattle. J. Anim. Sci. 2019, 97, 4405–4417. [Google Scholar] [CrossRef] [PubMed]
  50. National Institute of Water and Atmospheric Research (NIWA). Climate Change Scenarios for New Zealand. 2021. Available online: https://niwa.co.nz/our-science/climate/information-and-resources/clivar/scenarios (accessed on 1 June 2021).
  51. OECD/FAO. OECD-FAO Agricultural Outlook 2020–2029; FAO, Rome/OECD Publishing: Paris, France, 2020. [Google Scholar] [CrossRef]
  52. Beef + Lamb New Zealand Ltd. Economic Service Sheep and Beef Farm Survey, Taranaki/Rangitikei/Manawatu, 2020. Forecast and Quintile Analysis of Final 2018–2019 Survey Data. Available online: https://beeflambnz.com/sites/default/files/data/files/2019%20WNI.pdf (accessed on 1 June 2021).
  53. Nudda, A.; Buffa, G.; Atzoria, A.S.; Cappai, M.G.; Caboni, P.; Fais, G.; Pulina, G. Small amounts of agro-industrial byproducts in dairy ewes diets affects milk production traits and hematological parameters. An. Feed Sci. Technol. 2019, 251, 76–89. [Google Scholar] [CrossRef]
  54. Matthew, C.; Osborne, M.A.; Liu, Y.; Duan, X.; Hou, F. Winter rotation length effect on pasture production and animal performance. J. N. Z. Grassl. 2017, 79, 181–187. [Google Scholar] [CrossRef]
  55. Suckling, F.E.T. The effects of topdressing and oversowing hill pastures. N. Z. J. Agric. Res. 1959, 2, 153–164. [Google Scholar] [CrossRef]
  56. Lambert, M.G.; Clark, D.A.; Grant, D.A.; Costall, D.A.; Fletcher, R.H. Influence of fertiliser and grazing management on North Island moist hill country. 1. Herbage accumulation. N. Z. J. Agric. Res. 1983, 26, 95–108. [Google Scholar] [CrossRef] [Green Version]
  57. Chobtang, J.; Ledgard, S.F.; McLaren, S.J.; Donaghy, D.J. Life cycle environmental impacts of high and low intensification pasture-based milk production systems: A case study of the Waikato region, New Zealand. J. Clean. Prod. 2017, 140, 664–674. [Google Scholar] [CrossRef]
  58. Matthews, P.N.P.; Hodgson, J.; White, J.G.H. Livestock farming systems in New Zealand. In New Zealand Pasture and Crop Science; White, J., Hodgson, J., Eds.; Oxford University Press: Melbourne, Australia, 1999; pp. 133–151. [Google Scholar]
  59. McCall, D.G.; Tither, P.M. Use of the Stockpol computer decision-support program in commercial consultancy. In Proceedings of the New Zealand Grassland Association; New Zealand Grassland Association: Masterton, New Zealand, 1993; Volume 55, pp. 207–208. Available online: https://www.nzgajournal.org.nz/index.php/ProNZGA/article/view/2070/1698 (accessed on 15 November 2013).
  60. Payen, S.; Falconer, S.; Carlson, W.; Yanga, W.; Ledgard, S.F. Eutrophication and climate change impacts of a case study of New Zealand beef to the European market. Sci. Total Environ. 2020, 710, 136120. [Google Scholar] [CrossRef]
  61. Whitehead, D.; Edwards, G.R. Assessment of the application of gibberellins to increase productivity and reduce nitrous oxide emissions in grazed grassland. Agric. Ecosyst. Environ. 2015, 207, 40–50. [Google Scholar] [CrossRef]
  62. Gobilik, J.; Adam, L.; Punimin, A.; Harun, A.; Morris, S.T.; Matthew, C.; Yeo, B.K. Feed profile of a cut-and-carry feedlot cattle farming system in Sabah and implications for feedlot feed management. Trans. Sci. Technol. 2018, 5, 93–105. [Google Scholar]
Figure 1. Annual herbage supply (○) from GROW, feed demand (●) from MEB, and animal stock units (SU) per hectare (+) on the case-study farms and Average System (B+LNZ Class IV, medium slope, New Zealand southern North Island hill country sheep and beef cattle production system) from the 1980s to 2010–2011.
Agriculture 11 00531 g001
Table 1. Changes in average production area, effective area, sheep, cattle, animal stock units (SU), lambing and calving percentages, and chemical inputs in New Zealand southern North Island sheep and beef cattle systems from 1980 to 2011. All values are expressed on a per production system basis. Data were obtained from various B+LNZ sources as described in the text.
System Information1980–19811985–19861990–19911995–19962000–20012005–20062010–2011
Production area (ha)398396408433469493498
Effective area (ha)361363376397421437436
Effective area (%)90.791.792.291.789.888.687.5
Hay and silage (ha)67510889
Sheep (head)3118313928172542256927982532
Sheep SU2837287425692315233125382300
Sheep SU ha−17.867.926.835.835.545.815.28
Sheep:Cattle (SU)70:3072:2865:3556:4458:4259:4158:42
Cattle (head)254233290370348372347
Cattle SU1236112913941788167517841658
Cattle SU ha−13.423.113.714.53.984.083.8
Lambing (%)100.9100100.6107.1110.1125.7116.1
Calving (%)84.883.385.784.583.581.680
Nitrogen (T)0.20.51.22.45.52.7
Phosphorus (T)2.13.76.29.48.46.7
Sulfur (T)2.73.97.111.28.58.4
Potassium (T)0.70.71.82.21.91.4
Total Fertilizer (T)62.426.039.664.6103.691.182.5
Calculation of animal stock units (SU) follows the definition used by Beef + Lamb New Zealand (https://beeflambnz.com/data-tools/benchmarking-tool, accessed on 2 February 2014).
Table 2. Changes in effective area, number of sheep and cattle, animal stock units (SU), lambing and calving percentages, and chemical inputs on the case-study farms from the 1980s to 2010–2011.
System InformationFarm A Farm B Farm C
1985–19862010–20111980–19812010–20111980–19812010–2011
Effective area (ha)3458216701081670677
Hay or silage (ha)00006333
Precipitation (mm)10941287160213481560927
Temperature (°C)12.813.412.81312.613.2
Sheep (head)30804100653112,36411,5746750
Sheep SU235930044815862088304829
Sheep SU ha−16.83.67.28.013.17.1
Sheep:Cattle (SU)57:4334:6669:3180:2090:1081:19
Cattle (head)4031288453441221238
Cattle SU181558082192208910241169
Cattle SU ha−15.37.13.31.91.51.7
Lambing (%)79122123123105131
Calving (%)NBNB899495100
Nitrogen (kg ha−1yr−1)039.207.2040
Phosphorus (kg ha−1yr−1)20.322.9222529.20.0 A
Potassium (kg ha−1yr−1)000000.0 A
Sulfur (kg ha−1yr−1)002727020 A
Total fertilizer (kg ha−1yr−1)20.362.14959.229.240
Lime (kg ha−1yr−1)00045410341.5 A
Olsen P16–1919–2912181425 A
Copper04 B0000
A Riverside Farm leaflet (www.massey.ac.nz, accessed on 12 June 2013). B Four treatments per year. NB = No breeding cattle.
Table 3. Change in feed demand and herbage (feed) supply on the Average System and case-study farms between the 1980s and 2010–2011.
Feed InformationAverage SystemFarm AFarm BFarm C
1980–19812010–20111985–19862010–20111980–19812010–20111980–19812010–2011
Feed demand A
Total, t DM ha−1 yr−17.435.76 C7.947.046.016.258.215.64 A
Off farm, t DM ha−1 yr−1NDND0000.3300
Herbage (feed) supply B
Total, t DM ha−1 yr−19.648.708.877.797.277.418.616.34
Estimate of utilization (%)7766909083849589
A Including feed demand of grazing in dairy cattle; theoretically Feed demand = Herbage harvested, which was calculated using the Excel MEB model. B Herbage supply was derived using the GROW model. C Including feed demand of grazing-in dairy cattle. Average System = B+LNZ Class IV, medium slope, New Zealand southern North Island hill country sheep and beef cattle production systems as calculated in this study. ND = Not determined, because stock carried off farm was not reported in the annual farm survey.
Table 4. Changes in feed conversion efficiency on the Average System and case-study farms between the 1980s and 2010–2011.
Feed Conversion InformationAverage SystemFarm AFarm BFarm C
1980–19812010–20111985–19862010–20111980–19812010–20111980–19812010–2011
Feed consumption per animal class
* Sheep, kg DM ha−149833299375322504214509172844741
* Beef cattle, kg DM ha−1244424304184479117941049908888
Dairy cattle, kg DM ha−10360000015
Feed conversion per product
kg DM kg sheep + cattle carcass−15439443244436231
kg DM kg sheep carcass−165477648464110046
kg DM kg cattle carcass−14031322839522416
kg DM per kg lamb weaned2519281818142318
kg DM per lamb weaned574611672661417450649490
kg DM per kg calf weaned2822NBNB38371916
kg DM per calf weaned41823239NBNB3305349828522653
* Sheep and beef cattle on New Zealand Average System are heavier in recent years, meaning meat production per kg DM ha−1 is also higher. Average System = B+LNZ Class IV, medium slope, New Zealand southern North Island hill country sheep and beef cattle production system as calculated in this study. NB = No breeding cattle.
Table 5. Changes in annual carcass production on the Average System and case-study farms between the 1980s and 2010–2011. Lambing and calving percentages are presented in Table 1 and Table 2.
Carcass InformationAverage SystemFarm AFarm BFarm C
1985–19862010–20111980–19812010–20111980–19812010–20111980–19812010–2011
kg sheep + cattle carcass ha−1137147181219137148146222
kg sheep carcass ha−1767049479112873104
kg cattle carcass ha−16177132172462074188
kg lamb weaned per ewe2339184328383035
kg calf weaned per cow12513700140159140171
Lamb carcass weight, kg hd−113.9 A18.2 B14.716.311177.812.0
Steer carcass weight, kg hd−1277 C316 C0NA277308188240
Bull carcass weight, kg hd−1252 C310 C262260296329NRNR
A 1990 and B 2010: from B+LNZ (www.beeflambnz.com, accessed on 2 February 2014). C From [42,43]. Average System = B+LNZ Class IV, medium slope, New Zealand southern North Island hill country sheep and beef cattle production system as calculated in this study. NA = Not applicable; owner of Farm A did not rear steers in 1980–1985. NR = No record.
Publisher’s Note: MDPI stays neutral with regard to jurisdictional claims in published maps and institutional affiliations.

