Abstract
Pomegranate is one of the oldest known fruit crops, well adapted to hot and dry areas and successfully grown in Mediterranean countries. During the last two decades, numerous publications have revealed the traditionally known associations between pomegranate consumption and health benefits, which led to increased demand by consumers and expansion in cultivation areas. Pomegranate is well adapted to areas with diverse pedoclimatic conditions and local cultivars could provide an essential source of genes for breeding. In this study, fruit phenotypic and genetic variability, and relationships, were studied in 26 Greek and foreign pomegranate cultivars/accessions grown in an ex situ collection located in Naoussa Greece, using Inter Simple Sequence Repeat (ISSR) and Start Codon Targeted (SCoT) molecular markers. Results from the principal component analysis made on fruit phenotypic characters revealed five components that accounted for 74.8% of the total variance, the first being related to skin color parameters and the second to juice antioxidant contents and aril color. Clustering from phenotypic data allocated individuals into four clusters. A total of 184 bands were generated for all markers applied across the 26 pomegranate cultivars/accessions, with an average of 77 bands per ISSR markers and 82 bands for SCoT markers. Low variability in the phenotypic and genotypic level was indicated; nevertheless, results from the association study between phenotypic traits and molecular markers that were obtained using Multiple Regression Analysis (MRA) could prove valuable for marker-assisted breeding programs, especially from SCoT markers that were found to be strongly or averagely associated with the morphological traits and chemical components.
1. Introduction
Pomegranate (Punica granatum L.) is said to be originated from central Asia [1]. However, due to its high level of adaptability, pomegranate trees can be cultivated in a wide range of soil and climates in many different geographical places including the Mediterranean basin, California, and Asia. Pomegranate, as mentioned by Dioscorides and Hippocrates, had a very important place in the ancient cultures of the Mediterranean countries, while it was among the first crops, together with figs, dates, olives, and grapes, that was cultivated [1,2,3]. Pomegranate’s domestication is reported to have begun around 3000–4000 BC in Iran and in India [4]. Today, more than 500 varieties of pomegranates are cultivated throughout the world [2]. The pomegranate was formerly an underused crop cultivated for local markets. However, since 2000, numerous scientific studies report the antimicrobial, antioxidant, anticancer, and anti-inflammatory properties of pomegranate fruit, peel, leaves, flowers, and roots that contain bioactive phytochemicals, thus confirming the already known benefits for human health [5,6,7].
These findings have increased the public awareness, along with the consumption of pomegranate fruit resulted in an increased cultivation worldwide. Important pomegranate producers are India, Iran, Turkey, China, United States of America, Israel, Egypt, Spain, Afghanistan, Tunisia, Azerbaijan, Morocco, Argentina, Brazil, Chile, Peru, South Africa, Australia, and Italy [3].
Data about the world total area and world total production are not available due to the rapid increase in cultivation occurring during the recent years. In 2014 it was estimated to be around 3 million tons and in 2017 around 3.8 million tons [3]. According to the data collected by the Hellenic Statistical Authority [8], pomegranate cultivation in Greece counts 1,582,872 trees and their production extends almost 42,000 tons. In Greece, pomegranate was traditionally grown in Peloponissos, southern Greece, using the local cv. Ermioni, while new plantations were recently established throughout the country using mainly the cv Wonderful and to a lesser extent Hicaznar, Acco and No 116/17.
Phenotypic observations on morphological traits are implemented traditionally and are useful for preliminary evaluation of pomegranate genotypes because it is a fast and simple method and can be used as a general approach for assessing genetic diversity. Implementing multivariate statistical methods, as principal component analysis (PCA) and cluster analysis of the phenotypic data, can be very valuable for screening cultivars, as mentioned in studies with almond [9], Cerasus subgenus [10] and pomegranate [11,12]. Furthermore, DNA molecular markers, such as Inter Simple Sequence Repeats (ISSR), provide valuable information on the genetic diversity and genetic relationships of plants. The availability of information on the genetic relationships between varieties and/or accessions is very important for breeding programs. Different molecular markers, such as RAPD, RFLP, AFLP, SSR, ISTR, ISSR, and SRAP, which vary in their complexity and the generation of polymorphic bands, were used efficiently to determine genetic diversity among pomegranate cultivars [12,13,14,15,16].
Inter Simple Sequence Repeats (ISSR), are very efficient, combining the advantages of both RAPD and SSR markers. Furthermore, they are characterized with high levels of polymorphism, along with sensitivity, stability and very good repeatability and have been widely used for the genetic evaluation of many pomegranate cultivars across different countries [15,16]. Recently, new alternative markers techniques have been introduced, such as Start Codon Targeted (SCoT) polymorphisms. SCoT markers were first described by Collard and Mackill [17], they are based on short conserved sequences flanking to or surrounding of the ATG start (or initiation) codon and use a single 18-mer primer in PCR amplification reactions using higher annealing temperature (50 °C). This dominant marker technique is effortless and provides reproducible high polymorphism. SCoT markers have been used in genetic diversity studies, cultivar identification and for quantitative trait loci (QTL) mapping and DNA fingerprinting in wheat, rice, peanut, and grape [18,19,20], and in fruit trees (mango, citrus species and more) [21,22].
The ex situ collections may serve effectively to pomegranate local varieties conservation and provide a valuable tool for comparing local and introduced genetic material and many collections have been evaluated in Cyprus [23], Italy [24,25], Croatia [26], Tunisia [27] and Turkey [28].
The present study is an attempt to describe the variation among 26 pomegranate cultivars/accessions selected from different areas in Greece and compare them with foreign commercial cultivars. Specifically, the objectives of the present study were (a) to determine the variability in the fruit-related parameters and find whether associations exist between fruit physical and chemical properties, (b) to determine the overall degree of genetic polymorphism in the cultivars studied, using molecular markers (ISSR and SCoT) and (c) explore associations between phenotypic traits and molecular markers as a pre-breeding approach.
2. Materials and Methods
2.1. Plant Material
During various expeditions, pomegranate accessions/cultivars with distinct characters were identified and collected from private collections, commercial groves, or nurseries across regions in northern (Imathia, Drama, Thrace, and Mount Athos), central (Evrytania) and southern (Peloponissos) Greece while some are of unknown origin in Greece (Table 1).

Table 1.
Origin of the pomegranate accession/genotypes maintained in the ex situ collection at the Department of Deciduous Fruit Trees in Naoussa.
The accessions/cultivars were established in an ex situ collection together with commercial cultivars originating from Israel (cv. Acco) and Turkey (cv. Wonderful originated from four different sources in Greece and cv. Hicaznar). The collection was planted at the Department of Deciduous Fruit Trees in Naoussa (40°37′13.40″ N; 22°06′59.80″ E, at 119 masl). The annual mean temperature is 15.7 °C and precipitation is 717 mm, with lower values in the summer and greater in the winter season period. The soil pH is neutral (pH 7.4) with medium-heavy mechanical composition. The trees were planted in a randomized block design of six trees per genotype in two replicate trees per block. Fruit phenotypic characterization was performed on a six-fruit sample harvested only from the pomegranate accessions/cultivars presented in Table 2 and Table 3.
Table 2.
Means (±sterror) for fruit fresh weight (g), % edible portion, % juice/fruit, % juice/edible portion, 100 aril weight (g), total soluble solid content (TSS) (°Brix), total acidity (TA) (g 100 mL−1), maturity index (MI) (TSS/TA) and seed hardness (1 soft; 2 medium; 3 hard) in 26 pomegranate accessions/cultivars. Maximum, minimum, covariate coefficient (CV%) and least significant difference (LSD) are presented.
Table 3.
Means (±sterror) for the fruit skin color parameters L, a*, b*, Hue angle and Chroma and aril color (1, white; 2 = rose-white; 3, rose; 4, dark-rose; 5, rose-red; 6, red; 7, very red) in 26 pomegranate accessions/cultivars. Maximum, minimum, covariate coefficient (CV%) and least significant difference (LSD) are presented.
2.2. Morphological Traits
Fruit was harvested when commercially ripe and according to their size and color, transferred to the laboratory and sorted for size and uniformity of shape. Fruit was hand cracked, the arils were separated, the skin and aril weight were measured, and the % edible portion was calculated. Juice was hand extracted from a known aril portion weight, weighted and the % juice per fruit and edible portion were calculated. The CIE color parameters L* (brightness or lightness; 0 = black, 100 = white), a* (−a* = greenness, +a* = redness) and b* (−b* = blueness, +b* = yellowness) were measured using a Minolta chromatometer (Minolta CR-400, Tokyo, Japan) and the hue (H*) (0° = red-purple, 90° = yellow, 180° = bluish-green, 270° = blue) and Chroma (C*), degree of departure from grey to pure chromatic color) parameters were calculated according to McGuire [29]. Readings were taken close to the stalk of each fruit exocarp. Aril color (white, rose-white, rose, dark-rose, rose-red, red, very red) and tegmen hardness (soft, medium, hard) were characterized by a panel of 5 people, in accordance with the “Descriptor’s list for pomegranate” set up in the framework of EC Project GENRES 29 “Conservation, Evaluation, Exploitation and Collection of Minor Fruit Tree Species” [30].
2.3. Chemical Analyses
At harvest, total soluble solid (TSS) and total acidity (TA) contents were determined in pomegranate juice from a six-fruit sample per cultivar/accession. TSS was measured using a digital refractometer (model PR-1, Atago, Japan), and TA by titration to pH 8.2 with 0.1 N NaOH and expressed as citric acid content (g 100 mL−1). The maturity index (MI) was calculated as the ratio TSS/TA.
The Total phenolics (TPs) content was measured using a modified Folin–Ciocalteu colorimetric method [31]. The reaction mixture consisted of 0.1 mL of 1:8 diluted juice and 0.4 mL water were mixed with 2.5 mL of 1:10 diluted Folin–Ciocalteu’s phenol reagent, followed by 2 mL of 7.5% (w/v) sodium carbonate. After 5 min at 50 °C, absorbance was measured at 760 nm. Phenol content was estimated from a standard curve of gallic acid and results expressed as mg gallic acid equivalents (GAE) 100 L−1 juice.
Total antioxidant capacity (TAC) was evaluated using the 2,2-diphenyl-1-picrylhydrazyl (DPPH). Antioxidant activity was measured using the stable 1,1-diphenyl-2-picryl hydrazyl (DPPH) free radical [32], which has an intense violet color, but turns colorless as unpaired electrons are sequestered by antioxidants. Reaction mixtures containing 20 μL sample and 3 mL of 106.5 μM DPPH in MeOH, were vortexed, and then held at room temperature for 2 h. The absorbances of the reaction mixtures were measured at 517 nm and total antioxidant capacity TAC was estimated from a standard curve of ascorbic acid and results expressed as mg ascorbic acid equivalents (AAE) L−1 juice.
2.4. Molecular Analysis
Total DNA was extracted from young fresh leaves using the CTAB (cetyl trimethylammonium bromide) protocol as described by Doyle and Doyle [33]. DNA quality and concentration were measured by Quawell UV-Vis Spectrophotometer (Q5000).
Twenty molecular markers (nine ISSR markers and 11 SCoT markers were selected after a preliminary test for the genotypic characterization of the pomegranate cultivars. PCR amplifications for the ISSR markers were performed in 20 μL reaction volume containing 20 ng of genomic DNA, 1× PCR buffer, 0.4 μM of primer, 0.2 mM of DNTPs, 1 U kapa Taq polymerase. ISSR-PCR reactions were performed using a SureCycler 8800 thermocycler (Agilent Technologies, California, USA) under the cycling profile: first step at 94 °C for 4 min, followed by 35 cycles segmented in 30 s at 94 °C, 30 s at varied temperature based on primers and 40 s at 72 °C, and a final extension at 72 °C for 7 min. PCR amplifications for the SCoT markers were performed in 20 μL reaction volume containing 20 ng of genomic DNA, 1× PCR buffer, 1μM of primer, 0.25 mM of DNTPs, 1 U kapa Taq polymerase. SCoT-PCR reactions were performed using a SureCycler 8800 thermocycler (Agilent Technologies, California, USA) under the cycling profile: first step at 94 °C for 5 min, followed by 40 cycles segmented in 30 s at 94 °C, 1 min and 30 s at 50 °C and 1 min and 30 s at 72 °C, and a final extension at 72 °C for 5 min. PCR products were visualized by ethidium bromide stained 1.5% agarose gels in 1× TAE buffer for ISSR and SCoT markers. A 1000 bp DNA ladder was used as a molecular-weight size marker in side lanes of each gel.
2.5. Data Analysis
2.5.1. Phenotypic Traits
Mean values, mean standard error (SE), minimum and maximum values and covariate coefficient (CV) were calculated for all the phenotypic traits. Principal Component Analysis with Varimax rotation was applied with the mean values of the phenotypic traits [34]. To determine the number of statistically significant components the latent root criterion (eigenvalue > 1) and parallel analysis was used [35]. Furthermore, the Bartlett’s test of sphericity and the Kaiser-Meyer-Olkin measure of sampling adequacy were used to test the factorability of the correlation matrix.
Hierarchical Cluster Analysis was performed with the mean values of the phenotypic traits, standardized as z-scores, to construct a dendrogram using Squared Euclidean distance and Ward’s joining method. All the statistical analysis was performed using SPSS version 20.0.0.
2.5.2. Molecular Analysis
Scoring of the DNA profiles was performed and the bands of DNA fragments for ISSR and SCoT markers were classified as present (1) or absent (0). Data were analyzed using GenAlEx 6.5 [36,37], an Excel add-in for the genetic analysis, separately for each molecular marker. Band frequencies were also calculated for each group of pomegranates depending on their origin. Genetic distance matrices were calculated, and further genetic analyses were performed, including: Analysis of Molecular Variance (AMOVA) and Principal Coordinates Analysis (PCoA). The genetic distance matrix of each molecular marker was used for the construction of the UPGMA tree with MEGA X [38]. All the above statistical analyses were repeated also for the distance matrix that resulted from the combination of the ISSR and SCoT data.
ISSR and SCoT markers’ information on number of different alleles (Na), number of effective alleles (Ne), Shannon’s Information Index (I), gene diversity (GD) was obtained through analysis with GenAlEx 6.5 [36,37], while polymorphism information content (PIC) and resolving power (Rp) were obtained through analysis with the online program Online Marker Efficiency Calculator (iMEC) [39].
To estimate the association between the molecular markers and the phenotypic traits, stepwise Multiple Regression Analysis (MRA) was performed [40], where every phenotypic trait was treated as a dependent variable and DNA fragments produced by the molecular markers were treated as independent variables. The MRA analysis was performed using SPSS version 20.0.0.
3. Results
3.1. Phenotypic Traits
Fresh fruit weight (FFW) varied considerably among the studied pomegranate accessions/cultivars as suggested by a relatively high CV of 30.5, compared with most of the rest measured parameters (CV% = 7.0–41.8, apart from TA = 85.3). Highest FFW values were found in Wonderful, Hicaznar and 11006 (536.6, 446.4 and 390.0 g, respectively) and lowest values in 11010 and Georgias (125.2 and 158.1 g, respectively).
Greatest % edible portion values were found in ‘Georgias’ and ‘Spanish’ and lowest values in ‘11018’.
One of the most important parameters, from an industrial point of view, is the fruit juice content (% juice/fruit). Accessions/cultivars with highest values were Georgias (43.5%), followed by Persephone, 11012 and Spanish, 11019, 11018 and 11016 (40.4–38.1%), while the lowest values were found in 11006 (26.8%).
The % juice/edible portion parameter gives a good idea of the palatability of arils, since it refers to the quantity of juice compared with the total weight of the arils and is related to the crude fiber content and seed size and results are adding information to the seed hardness, being also a parameter related to the palatability of arils. A relatively low variability was found in the % juice/edible portion ranging between 55.8% and 69.3% (CV% 6.2) and values were higher in 11012, Wonderful, Ermioni, 11016 and 11014, whereas lowest values were found in 11002 and Acco.
Values of the 100-aril weight ranged between 21.5 and 52.9 g (CV% 21.5) and in cvs Wonderful and Acco it was 35.8 g and 29.6 g, respectively. Highest values were found in Ermioni, Persephoni and 11018, and lowest in 11025, 11009, and 11010.
The TSS of the studied accessions/cultivars ranged between 14.8 and 19.3 °Brix and CV% was 7.0; the range observed in the Greek (14.8–19.2 °Brix) was similar to the foreign accessions/cultivars (14.8–19.3 °Brix). The TA content ranged between 0.383 and 3.148% showing the greatest CV% (85.3), with highest values found in the foreign cultivars ‘Georgias’, Hicaznar and Wonderful, followed by 11006, 11011, and 11025, whereas in the rest genotypes low TA content was found.
Results showed a wide range of maturity index (MI) in the Greek accessions studied, with values ranging between 5.0 and 45.1 while a relatively high CV% was found (41.8%). Greatest values were found in Ermioni, Persephoni, 11019, 11005 and 11012 (41.0–45.1) and lowest in Georgias, Wonderful, Hicaznar and 11011 (5–9.7).
Seed hardness is an important characteristic for sensory attribute of pomegranate fruit grown for fresh consumption; cultivars with soft seeds achieved higher sensory assessment scores than those with harder seeds. However, cultivars for the juice industry are required to have hard seeds. In the present study soft seeded accessions/cultivars were Acco, Ermioni, Persephoni, and Spanish and the rest were medium or hard seeded. All results are presented in Table 2 and Table 3.
PCA results indicated five components that account for 74.8% of the total variance (Table 4). First component (PC1) accounted for 25.3% of the total variation and contained the fruit skin color parameters (Hue angle-skin, a*-skin, L*-skin, b*-skin), except for Chroma-skin and aril color. The second component (PC2) explained the 17.4% of the total variance and contained aril color and hardness, AEAC and TPs. Furthermore, the third component (PC3) explained the 12.9% and the fourth component (PC4) the 12.8% of the total variance, respectively. PC3 is related to % juice/edible portion, % juice/fruit and 100-aril weight (g) and PC4 is related to MI, TA, FFW, and Chroma-skin. Finally, the fifth component (PC5) explained 6.4% and is related to % edible portion.
Table 4.
Eigenvalues of the five principal component axes from PCA analysis of the studied pomegranate genotypes.
Figure 1 presents the Factor Loadings for each variety in the first two Principal Components (42.7 of total variance explained). To explain almost all interesting information a Hierarchical Cluster Analysis was performed with the Factor Loadings of the 5 Principal Components (74.823% of total variance explained).
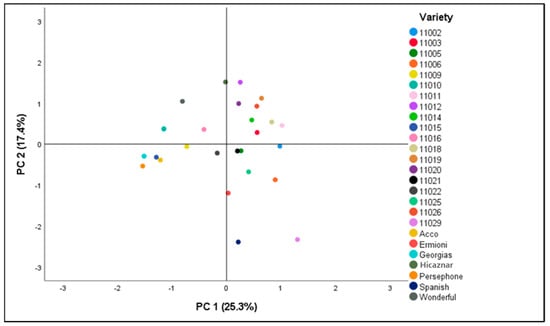
Figure 1.
Principal Component Analysis (PCA) loading plot. The points correspond to the Principal Component 1 (PC1) and Principal Component 2 (PC2) score for each variety.
According to the Hierarchical Cluster Analysis, the 26 genotypes studied were placed in 4 clusters (Figure 2). The first cluster (I) contained genotypes maintained in the ex situ collection at the Department of Deciduous Fruit Trees in Naoussa (11012, 11019, 11014, 11005, 11016, 11021, 11020, 11018, 11026), along with Ermioni and Spanish cultivars forming a subcluster. Genotypes 11002, 11029, 11022, 11025, 11003, 11006, 11011 formed a second cluster (II), while 11002 and 11029 formed a subcluster. The third cluster (III)is also composed of ex situ genotypes (11009, 11015, 11010) along with cvs Acco and Persephone. Finally, the fourth cluster (IV) contained cvs Hicaznar, Wonderful 1 and Georgias.
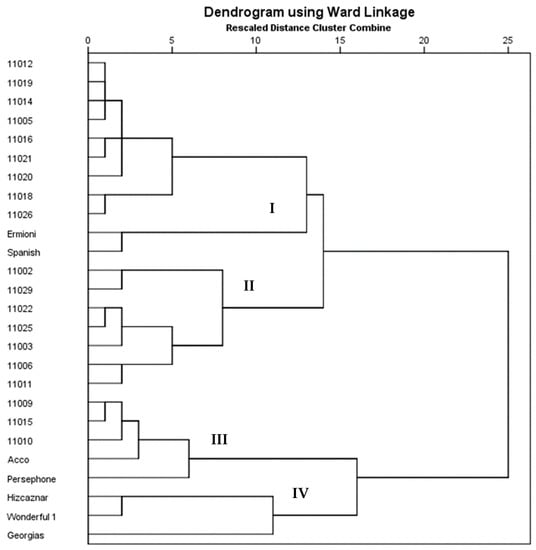
Figure 2.
Cluster analysis of the studied 26 pomegranate genotypes based on phenotypic traits.
3.2. Molecular Analysis
All 20 primers (Table 5) used in this study produced clear and reproducible bands that ranged from 190 bp to 2200 bp for ISSR markers and from 250 bp to 3800 bp for SCoT markers. A total of 184 bands were generated for all markers that were applied across the 26 pomegranate cultivars, with an average of 77 bands per ISSR markers and 82 bands for SCoT markers. A total of 32.34% of the ISSR fragments were polymorphic and only one private band was detected. A total of 26.67% of the SCoT fragments were polymorphic and six private bands were detected.
Table 5.
Details of ISSR and SCoT primers used, number of different alleles (Na), number of effective alleles (Ne), Shannon’s Information Index (I), gene diversity (GD), polymorphism information content (PIC) and resolving power (Rp) in 26 pomegranate cultivars/accessions.
Results of Analysis of Molecular Variance (AMOVA) for ISSR markers revealed percentages of 5% among populations and 95% within populations, while for SCoT markers revealed percentages of 6% among populations and 94% within populations. Principal Coordinates Analysis (PCoA) resulted in clustering the pomegranate accessions as shown in Figure 3, which agree with the obtained clusters from the dendrograms in Figure 4 and Figure 5.
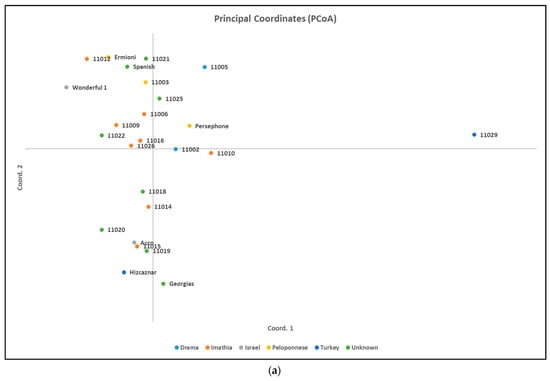
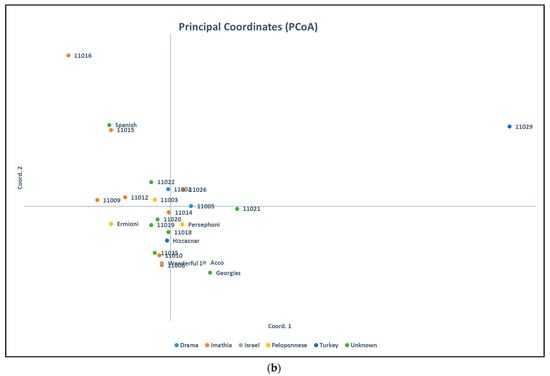
Figure 3.
Principal Coordinates Analysis for (a) ISSR molecular markers and for (b) SCoT molecular markers.
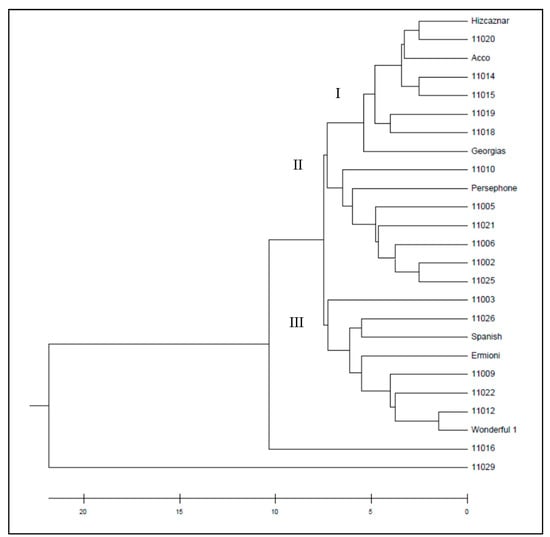
Figure 4.
UPGMA dendrogram of the studied 26 pomegranate genotypes based on 9 ISSR markers.
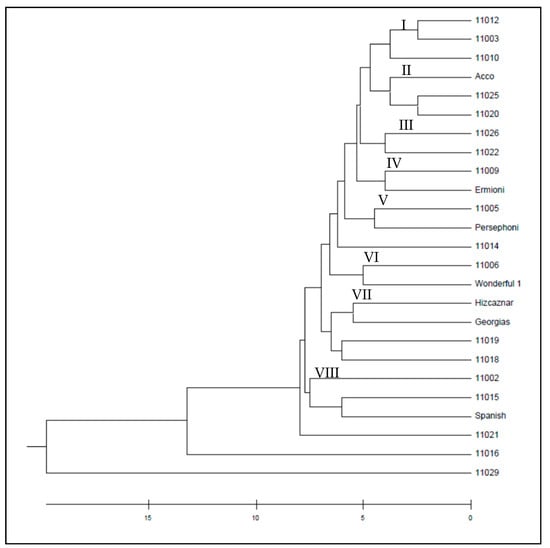
Figure 5.
UPGMA dendrogram of the studied 26 pomegranate genotypes based on 11 SCoT markers.
The dendrogram obtained from the ISSR markers by UPGMA method grouped the pomegranate cultivars into three wider clusters (Figure 4), while the UPGMA dendrogram resulted from the SCoT markers grouped the cultivars into eight smaller clusters (Figure 5). Similarities and dissimilarities between the two dendrograms can be easily detected. Hicaznar, Georgias, 11019 and 11018 belong to the same cluster in both dendrograms. Cvs Ermioni, 11009, 11026 and 11022 may belong to the same cluster according to the ISSR dendrogram but according to the SCoT markers two different clusters are formed that are very close to each other. The dendrogram obtained from the combined distance matrix of ISSR and SCoT markers, grouped the pomegranate genotypes into three clusters (Figure 6). Cultivars 11012, Wonderful 1, 11009, Ermioni, 11026, 11022, 11003, and Spanish form the first cluster. The second cluster contained 11021, 11005, Persephone, 11002, 11010, 11006, 11025, while the third cluster contained Georgias, 11019, 11018, 11015, 11014, Hicaznar, Acco, and 11020. Accessions 11016 and 11029 were not included in any cluster.
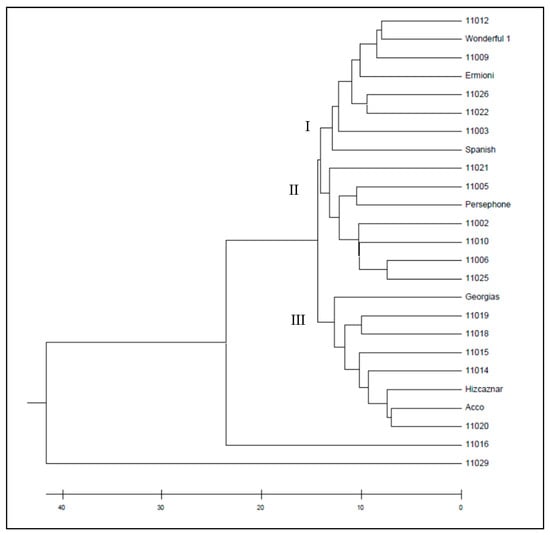
Figure 6.
UPGMA dendrogram of the studied 26 pomegranate genotypes based on the combined genetic matrix of ISSR and SCoT markers.
3.3. ISSR and SCoT Markers’ Association Study with Phenotypic Traits Using MRA
The analysis with ISSR markers revealed many markers associated with phenotypic traits that are statistically significant (R2 > 0.5). Three markers (UBC825820, UBC8271420 and UBC891450) were associated with % juice/edible portion.
A total of seven markers were associated with weight of 100 arils and one of them, (UBC820920) showed strong positive correlation, and it was statistically significant (beta coefficient = 0.744, p < 0.001) while UBC8911100 showed a strongly negative correlation (beta coefficient = −0.655, p < 0.001). A total of eight markers were identified for GAE mg L−1 juice, showing average correlation. For AEAC (mM), a total of six markers were identified and UBC880600 showed a strongly positive and statistically significant correlation (beta coefficient = 0.598, p < 0.001).
MRA analysis with SCoT fragments identified eight markers associated with % edible portion and SCoT1326830 showed a strongly positive and statistically significant correlation (beta coefficient = 0.607, p < 0.001). A total of six markers were identified for % juice/fruit and SCoT1337650 showed a strongly negative correlation (beta coefficient = −0.713, p < 0.001). Five markers were identified for TA (%w/v) and TSS/TA, respectively. Finally, SCoT13301100 showed a strongly positive correlation (beta coefficient = 0.749, p < 0.001) with TSS (Brix). All MRA results are shown in Table S1 followed by a list of all alleles (Supplementary Materials).
Identified alleles per cultivar with high and moderate positive statistically significant correlation are presented in Figure 7, while alleles with high and moderate negative statistically significant correlation are presented in Figure 8. Additional information on alleles per phenotypic trait can be found on Supplementary Materials.
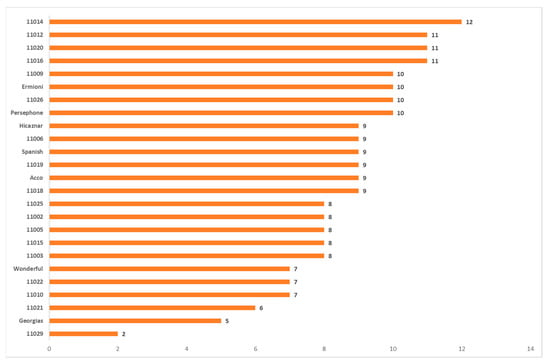
Figure 7.
Number of alleles per cultivar with high and moderate positive statistically significant correlation.
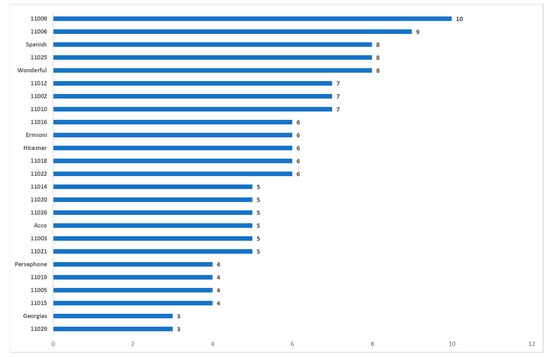
Figure 8.
Number of alleles per cultivar with high and moderate negative statistically significant correlation.
Most of the markers identified alleles with both positive and negative correlation. Interestingly, most alleles identified by SCoT markers were correlated moderately or highly negative with the phenotypic traits. According to the MRA analysis the alleles per phenotypic trait with only the positive strong or moderate correlation are: (i) for % juice/edible part: UBC825_820, (ii) for Weight of 100 arils (g): UBC820_920, (iii) for GAE mgr/1L juice: UBC820_1180, UBC880_1200, UBC891_1100, UBC811_1120, and (iv) for % juice/fruit: SCOT1339_500, SCOT1333_910. Pomegranate accessions that combine these alleles are 11012, 11014 (7 out of 8), 11016, 11020, 11026, Hicaznar and Persephone (6 out 8), 11009, 11015, 11022, Acco, Ermioni, and Spanish (5 out of 8), whereas accessions 11011, 11029, and 11021 do not contain any of the alleles.
4. Discussion
Fruit quality characteristics for the studied local accessions were evaluated and described in our previous study [41]. Results from both studies, for cultivars No 1–19 in Table 2 and Table 3, correlation was studied for the same fruit characteristics. Results showed that values were generally well correlated (r2 = 0.550–0.878), but there were differences in harvest maturity stage as depicted by changes in TSS (r2 = 0.394). Variation may be attributed to different meteorological conditions [23].
Cv Wonderful was similarly reported to exhibit relatively high FFW in various other studies [23], although it is generally known that variation may exist among different orchards in the USA which was shown to be attributed to different pollination rate affecting the aril number [42].
The % edible portion ranged between 47.0% and 65.3% and was similar to the range reported for Cypriot (48.9–69.0%) [23], Spanish (56.0–62.0%) [43], Croatian (35.7–62.1%) [26] and select USDA (41.5–64.4%) [44] germplasm/cultivars. The % edible portion is correlated negatively to skin thickness, suggesting that greatest values suggest for low skin thickness [23,41]. It is interesting that the % edible portion was relatively higher in the widely cultivated Greek cv Ermioni (58.1%) and most of the Greek accessions, as well as Cypriot germplasm [23], compared with Wonderful (49.0%) being the most widely grown cultivar worldwide.
The observed values for the % juice/edible portion parameter are in the range to those reported in other Spanish cultivars (50.3–64.2; 45.0–68.6) [45], although higher values (60–84%) have been reported in Indian germplasm [46].
The values of Greek germplasm for the 100-aril weight were greater to that reported in our previous study [41], probably due to different fruit load and age of trees. Values of 100 aril weight was similar to that reported for other Cypriot [23], Iranian [47] germplasm and UMH Germplasm Bank and commercial cultivars from Spain [48].
The levels of total soluble solid (TSS) and total acidity (TA) in the pomegranate juice are important characteristics since they result in the sensations of ‘sweetness’ and ‘sourness’ attributes related mainly to the taste of pomegranate [49]. TSS values were similar to the range observed in other collections in Cyprus (14.8–17.6), USDA (14.9–17.3%) [44], Greek (14.4–17.0%) [41], Turkish (15.5–16.9%) [50] and Israeli (13.7–17.8%) [51] and higher compared to Spanish germplasm (12.6–15.3%) [43].
Different harvest maturity standards also affect the TSS and TA values [52]. Variations are expected to occur not only due to genotypic differences but also due to environmental factors; higher temperatures are expected to result in higher TSS, lower TA and lower red coloration [53]. Moreover, in Northern Greece due to adverse weather condition during the fruit maturation period in October, such as temperature drop and rain, causing cracking and russeting damages, harvest is often forced to avoid damages [54]. In California, the harvest of Wonderful is recommended to start at TSS 17.0 °Brix and TA 1.9% [55] whereas in the present study it had relatively lower TSS and greater TA (16.3 °Brix and 2.2%, respectively). In other studies, Wonderful was also harvested at a more mature stage (Spanish collection, 7.5 °Brix and 0.8%, respectively; Cypriot, 18.4 and 1.0, respectively), resulting from the warmer climate conditions.
For the MI, many authors also mentioned wide ranges for this parameter, as seen in the present study. According to Chace et al. [56], pomegranate was appropriate for fresh market when its acidity content was lower than 1.8% and its MI between 7 and 12; when MI ranged from 11 to 16, pomegranates were quite tasty. However, the MI can be influenced by environmental conditions [57], moreover it is variety dependent and, optimally, must be defined for specific varieties [49].
According to our PCA results (Table 4 & Figure 1), traits related to fruit, aril and seed had the most discriminating power (PC1 and PC2). These results agree with previous studies that reported the importance of color, juice characteristics and fruit size [27,41,58,59]. According to PCA, correlation was detected between fruit traits and chemical properties and more specifically, PC2 related antioxidant content to aril color.
Hierarchical Cluster Analysis showed that most of the genotypes contained in the first cluster, are characterized by high values of % juice/edible portion, while the second cluster is composed of genotypes maintained in the ex situ collection. Cvs 11002 and 11029 formed a subcluster that may be due to their lowest values of % juice/edible portion. Hicaznar, Wonderful 1, and Georgias showed low values of TSS and MI and formed a fourth cluster. Cluster analysis revealed low variability among the cultivars studied, which may be due to the close relatedness of many of the genotypes. More morphological data on leaf, flower, and fruit along with other characteristics, such as harvest time and flowering time would allow an even higher characterization of pomegranate cultivars based on the phenotypic traits.
Results in our study from molecular analysis with ISSR and SCoT markers, indicated low percentage of polymorphism, which could be a result of the low diversity among the material used. Low genetic variation has also been reported in other studies [11,60,61,62]. On the contrary, higher percentage of polymorphism is reported in studies from Narzary et al. [63] and Zamani et al. [58], where large numbers of genotypes from different regions and wild genotypes were studied.
In both dendrograms resulted from ISSR (Figure 4) and SCoT markers, (Figure 5) cultivars 11016 and 11029 act as outliers forming their own clusters, since the genetic distance between them has the highest value among all the rest cultivars. Cultivar 11016 was differentiated because of the presence of numerous bands in comparison with the other cultivars. On the other hand, cv 11029 presented the least bands in comparison with the other cultivars. The clusters formed with the combined file of both distance matrices (Figure 6) are similar to the ones obtained from the SCoT markers, a fact that indicates that SCoT markers provided a higher rate of polymorphism compared to the ISSR markers. The low genetic diversity among the plant material studied which wad originated from different areas of Greece suggest that these plants either have common ancestors and/or are propagated by cuttings and not seeds. Two samples 11016 from Lefkada island and 11029 from Imvros island showed very distinctive genetic pattern, different form all the other samples always being outliers suggesting unique genetic background. Furthermore, most of the varieties were different than the American bred “wonderful”, yet the Spanish sample and a famous Greek variety “Ermioni” can be found in the same cluster.
A disagreement between the dendrograms obtained from phenotypic traits (Figure 1) and molecular markers (Figure 6) was observed, a fact that can be explained by the consequences of the environmental conditions on the cultivars’ characteristics [64,65].
The MRA method is an easy and quick approach for associating traits with markers [66,67]. The MRA tool is suitable for tree crops and MAS breeding programs [40]. MRA analysis with ISSR and SCoT markers revealed many markers associated with phenotypic traits, which are strongly positive and negative statistically significant (R2 > 0.5). Most alleles identified by SCoT markers were correlated moderately or highly negative with the phenotypic traits. These markers could prove very valuable in screening pomegranate cultivars for the desired quality traits, avoiding those that carry alleles that are negative correlated. According to the MRA analysis the alleles per phenotypic trait with only the positive strong or moderate correlation are: UBC825_820, UBC820_920, UBC820_1180, UBC880_1200, UBC891_1100, UBC811_1120, SCOT1339_500, and SCOT1333_910. Pomegranate accessions that combine many of these alleles and can be used in pyramiding for the phenotypic traits that were studied are 11012, 11014, 11016, 11020, 11026, Hicaznar, Persephone, 11009, 11015, 11022, Acco, Ermioni, and Spanish. However, accessions 11011, 11029, and 11021 did not contain any of the alleles and should be avoided in breeding programs.
5. Conclusions
This study is the first attempt to associate phenotypic traits and molecular markers in Greek pomegranate cvs. Although results from the present study indicated low variability in the phenotypic and genotypic level, many markers, especially SCoT markers, were found to be strongly or averagely associated with the morphological traits and chemical components, which were recorded for the pomegranate cultivars under study. All the information acquired in this study can be very valuable for future breeding programs as well as for conservation of genetic resources.
Supplementary Materials
The following are available online at https://www.mdpi.com/article/10.3390/agriculture11060482/s1, Table S1: Markers (ISSR/SCoT) associated with different phenotypic traits in pomegranate cultivars as revealed by MRA and the coefficients.
Author Contributions
Conceptualization, P.D. and P.M.; methodology, L.K., G.P. and E.D.P.; validation, L.K. and E.D.P.; formal analysis, P.D., L.K. and E.D.P.; investigation, G.P. and L.K.; resources, P.D., G.P. and P.M.; data curation, L.K., G.P. and E.D.P.; writing—original draft preparation, L.K., E.D.P. and P.D.; writing—review and editing, L.K., E.D.P., P.D. and P.M.; visualization, L.K. and E.D.P.; supervision, P.M. All authors have read and agreed to the published version of the manuscript.
Funding
This research was funded by the Operational Program Competitiveness, Entrepreneurship, and Innovation, under the call RESEARCH-CREATE-INNOVATE (project code: T1EDK-05438) and partly by the Operation Program Competitiveness and Entrepreneurship (EPAN ΙΙ), in regions Macedonia—Thrace, Crete, and Aegean Islands, Thessaly-Mainland Greece—Epirus and Attica (project number: 13SMEs2009).
Institutional Review Board Statement
Not applicable.
Informed Consent Statement
Not applicable.
Data Availability Statement
The data presented in this study are available on request from the corresponding author. The data are not publicly available due to privacy.
Acknowledgments
P.D. and G.P. thank C. Tsipouridis and S. Pantazis for contributing by collecting part of the studied plant material and A. Ntikas, C. Kazantzis, M. Pitsiouni and C. Ziakou and for field and laboratory supporting work.
Conflicts of Interest
The authors declare no conflict of interest.
References
- Holland, D.; Hatib, K.; Bar-Ya’akov, I. Pomegranate: Botany, Horticulture, Breeding. In Horticultural Reviews; Janick, J., Ed.; John Wiley & Sons, Inc.: Hoboken, NJ, USA, 2009; pp. 127–191. [Google Scholar] [CrossRef]
- Kahramanoglu, I.; Usanmaz, S. Pomegranate Production and Marketing; CRC Press, 2016. [Google Scholar] [CrossRef]
- Kahramanoglu, I. Trends in Pomegranate Sector: Production, Postharvest Handling and Marketing. Int. J. Agric. For. Life Sci. 2019, 3, 239–246. [Google Scholar]
- Lye, C.; Rural Industries Research and Development Corporation (Australia). Pomegranate: Preliminary Assessment of the Potential for an Australian Industry; RIRDC Publication No. 08/153; 2008; p. 17. [Google Scholar]
- Gil, M.I.; Tomás-Barberán, F.A.; Hess-Pierce, B.; Holcroft, D.M.; Kader, A.A. Antioxidant Activity of Pomegranate Juice and Its Relationship with Phenolic Composition and Processing. J. Agric. Food Chem. 2000, 48, 4581–4589. [Google Scholar] [CrossRef] [PubMed]
- Aviram, M.; Dornfeld, L. Pomegranate Juice Consumption Inhibits Serum Angiotensin Converting Enzyme Activity and Reduces Systolic Blood Pressure. Atherosclerosis 2001, 158, 195–198. [Google Scholar] [CrossRef]
- Haidari, M.; Ali, M.; Ward Casscells, S.; Madjid, M. Pomegranate (Punica granatum) Purified Polyphenol Extract Inhibits Influenza Virus and Has a Synergistic Effect with Oseltamivir. Phytomedicine 2009, 16, 1127–1136. [Google Scholar] [CrossRef]
- Hellenic Statistical Authority. Hellenic Statistical Authority-ELSTAT; Athens, Greece, 2018. [Google Scholar]
- Chalak, L.; Chehade, A.; Kadri, A. Morphological Characterization of Cultivated Almonds in Lebanon. Fruits 2007, 62, 177–186. [Google Scholar] [CrossRef]
- Khadivi-Khub, A.; Zamani, Z.; Fatahi, M.R. Multivariate Analysis of Prunus Subgen. Cerasus Germplasm in Iran Using Morphological Variables. Genet. Resour. Crop Evol. 2012, 59, 909–926. [Google Scholar] [CrossRef]
- Zamani, Z.; Sarkhosh, A.; Fatahi, R.; Ebadi, A. Genetic Relationships among Pomegranate Genotypes Studied by Fruit Characteristics and RAPD Markers. J. Hortic. Sci. Biotechnol. 2007, 82, 11–18. [Google Scholar] [CrossRef]
- Sarkhosh, A.; Zamani, Z.; Fatahi, R.; Ranjbar, H. Evaluation of Genetic Diversity among Iranian Soft-Seed Pomegranate Accessions by Fruit Characteristics and RAPD Markers. Sci. Hortic. 2009, 121, 313–319. [Google Scholar] [CrossRef]
- Melgarejo, P.; Martínez, J.J.; Hernández, F.; Martínez, R.; Legua, P.; Oncina, R.; Martinez-Murcia, A. Cultivar Identification Using 18S–28S RDNA Intergenic Spacer-RFLP in Pomegranate (Punica granatum L.). Sci. Hortic. 2009, 120, 500–503. [Google Scholar] [CrossRef]
- Ajal, E.A.; Jbir, R.; Melgarejo, P.; Hernández, F.; Haddioui, A.; Hannachi, A.S. Efficiency of Inter Simple Sequence Repeat (ISSR) Markers for the Assessment of Genetic Diversity of Moroccan Pomegranate (Punica granatum L.) Cultivars. Biochem. Syst. Ecol. 2014, 56, 24–31. [Google Scholar] [CrossRef]
- Madadi, M.; Zamani, Z.; Fatahi, R. Assessment of Genetic Variation within Commercial Iranian Pomegranate (Punica granatum L.) Cultivars, Using ISSR and SSR Markers. Turk. J. Agric. Food Sci. Technol. 2017, 5, 622. [Google Scholar] [CrossRef][Green Version]
- Amar, M.H.; El-Zayat, M. Abd. S. Utilization of ISTR, ISSR and SRAP Molecular Markers to Reveal and Classify Egyptian Pomegranates (Punica granatum L.). Plant Omics 2017, 10, 237–246. [Google Scholar] [CrossRef]
- Collard, B.C.Y.; Mackill, D.J. Start Codon Targeted (SCoT) Polymorphism: A Simple, Novel DNA Marker Technique for Generating Gene-Targeted Markers in Plants. Plant Mol. Biol. Report. 2009, 27, 86–93. [Google Scholar] [CrossRef]
- Abdel-Lateif, K.S.; Hewedy, O.A. Genetic Diverity among Egyptian Wheat Cultivars Using SCoT and ISSR Markers. SABRAO J. Breed. Genet. 2018, 50, 36–45. [Google Scholar]
- Xiong, F.; Zhong, R.; Han, Z.; Jiang, J.; He, L.; Zhuang, W.; Tang, R. Start Codon Targeted Polymorphism for Evaluation of Functional Genetic Variation and Relationships in Cultivated Peanut (Arachis hypogaea L.) Genotypes. Mol. Biol. Rep. 2011, 38, 3487–3494. [Google Scholar] [CrossRef] [PubMed]
- Guo, D.-L.; Zhang, J.-Y.; Liu, C.-H. Genetic Diversity in Some Grape Varieties Revealed by SCoT Analyses. Mol. Biol. Rep. 2012, 39, 5307–5313. [Google Scholar] [CrossRef]
- Luo, C.; He, X.-H.; Chen, H.; Ou, S.-J.; Gao, M.-P. Analysis of Diversity and Relationships among Mango Cultivars Using Start Codon Targeted (SCoT) Markers. Biochem. Syst. Ecol. 2010, 38, 1176–1184. [Google Scholar] [CrossRef]
- Mahjbi, A.; Baraket, G.; Oueslati, A.; Salhi-Hannachi, A. Start Codon Targeted (SCoT) Markers Provide New Insights into the Genetic Diversity Analysis and Characterization of Tunisian Citrus Species. Biochem. Syst. Ecol. 2015, 61, 390–398. [Google Scholar] [CrossRef]
- Kyriacou, M.C.; Ioannidou, S.; Nikoloudakis, N.; Seraphides, N.; Papayiannis, L.C.; Kyratzis, A.C. Physicochemical Characterization and Trait Stability in a Genetically Diverse Ex Situ Collection of Pomegranate (Punica granatum L.) Germplasm from Cyprus. Sci. Hortic. 2020, 263, 109116. [Google Scholar] [CrossRef]
- Cristofori, V.; Caruso, D.; Latini, G.; Dell’Agli, M.; Cammilli, C.; Rugini, E.; Bignami, C.; Muleo, R. Fruit Quality of Italian Pomegranate (Punica granatum L.) Autochthonous Varieties. Eur. Food Res. Technol. 2011, 232, 397–403. [Google Scholar] [CrossRef]
- Ferrara, G.; Cavoski, I.; Pacifico, A.; Tedone, L.; Mondelli, D. Morpho-Pomological and Chemical Characterization of Pomegranate (Punica granatum L.) Genotypes in Apulia Region, Southeastern Italy. Sci. Hortic. 2011, 130, 599–606. [Google Scholar] [CrossRef]
- Radunić, M.; Jukić Špika, M.; Goreta Ban, S.; Gadže, J.; Díaz-Pérez, J.C.; MacLean, D. Physical and Chemical Properties of Pomegranate Fruit Accessions from Croatia. Food Chem. 2015, 177, 53–60. [Google Scholar] [CrossRef]
- Mars, M.; Marrakchi, M. Diversity of Pomegranate (Punica granatum L.) Germplasm in Tunisia. Genet. Resour. Crop Evol. 1999, 46, 461–467. [Google Scholar] [CrossRef]
- Ozgen, M.; Durgaç, C.; Serçe, S.; Kaya, C. Chemical and Antioxidant Properties of Pomegranate Cultivars Grown in the Mediterranean Region of Turkey. Food Chem. 2008, 111, 703–706. [Google Scholar] [CrossRef]
- McGuire, R.G. Reporting of Objective Color Measurements. HortScience 1992, 27, 1254–1255. [Google Scholar] [CrossRef]
- Bellini, E.; Giordani, E. I fruttiferi minori in Italia, una risorsa tradizionale per l’innovazione frutticola: Il kaki e il melograno come casi di studio. Italus Hortus 2010, 17, 75–90. [Google Scholar]
- Singleton, V.L.; Rossi, J.A. Colorimetry of Total Phenolics with Phosphomolybdic-Phosphotungstic Acid Reagents. Am. J. Enol. Vitic. 1965, 16, 144–158. [Google Scholar]
- Blois, M.S. Antioxidant Determinations by the Use of a Stable Free Radical. Nature 1958, 181, 1199–1200. [Google Scholar] [CrossRef]
- Doyle, J.J.; Doyle, J.L. A Rapid DNA Isolation Procedure for Small Quantities of Fresh Leaf Tissues. Phytocemical Bull. 1987, 19, 11–15. [Google Scholar]
- Sharma, S. Applied Multivariate Techniques; John Willey & Sons Inc.: New York, NY, USA, 1996. [Google Scholar]
- O’Connor, B.P. SPSS and BAS Programs for Determining the Number of Components Using Parallel Analysis and Velicer’s MAP Test. Behav. Res. Methods Instrum. Comput. 2000, 32, 396–402. [Google Scholar] [CrossRef]
- Peakall, R.; Smouse, P.E. Genalex 6: Genetic Analysis in Excel. Population Genetic Software for Teaching and Research. Mol. Ecol. Notes 2006, 6, 288–295. [Google Scholar] [CrossRef]
- Peakall, R.; Smouse, P.E. GenAlEx 6.5: Genetic Analysis in Excel. Population Genetic Software for Teaching and Research--an Update. Bioinformatics 2012, 28, 2537–2539. [Google Scholar] [CrossRef]
- Kumar, S.; Stecher, G.; Li, M.; Knyaz, C.; Tamura, K. MEGA X: Molecular Evolutionary Genetics Analysis across Computing Platforms. Mol. Biol. Evol. 2018, 35, 1547–1549. [Google Scholar] [CrossRef] [PubMed]
- Amiryousefi, A.; Hyvönen, J.; Poczai, P. IMEC: Online Marker Efficiency Calculator. Appl. Plant Sci. 2018, 6, e01159. [Google Scholar] [CrossRef]
- Ganopoulos, I.V.; Kazantzis, K.; Chatzicharisis, I.; Karayiannis, I.; Tsaftaris, A.S. Genetic Diversity, Structure and Fruit Trait Associations in Greek Sweet Cherry Cultivars Using Microsatellite Based (SSR/ISSR) and Morpho-Physiological Markers. Euphytica 2011, 181, 237–251. [Google Scholar] [CrossRef]
- Drogoudi, P.D.; Tsipouridis, C.; Michailidis, Z. Physical and Chemical Characteristics of Pomegranates. HortScience 2005, 40, 1200–1203. [Google Scholar] [CrossRef]
- Wetzstein, H.Y.; Zhang, Z.; Ravid, N.; Wetzstein, M.E. Characterization of Attributes Related to Fruit Size in Pomegranate. HortScience 2011, 46, 908–912. [Google Scholar] [CrossRef]
- Martinez-Nicolas, J.J.; Melgarejo, P.; Legua, P.; Garcia-Sanchez, F.; Hernández, F. Genetic Diversity of Pomegranate Germplasm Collection from Spain Determined by Fruit, Seed, Leaf and Flower Characteristics. PeerJ 2016, 4, e2214. [Google Scholar] [CrossRef] [PubMed]
- Chater, J.M.; Merhaut, D.J.; Jia, Z.; Mauk, P.A.; Preece, J.E. Fruit Quality Traits of Ten California-Grown Pomegranate Cultivars Harvested over Three Months. Sci. Hortic. 2018, 237, 11–19. [Google Scholar] [CrossRef]
- Viswanath, P.; Al-Bakri, A.N.; Nadaf, S.K.; Amal, K. Correlations and Variability in Fruit Characters of Pomegranate. In Proceedings of Symposium Recent Advances in Management of Arid Ecosystem; CAZRI: India, 1999; pp. 361–364. [Google Scholar]
- Agrawal, S.; Chandra, A. Note Physico-Chemical Characteristics of Pomegranate Fruit. Curr. Agric. 1991, 15, 65–66. [Google Scholar]
- Tehranifar, A.; Zarei, M.; Nemati, Z.; Esfandiyari, B.; Vazifeshenas, M.R. Investigation of Physico-Chemical Properties and Antioxidant Activity of Twenty Iranian Pomegranate (Punica granatum L.) Cultivars. Sci. Hortic. 2010, 126, 180–185. [Google Scholar] [CrossRef]
- Alcaraz-Mármol, F.; Nuncio-Jáuregui, N.; García-Sánchez, F.; Martínez-Nicolás, J.J.; Hernández, F. Characterization of Twenty Pomegranate (Punica granatum L.) Cultivars Grown in Spain: Aptitudes for Fresh Consumption and Processing. Sci. Hortic. 2017, 219, 152–160. [Google Scholar] [CrossRef]
- Mayuoni-Kirshinbaum, L.; Porat, R. The Flavor of Pomegranate Fruit: A Review: The Flavor of Pomegranate Fruit: A Review. J. Sci. Food Agric. 2014, 94, 21–27. [Google Scholar] [CrossRef] [PubMed]
- Cam, M.; Hisil, Y.; Durmaz, G. Characterisation of Pomegranate Juices from Ten Cultivars Grown in Turkey. Int. J. Food Prop. 2009, 12, 388–395. [Google Scholar] [CrossRef]
- Dafny-Yalin, M.; Glazer, I.; Bar-Ilan, I.; Kerem, Z.; Holland, D.; Amir, R. Color, Sugars and Organic Acids Composition in Aril Juices and Peel Homogenates Prepared from Different Pomegranate Accessions. J. Agric. Food Chem. 2010, 58, 4342–4352. [Google Scholar] [CrossRef]
- Fawole, O.A.; Opara, U.L. Developmental Changes in Maturity Indices of Pomegranate Fruit: A Descriptive Review. Sci. Hortic. 2013, 159, 152–161. [Google Scholar] [CrossRef]
- Schwartz, E.; Tzulker, R.; Glazer, I.; Bar-Ya’akov, I.; Wiesman, Z.; Tripler, E.; Bar-Ilan, I.; Fromm, H.; Borochov-Neori, H.; Holland, D.; et al. Environmental Conditions Affect the Color, Taste, and Antioxidant Capacity of 11 Pomegranate Accessions’ Fruits. J. Agric. Food Chem. 2009, 57, 9197–9209. [Google Scholar] [CrossRef] [PubMed]
- Drogoudi, P.; Pantelidis, G.E.; Vekiari, S.A. Physiological Disorders and Fruit Quality Attributesin Pomegranate: Effects of Meteorological Parameters, Canopy Position and Acetylsalicylic Acid Foliar Sprays. Front. Plant Sci. 2021, 12, 645547. [Google Scholar] [CrossRef]
- Kader, A.A. Pomegranates: Ancient Roots to Modern Medicine; Seeram, N.P., Schulman, R.N., Heber, D., Eds.; Medicinal and Aromatic Plants—Industrial Profiles; CRC/Taylor & Francis: Boca Raton, FL, USA, 2006. [Google Scholar]
- Chace, E.M.; Church, G.G.; Poore, H.H. The Wonderful Variety of Pomegranate. USDA Circ. 1981, 98, 15. [Google Scholar]
- Pareek, S.; Valero, D.; Serrano, M. Postharvest Biology and Technology of Pomegranate: Postharvest Biology and Technology of Pomegranate. J. Sci. Food Agric. 2015, 95, 2360–2379. [Google Scholar] [CrossRef]
- Zamani, Z.; Adabi, M.; Khadivi-Khub, A. Comparative Analysis of Genetic Structure and Variability in Wild and Cultivated Pomegranates as Revealed by Morphological Variables and Molecular Markers. Plant Syst. Evol. 2013, 299, 1967–1980. [Google Scholar] [CrossRef]
- Beghè, D.; Fabbri, A.; Petruccelli, R.; Marieschi, M.; Torelli, A. Morphological and Molecular Characterization of Ancient Pomegranate (Punica granatum L.) Accessions in Northern Italy. Adv. Hortic. Sci. 2019, 33, 581–592. [Google Scholar]
- Ercisli, S.; Agar, G.; Orhan, E.; Yildirim, N.; Hizarci, Y. Interspecific Variability of RAPD and Fatty Acid Composition of Some Pomegranate Cultivars (Punica granatum L.) Growing in Southern Anatolia Region in Turkey. Biochem. Syst. Ecol. 2007, 35, 764–769. [Google Scholar] [CrossRef]
- Sarkhosh, A.; Zamani, Z.; Fatahi, R.; Ebadi, A. RAPD Markers Reveal Polymorphism among Some Iranian Pomegranate (Punica granatum L.) Genotypes. Sci. Hortic. 2006, 111, 24–29. [Google Scholar] [CrossRef]
- Durgaç, C.; Ozgen, M.; Simsek, O.; Aka Kaçar, Y.; Kiyga, Y.; Celebi, S.; Gündüz, K.; Serçe, S. Molecular and Pomological Diversity among Pomegranate (Punica granatum L.) Cultivars in Eastern Mediterranean Region of Turkey. Afr. J. Biotechnol. 2008, 7, 1294–1301. [Google Scholar]
- Narzary, D.; Rana, T.S.; Ranade, S.A. Genetic Diversity in Inter-Simple Sequence Repeat Profiles across Natural Populations of Indian Pomegranate (Punica granatum L.): Genetic Diversity of Wild Pomegranate. Plant Biol. 2010, 12, 806–813. [Google Scholar] [CrossRef] [PubMed]
- Kumar, L.S. DNA Markers in Plant Improvement: An Overview. Biotechnol. Adv. 1999, 10, 143–182. [Google Scholar] [CrossRef]
- Gupta, P.K.; Rustgi, S. Molecular Markers from the Transcribed/Expressed Region of the Genome in Higher Plants. Funct. Integr. Genom. 2004, 4. [Google Scholar] [CrossRef]
- Virk, P.S.; Ford-Lloyd, B.V.; Jackson, M.T.; Pooni, H.S.; Clemeno, T.P.; Newbury, H.J. Predicting Quantitative Variation within Rice Germplasm Using Molecular Markers. Heredity 1996, 76, 296–304. [Google Scholar] [CrossRef]
- Kar, P.K.; Srivastava, P.P.; Awasthi, A.K.; Urs, S.R. Genetic Variability and Association of ISSR Markers with Some Biochemical Traits in Mulberry (Morus spp.) Genetic Resources Available in India. Tree Genet. Genomes 2007, 4, 75–83. [Google Scholar] [CrossRef]
Publisher’s Note: MDPI stays neutral with regard to jurisdictional claims in published maps and institutional affiliations. |
© 2021 by the authors. Licensee MDPI, Basel, Switzerland. This article is an open access article distributed under the terms and conditions of the Creative Commons Attribution (CC BY) license (https://creativecommons.org/licenses/by/4.0/).