Abstract
While the capability of integrated nutrient management (INM) in rice systems has been adequately studied, little is known about the related short-term carbon sequestration and changes in soil carbon fractions. Our study examined the responses of organic carbon pools, carbon sequestration and rice yields after application of different organic manures combined with chemical fertilizers in a rice–rice (Oryza sativa L.) cropping system in the red and laterite agro-climatic zones of West Bengal, India. The treatments included non-fertilized control; rice straw (RS) + nitrogen, phosphorus and potassium fertilizer (NPK); Gliricidia (GL) + NPK; farmyard manure (FYM) + NPK; vermicompost (VC) + NPK; and NPK only. Rice straw + NPK treatment resulted in the highest total organic carbon and passive pool of carbon. Vermicompost + NPK treatment resulted in the highest oxidizable organic carbon (0.69%), dissolved organic carbon (0.007%) and microbial biomass carbon (0.01%), followed by FYM + NPK, GL + NPK and RS + NPK as compared to control. Rice straw + NPK sequestered the highest amount of carbon dioxide (CO2) as the total organic carbon (91.10 t ha−1) and passive pool of carbon (85.64 t ha−1), whereas VC + NPK resulted in the highest amount of CO2 (10.24 t ha−1) being sequestered as the active pool of carbon, followed by FYM + NPK (8.33 t ha−1) and GL + NPK (7.22 t ha−1). The application of both NPK only and VC + NPK treatments resulted in the highest grain yields over the three cropping seasons. In spite of high carbon sequestration being observed in more recalcitrant carbon pools, RS + NPK resulted in little increase (3.52 t ha−1) in rice yield over the short term. The results of this study suggest that the short-term changes of soil carbon fractions and carbon sequestration primarily depend on the type of organic manure used. Vermicompost, FYM and GL provide more labile carbon, which can improve rice yield over the short term. However, it is suggested to explore the dynamics of different carbon fractions, carbon sequestration in different pools and rice yields over longer periods of time.
1. Introduction
Rice is a staple food for more than half of the world’s population and is currently being grown across an area equaling approximately 192 million ha worldwide [1]. Rice-based cropping systems are the main agricultural production systems in most of the South Asian countries catering to food demands. After dramatic increases in productivity during the 1970s and early 1980s, which were attributed to the introduction of high-yielding varieties and the adoption of improved cultural practices, rice yields have either remained stagnant or declined [2,3]. Deterioration of soil properties coupled with inadequate crop and nutrient management and adverse changes in climatic parameters are considered the basic causes for yield declines or stagnation [4]. The soil organic carbon (SOC) content of most soils in India is less than 10 g Kg−1 [5], which is attributed to excessive tillage, imbalance in fertilizer use, little or no crop residue being returned to the soil and soil degradation [6]. However, SOC is a key soil property and is often considered as the backbone of soil quality. It directly affects the physical, chemical and biological properties of soil, and in turn affects crop productivity. Soil carbon consists of about 80% (2500 GT = 1550 GT SOC + 950 GT soil inorganic carbon—SIC) of the total terrestrial C storage (3170 GT) and is a major component of the global C cycle [7]. The amount of carbon in soil can be increased by storing atmospheric CO2, a process known as soil carbon sequestration. This process is primarily mediated by plants through photosynthesis, with carbon stored in the form of SOC [7]. Therefore, carbon sequestration is a win–win technology for mitigating greenhouse gas emissions [8] and improving soil quality [9] in order to sustain the productivity of rice-based farming systems.
Integrated nutrient management (INM), whereby both organic manures and inorganic fertilizers are used simultaneously, is probably the most effective method to maintain healthy and sustainable soil systems while increasing crop productivity [8,9,10,11]. Although there have been numerous studies conducted on INM in rice-based cropping systems in India, most of them determined the nutrient equivalence of organic manures in comparison to chemical fertilizers [5,12]. The SOC pool is affected by a wide range of agricultural management practices, including tillage [13,14], residue management, fertilization and manure application [15,16], water management and soil drainage [17]. Integrated nutrient management is one of the strategies that can be used to restore SOC in depleted and degraded soils, while simultaneously improving yields. However, little is known about carbon storage and dynamics under INM in rice-based cropping systems. The types of organic manures applied to soils can have different influences on SOC and crop yields [10]. However, such changes will not be reflected by total organic carbon (TOC) values, particularly over short term. Therefore, changes in more sensitive carbon fractions, such as dissolved organic carbon (DOC), microbial biomass carbon (MBC), readily mineralizable carbon (RMC) and particulate organic carbon (POC), are also important to understand the dynamics of SOC at early stages of management practices, such as INM [18].
Harvesting of crop residues for animal feed or energy sources is a common practice in developing countries such as India, and consequently this could reduce the SOC content, as less or no crop residues would be returned to soils [19,20]. This is especially true for red and laterite agro-climatic zones in West Bengal, India, where rice-based cropping systems are predominant. The rice yield in this area is poor, which is attributed to the coarse texture of the soil and its low SOC content and nutrient levels [21], as well as the acidic reaction of soils. A judicious application of chemical fertilizer in combination with organic manures could bridge the gap between actual and potential yields [10,22] and help build up carbon in the soil. Adoption of the INM approach using certain on-farm resources for rice cultivation could improve soil quality and help sequester different fractions of SOC. However, it is important to elucidate the short-term changes of different carbon fractions under different INM modules to better understand the changes of SOC at early stage of INM practices. Therefore, this study was conducted to determine the impacts of different INM practices on carbon sequestration, changes in different organic carbon fractions and yields of rice–rice cropping systems in the red and laterite agro-climatic zones of West Bengal, India.
2. Materials and Methods
2.1. Field Site
Rice was grown in a farmer’s field at Jhargram, West Bengal, India (22°45′ N latitude and 86°98′ E longitude, elevation 81 m above sea level) for three consecutive rice growing seasons, including the Kharif or rainy season (July–October) of 2007, Rabi or pre-summer season (January–April) of 2008 and Kharif (July–October) of 2008. The field was under a rice–rice cropping system and received only inorganic fertilizers for more than ten years. Therefore, there was less chance of any nutrient built up from previous years. Even if it did build up, it was expected to be the same over the field and to have the same effect over all treatment plots. Despite a certain amount of nutrient build-up (based on results from initial soil test), the nutrients were applied at the recommended amounts rather than based on the soil test value. The dominant climate in the study area is a sub-humid tropical climate (long-term mean annual precipitation is 1400 mm, mean annual maximum and minimum air temperature are 30 °C and 22 °C, respectively) [23]. The soil of the study area is Typic Haplustalfs (lateritic) [24] with a sandy loam texture and is good for rice growing, with favorable drainage facilities. Basic physical, chemical, and biological properties of the surface soil (0–0.15 m) were also tested in a laboratory and are presented in Table 1.

Table 1.
Physical, chemical, and microbial properties of the lateritic soil from the field site in West Bengal, India.
2.2. Field Experiment
A total of six treatments with four replications (24 plots of 5 m × 4 m) were laid out following the randomized complete block design (Figure 1). Treatment one (T1) did not receive any inorganic fertilizer or organic manure (control). Four locally available and commonly used organic manures, namely rice straw (RS), Gliricidia leaves (GL), farmyard manure (FYM) and vermicompost (VC) (T2 to T5, respectively), were applied at a rate of 1000 kg C ha−1(Table 2). Each treatment (except T1) received the locally recommended amounts of N, P and K (N: P: K: 80:40:40 kg ha−1). The amounts of N, P and K within the applied organic manure were calculated based on the present amounts. Balance amounts of N, P and K were compensated for by adding chemical fertilizers to T2, T3, T4 and T5 (Table 3). Treatment six (T6) only received chemical fertilizers (urea, single super phosphate and muriate of potash). The RS was stored in a dry place (28–35 °C) after harvesting and was chopped (less than half inch size) before being added to soil. The FYM was a decomposed mixture of plant and animal wastes. Gliricidia is a leguminous, medium-sized tree, which is traditionally grown in non-agricultural lands. Whole Gliricidia leaves were added to the soil as organic manure. Vermicompost is a heterogeneous mixture of household and farm organic wastes decomposed by earthworms. The nutrient contents of organic manures are documented in Table 2. The organic manures were incorporated to a depth of 30 cm during the first ploughing three weeks before transplanting rice seedlings. The commonly used rice variety IR-36 was grown to maturity.
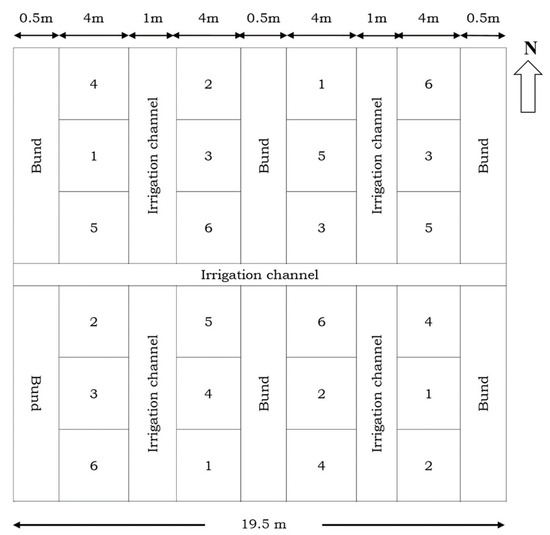
Figure 1.
Layout of experimental plots in the field and treatment allocation channels. The numbers within the plots indicate the treatments: 1 indicates T1, control (no fertilizer or manure); 2 indicates T2, rice straw + NPK (nitrogen, phosphorus, potassium) as chemical fertilizer; 3 indicates T3, Gliricidia leaves + NPK as chemical fertilizer; 4 indicates T4, farmyard manure (FYM) + NPK as chemical fertilizer; 5 indicates T5, Vermicompost + NPK as chemical fertilizer; 6 indicates T6, only chemical fertilizers.
Table 2.
Nutrient contents and carbon/nitrogen (C/N) ratios for the organic manures.
Table 3.
Amounts of nutrients (nitrogen, phosphorous and potassium) (Kg/plot) added by organic manures and chemical fertilizers for each treatment.
2.3. Cultural Practices
After first ploughing, the plots were submerged for three weeks until transplanting. The first half of the required N fertilizer and the total required P and K fertilizers were applied to designated plots two days before transplanting as the pre-planting (or basal) application (N: P: K: 40:40:40 kg ha−1). The remaining half of the N fertilizer was applied as a uniform post-planting application (top dressing) 21 days after transplanting (DAT). Two rice seedlings were transplanted at a spacing of 0.15 m between the hills and 0.20 m between the rows. The experiment was repeated for the three consecutive rice growing seasons. Commonly used agronomic practices such as weeding, irrigation and crop protection were adopted for the entire period of crop growth. The mature crop was harvested at the end of each cropping season.
2.4. Sample Collection, Preparation and Analysis
A composite soil sample (0–0.15 m) from each plot was collected during field preparation, as well as at different stages of rice growth, including maximum tillering (30 DAT), booting (60 DAT) and harvesting (90 DAT) stages for all three growing seasons. Soil samples were air-dried, ground, passed through a 2 mm sieve and stored temporarily in polyethylene bags. The physical and chemical properties of soils were analyzed following the method used by Jackson [25]. The soil texture was determined using the hydrometer method [26]. The total organic carbon (TOC) was determined using the dry combustion method, as no carbonates were found in samples due to their acidic (pH 4.6) nature. Oxidizable organic carbon (OOC) and DOC were determined following the methods used by Walkley and Black [27] and McGill et al. [28], respectively. Determination of OOC was repeated using 5 and 10 mL instead of 20 mL of concentrated sulfuric acid, as specified by Walkley and Black [27]. The resulting three acid-to-aqueous solution ratios of 0.5:1, 1:1 and 2:1 (which corresponded to 12 N, 18 N and 24 N of H2SO4, respectively) allowed comparison of OOC values extracted under different oxidizing conditions using the modified Walkley and Black method, as described by Chan et al. [29]. Different concentrations of H2SO4 helped to separate the TOC into four pools of decreasing oxidizability. The OOC determined using 12 N H2SO4 was considered to be “very labile”, named pool-I. The differences in OOC values extracted between 18 N and 12 N and 24 N and 18 N H2SO4 were considered to be “labile” or classed as pool-II and “less labile” or pool-III, respectively [29]. The OOC value determined using 24 N H2SO4 was equivalent to the standard Walkley and Black [27] method. The “non-labile” or pool-IV OOC was the residual OC after reaction with 24 N H2SO4 when compared to the total C determined by the dry combustion method. This was also considered as the recalcitrant fraction of OC. The sum of pool-I and pool-II was considered as the active pool of C (APC), while that of pool-III and pool-IV was considered as the passive pool of C (PPC). Microbial biomass carbon (MBC) content was determined following Joergensen [30] using moist soil samples. A lability index (LI) for the SOC was computed using pool-I, pool-II and pool-III, which were given weights of 3, 2 and 1, respectively, on the basis of their ease of oxidation. The LI was computed as the sum of these weighted values in proportion to the TOC of each sample, as follows [31].
Amounts of CO2 sequestered as APC, PPC and TOC in the rhizosphere soil were calculated using the percentages of carbon for each of the above pools (grand mean of three crop growth stages and three seasons), the depth (0.15 m) and the bulk density of the soil. Accordingly, the amount of CO2 sequestered in each pool was calculated and compared to CO2 values in the initial APC, PPC and TOC pools.
2.5. Determination of Grain Yield
The crops were harvested, dried and threshed separately for each plot, except for a strip measuring 0.5 m in width around the plots (edge effect). The grain yield of each plot was estimated for all three growing seasons and expressed as t ha−1.
2.6. Statistical Analysis
The effects of treatments on different carbon fractions (p < 0.05) were tested using analysis of variance (ANOVA) in SPSS software package (IBM Inc., Chicago, IL, USA). The mean effects were further subjected to a post-hoc test using Duncan’s multiple range test (DMRT).
3. Results
3.1. Changes of Carbon Fractions under Different INM Practices
No significant increases were observed in TOC for either control or NPK only plots, whereas organic manure + NPK plots showed significantly high TOC contents (Figure 2). However, NPK only and all organic manure + NPK treatments showed increases in other carbon fractions over control. Accordingly, the TOC content was highest (2.81%) in plots the received RS + NPK. The increase was 79% greater than the initial TOC of the soil. Although the other organic manures such as GL + NPK, FYM + NPK and VC + NPK showed significant increases in TOC content compared to the control, no significant differences were observed among them. Oxidizable organic carbon and DOC values significantly improved for all organic manure plots compared to control. Vermicompost + NPK plots had the highest OOC (0.69%) and DOC (0.007%) values compared to the control, whereas plots that received NPK only had the lowest OOC (0.51%) and DOC (0.004%) (Figure 2). Further, OOC and DOC significantly increased in FYM + NPK, GL + NPK and RS + NPK plots compared to control. The MBC values in soil (0–15 cm depth) significantly (p < 0.05) increased with the application of organic manures. The highest increase in MBC was observed in VC + NPK plots, while chemical fertilizer plots had the lowest values compared to the control. In addition, increases of MBC followed the order of FYM + NPK (27.4%), GL + NPK (26.4%) and RS + NPK (20.3%). Further, MBC values increased by 9.1 and 13.5% in the control and NPK only plots, respectively, over the initial content (Figure 2).
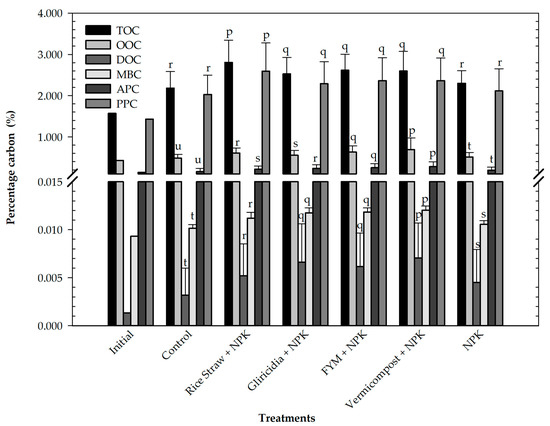
Figure 2.
Effects of treatments on different pools of organic carbon (%) in the rice rhizosphere soil. The values are the averages and error bars are the standard deviations of measurements over three crop growth stages through three consecutive crop growing seasons. Bars followed by the same letter (within and between stacks) are not significantly different at p < 0.05. TOC (total organic carbon), OOC (Oxidizable organic carbon) DOC (dissolved organic carbon), MBC (microbial biomass carbon), APC (active pool of carbon), PPC (passive pool of carbon).
3.2. Changes of Organic Carbon Pools Based on Oxidizability under Different INM Practices
The initial pool-I, pool-II, pool-III and pool-IV C contents of soil accounted for 4.46%, 4.39%, 18.41% and 72.74%, respectively, of the total C (1.57%) (Figure 3). Application of organic manures significantly (p < 0.05) increased the concentrations of these pools in the rhizosphere soil. Accordingly, the greatest increases in pool-I (62.4%), pool-II (100.2%) and pool-III (26.1%) C contents were observed in VC + NPK plots, whereas pool-IV C was the highest (29.3%) in RS + NPK plots. Further, significant increases in oxidizable carbon pools were observed for other organic manures (except for pool-III of GL + NPK plots) compared to control. The lowest increases were observed in chemical-fertilizer-treated plots for pool-I (6.5%), pool-II (38.1%) and pool-IV (5.2%) C contents over the control. The initial active and passive pools of C in soil accounted for 8.85% and 91.15%, respectively, of the TOC content (1.57%) (Figure 3). However, there were significant (p = 0.05) changes in the active and passive pools of C with the application of organic manures. Among the organic manures, VC + NPK plots had the greatest increase (100.21%) of active pool C, followed by FYM + NPK (81.33%), GL + NPK (70.74%) and RS + NPK (53.62%) plots. Further, compared to the initial value, the active pool of C increased by 12.1% in control and 35.5% in NPK only plots. Rice straw + NPK had the highest passive pool of C (81.2%) (Figure 3). Moreover, at the end of the third cropping season, the mean values of PPC under different treatments followed the order of RS + NPK (2.59%) > FYM + NPK (2.36%) ≈ VM + NPK (2.36%) ≈ GL + NPK (2.29%) > NPK only (2.11%) ≈ control (2.09%).
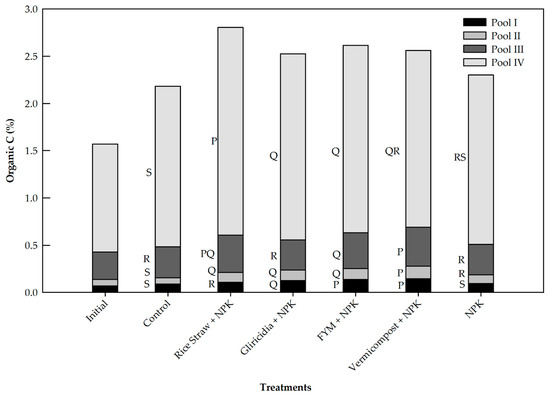
Figure 3.
Effects of treatments on different pools of organic carbon extracted based on oxidizability (pool-I, pool-II, pool-III and pool-IV). The values are the averages over three crop growth stages through three consecutive crop growing seasons. Bars followed by the same letter are not significantly different at p < 0.05.
3.3. Lability Index (LI)
The lability index is important to understand the carbon fractions in relation to the total carbon in soil. The initial LI in the rhizosphere soil was 0.41. The application of different manures significantly changed the LI (p < 0.05). Vermicompost + NPK plots had the highest LI (0.44), followed by FYM + NPK (0.39) and GL + NPK (0.37) (Figure 4). No significant differences in LI were observed among control, NPK and RS + NPK plots. Compared to the initial LI, RS + NPK plots showed a 17.24% decrease in LI.
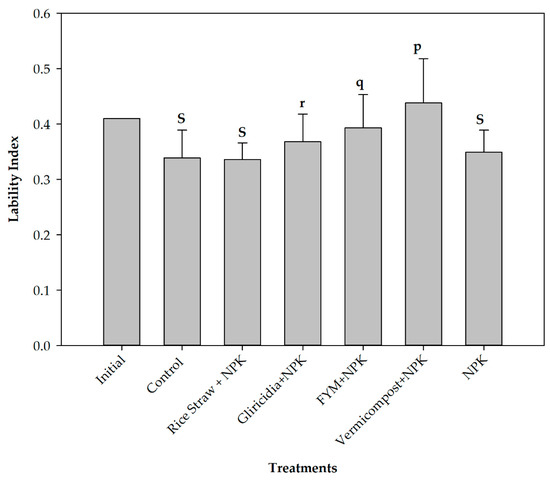
Figure 4.
Effects of treatments on the lability index (LI). The values are the averages and error bars are the standard deviations of measurements over three crop growth stages through three consecutive crop growing seasons. Bars followed by the same letter are not significantly different at p < 0.05.
3.4. Amounts of CO2 Sequestered in the Rhizosphere Soil
The amounts of CO2 sequestered in relation to the initial values of APC, PPC and TOC under each INM system were different (Figure 5). Carbon sequestration in terms of both TOC (91.11 t ha−1) and PPC (88.74 t ha−1) was highest in RS + NPK plots as compared to that of control. Plots that received chemical fertilizer only sequestered 19.02 and 16.84% CO2 in TOC and PPC pools, respectively, compared to control (no fertilizer) plots. The highest CO2 sequestration (21.01 t ha−1) rate in the APC pool was observed in VC + NPK plots, followed by FYM + NPK (18.23 t ha−1) and GL + NPK (16.47 t ha−1).
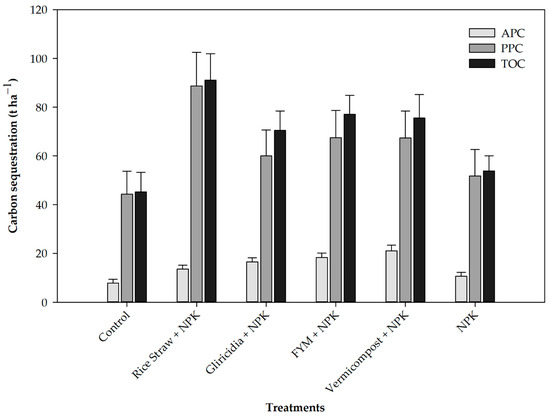
Figure 5.
Effects of treatments on carbon sequestration in terms of total organic carbon (TOC), passive pool of carbon (PPC) and active pool of carbon (APC) values. The values are the averages of measurements over three crop growth stages through three consecutive crop growing seasons.
3.5. Effects of Different INM Systems on Rice Grain Yield
Application of NPK only and VC + NPK resulted in the highest grain yields throughout the three cropping seasons. Further, the average yield over three seasons also showed a similar trend (Table 4). The control plots had the lowest yield. Although the RS + NPK plots showed the highest CO2 sequestration in the rhizosphere, the average rice grain yield over three seasons was lower (3.52 t ha−1) than for the NPK only and VC + NPK plots (Table 4). In addition, FYM + NPK and GL + NPK plots also showed comparatively higher yields over control.
Table 4.
Mean rice grain yield (t ha−1) for each treatment per season and the average of the three seasons.
4. Discussion
4.1. Effects of Different INM Practices on Soil Carbon Fractions
The declining productivity rates in the Indo-Gangetic Plain (IGP) have been attributed to declining C stocks in soils [32]. The carbon sequestration pools and dynamics were induced by fertilization practices [33,34,35]. The results showed that the use of organic manures in combination with NPK fertilizers significantly increased TOC and other carbon fractions, while NPK fertilizer application resulted in no changes in TOC compared with control. Long-term experiments have shown that the optimum application of inorganic fertilizers has either increased or maintained the SOC over the years [18,36]. Li et al. [37] also observed no significant effects on TOC in NPK only soils but changes in particulate organic carbon were significant in subtropical paddy soil in a long-term fertilization experiment. The total organic carbon content in the soil increased due to the addition of plant residue to the soil. Nayak et al. [5] also observed improved the SOC in surface soil via retention of higher amounts stubble and root biomass. Li et al. [38] also observed significantly higher SOC concentrations and stocks for treatments that included organic manure rather than mineral or unfertilized treatments. Diels et al. [39] observed that the addition of NPK fertilizers only had a slight effect on the quantities of aboveground plant residues returned to the soil compared to the control. The highest TOC values being observed in RS + NPK plots suggested that the application of rice straw along with chemical fertilizers leads to greater accumulation of organic matter than application of chemical fertilizer alone. However, the highest PPC values being observed in plots that received RS + NPK indicated low readily available (labile) organic carbon compared to other organic manure plots. The high carbon-to-nitrogen (C/N) ratio of RS resulted in accumulation of soil organic carbon in passive pools. Vermicompost + NPK application enhanced the labile fractions of soil organic carbons such as OOC, DOC, MBC and APC compared to RS + NPK application. Further, the results indicated that other fertilizer and manure combinations such as FYM + NPK and GL + NPK also build up higher labile carbon fractions [40,41,42]. The soluble carbon fraction is an important pool to understand the soil organic matter turnover in agricultural soils [43]. Moreover, it provides readily decomposable substrate for soil microorganisms and acts as a short-term reservoir of plant nutrients [44]. Soil MBC, which is important with respect to soil organic matter decomposition and nutrient cycling, is a sensitive indicator of changes due to management practices [43]. Significantly high MBC levels in VC + NPK followed by FYM + NPK and GL + NPK plots evidenced the presence of high soluble organic carbon fractions. The MBC results in this study are consistent with the findings in other studies showing that MBC contents significantly increased in VC, FYM and other organic manures added to soils together with NPK fertilizers [43,45,46,47]. Hence, the application of inorganic fertilizers in combination with radially decomposable organic manures results in more labile carbon, which can act as a source of energy and nutrients.
4.2. Changes of Different Oxidizable Organic Carbon Pools under INM Practices
The results of this study showed significant changes in organic carbon fractions extracted under a gradient of oxidizing conditions among the different treatments. Much higher increases in SOC was observed in long-term experiments with organic manure [48,49,50]. Li et al. [38] observed that organic manure treatment contributes to higher non-labile C and also improved labile C rates compared to mineral or unfertilized treatments. In this study, the majority of the differences were found in pool-I and pool-II, which were the most easily oxidizable fractions. More importantly, the results of pool-I and pool-II followed similar trends as for DOC and MBC for different organic manure and fertilizer treatments. Therefore, this indicated that pool-I and pool-II are more sensitive indicators of more labile soil carbon fractions and are important in detecting changes due to management practices over short periods of time. On the other hand, a more comprehensive index, such as the LI used in this study, is important to understand organic carbon accumulation in both passive and readily available pools in relation to TOC in soil. Accordingly, the LI of this study suggested that organic manure and fertilizer combinations, such as VC + NPK, FYM +NPK and GL + NPK, provide more labile carbon, whereas RS + NPK results in more passive soil carbon pools over the short term.
4.3. Carbon Sequestration and Rice Yield under Different INM Practices
The results of this study indicated that treatments including inorganic fertilizer only or a combination of inorganic fertilizers and organic manures could improve the C sequestration in soils. However, the type of carbon fraction (passive or labile) sequestered and the rate of sequestration in soils is likely to depend on the type and quality of organic manure added [38]. Accordingly, both TOC and PPC fractions increase in organic manure plots with more resistant compounds such as RS, whereas application of VC, FYM and GL together with chemical fertilizers builds up more labile carbon fractions, which may be attributed to the presence of larger proportions of recalcitrant organic compounds in these compounds [38,51,52]. The highest yields being observed consistently for both NPK only and VC + NPK over three seasons (Table 4) suggested that VC + NPK can replace the sole application of inorganic fertilizer to obtain high yields in rice–rice cropping systems. This is particularly important, as it represents a “win–win” technology that can be used to increase rice yields while improving labile carbon fractions, which are important soil quality indicators. In addition, FYM or GL in combination with inorganic fertilizers could also be used to obtain high yields over the short term. Rice straw + NPK produces yields of 3–4 t ha−1 over the short term while improving TOC and passive carbon pools in soils. The presence of easily decomposable organic compounds in VC, FYM and GL resulted in different labile forms of C and nutrients being released over short time periods and improved crop production. On the other hand, the presence of recalcitrant compounds in RS did not result in an immediate yield increase as compared to other organic manures.
5. Conclusions
Different soil carbon fractions changed significantly with different integrated nutrient management practices in rice–rice cropping systems of red and laterite agro-climatic zones of West Bengal, India. In spite of increasing yields, application of chemical fertilizers only results in little sequestration of organic carbon in soils. The application of inorganic fertilizers and organic manures in combination seems to be a viable option to increase rice yields while improving soil carbon accumulation. Particularly, the application of vermicompost in combination with inorganic fertilizers can replace the sole application of inorganic fertilizer to achieve high yields and improve labile carbon fractions in soils, which in turn enhance soil quality. Further, the C/N ratio of organic manures is a key factor in partitioning the soil organic carbon into different pools. Accordingly, in terms of carbon sequestration into more stable pools, the use of RS with inorganic fertilizer could be a better option. However, the improvement of rice yields under RS+ NPK treatment needs to be investigated over the long term. Overall, the results of this study suggested that the use of INM for rice cultivation in the red and laterite agro-climatic zones of eastern India provides beneficial effects to improve soil carbon contents and rice yields over the short term. It is suggested that the dynamics of different carbon fractions and rice yields should be explored over longer periods of time.
Author Contributions
A.B. conceptualized the framework and supervised the overall project. M.G. prepared the first draft. W.A., D.N.V.G., H.B.V. and P.K.P. reviewed and edited the manuscript for submission. All authors have read and agreed to the published version of the manuscript.
Funding
Financial support of the Natural Sciences and Engineering Research Council of Canada (NSERC) (RGPIN-2014-4100) is highly acknowledged.
Institutional Review Board Statement
This study did not involve human or animals.
Informed Consent Statement
Not Applicable.
Data Availability Statement
Data will be made available upon request.
Conflicts of Interest
The authors declare no conflict of interest.
References
- FAO. FAOSTAT Database Collections; Food and Agriculture Organization of the United Nations: Rome, Italy, 2019. [Google Scholar]
- Ladha, J.; Dawe, D.; Pathak, H.; Padre, A.; Yadav, R.; Singh, B.; Singh, Y.; Singh, Y.; Singh, P.; Kundu, A. How extensive are yield declines in long-term rice–wheat experiments in Asia? Field Crop. Res. 2003, 81, 159–180. [Google Scholar] [CrossRef]
- Pathak, H.; Ladha, J.; Aggarwal, P.; Peng, S.; Das, S.; Singh, Y.; Singh, B.; Kamra, S.; Mishra, B.; Sastri, A. Trends of climatic potential and on-farm yields of rice and wheat in the Indo-Gangetic Plains. Field Crop. Res. 2003, 80, 223–234. [Google Scholar] [CrossRef]
- Ladha, J.K.; Fischer, K.; Hossain, M.; Hobbs, P.; Hardy, B. Improving the Productivity and Sustainability of Rice-Wheat Systems of the lndo-Gangetic Plains: A Synthesis of NARS-IRRI Partnership Research; International Rice Research Institute: Los Banos, Phillippines, 2000. [Google Scholar]
- Nayak, A.; Gangwar, B.; Shukla, A.K.; Mazumdar, S.P.; Kumar, A.; Raja, R.; Kumar, A.; Kumar, V.; Rai, P.; Mohan, U. Long-term effect of different integrated nutrient management on soil organic carbon and its fractions and sustainability of rice–wheat system in Indo Gangetic Plains of India. Field Crop. Res. 2012, 127, 129–139. [Google Scholar] [CrossRef]
- Lal, R. Soil carbon sequestration in India. Clim. Chang. 2004, 65, 277–296. [Google Scholar] [CrossRef]
- Lal, R. Carbon sequestration. Philos. T. Roy. Soc. B 2008, 363, 815–830. [Google Scholar] [CrossRef]
- Ashiq, W.; Nadeem, M.; Ali, W.; Zaeem, M.; Wu, J.; Galagedara, L.; Thomas, R.; Kavanagh, V.; Cheema, M. Biochar amendment mitigates greenhouse gases emission and global warming potential in dairy manure based silage corn in boreal climate. Environ. Pollut. 2020, 265, 114869. [Google Scholar] [CrossRef] [PubMed]
- Ali, W.; Nadeem, M.; Ashiq, W.; Zaeem, M.; Gilani, S.S.M.; Rajabi-Khamseh, S.; Pham, T.H.; Kavanagh, V.; Thomas, R.; Cheema, M. The effects of organic and inorganic phosphorus amendments on the biochemical attributes and active microbial population of agriculture podzols following silage corn cultivation in boreal climate. Sci. Rep. 2019, 9, 1–17. [Google Scholar] [CrossRef]
- Ali, W.; Nadeem, M.; Ashiq, W.; Zaeem, M.; Thomas, R.; Kavanagh, V.; Cheema, M. Forage yield and quality indices of silage-corn following organic and inorganic phosphorus amendments in podzol soil under boreal climate. Agronomy 2019, 9, 489. [Google Scholar] [CrossRef]
- Ashiq, W. Evaluating the potential of biochar in mitigating greenhouse gases emission and nitrogen retention in dairy manure based silage corn cropping systems. Master’s Thesis, Memorial University of Newfoundland, St. John’s, NL, CA, 2018. [Google Scholar]
- Swarup, A.; Yaduvanshi, N. Effects of integrated nutrient management on soil properties and yield of rice in alkali soils. J. Indian Soc. Soil Sci. 2000, 48, 279–282. [Google Scholar]
- Dalal, R.; Allen, D.; Wang, W.; Reeves, S.; Gibson, I. Organic carbon and total nitrogen stocks in a Vertisol following 40 years of no-tillage, crop residue retention and nitrogen fertilisation. Soil Tillage Res. 2011, 112, 133–139. [Google Scholar] [CrossRef]
- West, T.O.; Post, W.M. Soil organic carbon sequestration rates by tillage and crop rotation: A global data analysis. Soil Sci. Soc. Am. J. 2002, 66, 1930–1946. [Google Scholar] [CrossRef]
- Ding, X.; Yuan, Y.; Liang, Y.; Li, L.; Han, X. Impact of long-term application of manure, crop residue, and mineral fertilizer on organic carbon pools and crop yields in a Mollisol. J. Soils Sediments 2014, 14, 854–859. [Google Scholar] [CrossRef]
- Ashiq, W.; Vasava, H.B.; Cheema, M.; Dunfield, K.; Daggupati, P.; Biswas, A. Interactive role of topography and best management practices on N2O emissions from agricultural landscape. Soil Tillage Res. 2021. Unpublished. [Google Scholar]
- Abid, M.; Lal, R. Tillage and drainage impact on soil quality: I. Aggregate stability, carbon and nitrogen pools. Soil Tillage Res. 2008, 100, 89–98. [Google Scholar] [CrossRef]
- Purakayastha, T.; Rudrappa, L.; Singh, D.; Swarup, A.; Bhadraray, S. Long-term impact of fertilizers on soil organic carbon pools and sequestration rates in maize–wheat–cowpea cropping system. Geoderma 2008, 144, 370–378. [Google Scholar] [CrossRef]
- Devi, S.; Gupta, C.; Jat, S.L.; Parmar, M. Crop residue recycling for economic and environmental sustainability: The case of India. Open Agric. 2017, 2, 486–494. [Google Scholar] [CrossRef]
- Manna, M.; Ghosh, P.; Acharya, C. Sustainable crop production through management of soil organic carbon in semiarid and tropical India. J. Sustain. Agric. 2003, 21, 85–114. [Google Scholar] [CrossRef]
- Manna, M.; Swarup, A.; Wanjari, R.; Singh, Y.; Ghosh, P.; Singh, K.; Tripathi, A.; Saha, M. Soil organic matter in a West Bengal Inceptisol after 30 years of multiple cropping and fertilization. Soil Sci. Soc. Am. J. 2006, 70, 121–129. [Google Scholar] [CrossRef]
- Kaur, T.; Brar, B.; Dhillon, N. Soil organic matter dynamics as affected by long-term use of organic and inorganic fertilizers under maize–wheat cropping system. Nutr. Cycl. Agroecosyst. 2008, 81, 59–69. [Google Scholar] [CrossRef]
- Shit, P.K.; Nandi, A.S.; Bhunia, G.S. Soil erosion risk mapping using RUSLE model on Jhargram sub-division at West Bengal in India. Modeling Earth Syst. Environ. 2015, 1, 1–12. [Google Scholar] [CrossRef]
- Staff, S. Keys to Soil Taxonomy, 12th ed.; Natural Resources Conservation Service United States Department of Agriculture: Washington, DC, USA, 2014. [Google Scholar]
- Jackson, M.L. Soil Chemical Analysis: Advanced Course; UW-Madison Libraries Parallel Press: Madison, WI, USA, 2005. [Google Scholar]
- Bouyoucos, G. Improved hydrometer method for making particle size analysis. Agron. J. 1962, 54, 464–465. [Google Scholar] [CrossRef]
- Walkley, A.; Black, I.A. An examination of the Degtjareff method for determining soil organic matter, and a proposed modification of the chromic acid titration method. Soil Sci. 1934, 37, 29–38. [Google Scholar] [CrossRef]
- McGill, W.; Cannon, K.; Robertson, J.; Cook, F. Dynamics of soil microbial biomass and water-soluble organic C in Breton L after 50 years of cropping to two rotations. Can. J. Soil Sci. 1986, 66, 1–19. [Google Scholar] [CrossRef]
- Chan, K.; Bowman, A.; Oates, A. Oxidizible organic carbon fractions and soil quality changes in an oxic paleustalf under different pasture leys. Soil Sci. 2001, 166, 61–67. [Google Scholar] [CrossRef]
- Joergensen, R. Microbial biomass. In Methods in Applied Soil Microbiology and Biochemistry; Elsevier: Amsterdam, The Netherlands, 1995; pp. 375–417. [Google Scholar]
- Patra, D.; Chand, S.; Anwar, M. Organic C dynamics and its conservation under wheat (Triticum aesetivum)–Mint (Mentha arvensis)-Sesbania rostrata cropping in sub-tropical condition of northern Indo-Gangetic plains. J. Environ. Manag. 2014, 135, 118–125. [Google Scholar] [CrossRef] [PubMed]
- Abrol, I.; Bronson, K.; Duxbury, J.; Gupta, R. Long-Term Soil Fertility Experiments in Rice-Wheat Cropping Systems; Facilitation Unit, Rice-Wheat Consortium for the Indo-Gangetic Plains: Wageningen, The Netherlands, 2000. [Google Scholar]
- Wang, Y.; Hu, N.; Xu, M.; Li, Z.; Lou, Y.; Chen, Y.; Wu, C.; Wang, Z.-L. 23-year manure and fertilizer application increases soil organic carbon sequestration of a rice–barley cropping system. Biol. Fertil. Soils 2015, 51, 583–591. [Google Scholar] [CrossRef]
- Yan, D.; Wang, D.; Yang, L. Long-term effect of chemical fertilizer, straw, and manure on labile organic matter fractions in a paddy soil. Biol. Fertil. Soils 2007, 44, 93–101. [Google Scholar] [CrossRef]
- Yang, X.; Ren, W.; Sun, B.; Zhang, S. Effects of contrasting soil management regimes on total and labile soil organic carbon fractions in a loess soil in China. Geoderma 2012, 177, 49–56. [Google Scholar] [CrossRef]
- Zhang, W.; Xu, M.; Wang, B.; Wang, X. Soil organic carbon, total nitrogen and grain yields under long-term fertilizations in the upland red soil of southern China. Nutr. Cycl. Agroecosystems 2009, 84, 59–69. [Google Scholar] [CrossRef]
- Li, M.; Lin-Zhang, Y.; Li-Zhong, X.; Ming-Xing, S.; Shi-Xue, Y.; Yun-Dong, L. Long-term effects of inorganic and organic amendments on organic carbon in a paddy soil of the Taihu Lake Region, China. Pedosphere 2011, 21, 186–196. [Google Scholar]
- Li, J.; Wen, Y.; Li, X.; Li, Y.; Yang, X.; Lin, Z.; Song, Z.; Cooper, J.M.; Zhao, B. Soil labile organic carbon fractions and soil organic carbon stocks as affected by long-term organic and mineral fertilization regimes in the North China Plain. Soil Tillage Res. 2018, 175, 281–290. [Google Scholar] [CrossRef]
- Diels, J.; Vanlauwe, B.; Van der Meersch, M.; Sanginga, N.; Merckx, R. Long-term soil organic carbon dynamics in a subhumid tropical climate: 13C data in mixed C3/C4 cropping and modeling with ROTHC. Soil Biol. Biochem. 2004, 36, 1739–1750. [Google Scholar] [CrossRef]
- Rudrappa, L.; Purakayastha, T.; Singh, D.; Bhadraray, S. Long-term manuring and fertilization effects on soil organic carbon pools in a Typic Haplustept of semi-arid sub-tropical India. Soil Tillage Res. 2006, 88, 180–192. [Google Scholar] [CrossRef]
- Verma, T.; Bhagat, R. Impact of rice straw management practices on yield, nitrogen uptake and soil properties in a wheat-rice rotation in northern India. Fertil. Res. 1992, 33, 97–106. [Google Scholar] [CrossRef]
- Yadav, R.; Dwivedi, B.; Pandey, P. Rice-wheat cropping system: Assessment of sustainability under green manuring and chemical fertilizer inputs. Field Crop. Res. 2000, 65, 15–30. [Google Scholar] [CrossRef]
- Bhattacharyya, P.; Nayak, A.; Mohanty, S.; Tripathi, R.; Shahid, M.; Kumar, A.; Raja, R.; Panda, B.; Roy, K.; Neogi, S. Greenhouse gas emission in relation to labile soil C, N pools and functional microbial diversity as influenced by 39 years long-term fertilizer management in tropical rice. Soil Tillage Res. 2013, 129, 93–105. [Google Scholar] [CrossRef]
- García-Orenes, F.; Guerrero, C.; Roldán, A.; Mataix-Solera, J.; Cerdà, A.; Campoy, M.; Zornoza, R.; Bárcenas, G.; Caravaca, F. Soil microbial biomass and activity under different agricultural management systems in a semiarid Mediterranean agroecosystem. Soil Tillage Res. 2010, 109, 110–115. [Google Scholar] [CrossRef]
- Basak, B.; Biswas, D.; Pal, S. Soil biochemical properties and grain quality as affected by organic manures and mineral fertilizers in soil under maize-wheat rotation. Agrochimica 2013, 57, 49–66. [Google Scholar]
- Das, B.B.; Dkhar, M. Organic amendment effects on microbial population and microbial biomass carbon in the rhizosphere soil of soybean. Commun. Soil Sci. Plant Anal. 2012, 43, 1938–1948. [Google Scholar] [CrossRef]
- Verma, R.K.; Verma, R.S.; Rahman, L.-U.; Yadav, A.; Patra, D.D.; Kalra, A. Utilization of distillation waste–based vermicompost and other organic and inorganic fertilizers on improving production potential in geranium and soil health. Commun. Soil Sci. Plant Anal. 2014, 45, 141–152. [Google Scholar] [CrossRef]
- Christensen, B.T. The Askov long-term experiments on animal manure and mineral fertilizers. In Evaluation of Soil Organic Matter Models; Springer: Berlin, Germany, 1996; pp. 301–312. [Google Scholar]
- Smith, P.; Powlson, D.; Glendining, M.; Smith, J. Potential for carbon sequestration in European soils: Preliminary estimates for five scenarios using results from long-term experiments. Glob. Chang. Biol. 1997, 3, 67–79. [Google Scholar] [CrossRef]
- Aoyama, M.; Kumakura, N. Quantitative and qualitative changes of organic matter in an Ando soil induced by mineral fertilizer and cattle manure applications for 20 years. Soil Sci. Plant Nutr. 2001, 47, 241–252. [Google Scholar] [CrossRef]
- Drinkwater, L.E.; Wagoner, P.; Sarrantonio, M. Legume-based cropping systems have reduced carbon and nitrogen losses. Nature 1998, 396, 262–265. [Google Scholar] [CrossRef]
- Liu, E.; Teclemariam, S.G.; Yan, C.; Yu, J.; Gu, R.; Liu, S.; He, W.; Liu, Q. Long-term effects of no-tillage management practice on soil organic carbon and its fractions in the northern China. Geoderma 2014, 213, 379–384. [Google Scholar] [CrossRef]
Publisher’s Note: MDPI stays neutral with regard to jurisdictional claims in published maps and institutional affiliations. |
© 2021 by the authors. Licensee MDPI, Basel, Switzerland. This article is an open access article distributed under the terms and conditions of the Creative Commons Attribution (CC BY) license (https://creativecommons.org/licenses/by/4.0/).