Article

Development of Organic Milk Production in Poland on the Background of the EU

by
Piotr Bórawski
1,*,
Marek Bartłomiej Bórawski
2,
Andrzej Parzonko
3,
Ludwik Wicki
3,
Tomasz Rokicki
4,
Aleksandra Perkowska
4 and
James William Dunn
5
1
Department of Agrotechnology and Agribusiness, Faculty of Agriculture and Forestry, University of Warmia and Mazury in Olsztyn, 10-719 Olsztyn, Poland
2
Faculty of Law and Administration, University of Warmia and Mazury in Olsztyn, 10-725 Olsztyn, Poland
3
Department of Economics and Organization of Enterprises, Institute of Economics and Finance, Warsaw University of Life Science—SGGW-Warsaw, 02-787 Warszawa, Poland
4
Department of Logistics, Institute of Economics and Finance, Warsaw University of Life Science—SGGW-Warsaw, 02-787 Warszawa, Poland
5
Department of Agricultural Economics, Sociology, and Education, Faculty of Agricultural Sciences, Pennsylvania State University, University Park, PA 16802, USA
*
Author to whom correspondence should be addressed.
Agriculture 2021, 11(4), 323; https://doi.org/10.3390/agriculture11040323
Submission received: 22 February 2021 / Revised: 30 March 2021 / Accepted: 31 March 2021 / Published: 6 April 2021
(This article belongs to the Section Agricultural Economics, Policies and Rural Management)

Abstract

:
Organic milk production is an environmentally friendly production system based on local forage and a ban on using chemical fertilizers and certain other rules. Organic milk is considered to be healthier and is gaining attention worldwide. The market for organic products is increasing. The aim of the paper was to analyze changes in the development of organic dairy production in Poland in the context of the EU. We analyzed the changes on the European Union (EU) level and the Poland level. To analyze the changes in organic milk production on European Union level, we used the autoregressive integrated moving average model (ARIMA). Our results show that both organic milk production and the farm area used for organic production will increase. Moreover, we analyzed the organic dairy farms running rural accountancy within the Farm Accountancy Data Network (FADN) in Poland in the years 2007–2018. We used tabular and graphic methods to present the data. In the analysis the methods of correlation and regression were used. Germany, France, Austria, and Great Britain are the countries with the largest numbers of organic dairy cows. Our prognosis examined the development of organic milk production in the European Union (EU). The number of cows on dairy organic farms will increase in most countries in the EU. Then, we analyzed the impact of the chosen factors on three dependent variables: organic milk production, total production of organic dairy farms, and income from family farms. The most important independent variables were cow numbers, the value of fixed assets, the value of current assets, long-term debt, and short-term debt.

1. Introduction

The ecological consciousness of consumers and the preference for a healthy lifestyle have caused an increased demand for ecological dairy products, mainly because consumers perceive these products to be healthier. Today, consumers are aware of highly processed foods and the potential harmful environmental impacts of conventional agriculture [1,2].
Milk is shown to have a positive impact on bone mass, cardiovascular health, and gastrointestinal microbiomes [3]. Milk is important in feeding children because they need nutritious and energy-rich foods for growth [4]. Moreover, dairy products contain much needed nutrients, such as calcium, potassium, protein, fat, and vitamins [5]. Milk and dairy products are important for human health because they may reduce the risk of osteoporosis and cardiovascular diseases [6]. Both organic and conventional milk contain essential vitamins and minerals such as calcium, potassium, vitamin A, D, B12, riboflavin, niacin, and other ingredients [7].
The problem of environmentally sustainable value in agriculture is a constant concern within the Common Agricultural Policy (CAP) of the European Union (EU). It is commonly believed that smaller farms are more environmentally friendly, and the farmers are “landscape guardians” in comparison to larger farms [8]. It is a common question about the way small farms develop: will they remain small or increase productivity through investment? [9].
Small and big farms in the EU are functioning in a turbulent environment because of high price volatility, changes in climactic conditions, and changes in the Common Agricultural Policy. That is why one promising strategy can be entering organic markets [10]. The two systems differ and have similarities. Particular differences concern the production system, cow fertility, animal health, and consumption.
Many studies compare organic dairy farming with conventional farming [7,10,11,12,13]. One factor that shaped the conditions on the dairy market was the abolition of the quota system in 2015 that allowed an increase of milk production, but also led to potential environmental problems. The intensification of traditional dairy farming may lead to an increase of nitrogen and phosphate [11]. There are some differences between organic and conventional farming. Organic dairying is based on pasture and forage feeding. However, conventional dairying is tied to high levels of grain feeding, choosing breeds that produce more milk, and the application of fertilizers [12]. Yield achieved by conventional herds are higher than organic herds, where yields vary from 72 to 91% of traditional cows [13]. According to Backer and Stone [7], U.S. milk production from organic raised cows is 15% less than from conventionally raised cows.
Organic dairy farms have a higher consumption of electricity per cow and diesel in comparison to conventional farms. These results are caused by larger fodder area, and lower yields that create the need to use more tractor diesel. Higher animal density on conventional dairy farms is the reason for greater milk production. Moreover, conventional dairy farms use more purchased concentrate feed, which has lower nitrate discharges per kg of feed [14].
Organic dairy products have almost a 30% share of the entire milk market. Milk and dairy organic products are mainly sold in Northern European countries. The increase of organic dairy cows is associated with an increase in organic farmland and the increased demand for organic products. A higher number of ecological animals in the whole herd can be found in Austria, Sweden, Latvia, Czech Republic, Denmark, Great Britain, and in total they are up to 10–20% of the total EU herd [15].
Organic milk production is strongly linked to permanent pastures, which deliver fodder, preserve soils, and do not destroy organic matter and organisms. The environmental, economic, and legal objectives are important for the progress of sustainable development and are present in the public debate [16]. The care of the environment is increasingly important.
Organic milk production is thought to be cleaner than traditional dairy operations. This activity is uncommon in agricultural production. Each year consumers become more aware of the environment, healthy food, and agriculture. Additionally, the standards and regulations in the environment, product quality, and social pressure on environmental performance in China, Europe, and other parts of Europe are increasing [17].
Many papers describe traditional dairy production. However, little attention is paid to organic dairy production. No previous research has raised the issue of organic prognosis. We wanted to fill in the gap in the literature concerning development of organic dairy production in resource utilization in Poland in the context of the European Union.
The aim of the paper was to analyze changes in the development of organic dairy production in Poland on the background of the EU.
In this paper, we wanted to address following questions:
  • What are the changes in terms of stationarity in farmland area for organic dairy farms in the EU?
  • How has EU milk production from dairy organic farms changed in the years 2007-18?
  • Have the changes in production had an impact on organic dairy milk production in Poland?
  • What is the prognosis for organic milk production and the number of dairy cows in the EU?
We used different methods to achieve these goals. The ARIMA model was used to check the stationarity and do the prognosis in the EU, whereas multiple regression analysis was used to check the impact of selected factors on organic milk production in Poland.
The paper is organized as follows. Section 1 characterizes the factors having an impact on organic milk production and the idea of sustainable development. In Section 2, the methodology is explained. Then, we presented the results of analysis. The final part comprises the discussion and conclusion.

1.1. Factors Shaping Organic Milk Production in Poland

There are many factors that shape the efficiency and production of organic dairy farms. Generally speaking, we can divide them into three groups: environmental, economic, and legal factors.
The environmental factors are the most important. They include quality of the environment, milking hygiene, pasture feeding, and a ban on the use of chemical fertilizers and pesticides. Ecological dairy farming strongly depends on the quality of the environment. Animal welfare is the first priority. The dairy cows must have access to pastures. The animals must have free movement, and the use of green area. Such animal breeding enables them the free access to the sun, which helps produce vitamin D. The grass and pasture-based diets of organic cows are the main cause for the higher content of the beneficial poly-unsaturated fatty acid (FA) profile [18,19].
Another important issue in dairy cow breeding is milking hygiene. Farms that provide hygienic conditions for ecological dairy cows will help determine the supply and prices of dairy products.
The ecological efficiency of milk producers requires the elimination of heat loss in the winter and the elimination of overheating during the summer. Trees in the pastures can reduce overheating the cows during the summer. The shadowed areas have moisture and can keep the cows cooler during the summer.
Constant access to water is another important issue for ecological dairy breeding. The environmental requirements for ecological dairy production are stronger than in traditional breeding and create better conditions for animal welfare [20].
Organic milk production has impacted forage management, livestock systems, animal health, feeding, and other factors. Moreover, a larger area of pasture is needed to achieve the same amount of milk, which leads to more natural dairy management, welfare, and animal health [21].
Milk production is strongly linked to permanent pastures that deliver fodder, preserve soils, and do not destroy organic matter. Poland is a country rich in permanent pastures. However, the area has decreased 3.8% in the years 2007–2017. This means that more land is devoted to non-agricultural activities [22].
Economic issues are the second group of factors influencing organic dairy production. They mainly include market competition, organic dairy-product prices, consumer choices, and premiums for organic production.
Today, organic agriculture will not be able to survive strong competition in the market without state support. That is why many researchers and policy makers point out that the CAP should support small farmers that produce using ecological production methods. Conventional agriculture is putting strong pressure on the environment. It is difficult to measure the problem. Some researchers believe that some environmental indicators should be used to analyze this phenomenon, such as soil quality, land conservation, greenhouse gas emissions, and wildlife habitat [8].
To be competitive, ecological dairy production must generate higher incomes and decrease production costs. Another issue is the price of ecological products [23]. The support of organic dairy production should ensure its sustainability, which means to cover costs and the ability to pursue current activity and to develop [24].
According to Brodzińska [25], organic agriculture is developing well in Poland, mainly because of support payments. Pawlewicz and Szamrowski [26] also claim that the farms only change to ecological production because of additional payments, an indication that the organic food market is not developing well. Most Polish organic products, including dairy, are exported to Germany.
Changes in consumer behavior create problems for the entire milk supply system including processing, retail, and transportation, which is also typical for the organic market. Each year, we observe fewer dairies in the market, which increase their production and processing, and may have a negative impact on the environment [27].
The market for organic dairy products depends on the situation in the conventional market. According to Komorowska [28], the decrease of conventional product prices caused a decrease in ecological-product prices. The demand-price situation in conventional food markets affects organic product prices. Without a large enough organic market, organic producers are forced to sell their products to conventional markets at the same prices, which limits prices for organic animal products.
Organic product prices are 20–30% higher than traditional products and the higher prices decrease the quantity demanded. The economic efficiency of organic agriculture is lower than conventional agriculture. The restrictive requirements of organic agriculture make it difficult to reduce costs. The requirements mainly include the ban of using chemical fertilizers and the requirement of environmentally preservation methods [29].
The market for organic food is increasing because of animal product safety. Recent studies show that consumer awareness of organic food increased mainly because of the increasingly important health concerns [30].
The third group of factors affecting the development of organic dairy production is tied to legal issues. The regulations on organic farming can impact livestock systems, forage management, reproductive behavior, animal health and feeding, and other things. The EU described organic farming in two regulations: 2092/91 and 1804/99. These documents describe the allowed organic livestock management practices [21].
Polish organic production is governed by the Act on Organic Farming issued by the Minister of Agriculture. However, the primary Act is the Council Regulation (EC) No. 834/2007 [31]. This article describes the farmer’s obligations and good agricultural practices and the tasks of public administration of organic agriculture [32]. It describes the organic production system, its role, and obligations within agri-environmental schemes. Another regulation is the Commission regulation (EU) No 889/2008, which describes the following issues: animal management, breed choice, animal welfare, animal nutrition, and veterinary management.
According to the regulations, animal management includes access to open air or grazing areas, a stocking density of at most 2 dairy cows/ha, animal-health management, mainly based on prevention of diseases, and enough space for animals to have natural behavior.
The breed choice should be selected to avoid health problems typical with intensive production. Indigenous breeds and strains should be preferred. The breed choice should be appropriate for the local conditions. The next issue is animal welfare. It should meet EU welfare standards; mutilations are banned, and suffering should be minimal.
The fourth issue is animal nutrition. It includes feed in accordance with the rules of organic farming addressing the cow’s physical needs. At least 50% of the feed should come from the farm. At least 60% of the dry matter in daily rations must consist of roughage. Moreover, calves should be fed on maternal milk for a minimum of 3 months. Additionally, no synthetic pesticides or fertilizers and no genetically modified organisms should be used.
The last issue includes veterinary management. According to the regulations, it should be based on disease prevention. Chemically synthesized allopathic medical products are not permitted. Moreover, the use of growth promotion agents and hormones is prohibited [33].

1.2. Sustainable Development in Relation to Milk Organic Production in the EU

Sustainable development is a concept widely discussed in the literature. Its aim is biological diversity and the integrity of natural systems. It should not violate the environment. The concept depends on social, economic, and ecological factors [32].
The EU is undertaking many challenges to decrease environmental pollution. The EU is becoming an economy that protects its citizens and promotes resource-efficiency, competitiveness, and low-carbon usage. Such important objectives have been realized in the Common Agricultural Policy (CAP) and The Seventh Environment Action Programme 2014–2020 [34,35].
The main aim of organic farming is the protection of the environment. As a system it contributes to environmental improvement. Moreover, its aim is the reduction of the degree of environmental degradation that is done by intensive agricultural practices [36,37,38].
Organic milk production is strongly linked to sustainable development. Its main rule is the abolition of chemical fertilizers and pesticide use and the certification of production. At the beginning the market of certified plant products was developing faster than for animal production. In recent years organic animal production, including milk, has increased [29].
The farms engaged in organic milk production must be competitive to survive. An organic farm must use proper breeding technology to achieve higher milk production [39].
The quality of organic milk is determined by various factors, such as: milking hygiene, storage, and transport conditions for the milk, chemical and mechanical pollution, the methods of breeding cows, and treating sickness [40,41].
Organic milk is produced in an environmentally friendly manner in accordance with sustainable development. However, a clear deficiency in zinc, molybdenum, selenium, copper, and iodine can occur on organic farms. These shortages must be addressed by specific forage supplements [21].
Organic dairy farming is focused on keeping animals healthy and providing more land to support their natural behavior [42]. According to Becker and Stone [7], the quality of milk from organic farms depends on the quality of feed and soil fertility. The amount of milk also depends on the animal’s genetics.
The longevity of organic dairy cows is important because “it affects the sustainability of dairy production at different levels because a shorter-productive lifespan means that a greater investment in rearing is incurred in a shorter time period, which implies more greenhouse gas emissions per kilogram of product” [43]. CH4 emissions per unit and milk yield of dairy cows have been reported to increase in the first lactations but are lower for cows from 6.5 years of age onward [44].
It is advantageous in terms of greenhouse gas emissions per unit and sustainable development to keep beef and dairy production separate [45].
According to Jespersen, et al. [46], organic production has an impact on the development of public goods such as biodiversity, animal and human welfare, and health.
The development of organic dairy production has depended for a long time on the agri-environmental policy of the European Union, that was largely focused on mitigating the harmful effects of agricultural intensification. According to Vickery et al. [47], relatively little support was allocated to the development of sustainable agricultural systems that are socially and economically attractive to farmers, although the introduction of land management practices is beneficial for wilderness.
There are many differences between traditional and organic milk production. Farmers must implement management practices when they want to convert their traditional dairy farms to organic production. Organic dairy production is based on grazing cows, which increases the dependence on self-sufficiency in fodders. This activity delivers more biodiversity and aesthetic values [10]. Organic dairy production is more environmentally friendly, whereas traditional practices are more productive. The prices of organic dairy products are lower, but the sale of conventional milk products is greater and have more market share. Organic dairy production is resistant to mastitis, parasites and diseases. Conventional milk production is more focused on concentrated feed. The market for organic dairy products is increasing but still in its beginning stage [48]. Conventional milk production is leading to substantial inputs of phosphorus and nitrogen. Organic milk production requires more farmland than conventional production [14].
Traditionally, dairy production creates some threats to the environment because of inappropriate manure management, the use of chemical fertilizers and concentrate fodder [49]. To solve such problems, the EU has elaborated its Common Agricultural Policy (CAP) and through the Nitrates Directive and Water Framework Directive wanted to decrease these concerns in the EU [50]. Only bigger and cleaner milk production can fulfil the future food demand, that will increase with world population growth. Organic dairy production is one way to deliver healthy food. The world’s agricultural production is adjusting to the increased world population. Agriculture will have to feed the larger population, whereas the area of land devoted for agricultural production is decreasing, which is causing environmental degradation and global warming [51].
From the literature, we have inferred the research hypotheses:
Hypothesis 1 (H1).
Organic milk production in Poland and other European Union countries will be developing because of increasing ecological awareness of society.
Hypothesis 2 (H2).
Organic dairy farms are more environmentally friendly and support sustainability because the farmers keep cows, calves, heifers, bulls, pigs, sheep, goats, and other animals.

2. Materials and Methods

2.1. Data Information

In this section, we give information about the variables considered in the analysis. The first part deals with information about organic dairy production in the EU. To do this, we analyzed the number of dairy cows in organic farms, arable area, permanent crops, and permanent grasslands. The data were obtained from the Eurostat [52].
The second group of data was linked to organic dairy farms running rural accountancy. The data came from the FADN (Farm Accountancy Data Network) in Poland. This is a farm accounts data collection system. The system was formally established in 1965 [53]. As the European Union has expanded, the system has included more countries. Currently, the system operates in 28 EU member states. The system works according to three principles: voluntary participation of the farmer, the data obtained are strictly confidential, and the data cannot be used by tax authorities.
In Poland, the functioning of FADN is regulated by the Act on the collection and use of accountancy data of agricultural holdings [53]. This act took force on 1 May 2004 when Poland became a member of the European Union. The FADN system in Poland is organized by the Institute of Agricultural and Food Economics. FADN is used in planning and implementing the tasks of the EU agricultural policy. The collected data are used for determining the annual income of farms operating in the EU and farm activity analysis and assessing the effects of changes in the EU agricultural policy.
Variables were sequentially explained (dependent variables, which were described in Polish currency zloty (PLN): Y1—organic milk production (PLN), Y2—total production of organic dairy farms (PLN), Y3—income from family farm (PLN).
Based on a review of the literature and data availability, 10 potential explanatory variables were initially selected for each EU country that may affect dairy organic milk production [51]. The explanatory variables chosen were (independent variables):
  • X1—farm area (ha),
  • X2—value of plant production (PLN),
  • X3—cow’s number (LU),
  • X4—milk yield (kg/cow),
  • X5—value of fixed assets (PLN),
  • X6—value of land (PLN),
  • X7—value of machinery (PLN),
  • X8—value of current assets (PLN),
  • X9—long-term debt (PLN),
  • X10—short-term debt (PLN).
We used the method of least squares to conduct the linear regression analysis. We used the Statistica 13 program for data analysis.

2.2. ARIMA Model

We used two methods in the paper. The first method was an autoregressive integrated moving average (ARIMA) model. The basis of the analysis was data from Eurostat. We have used the model to check the stationarity and to elaborate the prognosis. The model is analyzing a stationary time series and is a generalization of an autoregressive moving average (ARIMA) model [54,55,56,57,58]:
An Auto Regressive (AR only) model is one where Yt depends only on its own lags. That is, Yt is a function of the ‘lags of Yt’.
y t = φ 0 + φ 1 y t 1 + φ 2 y t 2 + + φ p y t p + e t
where:
  • y t ,   y t 1 ,   y t 2 , ,   y t p —the value of the forecast variable at the time or period t ,   t 1 ,     t 2 , t p
  • φ 0   ,   φ 1 , ,   φ t p —model parameters;
  • e t —error (rest) of the model for the moment or period t; and
  • p —delay operator.
Another model is the moving average MA model:
y t = θ 0 +   e t   θ 1 e t 1 θ 2 e t 2   θ q e t q
where:
  • y t —is the value of the forecast variable in period t;
  • e t ,   e t 1 , , e t q —errors (residuals) in periods t , t q
  • θ 0 ,   θ 1 , , θ q —model parameters, and
  • q —delay operator.
An ARIMA model uses a time series that was differenced at least once to make it stationary and combine the AR and the MA terms. The ARIMA method includes individual stages of the analysis: identification, estimation, and diagnosis. The main condition for the identification process for the ARIMA method is the stationarity of the input series. The model should have a constant mean, variance and autocorrelation over time [59,60,61]. The stationarity of the process can be checked on the autocorrelation diagram. We can assume that non-stationary series have more than 6 lags significantly different from zero. The ARIMA model itself brings the data to a stationary form. As such, the equation becomes:
y t = φ 1 y t 1 +   φ 2 y t 2 + + φ p y t p + e t + θ 0   θ 1 + e t 1 θ 2 e t 2   θ q e t q

2.3. Regression Analysis of Factors Shaping the Organic Dairy Production in Poland

In order to determine the impact of production variables (land, capital, workforce) on the organic dairy production, a regression method was used. Due to the high correlation coefficient of interrelations between production factors we used linear regression, which is described by the following formula. This model uses information from the farms covered by the research. The estimated model of such regression can be written by the following equation: [40]:
Yi = α + β1∙× 1 + β2∙× 2 + … + βi∙× i + εi     for i = 1, 2, 3…n
where:
y—dependent variable,
x—independent varaible,
α—constant,
β1, β2, …—regression coefficient,
εi—random component.
Based on the regression equation, the strength of the relationship (forward multiple step regression coefficient) between the described (dependent) variables and the individual descriptive (independent) variables was calculated. The obtained results of the analysis were collected in tables containing appropriate means and standard deviations of the examined features, the coefficient of linear correlation between the examined features, and the multiple regression equations. The regression equation was assessed using an F-test, and the Student’s t-test to evaluate the individual correlation coefficients. The significance assessment was made at the level of 0.05.
The selection of dependent variables resulted from their importance for milk production on organic dairy farms. The selection of the independent variables was made on the basis of the substantive justification of their impact on the dependent variable. In this respect, endogenous and exogenous variables were taken into account. Then, from the set of the presented variables, variables with high autocorrelation were eliminated. Ultimately, the sets of variables were limited to a few that had a statistically significant effect on the dependent variables. Variables with low impact were eliminated. The selection of the variables was based on prior research conducted in the field of agricultural incomes and the available data and the analysis. This approach is described in the literature [62]. However, regression has its limitations. The most important is its assumption of normality. The sampling distribution should be normally distributed. To achieve this goal the Mann–Whitney U test can be used to evaluate the hypothesis regarding the compatibility of distributions. This test is not performed on the variables’ mean values but based on the sum of the ranks of the variables [63].

3. Results and Discussion

3.1. Development of Organic Farming in the EU

Organic farming is developing well in the EU. For example, in 2017 there were 135 thousand organic farms, whereas by 2017 the number had reached 305 thousand [53]. The output of farms that produce organic milk increased from 2.4 million metric tons in 2007 to 4.9 million metric tons in 2017 in the EU [64].
It is worth mentioning that Holland, which is a leader in total milk production, has a low share of organic cows [65]. This also applies to some new EU (13) member states, for example Poland (0.3%), Slovenia (0.7%), and Lithuania (0.8%).
According to Runowski [
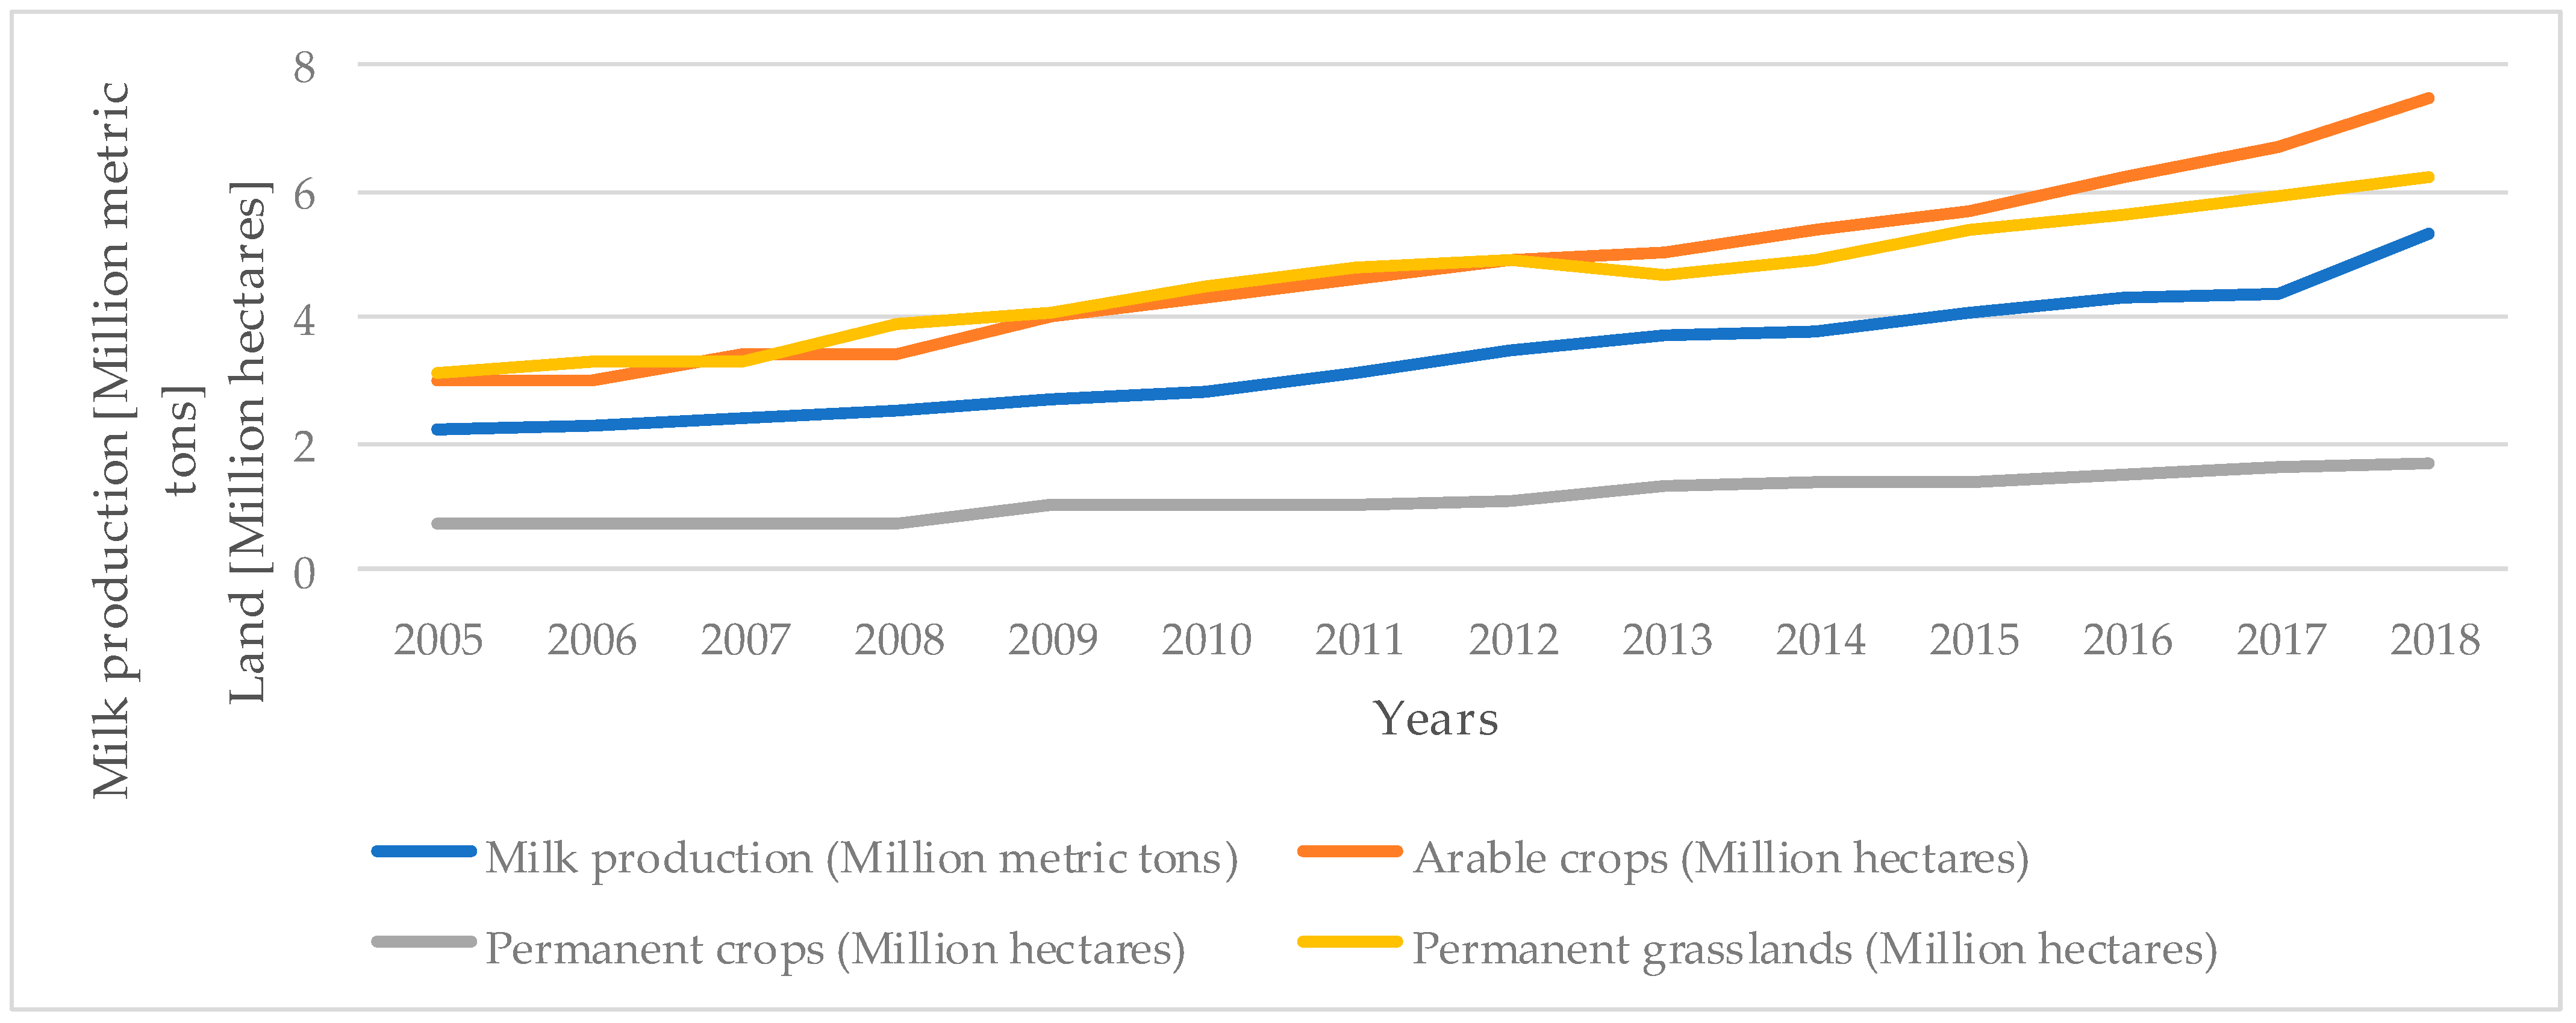
29], European and North American farmers are the leaders in organic production. The scope of organic milk production is spatially dispersed. The total organic milk production in 2006 was 2.3 million tons, which constituted 1.8% of the total milk production. In 2018 the production increased to 4.5 million tons (0.9%) [52,53]. It is worth mentioning that milk production is accompanied by permanent grasslands, which have increased from 3.0 to 6.7 million hectares (Figure 1). As we can see arable crops and permanent grasslands have the same area in 2012. From 2013, arable crops have a larger area than permanent grassland.
The EU (15) countries have the most organic milk production, mainly, Austria, Switzerland, Italy, and Sweden compared to EU (13). In the new member states EU (13), the most important producers are Latvia, Czech Republic, Slovakia, and Slovenia.
The production of organic milk in Germany rose to 940,000 tons in 2017 in comparison to prior years. Thus, Germany occupies the top position in EU organic milk production [66].
France is also an important producer of organic milk. French organic milk production increased to 649,000 tons, which is 68,000 tons (11.7%) greater than in 2016.
In Austria both the number of dairy cows and organic milk production increased in 2017 (115,000 dairy cows and 613,000 tons of organic milk).
The number of organic dairy cows in Denmark increased to 71,000 cows and the milk production to 540,000 tons. Another big producer of organic milk is the Netherlands with 2017 production of 223,000 tons and Belgium with the 112,000 tons of production. However, the biggest decrease of organic milk production was recorded in Great Britain from 519,500 tons to 492,000 tons in 2016–2017.
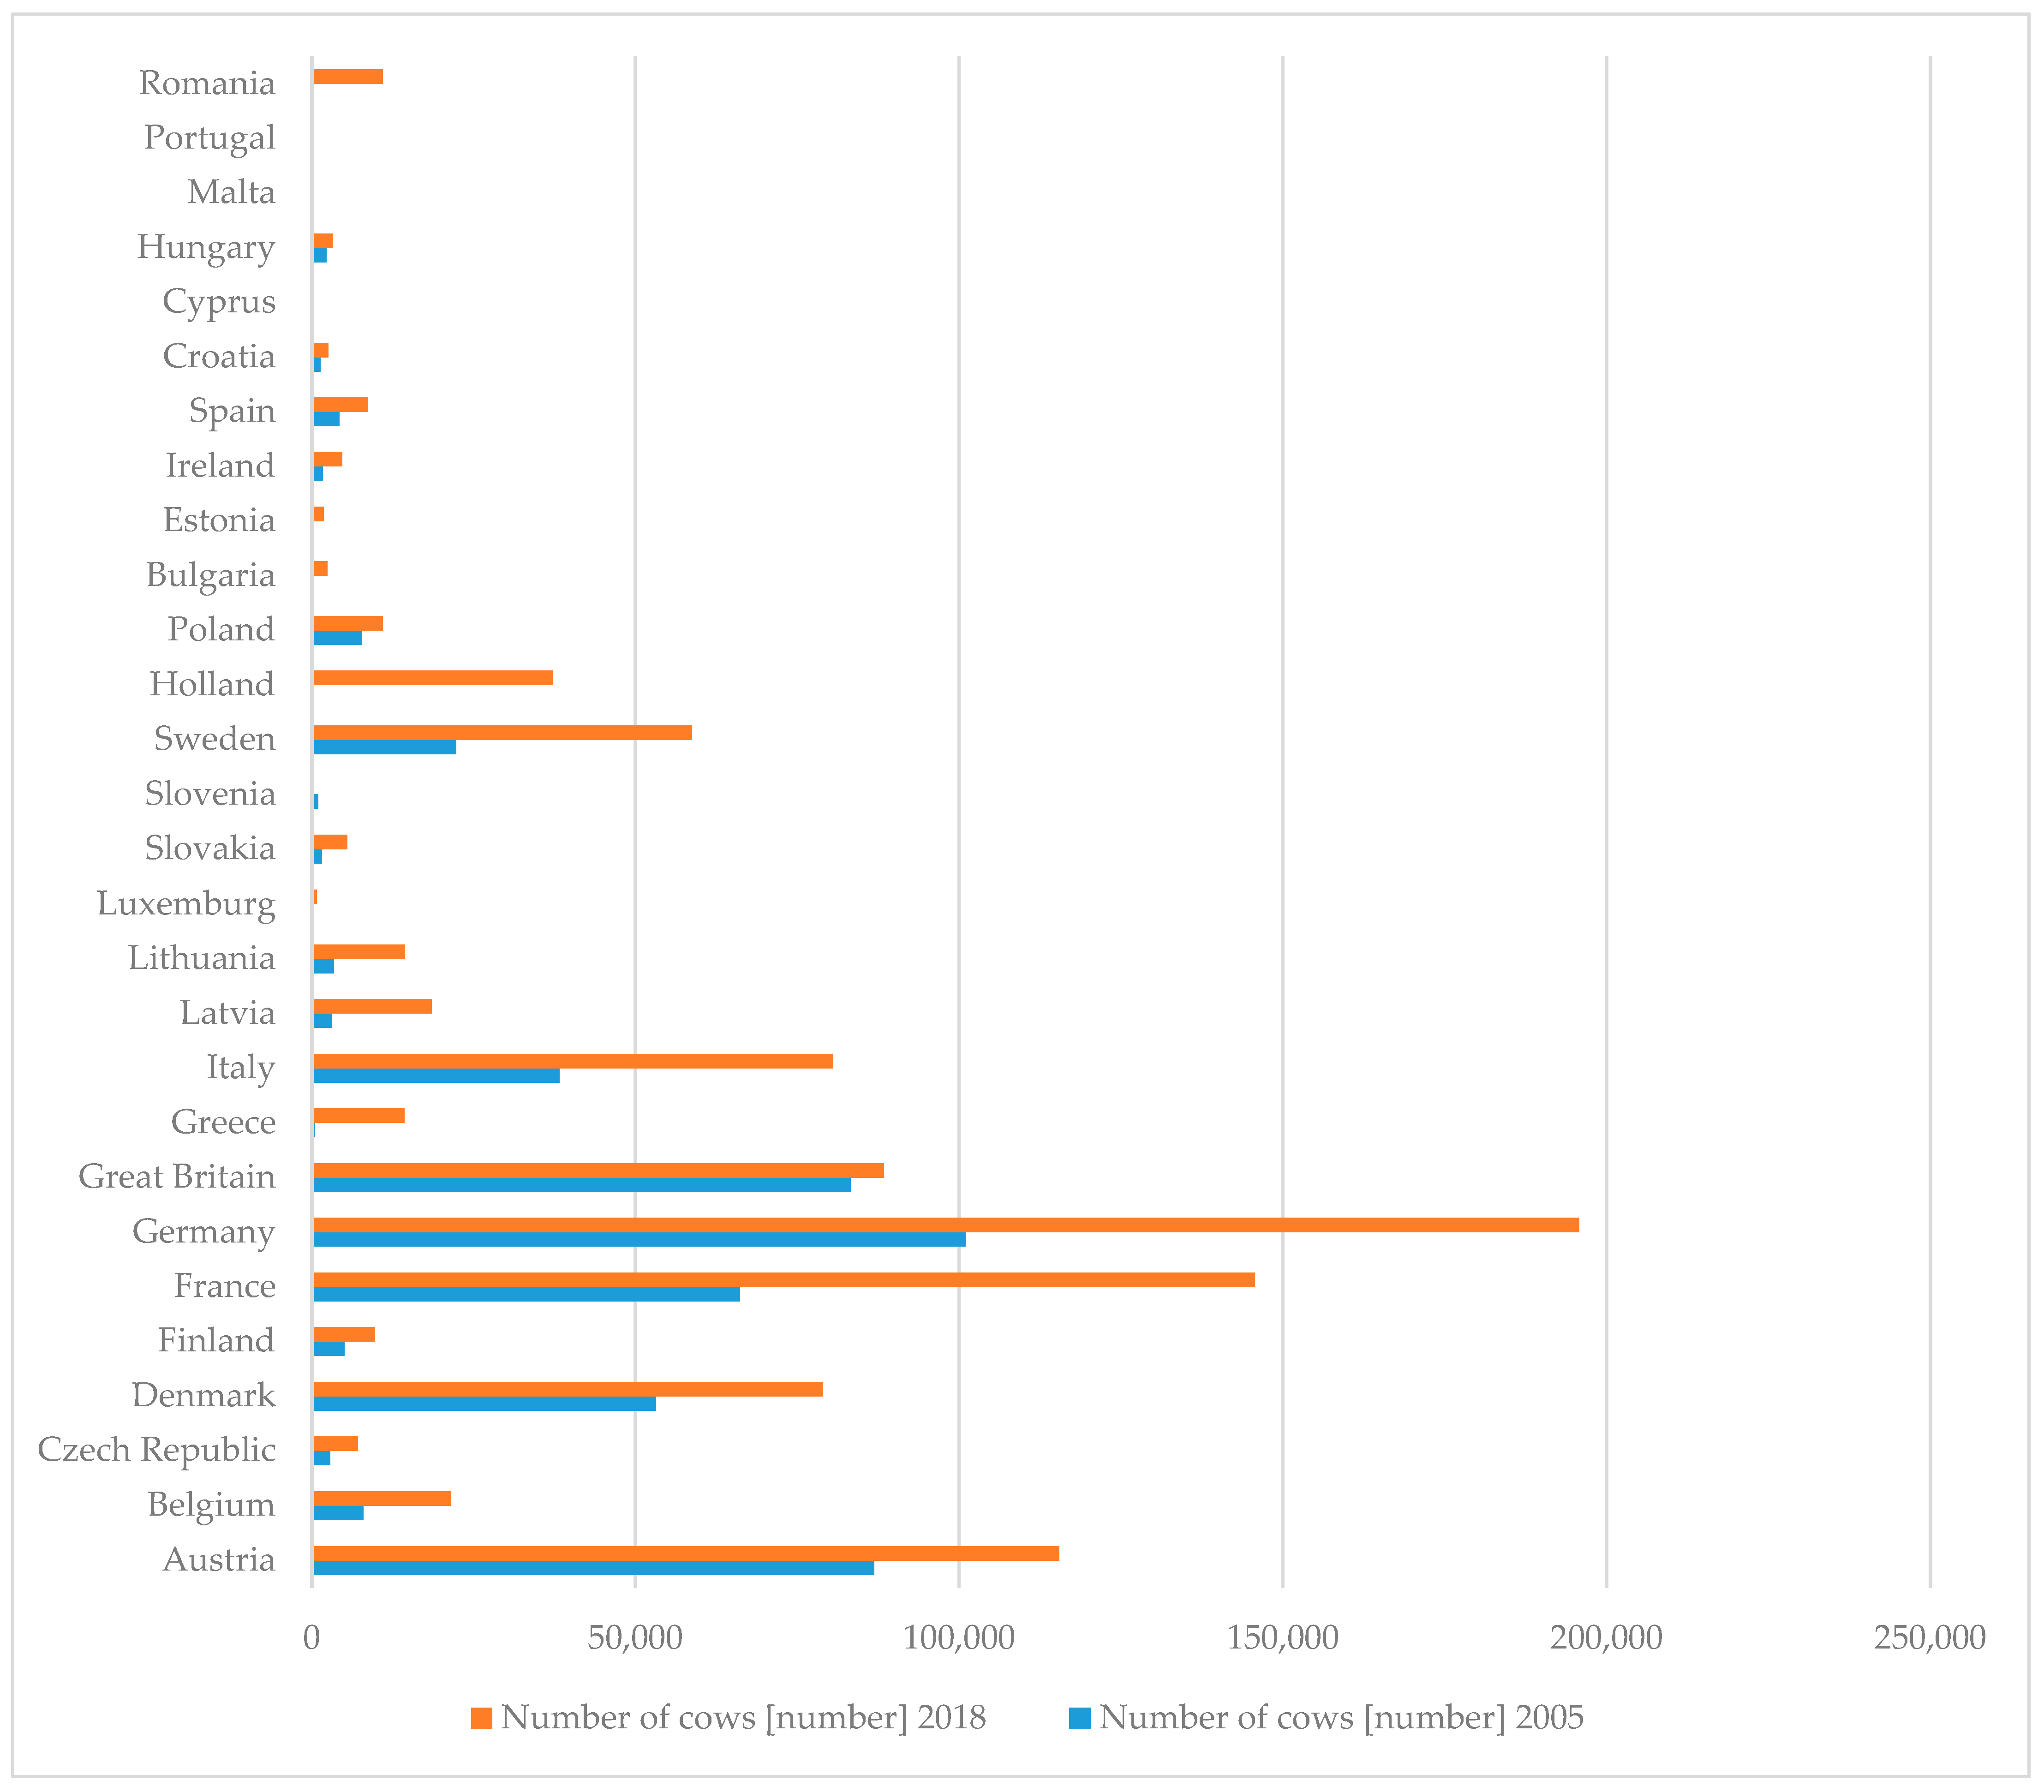
The authors of the paper wanted to examine how cow numbers are changing in the EU. The data presented in Figure 2 shows that the largest number of cows in 2018 were in Germany (195,750 heads), France (145,649 heads), and Austria (115,425 heads). The biggest increases of cow numbers on organic farms were observed in Holland (12,090%), Greece (2890%), and Latvia (507%) in the years 2005–18.
As we can see from the Figure 2, Poland has a lower number of cows than EU countries. Moreover, Szarek et al. [67] claimed that Polish organic dairy farms had poor conditions in terms of heifers and cow nutrition in past decades, which resulted in a low average milk yield.
Organic milk production is strongly linked to organic crop area, which delivers fodder [68]. Spain among the EU countries had the largest organic crop area in 2018 (2,246,475 thousand ha), France (2,034,115) and Italy (1,957,937). The biggest increase of organic crop area in 2018 compared to 2005 was observed in Bulgaria (11465.4%), Croatia (3516.1%) and Cyprus (491.6%). The smallest increase of organic crops area in 2018 compared to 2005 was observed in Holland (18.7%), Portugal (25.4%) and Germany (51.3%). The decrease of organic crops area in 2018 compared to 2005 was only in Great Britain (−26.2%) [69].

3.2. Dairy Cow Numbers, Organic Milk Production, and Land in the EU

The authors of the paper wanted to check the statistics of cows on organic farms in some EU countries. As we can see from Table 1, the highest average number of cows in dairy farms was observed in Germany (156,250 heads), France (116,360), and Austria (100,970). These countries had the highest number of cows on organic farms (respectively 203,958, 145,649, 115,425). Four countries of the EU had no organic dairy farms in 2005.
The coefficient of variation shows the changes in the analyzed data. It describes the data points around the mean. It describes the ratio of the standard deviation to the mean. Portugal (205%), Cyprus (123%), Romania (114%), Greece (85%), Bulgaria (46%), and Croatia (49%) achieved the biggest coefficients of variation, whereas Malta (0%), Slovenia (0%) had no differences in the analyzed data. Austria (10%), Denmark (13%), and Hungary (19%) had the lowest coefficients of variation.
Skewedness and kurtosis measure the asymmetry of the data. When we combine skewedness and kurtosis, we test the normality showing that limiting variance accounts for the serial correlation in the data [70,71]. However, kurtosis is useful in thin tails for example in the normal distribution. Skewedness describes the extent to which the analyzed distribution is different from the normal distribution. A normally distributed variable can be described by skewedness and kurtosis near zero [72]. Skewedness was negative for 10 countries, which means that the mean of negatively skewed data was less than the median. Kurtosis was negative in eighteen countries and it tells how the tails of distribution are different from a normal distribution. Negative kurtosis shows the distribution with lighter tails than normal. Our results depend only on stationarity and the existence of some moments as it was achieved by other authors [70].
In order to check the stationarity of the data, the ARIMA model was elaborated. Phi_1 is described by AR whereas theta_1 represents the MA. AR (autoregression) describes the changing variable that regresses on values. The MA part shows the coherence between an observation. It is also used to calculate the residual error from the model (Table 2). The I (integrated) describes the differencing of raw observations required for the time series to become stationary. We did not have data for Cyprus and Slovenia.
The economic data was used to prepare forecasts (Table 3). We used our ARIMA model to make our forecast. This is a common action, the aim of which is to predict how the variable will change in the future. For Sweden and Cyprus, we could not prepare forecasts because of lack of data. The number of cows in organic farms will increase in Poland. However, the process will be faster in other EU countries. The increase of cows in organic farms and milk production depends not only on producers, but also on processors. The FIBL-AMI [73] data show that Poland has only 5% of the producers in the EU. However, the organic processors are smaller at 4%. The distribution of organic processors in the EU shows that the most are in Italy (25%), Germany (21%), France (21%), Spain (6%), and United Kingdom (4%). These data show that the market for organic dairy products in our analysis in Poland is not developing well. Most Polish organic food is exported to Germany and other EU countries.
Countries with the largest number of cows on organic farms will not have the fastest pace of increase. This means that the market seems to be saturated.
The ARIMA model was elaborated to check if the data is stationary. The data presents average for the EU because of the lack of the data for particular countries (Table 4).
However, based on the data we can explain which countries of the EU will increase the organic milk production and organic land. In the EU, the organic farmland increased more than two-thirds. Spain (2.2 million hectares and 14% share of organic farmland in the EU in 2018), France (2 million hectares), and Italy (1.95 million hectares) are the countries with the highest contribution of organic land in the EU [73].
Table 5 presents the prognosis for the analyzed factors. The model predicts the largest increase for milk production (30.8%) and arable crops (27.4%). Permanent grasslands will increase (14.1%). This land is a very important in organic milk production because it is the source of fodder.
Organic cow milk production is and will be developing well in the EU. It has almost doubled since 2007. The production with 5.3 million metric tons in 2018 constitutes 3.4 percent of the EU milk production [73]. Germany, France and Austria are the top countries having the most cows and production. Latvia, Liechtenstein, Sweden, and Austria have the highest share (more than 20 percent).
The development of organic milk production depends and will depend not only on producers, but also on processors and consumers. The number of processors in 2018 in the EU was 72,000. Italy had the most producers (20,087) and Germany had the largest number of importers (1723). The per capita consumption of organic food in 2018 was the largest in Denmark and Switzerland (both 312 euros), Sweden (231 euros), Luxemburg (221 euros), and Austria (205 euros) [63].

3.3. Factors Shaping Production in Dairy Organic Farms Running Rural Accountancy FADN in Poland

The records of farms collected by rural advisors running rural accountancy is the most detailed and valuable database. Each year the advisor visits the farm quarterly and collects data based on bills and invoices.
Polish and Central and Eastern European countries have small farms characterized by small-scale production and eco-efficiency [74]. Such farms fit perfectly with the concept of sustainable development because they use few chemical fertilizers and pesticides. This encourages farm owners to transform their holdings into organic activity, which is based on environmentally and animal-friendly farming practices. However, this production system is based on certification, which is difficult for farmers to attain [75]. Farmers must take actions established by CAP and must advertise their products among farming community and consumers to get satisfactory prices. The price of organic milk products depends not only on protein and other ingredients content, [76] but also on market characteristics such as consumer willingness to pay for products and logistic systems.
The number of ecological dairy farms in the period 2007–2018 increased 181.3%. The area of fodder increased 116.3% and farmland 84.5%. The leased area increased 16.7%. An organic dairy production system is forage based. Its aim is to include animal health and welfare, while eliminating the use of chemical fertilizers and reducing the use of conventional veterinary treatments [33]. Organic dairy production has increased the demand for “grass-based” dairy production, which relies heavily on grazing and the use of forage crops, primarily due to the reported human health benefits of the milk produced, as well as perceived environmental and animal welfare benefits in most world countries [77].
Organic dairy farms are larger than conventional dairy farms. According to FADN data, the farm area of conventional dairy farms in 2018 was 22.5 ha and was 6.1 ha smaller than organic dairy farms (Table 6).
Plant production, mainly permanent pastures and meadows are more important in organic dairy farming than on traditional farms [78]. The permanent meadows and pastures in dairy organic farming protect or create biodiversity—especially for grasslands, which are considered potential habitats rich in plant, animal and microorganism species. The Rio Summit in 1992 and, consequently, the Convention on Biological Diversity, increased global awareness of the importance of sustainable development for the protection of wilderness. Agriculture is an inseparable element of this phenomenon because agricultural practices can potentially destroy habitat [79,80].
Cow numbers on organic farms increased by 95.3% in the years 2007–2018. The achieved milk yield per cow has increased almost by 38.7% in the years 2007–2018. This is because the farmers now use animals that give more milk, and they are also changing their feeding systems (Table 7). The average number of cows was 15.43 in 2018. This number is not high and shows a small scale of production. According to Malaga-Toboła [81], farms keeping more than 20 cows can achieve profitability at 140% level. Organic farms with 11–20 cows can achieve smaller profitability in Polish conditions.
However, the milk yields on dairy organic farms in 2018 was smaller (4698 kg/cow) than on conventional dairy farms (5748 kg/cow). This means that organic dairy farms need more cows to achieve the same milk production. According to FADN data, traditional dairy farms kept (15.43 dairy cows) and were bigger than organic farms (13.63 cows). According to the FADN data, other animals are few and their production is less important in creating income.
Such results have been confirmed in many studies. The different production level of organic dairy farms has been found in countries that can be the results of different system intensities [67,82].
The results demonstrate that the number of dairy cows increased faster than farmland area in the studied organic dairy farms. Such a situation may result in production disorders in the future, which affect farm income [42]. Bigger farm area helps to keep animals healthy, avoiding disorders and increasing efficiency.
Our study demonstrates that organic dairy farms are more environmentally friendly and support sustainability because the farmers not only keep cows, but also other livestock such as calves, heifers, bulls, pigs, sheep, and goats. Farms where more than one breed is kept are more valuable in terms of sustainability [43].
As we can see from Table 7, the majority of organic animal production consists of milk and cattle. These sectors should adjust to different organic requirements and typical management procedures. That is why we can conclude that there are different dairy production systems in Europe [83].
The value of milk and dairy products increased in Poland by more than 280% in 2007–2018. However, Polish, Austrian, and Swiss organic dairy farms have smaller herd sizes and lower milk production. The highest milk production levels and largest herd sizes are in Denmark, Sweden, and northern Germany [84].
The development of organic dairy products is possible because the organic dairy and livestock industries have grown. This caused a reduction in organic prices and some producers exited the sector [85].
Organic dairy production has benefits for plant production because of mowing and grazing of animals. The abandonment of these practices in abandoned areas is the cause of secondary succession manifested by gradual overgrowth of unused areas, e.g., through bushes and trees, which is associated with the loss of the nature of the open landscape and the withdrawal of animal species associated with it. This problem is increasingly affecting grassland in the large river valleys in Poland [86,87,88].
The intensification of agriculture was one of the most important factors contributing to the decline in the population of many species of birds (partridge, corncrake, etc.) [89,90].
Table 8 presents production and income of dairy organic farms. Total production increased 208.5% in the years 2007–2018, but the intermediate consumption increased 209.2%. This result shows that the costs increase faster than production. The research done by Sosnówka-Czajka [36] shows that organic farms with an area exceeding 20 ha are specializing in cattle, sheep, or pigs. Smaller organic farms in Poland specialize in pork and organic lamb production. Livestock production on Polish organic farms has relatively small herds, demonstrating that a small scale of production and specialization generates high production costs.
Our analysis confirms that the highest increase in 2007–2018 was observed in the costs of external factors (348.1%). This includes payments for workforce, credit costs, and other external factors. This means that farmers have to pay more for external factors.
Another increase was observed in balance of subsidies and taxes (229.5%), gross value added (229.4%) and income from a family farm (227.1%). The balance of subsidies and taxes is important because they are the effect of payments for organic production (Table 8).
When we compare these results with the poorly developed processing of organic animal production in Poland, and small demand for the organic products in Poland the prospects for this sector are not promising [91]. The diversification of animal production in dairy organic farms and the entire organic sector in Poland is high and generates high cost.
Production factors and their productivity are essential in achieving production effects in dairy farms. According to Smędzik-Ambroży [92], this statement is universal, regardless of the form of the production function, the sector of the economy, and the type of growth, i.e., extensive (based on increasing the use of a given factor) or intensive (increasing the productivity of a given factor). Therefore, they are also of key importance for efficiency relationships, and thus determine the level of investment.
W. Petty considered land and labor as the primary determinants of national wealth. In the real world, the prices of goods are determined by the cash costs of production comprising wages/salaries, pensions, and profits as the remuneration of the traditional production factors, labor, land, and capital. It was recognized in A. Smith’s later theory and became the basis for the formulation of the so-called Smith’s dogma, developed further by J. B. Say, who also noticed the value-creating role of capital and land, thus rejecting value theories based solely on labor introduced primarily by D. Ricardo and K. Marx [93].
Fixed and current assets are important on organic dairy farms because they determine organization and the economic situation. According to Guth and Smedzik-Ambroży [94], factor endowments are the primary determinants of the economics of farming. This is also supported by other studies of various authors, that show that the effects of farming in agriculture are primarily determined by the use of production resources.
The highest increase was observed in land value (642.6%). This is because the demand for land has increased. Investment in land is becoming more popular (Table 9). Land is considered to be the most important asset for the rural population because it is the place of their livelihood [95]. The soil is responsible for the production of 95% of the food produced for people and feed produced for animals [96].
This helped to renew fixed assets that resulted in the realization of current production processes and their development [97]. However, the share of fixed assets in agriculture in Polish farms is still very high (more than 80%). Such a situation can cause low capital efficiency.
Current assets are also important in organic dairy farms. They include the current herd, stock, other current assets, long-term debt, and short-term debt. Its feature is the necessity to use it within one year from the date of purchase. The most important features of current assets are change in material form in the course of production, complete wear and tear in the course of production, and the transfer of value to manufactured products. Current assets increased for 267% in the analyzed period. However, the highest increase was observed in long-term debt, which shows the willingness to invest on organic dairy farms (Table 9). Organic dairy farms do not use chemical fertilizers and pesticides so the value of current assets in dairy organic farms is generally smaller in comparison to tradition production system. Organic dairy farms are larger than typical Polish farms and they have a higher proportion of current assets, which shows better liquidity. This enables them to invest to a greater extent [98].
The impact of factor endowments on the efficiency of agricultural production results from the production function. This illustrates the relationship between the amount of expenditure incurred and measured, e.g., depreciation, the number of man-hours, the number of employees, the area of agricultural land, the value of fertilizers, and other current assets, and the results achieved (e.g., the amount of product produced) [92].
First, we used correlation analysis to check how the variables correspond with each other (Table 10). The analysis confirmed that organic milk production is mostly correlated to total agricultural production and family farm income. That is why we built three models for these variables separately.
Moreover, milk production is also strongly correlated with the cow numbers (LU), milk yield (kg/cow), value of fixed assets (PLN), value of land (PLN), value of machinery (PLN), value of current assets (PLN), and long-term debt (PLN). Based on the correlation analysis the authors eliminated the following variables: X2, X3 and X7 (Table 10).
An important part of the agricultural economy of many countries in the world is the production of milk on farms specializing in dairy cattle breeding, thanks to which many jobs were created, also in rural areas, mainly in food processing [99].
The analysis of factors that may affect organic milk production on farms generated many interesting results (Table 11). After verification of independent variables, it can be observed that the adjusted R 2 = 0.937 for the organic milk production model, so the model explains the vast majority of the variation in milk production on farms in the individual EU countries. The regression analysis shows the impact of independent variables on organic milk production. The variables which have an impact on organic milk production are: X3—cow numbers, X5—value of fixed assets (PLN), X8—value of current assets, X9—long term debt and X5—short term debt (Table 11).
The multiple regression coefficient R2 = 0.945 for total organic farms production means that this variable is strongly correlated with the following variables: X3—cow numbers, X5—value of fixed assets, X8—value of current assets and X9—long term debt.
The final dependent variable income of the family farm depended on X3—cow numbers, X5—value of fixed assets, X8—value of current assets. The all analyzed regression models have a high coefficient of determination R2, which indicates the high level of fit of the models [22].

4. Discussion

Organic dairy farming produces milk using home-produced fodder. Moreover, the animals live longer as they are not exploited so intensively. Raising ecological cows improves cow health, lowering the rate of death loss, and fewer herd replacement animals are needed [23]. However, the most important problem is lower economic efficiency and productivity of organic dairy farming compared to conventional farms.
Environmental and economic benefits of organic farming have an impact on its adoption. “Organic standards are evolving to address challenges faced in specific markets. This evolution is aimed at guaranteeing fairer competition for farmers and operators, preventing fraud and unfair practices, and improving consumer confidence in organic products” [100,101,102].
According to Willer and Lernoud [68], between 2007 to 2016, organic dairy production in the EU almost doubled, constituting more than 2.8% (4.1 million metric tons) of total milk production. Organic dairy farming is diversified in different regions of the EU. In the UK organic dairy farms are mainly located in southwestern England and Wales, which are traditional dairy processing areas.
In Germany, the organic dairy farming is located in Southern Germany mainly in Baden-Württemberd and Bavaria [103]. In Denmark, this activity is situated in Jutland (75%) and The Islams (25%) and is mainly concentrated in the South because of favorable conditions for dairy farming, good advisory services, and processing capacity. In Italy, for example, organic dairy farms are located in the Po Valley and Central Italy [104,105].
In Poland, organic dairy farming is located in Warmia and Mazury and Podlaskie voivodeships. Organic production in Poland shows large spatial and regional variation. Production in organic farms is mostly concentrated in northern and southern voivodeships of Poland (Kujawsko-Pomorskie, Pomorskie, Podlaskie, Warmińsko-Mazurskie and Zachodniopomorskie) and in the Dolnośląskie. These regions are famous for dairy production, have highest potential, and local conditions that are excellent not only for organic farming, but also for agritourism and other environmentally friendly agricultural activities [36].
Organic milk production is mainly influenced by elements such as the level of investment, resources, prices and costs [106]. The functioning of dairy farms determines their spatial distribution in different regions, economic value, and the efficiency of milk production. Dairy farms, due to the growing costs of means of production and increasing labor costs, increase the level of production [107]. The development of dairy farms shapes sustainable development and the level of investment. Dairy farms need to invest in the modernization of fixed assets, animal welfare and environmental protection, while increasing production levels to cope with market competition. This direction of investments took place in many European Union countries, which was a result of the requirements related to integration [108,109].
The development of milk production on organic farms and cow numbers depends on the development of entire market. Poland has 5% of EU organic producers, but fewer than 4% of organic processors. This means that further development of processing sector will require outlays in such enterprises.
The development of dairy and organic agriculture as whole depends on subsidies in the Rural Development Program. The program in 2007–2013 was more pro-organic farming. The RDP in new perspective 2014–2020 has more restrictions planned on the subsidies for organic farming that will have a negative impact in the number of organic farms in Poland. Such a situation will not encourage an increase in production of organic food including milk. Polish organic dairy farms represent family farming, not large farms, and the RDP will deliver most profits from subsidies acquired for permanent grassland [36]. The CAP for milk organic farming should be coherent to increase the number of dairy organic farms.
Even though the demand for dairy organic products in Poland is rather small, the production can be increased by exports to other EU countries. These products are more popular in the United Kingdom (24%), Italy (21%), Germany (17%), and France (16%). Such a situation creates the opportunity to support domestic producers to fulfill the needs in western EU countries [110].

5. Conclusions

Our research confirms the small scale of dairy organic farms’ production in Poland. Breeding 15 cows does not guarantee a satisfactory income from organic dairy production. Moreover, the diversification of organic milk production to cattle breeding, pork, and other animals creates high costs of production and external factors. Organic farms keeping more than 20 cows have the potential to achieve satisfactory income [92]. To achieve the satisfactory income organic dairy farms should increase production and achieve more specialization that can reduce costs of production.
The aim of the paper was to analyze changes in the production of ecological dairy production in Poland on the context of the EU. Our analysis has confirmed a significant increase of dairy cattle production in Poland in 2007–2018. The biggest producers with the largest number of dairy cows in 2018 were Germany (195,750 head), France (145,649 head) and Austria (115,425 head). However, the biggest increase of dairy cows in organic farms in the 2005–2008 were observed in Holland (12.090%), Greece (2.890%), and Latvia (507%).
The number of dairy cows on organic farms has changed in the analyzed period. The descriptive statistics enabled us to check the changes. Only Malta (0%), Slovenia (0%) had no differences in the number of dairy cows. The lowest coefficient of variation was typical for Austria (10%), Denmark (13%) and Hungary (19%) whereas Portugal (205%), Cyprus (123%), Romania (114%), Greece (85%), Bulgaria (46%), and Croatia (49%) had the biggest coefficient of variation.
Our prognosis shows that the highest increase in 2019–2023 will be observed for milk production (30.8%) and arable crops (27.4%) and the lowest for permanent grasslands (14.1%). The small increase of organic milk production and arable crops will be the effect of changing customs of consumers who require healthy food.
The EU organic dairy market is diverse. The difference occurred between production levels, nursing systems, farm size and health status. They also differed in management strategies, including feeding and other practices [84].
More difficult and more expensive ecological dairy production has a barrier of lower profitability. The most important barrier is the sales systems and prices that are more expensive than traditional products, which discourages consumers [20]. The prices of ecological products are 84% higher than traditional products [23].
Our results demonstrate that the organic dairy farms achieve lower production levels than conventional farms. However, they have other advantages in sustainable development, fertility, and animal longevity. The very important benefits for organic milk production are the reduced use of pesticides and phosphorus. These factors have an impact on the reduction of global warming [14].
Milk production on organic farms depends on the following variables: cow numbers, value of fixed assets, value of current assets, long-term debt and short-term debt. Our analysis confirms that milk production on organic farms depends on many variables that are common for farms. To achieve stable production, farmers must take into account many factors that are different for each farm.
Polish dairy organic farms combine milk, beef, pork, and goat meat production. This means that they are potentially reducing greenhouse gas emissions for the same production level in comparison to the same production level on traditional farms. That is why, based on the literature, we can conclude that they achieve greater sustainability in the organic sector in comparison to other production systems [43].

Author Contributions

Conceptualization, P.B. and M.B.B.; methodology, P.B. and M.B.B.; software, P.B.; validation, P.B. and M.B.B.; formal analysis, P.B.; investigation, P.B.; resources, P.B.; data curation, P.B.; writing—original draft preparation, P.B., M.B.B., A.P. (Aleksandra Perkowska), A.P. (Andrzej Parzonko), L.W., T.R.; writing—review and editing, P.B., M.B.B., A.P. (Aleksandra Perkowska), A.P. (Andrzej Parzonko), L.W., T.R. and J.W.D.; project administration, P.B.; funding acquisition, P.B. All authors have read and agreed to the published version of the manuscript.

Funding

The article was written by the project funded by the National Science Centre in Poland allocated on the project OPUS 15, number of the project: 2018/29/B/HS4/00392.

Institutional Review Board Statement

Not applicable.

Informed Consent Statement

Not applicable.

Data Availability Statement

The data presented in this study are available on request from the corresponding author.

Acknowledgments

The Authors of the paper would like to thank two anonymous reviewers for their comments which helped to improve this paper.

Conflicts of Interest

The authors declare no conflict of interest.

References

  1. Wójcik, A.; Karbowska, K.; Karbowska, K.; Dzięgiel, D. Rearing dairy cattle on an organic farm. Przegląd Hod. 2016, 4, 9–12. [Google Scholar]
  2. Pawlewicz, A. Regional Diversity of Organic Food Sales in the European Union. In Proceedings of the 50th International Conference “Economic Science for Rural Development”, Jelgava, Latvia, 9–10 May 2019; LLU-ESAF: Jelgava, Latvia, 2019; pp. 360–366. [Google Scholar] [CrossRef]
  3. Garbach, S. Probiotics and gastrointestinal health. Am. J. Gastroentirol. 2000, 95 (Suppl. 1), 2–4. [Google Scholar] [CrossRef]
  4. Garcia, S.N.; Osburn, B.I.; Cullar, J.S. A one health perspective on dairy production and dairy food safety. One Health 2019, 7. [Google Scholar] [CrossRef] [PubMed]
  5. Simo, D.; Mura, L.; Buleca, J. Assessment of milk production competitiveness of the Slovak Republic within the EU-27 countries. Agric. Econ. Czech 2016, 62, 482–492. [Google Scholar] [CrossRef] [Green Version]
  6. Gulseven, O.; Wohlgenant, M. What are the factors affecting the consumers’ milk choices? Agric. Econ. Czech. 2017, 63, 271–282. [Google Scholar] [CrossRef] [Green Version]
  7. Becker, C.A.; Stone, A.E. Differences between Organic and Conventional Cow’s Milk; Mississippi State University Extension: Hood Road, MS, USA, 2020. [Google Scholar]
  8. Czyżewski, B.; Matuszczak, A.; Grzelak, A.; Guth, M.; Majchrzak, A. Environmental sustainable value in agriculture revisited: How investment subsidies foster eco-efficiency. Ann. Pol. Assoc. Agric. Agribus. Econ. 2019, 21, 76–84. [Google Scholar] [CrossRef]
  9. Czyżewski, B.; Matuszczak, A.; Grzelak, A.; Guth, M.; Majchrzak, A. Environmental sustainable value in agriculture revisited: How does Common Agricultural Policy contribute to eco-efficiency. Sustain. Sci. 2021, 16, 137–152. [Google Scholar] [CrossRef]
  10. Maëlys, B.; Niels, B.; Maréchal, G.M.; Guillaume, M.; Magali, S.C.; Guillaume, M. Conversion to organic farming decreases the vulnerability of dairy farms. Agron. Sustain. Dev. 2019, 39, 1–11. [Google Scholar] [CrossRef] [Green Version]
  11. Groeneveld, A.; Pearlings, J.; Bakker, M.; Heijman, W. The effect of milk quota abolishment on farm intensity: Shifts and Stability. NJAS Wagening. J. Life Sci. 2016, 77, 25–37. [Google Scholar] [CrossRef]
  12. Schweden, B.H.; Wester, T.J.; Morel, P.C.H.; Tavendale, M.H.; Deadman, C.; Shadbolt, N.M.; Otter, D.E. Organic and conventionally produced milk—An evaluation of factors influencing milk composition. J. Dairy Sci. 2014, 98. [Google Scholar] [CrossRef] [Green Version]
  13. Bilik, K.; Lopuszanska-Rusek, M. Effect of organic and conventional feeding of Red-and-White cows on productivity and milk composition. Ann. Anim. Sci 2010, 10, 441–458. [Google Scholar]
  14. Cederberg, C.; Mattsson, B. Life cycle assessment of milk production—A comparison of conventional and organic farming. J. Clean. Prod. 2000, 8, 49–60. [Google Scholar] [CrossRef] [Green Version]
  15. Komorowska, D. Efficiency of organic dairy farms compared to all individual dairy farms. Ann. Agric. Econ. Rural Dev. 2016, 103, 46–52. [Google Scholar]
  16. Matuszczak, A.; Kryszak, Ł.; Czyżewski, B.; Łopatka, A. Environment and political economics: Left-wing liberalism or conservative leftism—Which is better for eco-efficiency. Evidence from Poland. Sci. Total Environ. 2020, 743, 140779. [Google Scholar] [CrossRef]
  17. Hicks, C.; Dietmar, R. Improving cleaner production through the application of environmental management tools in China. J. Clean. Prod. 2007, 15, 395–408. [Google Scholar] [CrossRef]
  18. Schwendel, B.H.; Wester, T.J.; Morel, P.C.H.; Fong, B.; Tarendale, M.H.; Deadman, C.; Shadbolt, M.; Otter, D.E. Pasture feeding conventional cows removes differences between organic and conventionally produced milk. Food Chem. 2017, 229, 805–813. [Google Scholar] [CrossRef]
  19. Tunick, M.H.; Van Hekken, D.L.; Paul, M.; Ingham, E.R.; Karreman, H.J. Case study: Comparison of milk composition from adjacent organic and conventional farms in the USA. Int. J. Dairy Technol. 2016, 69, 137–142. [Google Scholar] [CrossRef]
  20. Walczak, J.; Szewczyk, A. Environmental determinants of organic dairy farming. Wiadomości Zootech. R. Li 2013, 3, 81–92. [Google Scholar]
  21. Rosati, A.; Aumaitre, A. Organic dairy farming in Europe. Livest. Prod. Sci. 2004, 90, 41–51. [Google Scholar] [CrossRef]
  22. Bórawski, P.; Gotkiewicz, W.; Bełdycka-Bórawska, A.; Szymańska, E.J.; Brelik, A.; Harper, J.K.; Dunn, J.W. Changes in grassland and their impact on milk production in Poland in the context of environmental protection. Pol. J. Environ. Stud. 2020, 29, 1567–1578. [Google Scholar] [CrossRef]
  23. Borecka, A.; Szumiec, A. Economic effectiveness of organic dairy farming. Wiadomości Zootech. R. LI 2013, 3, 93–101. [Google Scholar]
  24. Nachtman, G. Economic sustainability of organic farms in 2010–2013. Probl. Agric. Econ. 2015, 4, 105–125. [Google Scholar] [CrossRef]
  25. Brodzińska, K. Rolnictwo ekologiczne—Tendencje i kierunki zmian. Probl. World Agric. 2014, 14, 27–36. [Google Scholar]
  26. Pawlewicz, A.; Szamrowski, P. The functioning and development of the organic food raw materials market under the new financial plan for 2014–2020. Village Agric. 2014, 3, 175–188. [Google Scholar]
  27. Sonesson, U.; Berlin, J. Environmental impact of future milk supply chains in Sweden: A scenario study. J. Clean. Prod. 2003, 11, 253–266. [Google Scholar] [CrossRef]
  28. Komorowska, D. Factors determining the effectiveness of ecological farms of different size groups. Econ. Organ. Agri. Food Sect. 2013, 104, 125–143. [Google Scholar]
  29. Runowski, H. Organic Farming—Progress or Regress? Ann. Agric. Econ. Rural Dev. 2009, 96, 182–193. [Google Scholar]
  30. Kirk, J.; Slade, K. An Investigation into UK Consumer Perception of Organic Lamb. In Proceedings of the Organic Meat and Milk from Ruminants, Athens, Greece, 4–6 October 2002; Zervas, K., Ed.; EAAP Publication: Rome, Italy, 2002; Volume 106, pp. 157–161. [Google Scholar]
  31. Council of the European Union. Council Regulation (EC) No. 834/2007. 2007. Available online: http://eur-lex.europa.eu/LexUriServ/LexUriServ.do?uri=OJ:L:2007:189:0001:0023:EN:PDF (accessed on 24 July 2020).
  32. Koloszko-Chomentowska, Z. The economics consequences of supporting organic farms by public funds: Case of Poland. Technol. Econ. Dev. Econ. 2015, 21, 332–350. [Google Scholar] [CrossRef]
  33. Rodriguez-Bermúdez, R.; Miranda, M.; Boudracco, J.; Fouz, R.; Pereira, V.; López-Alonso, M. Breeding for organic dairy farming: What types of cows are needed? J. Dairy Res. 2019, 86, 3–12. [Google Scholar] [CrossRef] [Green Version]
  34. European Parliament, Council of the European Union. Decision No 1386/2013/ EU of the European Parliament and of the Council of 20 November 2013 on a General Union Environment Action Programme to 2020 “Living Well, within the Limits of Our Planet”. 2013. Available online: https://eur-lex.europa.eu/legal-content/EN/TXT/?uri=celex%3A32013D1386 (accessed on 30 August 2020).
  35. Czyżewski, B.; Matuszczak, A.; Polcyn, J.; Smędzik-Ambroży, K.; Staniszewski, J. Deadweight loss in environmental policy: The case of the European Union member states. J. Clean. Prod. 2020, 260, 121064. [Google Scholar] [CrossRef]
  36. Sosnówka-Czajka, E.; Iwona Skomorucha, I.; Muchacka, R. Characteristics of organic livestock farms in Poland in 2009–2011. Ann. Anim. Sci. 2015, 15, 197–210. [Google Scholar] [CrossRef] [Green Version]
  37. Bengtsson, J.; Ahnstrom, J.; Weibull, A.C. The effects of organic agriculture on biodiversity and abundance: A meta-analysis. J. Appl. Ecol. 2005, 42, 261–269. [Google Scholar] [CrossRef]
  38. Flohre, A.; Rudnick, M.; Traser, G.; Tscharntke, T.; Eggers, T. Does soil biota benefit from organic farming in complex vs. simple landscapes? Agricul. Ecosyst. Environ. 2011, 141, 210–214. [Google Scholar] [CrossRef]
  39. Fleszar, J. Quantitive and qualitive efficiency of milk production in ecological farm. J. Res. Appl. Agric. Eng. 2009, 54, 75–79. [Google Scholar]
  40. Sobczyk, M. Statistics; PWN: Warszawa, Poland, 2005. [Google Scholar]
  41. Paraffin, A.S.; Zindove, T.J. Perceptions of Factors Affecting Milk Quality and Safety among Large- and Small-Scale Dairy Farmers in Zimbabwe. J. Food Qual. 2018, 1–7. [Google Scholar] [CrossRef] [Green Version]
  42. Van Soest, F.J.S.; Mourits, M.C.M.; Blanco-Penedo, I.; Duval, J.; Fall, N.; Krieger, M.; Sjöstrom, K.; Hogeven, H. Farm-specific failure costs of production disorders in European organic dairy herds. Prev. Vet. Med. 2019, 168, 19–29. [Google Scholar] [CrossRef]
  43. Bieber, A.; Wallenbeck, A.; Leiber, F.; Fuerst-Waltl, B.; Vinckler, C.; Gullstrand, P.; Walczak, J.; Wójcik, P.; Spengler Neff, A. Production level, fertility, health production conditions in Austria, Switzerland, Poland, and Sweden. J. Dairy Sci 2019, 102, 5330–5341. [Google Scholar] [CrossRef]
  44. Grand, F.; Amelchanka, S.L.; Furger, M.; Clauss, M.; Zeitz, J.O.; Kreuzer, M.; Schwarm, A. Biological implications of longevity in dairy cows: 2. Changes in methane emissions and efficiency with age. J. Dairy Sci. 2016, 99, 3472–3485. [Google Scholar] [CrossRef] [Green Version]
  45. Zehetmeier, M.; Baudracco, J.; Hoffman, H.; HeiꞴenhuber, A. 2012. Does increasing milk yield per cow reduce greenhouse gas emissions? A system approach. Animal 2012, 6, 154–166. [Google Scholar] [CrossRef] [Green Version]
  46. Jespersen, L.; Baggesen, D.; Fog, E.; Halsnæs, K.; Hermansen, J.E.; Andreasen, L.; Strandberg, B.; Sørensen, J.T.; Halberg, N. Contribution of organic farming to public goods in Denmark. Org. Agric. 2017, 7, 243–266. [Google Scholar] [CrossRef] [Green Version]
  47. Vickery, J.A.; Tallowin, J.R.; Feber, R.E.; Asteraki, E.J.; Atkinson, P.W.; Fuller, R.J. The management of lowland neutral grasslands in Britain: Effects of agricultural practices on birds and their food resources. J. Appl. Ecol. 2001, 38, 650. [Google Scholar] [CrossRef]
  48. Ahlaman, T.; Ljung, M.; Rydhmer, L.; Röcklinsberg, H.; Strandberg, E.; Wallenbeck, A. Differences in preferences for breeding traits between organic and conventional dairy producers in Sweden. Livest. Sci. 2014, 162, 5–14. [Google Scholar] [CrossRef] [Green Version]
  49. Adenuga, A.H.; Davis, J.; Hatchinson, G.; Donnellan, T.; Patton, H. Environmental efficiency and pollution costs of nitrogen surplus in dairy farms: A parametric hyperbolic technology distance function approach. Environ. Resour. Econ. 2019, 74, 1273–1298. [Google Scholar] [CrossRef] [Green Version]
  50. Kelly, E.; Shalloo, L.; Geary, U.; Kinsella, A.; Thorne, F.; Wallance, M. The association of management and demographic factors with technical allocative and economic efficiency of Irish dairy farms. J. Agric. Sci. 2012, 150, 738–754. [Google Scholar] [CrossRef] [Green Version]
  51. Toma, L.; March, M.; Stott, E.; Roberts, D.J. Environmental efficiency of alternative dairy systems: A productive efficiency approach. J. Dairy Sci. 2013, 96, 7014–7031. [Google Scholar] [CrossRef] [Green Version]
  52. KPMG. Global Organic Milk Production Market Report. Available online: https://home.kpmg/content/dam/kpmg/au/pdf/2018/global-organic-milk-production-market-report.pdf (accessed on 1 April 2021).
  53. Available online: https://eur-lex.europa.eu/resource.html?uri=cellar:e64e3d13-5f95-4619-94d2-50a829404ae1.0001.01/DOC_7&format=PDF (accessed on 1 April 2021).
  54. Hamulczuk, M.; Hertel, K.; Klimkowski, C.; Stańko, S. Selected Problems of Forecasting Retail Food Price; Institute of Agricultural and Food Economics, National Research Institute: Warsaw, Poland, 2004. [Google Scholar]
  55. Choi, B.S. ARMA Model Identification; Springer: Berlin/Heidelberg, Germany, 1992. [Google Scholar]
  56. Routa, M.; Majhi, B.; Majhi, R.; Panda, C. Forecasting of currency exchange rates using an adaptive ARMA model with differential evolution based training. J. King Saud Univ. Comput. Inf. Sci. 2014, 26, 7–18. [Google Scholar] [CrossRef] [Green Version]
  57. De Jonga, P.; Penzerb, J. The ARMA model in state space form. Stat. Probab. Lett. 2004, 70, 119–125. [Google Scholar] [CrossRef]
  58. Erdem, E.; Shi, J. ARMA based approaches for forecasting the tuple of wind speed and direction. Appl. Energy 2011, 88, 1405–1414. [Google Scholar] [CrossRef]
  59. Rabiej, M. Statystyka z Programem Statistica; Wydawnictwo Helion: Gliwice, Poland, 2012. [Google Scholar]
  60. Kot, S.; Jakubowski, J.; Sokołowski, A. Statystyka; Difin: Warsaw, Poland, 2011. [Google Scholar]
  61. Malska, W.; Wachta, H. Wykorzystanie modelu ARIMA do analizy szeregu czasowego. Zesz. Nauk. Pol. Rzesz. 2015, 292, 23–30. [Google Scholar]
  62. Kurdyś-Kujawska, A.; Strzelecka, A.; Zawadzka, D. The Impact of Crop Diversification on the Economic Efficiency of Small Farms in Poland. Agriculture 2021, 11, 250. [Google Scholar] [CrossRef]
  63. Stanisz, A. Modele Regresji Logistycznej. Zastosowanie w Medycynie, Naukach Przyrodniczych i Społecznych (Logistic Regression Models. Application in Medicine, Natural and Social Sciences); Statsoft Polska: Kraków, Poland, 2016. [Google Scholar]
  64. FIBL. The World of Organic Agriculture. Statistics & Emerging Trends. 2019. Available online: https://www.organic-world.net/yearbook/yearbook-2019.html (accessed on 1 April 2021).
  65. Runowski, H. Economic aspects of organic milk production. Ann. Agric. Econ. Rural Dev. 2002, 96, 36–51. [Google Scholar]
  66. Market Trends 2019. Germany Has the Most Organic Cows. Available online: https://www.dairyglobal.net/Market-trends/Articles/2019/1/Germany-has-the-most-organic-cows-381636E/ (accessed on 1 April 2021).
  67. Szarek, J.; Adamczyk, K.; Felenczak, A. Polish Red Cattle Breeding: Past and present. Anim. Genet. Resour. 2004, 35, 21–35. [Google Scholar] [CrossRef] [Green Version]
  68. Willer, H.; Lernoud, J. The World of Organic Agriculture-Statistics and Emerging Trends. FiBL & IFOAM-Organics International. 2018. Available online: http://ciaorganico.net/documypublic/486_2020-organic-world-2019.pdf (accessed on 1 April 2021).
  69. Rakshit, H.B.; Sing, A. The ABC’s of Organic Production; JAIN BROTHERS: New Delhi, India, 2018. [Google Scholar]
  70. Bai, J.; Ng, S. Tests for Skewness, Kurtosis, and Normality for Time Series Data. J. Bus. Econ. Stat. 2005, 23. [Google Scholar] [CrossRef] [Green Version]
  71. Bai, J.; Ng, S. Tests for Skewness, Kurtosis, and Normality for Time Series Data; Boston College Working Papers in Economics No. 501; Boston College Department of Economics: Chestnut Hill, MA, USA, 2001. [Google Scholar]
  72. Park, H.M. Univariate Analysis and Normality Test Using SAS, STATA, and SPSS. Available online: http://cef-cfr.ca/uploads/Reference/sasNORMALITY.pdf (accessed on 12 February 2021).
  73. FIBL. The World of Organic Agriculture. Statistics & Emerging Trends. 2020. Available online: https://www.fibl.org/fileadmin/documents/shop/5011-organic-world-2020.pdf (accessed on 1 April 2021).
  74. Stępień, S.; Czyżewski, B.; Sapa, A.; Borychowski, M.; Poczta, W.; Poczta-Wajda, A. Eco-efficiency of small-scale farming in Poland and its institutional drivers. J. Clean. Prod. 2021, 279, 123721. [Google Scholar] [CrossRef]
  75. Lesjak, H.A. Explaining organic farming through past policies: Comparing support policies of the EU, Austria and Finland. J. Clean. Prod. 2008, 16, 1–11. [Google Scholar] [CrossRef]
  76. Groenestein, C.M.; Hutchings, N.J.; Haenel, H.D.; Amon, B.; Menzi, H.; Mikkelsen, M.H.; Misselbrook, T.H.; van Bruggen, C.; Kupper, T.; Webb, J. Comparison of ammonia emissions related to nitrogen use efficiency of livestock production in Europe. J. Clean. Prod. 2018, 211, 1162–1170. [Google Scholar] [CrossRef]
  77. Rotz, C.A.; Holly, M.; de Long, A.; Egan, F.; Kleinman, P.J.A. An environmental assessment of grass-based dairy production in the northeastern United States. Agric. Syst. 2020, 184, 102887. [Google Scholar] [CrossRef]
  78. Tiger, R. Organic Dairy Production Planning Concept. Ag Decision Maker. 2007. Available online: https://www.extension.iastate.edu/agdm/livestock/html/b1-24.html (accessed on 1 April 2021).
  79. Plantureux, S.A.; Peeters, A.; McCracken, D. Biodiversity in intensive grasslands: Effect of management, improvement and challenges. Agron. Res. 2005, 3, 153–164. [Google Scholar]
  80. Polish FADN. Standard Results of Polish FADN Agricultural Holdings; Institute of Agricultural and Food Economics, National Research Institute: Warsaw, Poland, 2019. [Google Scholar]
  81. Malaga-Taboła, U. Influence of the milking cows herd size and technical infrastructure on the production efficiency on ecological farms. Inż. Rol. 2011, 8, 207–214. [Google Scholar]
  82. Krieger, M.; Sjöström, K.; Blanco-Penedo, I.; Madouasse, A.; Duval, J.E.; Bareille, N.; Fourichon, C.; Sundrum, A.; Emanuelson, U. Prevalence of production disease related indicators in organic dairy herds in four European Countries. Livest. Sci. 2017, 198, 104–108. [Google Scholar] [CrossRef]
  83. Ivemeyer, S.; Brinkmann, J.; March, S.; Simantke, C.; Winckler, C.; Knierion, V. Major organic dairy farm types in Germany and their farm, herd and management characteristics. Org. Agric. 2017, 1–17. [Google Scholar] [CrossRef]
  84. Wallenbeck, A.; Rousing, T.; Sprensen, J.T.; Bieber, A.; Spengler, N.A.; Fuerst-Waltl, B.; Winckler, C.; Peiffer, C.; Steininger, F.; Simantke, C.; et al. Characteristics of organic dairy major farm types in seven European countries. Org. Agric. 2019, 9, 275–291. [Google Scholar] [CrossRef] [Green Version]
  85. Dimitri, C.; Oberholtzer, L. EU and U.S. organic markets face strong demand under different policies. Ambeer Walves 2006, 4, 12–19. [Google Scholar]
  86. Świtek, S.; Jankowiak, Ł.; Rosin, Z.M.; Sawinska, Z.; Steppa, R.; Takacs, V.; Zbyryt, A.; Tryjanowski, P. How to Keep a High Level of Biodiversity on Farmland Area in Poland? Identification of Major Research Problems. Village Agric. 2017, 4, 130. [Google Scholar]
  87. Tälle, M. Conservation of Semi-Natural Grasslands: Effects of Different Management Methods on Biodiversity; Department of Physics, Chemistry and Biology Division of Biology Linköping University: Linköping, Sweden, 2018; pp. 1–74. [Google Scholar]
  88. Lankoski, J. Alternative Payment Approaches for Biodiversity Conservation in Agriculture; OECD Food, Agriculture and Fisheries Papers No. 93; OECD Publishing: Paris, France, 2016. [Google Scholar]
  89. Wilson, J.D.; Whittingham, M.J.; Bradbury, R.B. The management of crop structure: A general approach to reversing the impacts of agricultural intensification on birds? IBIS 2005, 147, 455. [Google Scholar] [CrossRef]
  90. Tryjanowski, P.; Kuźniak, S.; Kujawa, K.; Jerzak, L. Ecology of Agricultural Landscape Birds; Bogucki Wydawnictwo Naukowe: Poznań, Poland, 2009; pp. 1–390. [Google Scholar]
  91. Jezierska-Thöle, A.; Gwiaździńska-Goraj, M.; Wiśniewski, L. Current status and prospects for organic agriculture in Poland. Questuiones Geogr. 2017, 36, 23–36. [Google Scholar] [CrossRef] [Green Version]
  92. Smędzik-Ambroży, K. Resources and Sustainable Development of Agriculture in Poland after Accession to the European Union; PWN: Warsaw, Poland, 2019. [Google Scholar]
  93. Blaug, M. Economic Theory. Retrospective Approach; WN PWN: Warsaw, Poland, 2000. [Google Scholar]
  94. Guth, M.; Smędzik-Ambroży, K. Economic resources versus the efficiency of different types of agricultural production in regions of the European union. Econ. Res. Ekon. Istraživanja 2019, 30, 318–333. [Google Scholar] [CrossRef] [Green Version]
  95. Mulale, K.; Chanda, R.; Perkins, J.S.; Magole, L.; Sebego, R.J.; Althopheng, J.R.; Mphinyane, W.; Reed, M.S. Formal institutions and their role in promoting sustainable land management in Boteti. Botswana. Land Degrad. Dev. 2014, 25, 80–91. [Google Scholar] [CrossRef]
  96. Panagos, P.; Imeson, A.; Meusburger, K.; Borrelli, P.; Poesen, J.; Alewell, C. Soil conservation in Europe: Wish or reality. Land Degrad. Dev. 2016, 27, 1547–1551. [Google Scholar] [CrossRef] [Green Version]
  97. Nowak, A.; Kamińska, A. Regional Differentiation of Investment Input in Polish Agriculture. Econ. Organ. Agri. Food Sect. 2013, 103, 17–27. [Google Scholar]
  98. Kryszak, Ł.; Guth, M.; Czyżewski, B. Determinants of farm profitability in the EU regions. Does farm size matter? Agric. Econ. Czech 2021, 67, 90–100. [Google Scholar] [CrossRef]
  99. Borawski, P.; Dunn, J.W. Conditioning of Milk Market Development in Poland with Particular Regard Paid to Price Volatility. In Economic Science for Rural Development 35; LLU-ESAF: Jelgava, Latvia, 2014; pp. 88–96. [Google Scholar]
  100. Bórawski, P.; Pawlewicz, A.; Parzonko, A.; Harper, J.K.; Holden, L. Factors Shaping Cow’s Milk Production in the EU. Sustainability 2020, 12, 420. [Google Scholar] [CrossRef] [Green Version]
  101. Slagboom, M.; Kargo, M.; Edwards, D.; Sorensen, C.; Thomasen, J.R.; Hjorto, L. Organic dairy farmers put more emphasis on production traits than conventional farms. J. Dairy Sci. 2016, 99, 9845–9856. [Google Scholar] [CrossRef] [Green Version]
  102. Pawlewicz, A.; Brodzińska, K.; Zvirbule, A.; Popluga, D. Trends in the development of organic farming in Poland and Latvia compared to the EU. Rural Sustain. Res. 2020, 43. [Google Scholar] [CrossRef]
  103. Rahmann, G.; Nieberg, H. New insights into organic farming in Germany—Empirical results of a survey in 218 farms. Landbauforsch. Völkenrode 2005, 3, 193–202. [Google Scholar]
  104. Häring, A.M. Organic dairy farms in the EU. Production systems, economics and future development. Livest. Prod. Sci. 2003, 80, 89–97. [Google Scholar] [CrossRef]
  105. Eurostat. Organic Farming Statistics. 2021. Available online: https://ec.europa.eu/eurostat/statistics-explained/index.php/Organic_farming_statistics#Total_organic_area (accessed on 1 April 2021).
  106. Smigła, M. Determinants of Milk Production in Euro-Regions with Very Big Milk Farms After 2004. J. Agribus. Rural Dev. 2014, 1, 143–150. [Google Scholar]
  107. Adamski, M. The Evaluation of Development Opportunities of Dairy Farms in Poland, Taking into Account the Economic Size. Ann. Agric. Econ. Rural Dev. 2014, 101, 80–90. [Google Scholar]
  108. Borawski, P.; Pawlewicz, A. Economic Efficiency of Individual Farms in the Sustainable Development Aspect Based on the Example of Warmia and Mazury Province. Zesz. Nauk. Akad. Rol. Wrocławiu 2006, 540, 91–97. [Google Scholar]
  109. Sass, R. Polish Milk Farms Against a Background of Member States UE-15. Ann. Agric. Econ. Rural Dev. 2009, 96, 209–224. [Google Scholar]
  110. European Commission. An Analysis of the EU Organic Sector; European Commission Directorate-General for Agriculture and Rural Development: Brussels, Belgium, 2010. [Google Scholar]
Figure 1. Development of organic cow’s milk production and organic lands in the European Union (EU) Source: own study based on data from EUROSTAT.
Agriculture 11 00323 g001
Figure 2. Number of cows in organic farms in the EU in 2005–2018. Source: own study based on data from EUROSTAT.
Agriculture 11 00323 g002
Table 1. Descriptive statistics of cows in organic farms in the EU.
CountryAverageMedianMinimalMaximal(+ −) NumberCoefficient of VariationSkewednessKurtosis
Austria100,970963,51086,896115,42510,3020.102020.37570−1.1678
Belgium14,69913,09879,93021,52044,4230.302210.26472−0.85902
Czech Republic65,61070.63528,65074,02015,1120.23033−2.16342.8789
Denmark63,51363,02453,11578,97284,0650.132360.61061−0.50431
Finland76,37278,96050,52098,02016,2770.21312−0.22124−1.1625
France116,360120,780661,2301,456,54925,5660.21972−0.87279−0.082160
Germany156,250149,390101,000203,95834,0240.21776−0.028026−0.87905
Great Britain78,03176,84870,13588,34460,1090.0770320.38325−0.82042
Greece56,63438,90048,00014,35148,2720.852350.99714−0.54486
Italy5703455,19438,28480,54715,6590.274560.31627−1.2801
Latvia1513618,24430,48019,77259,3120.39187−1.13860.025024
Lithuania99,53195,38534,47014,70635,3560.35523−0.27805−0.16829
Luxemburg53,81254,90024,30078,70015,1150.28088−0.448220.58228
Slovakia51,18555,11515,50063,94015,5850.30449−1.66421.6346
Slovenia10,0400.000010,04010,0400.00000.00000.00000.0000
Sweden46,66947,92222,32158,70210,6000.22713−1.59381.8362
Holland24,40225,04330,50037,18010,8160.44324−1.37921.3810
Poland13,14411,62278,00020,01541,7140.317360.69540−0.76263
Bulgaria15,02912,83032,80029,55011,4480.761720.21025−1.6749
Estonia18,30618,86524,10025,42070,0880.38286−1.54481.5471
Ireland24,63220,54017,37047,52010,1280.411151.61271.3790
Spain52,08143,10015,56086,61025,5040.489700.19770−1.2566
Croatia18,82617,70513,71025,67050,1080.266160.38647−1.4100
Cyprus12,96250,5000.000040,10016,0381.23730.61608−1.1943
Hungary27,03225,16021,57033,39051,9200.192070.25696−1.7476
Malta0.00000.00000.00000.00000.00000.00000.00000.0000
Portugal34,0000.00000.000020,10069,8512.05442.00002.3809
Romania75,36654,9150.000021,66786,3041.14510.40748−1.3254
Source: own elaboration based on data from EUROSTAT.
Table 2. Autoregressive integrated moving average model (ARIMA) model of organic cows in the EU.
CountryNumber of Cows [Number]
phi_1CoefficientStd.errorzp Valuetheta_1CoefficientStd.errorzp Value
Austriaphi_10.6861.8110.1960.845theta_10.3831.4130.2710.787
Belgiumphi_10.6910.4181.6520.099theta_10.3030.6160.4920.623
Czech Republicphi_1−0.0190.036−0.5090.611theta_10.9990.6221.6080.108
Denmarkphi_10.2540.6150.4140.679theta_10.4560.4421.0300.303
Finlandphi_10.8070.07112.2800.000theta_1−0.9990.424−2.3570.018
Francephi_10.5850.4551.2860.199theta_10.3240.3320.9740.330
Germanyphi_10.7630.2562.9800.003theta_10.7600.6241.2180.223
Great Britainphi_1−0.1201.978−0.0610.952theta_10.3014.2800.080.944
Greecephi_11.3920.3893.5740.000theta_1−0.9990.430−2.3260.020
Italyphi_10.8360.2223.7640.000theta_1−0.1230.290−0.4260.671
Latviaphi_10.7690.2812.7380.006theta_10.0150.3220.0460.963
Lithuaniaphi_10.4056.6250.0610.951theta_10.2835.3810.0530.958
Luxemburgphi_10.4672.2580.2070.836theta_11.0000.3792.6400.080
Slovakiaphi_10.1280.1470.8710.384theta_1−0.9990.599−1.6710.095
Sloveniaphi_1----theta_1----
Swedenphi_10.2401.0290.2330.816theta_10.4340.9000.4820.630
Hollandphi_10.6260.5201.2020.229theta_10.3500.6850.5110.609
Polandphi_1−0.2660.667−0.3990.690theta_10.8550.7421.1520.249
Bulgariaphi_10.8840.4691.8840.059theta_10.8320.3162.6350.008
Estoniaphi_1−0.1100.537−0.2040.838theta_1−0.9990.370−2.7020.007
Irelandphi_10.7150.3941.8150.070theta_1−0.1730.459−0.3770.706
Spainphi_10.7171.9310.3710.711theta_1−0.1191.721−0.0690.945
Croatiaphi_10.3020.9860.3060.780theta_10.0860.8690.0990.920
Cyprusphi_1----theta_1----
Hungaryphi_10.7760.5641.3750.169theta_10.6140.4501.3670.172
Maltaphi_10.7970.1904.1860.000theta_10.0950.3040.3110.755
Portugalphi_1−0.4741.996−0.2370.812theta_10.5481.9040.2880.773
Romaniaphi_11.0360.9761.0610.289theta_1−1.0001.490−0.6710.502
Source: own elaboration based on data from EUROSTAT.
Table 3. Prognosis of cows in organic farms in the EU countries.
CountryNumber of Cows [Number]
20192020202120222023
PredictionStd.errorPredictionStd.errorPredictionStd.errorPredictionStd.errorPredictionStd.error
Austria114,4614495113,8676579121,1457359123,1807698130,9887853
Belgium21,431185921,144262222,946291723,808304824,7143108
Czech Republic73321757109245742524575132457513245
Denmark71,843688965,652844972,077854172,677854673,5758547
Finland998529510,28929710,55229910,78130110,979302
France139,03218,923141,21025,576142,37627,488143,16828,113145,99828,324
Germany180,52715,955172,06629,082185,60634,501185,67337,299186,90838,836
Great Britain79,546547277,237556283,514556387,481556387,4865563
Greece19,514216827,325232938,200261353,340309154,4183851
Italy74,85810,31572,09212,66675,77914,07875,84614,98676,22915,589
Latvia17,282415416,322527817,558584218,015615218,5786327
Lithuania13,191175212,668212813,156218313,371219214,3362193
Luxemburg87267768119876128880130885130
Slovakia64664955905657673365968206596823659
Slovenia----------
Sweden52,479934246,98611,26453,66911,36454,35411,37055,27811,371
Holland33,972851029,32511,89236,41612,97841,59513,38043,45913,534
Poland12,796349112,800405212,830408912,907409113,1244091
Bulgaria20954012096797209610032096113820971234
Estonia22004681931700226170223027022358702
Ireland37928433475959385910133916104039701053
Spain8054215477272509809526738124275482042794
Croatia21314371964469215147221994722294472
Cyprus----------
Hungary33022593255444335552533905693468593
Malta892274798368899416907444915461
Portugal36653265416543654565
Romania16,344651718,700652121,140652523,667653026,2846535
Source: own elaboration based on data from EUROSTAT.
Table 4. ARIMA model of milk organic production and organic land in the EU in the years 2005–2018.
Variable CoefficientStd.errorzp Value CoefficientStd.errorzp Value
Milk productionphi_11.0670.02248.440.000theta_1−0.9990.390−2.5660.010
Arable cropsphi_1−0.6260.284−2.210.027theta_10.6540.5351.2230.221
Permanent cropsphi_1−0.8160.328−2.490.012theta_10.3080.2440.1370.891
Permanent grasslandsphi_10.4730.2671.7740.076theta_1−1.000.199−5.0300.000
Source: own elaboration based on data from EUROSTAT.
Table 5. Prognosis of organic milk production and organic land in the years 2019–2023.
Variable20192020202120222023
PredictionStd.errorPredictionStd.errorPredictionStd.errorPredictionStd.errorPredictionStd.error
Milk production5.20.165.60.166.00.166.30.166.80.16
Arable crops7.90.198.20.278.60.339.00.389.30.43
Permanent crops1.80.031.90.032.00.032.00.032.10.04
Permanent grasslands6.40.176.60.186.80.197.10.197.30.19
Source: own elaboration based on data from EUROSTAT.
Table 6. Characteristics of plant production of dairy organic farms in Poland in 2007–2018.
YearsFarms’ NumberFarmland Area (ha)Lease Area (ha)Grains Area (ha)Fodder Area (ha)Value of Plant Production (PLN)Value of Grains (PLN)Value of Potatoes (PLN)Value of Forage Crops (PLN)
20071615.54.24.1810.899132503514732201
20081822.611.83.1719.0710,293413525942854
20091920.46.33.8415.94729039512785170
20105324.58.74.1219.0912,11360482877795
20115325.09.04.7718.9320,660893822256810
20125324.68.04.8718.7614,051767728181196
20135920.05.23.3015.2311,47866062744654
20146720.94.23.6215.98842460931694−1732
20155922.33.83.6717.26633853641632−1690
20165023.64.24.1518.119063584812911184
20174625.44.42.9920.938390437511002227
20184528.64.93.2923.569185526019111168
2007–2018 (%)181.384.516.7-21.3116.30.584.4724.73−45.99
Source: own elaboration based on data from FADN.
Table 7. Characteristics of animal production of dairy organic farms in Poland in 2007–2018.
YearsDairy Cow’s Number (LU)Swine
(LU)
Milk Yield kg/Cow
(LU)
Sheeps and Goats
(LU)
Value of Animal Production (PLN)Value of Milk and Dairy Products (PLN)Value of Beef and Calf (PLN)Value of Pork (PLN)Value of Other Animals and Products (PLN)
20077.900.3433820.0032,65624,2657546428417
200813.700.1934650.0061,69645,67013,1935201596
200910.000.0733210.3357,70728,40296231491228
201013.630.1734580.0962,06047,404963344−155
201113.600.1932270.0065,81547,72116,683514510
201213.870.1434630.0870,30151,09018,162382249
201311.130.2938220.0964,95550,18414,4081055−781
201411.310.0437260.0766,78150,29716,524138−309
201512.950.0339150.0171,38652,51917,138461568
201613.900.0141820.0174,80658,47815,7538306
201715.500.0141080.01103,91782,00321,71130−17
201815.430.046980.01119,57494,22624,4190.00663
2007–2018 (%)95.300.0038.700.00266.16288.32223.600.0058.99
Source: own elaboration based on data from FADN.
Table 8. Production and income of dairy organic farms in Poland in 2007–2018 (in PLN).
YearsTotal ProductionIntermediate ConsumptionBalance of Subsidies and TaxesNet Value AddedAmortizationGross Value AddedCosts of External FactorsBalance of Investment Subsidies and TaxesIncome from a Family Farm
200742,01520,43217,65839,241813331,108961−44429,703
200872,44541,70333,56264,30410,67753,6279163−40144,063
200946,22529,46929,32946,08512,56633,5191887−97030,662
201075,22441,75842,62976,09515,97060,125738338353,125
201187,69046,42051,14991,41917,79173,628845552165,694
201288,45746,64437,71179,52419,04160,4838996−9751,389
201377,85542,63038,10673,33119,74453,5873042350,549
201476,58941,18935,55570,95418,64752,308373475449,328
201578,48644,93743,44676,99420,49156,5032460−18153,862
201685,12948,04250,03887,12520,69966,425387848563,032
2017112,94451,21357,669119,40021,19898,201420923094,223
2018129,62863,17258,176124,63122,162102,4704306−101297,152
2007–2018 (%)208.5209.2229.5217.6172.5229.4348.1101.6227.1
Source: own elaboration based on data from FADN.
Table 9. Fixed and current assets of dairy organic farms in Poland in 2007–2018 (in PLN).
YearsTotal AssetsFixed AssetsLandBuildingsMachineryBasic HerdCurrent AssetsCurrent HerdStock Other Current AssetsLong-Term DebtShort Term Debt
2007238,110213,22869,46587,81237,12918,82224,88278318397865464852637
2008316,198276,54973,876100,47866,83735,35839,64911,47718,712946028,7219993
2009566,424533,198296,919122,67588,19825,40533,226936013,00010,86618,8336882
2010753,781702,136431,259123,817108,36338,69651,64514,30219,62217,72226,18211,695
2011810,201740,928460,738123,856118,63537,69969,27316,27227,49425,50723,16014,698
2012837,920777,605472,400133,894130,93140,37960,31516,67327,58416,05721,55715,067
2013699,366369,332312,630150,716138,94337,04360,03415,25925,83718,93828,70210,272
2014699,454646,183353,242131,699120,60840,63353,27115,68723,48014,10439,8678971
2015752,658690,862384,475145,966116,33044,09261,79619,46820,89521,43426,3175789
2016776,948706,613398,409139,941118,34949,91470,33520,40920,90329,02331,62211,690
2017813,459734,265424,761124,937127,92256,64579,19422,67922,42434,09131,0056785
2018924,405833,023515,861120,527141,01155,62391,38228,28623,08940,00747,8106577
2007−2018 (%)288.2290.7642.637.3279.8195.5267.3261.2175.0362.3637.2149.4
Source: own elaboration based on data from FADN.
Table 10. Correlation analysis between dependent and independent variables.
Y1Y2Y3X1X2X3X4X5X6X7X8X9X10
Y11.0000.9790.977−0.5180.331−0.5590.8290.7810.7610.3750.8790.9510.825
Y20.9791.0000.972−0.5990.505−0.6400.8500.8330.8140.5280.8620.9730.875
Y30.9770.9721.000−0.5150.429−0.5570.7970.8030.7860.4030.8090.9600.806
X1−0.518−0.598−0.5151.000−0.5810.997−0.885−0.548−0.475−0.522−0.525−0.562−0.638
X20.3310.5040.429−0.5811.000−0.6030.4400.5090.5310.8400.2760.5050.539
X3−0.559−0.640−0.5570.997−0.6031.000−0.902−0.595−0.525−0.548−0.562−0.604−0.674
X40.8290.8500.797−0.8860.440−0.9031.0000.7210.6640.4520.7920.8270.806
X50.7820.8330.803−0.5480.509−0.5960.7211.0000.9670.6160.7120.8690.867
X60.7610.8140.786−0.4750.531−0.5250.6640.9671.0000.6290.6850.8760.910
X70.8260.8760.807−0.6380.539−0.6740.8070.8670.9100.6700.8140.9151.000
X80.9510.9730.960−0.5620.506−0.6050.8270.8690.8760.5430.8371.0000.915
X90.8790.8630.809−0.5250.277−0.5630.7930.7120.6850.4271.0000.8370.814
X100.3760.5290.403−0.5220.840−0.5480.4520.6160.6291.0000.4270.5430.6700
Source: own elaboration based on data from FADN.
Table 11. Regression analysis of independent variables and dependent variables.
Independent VariablesY1—Organic Milk ProductionY2—Total Production of Organic Dairy FarmsY3—Income from Family Farm
Intercept1382.6764819.6641665.677
X3—cow’s number0.9540.9311.040
X5—value of fixed assets0.4560.5320.631
X8—value of current assets0.8370.8391.050
X9—long term debt0.2600.161-
X5—short term debt−0.190-−0.170
F61,488105,62881,067
R20.9370.9450.930
p0.0000.0000.000
Source: own elaboration based on data from FADN.
Publisher’s Note: MDPI stays neutral with regard to jurisdictional claims in published maps and institutional affiliations.

