Article

Distribution, Genetic Diversity and Population Structure of Aegilops tauschii Coss. in Major Wheat-Growing Regions in China

1
Key Laboratory of Weed Biology and Management, Institute of Plant Protection, Chinese Academy of Agricultural Sciences, Beijing 100193, China
2
College of Agriculture and Biotechnology, Hebei Normal University of Science and Technology, Qinhuangdao 066004, China
*
Author to whom correspondence should be addressed.
Agriculture 2021, 11(4), 311; https://doi.org/10.3390/agriculture11040311
Submission received: 31 January 2021 / Revised: 19 March 2021 / Accepted: 30 March 2021 / Published: 2 April 2021
(This article belongs to the Section Crop Protection, Diseases, Pests and Weeds)

Abstract

:
Aegilops tauschii Coss. is known as a noxious grass weed seriously affecting wheat quality and yield. To investigate its present occurrence in wheat fields and the potential genetic diversity of the grass weed in China, a filed survey covering major wheat production regions was conducted during 2017–2019. Seeds of different Ae. tauschii populations collected from the survey were analyzed with Simple Sequence Repeats (SSRs) technique. Results showed that Ae. tauschii was occurring in each of the provinces surveyed with varied occurrence frequency ranging from 0.91% in Sichuan Province to 92.85% in Henan Provinces. Eighty alleles with size ranging from 98 bp to 277 bp were detected from the 192 collected Ae. tauschii populations with 17 SSR markers. Ae. tauschii, in this study, exhibited a moderately high level of genetic diversity, high differentiation, deficient heterozygosity and limited gene flow. Compared with other provinces, Hubei populations possessed relatively low genetic diversity. Dendrogram analysis showed that genetic distance did not seem to be related to geographic distribution. Additionally, STRUCTURE analysis suggested that Ae. tauschii populations in wheat fields of China can be divided into three groups, which was further supported by cluster analysis. Among the three groups, solely 7% of the total variation was detected, whereas the majority variation (67%) occurred among different populations within same group. Undoubtedly, such information will help us to better understand population relationships and spread of Ae. tauschii in China and will provide a new perspective for its integrated management.

1. Introduction

Aegilops tauschii Coss., an alien invasive species, is widely distributed in major wheat production areas of China during recent years. It is reported that Ae. tauschii occurred in eight wheat-growing provinces of China by 2007, with a damage area of approximately 3.3 × 10⁵ ha [1]. As a member of the Poaceae family, Ae. tauschii is a self-pollinated, annual diploid plant [2]. Ae. tauschii has extremely strong producibility, and an individual plant can produce 10–40 tillers, with 100–800 seeds, on average [1,3]. Usually, Ae. tauschii emerges from September to November and matures from May to June of the following year, competing with wheat for sunlight, water and fertilizer [4]. It can cause a 50–80% wheat yield loss when its ears are up to 457 m−2 [1]. As a donor of wheat D genome, Ae. tauschii has high homology with wheat in genetic background, and only a few selective herbicides are available for this weed. In addition, the upper spikelets of Ae. tauschii are easily detached from the rachis and fall into the soil before reaching complete maturity, while the basal spikelets remain in the rachis, spreading with wheat seeds. The distribution of weeds is closely related to its monitoring and management. Descriptive studies of the genetic diversity in weed populations can also be extremely important, because they provide essential background for further focused research, such as understanding the ability of weeds to adapt to different environments and the impact of herbicide selection on weed populations [5,6]. It is generally believed that Ae. tauschii originated from Azerbaijan and the southern coastal region of the Caspian Sea [7]. From its origin, it spread westward to central Syria through the valleys of mountainous southeastern Turkey and eastward to western China through the Kopet Dag Mountains of Turkmenistan [7]. As early as 1955, Ae. tauschii was first spotted in Henan Province, central China. Before the 1990s, Ae. tauschii only sporadically infested wheat in the provinces of Henan, Shanxi and Shaanxi [8]. Since the 2000s, it escaped from control management and experienced a rapid expansion to new habitats. However, the precise distribution and occurrence states of Ae. tauschii in wheat fields in China are obscure.
Although the genetic diversity of Ae. tauschii in China has been described previously, the materials in this research were focused on the populations from provinces of Henan, Shaanxi and Xinjiang [9,10]. Nevertheless, the distribution range of the species is gradually expanding across the wheat fields in China, particularly in recent years. Thus, more populations from a wider range of locations are required to comprehensively evaluate its genetic diversity and understand its spread in China.
Plant phenotypes and their biochemical or molecular markers can be used to evaluate their genetic diversity. Molecular markers play an increasingly important role in estimating genetic distance, due to their predictable genetic basis and abilities to distinguish specific segments of DNA or their products. Furthermore, it is less susceptible to environmental fluctuations, compared with morphological features [11]. Among that, Simple Sequence Repeats (SSRs) are tandemly repeated motifs of 1–6 nucleotides per unit that are widely spread throughout a genome. Compared with other molecular markers, SSRs are more preferable, due to their high polymorphism, reproducibility, high mutation rates and relative scoring ease [12,13,14]. It is reported that Ae. tauschii genome contains a large number of SSRs [15]. Recently, Yang et al. [5] used SSR markers to assess the genetic diversity of Commelina communis, a hard-to-control weed in summer crops. In another study, microsatellite markers were also used to evaluate the genetic diversity of Olea europaea and Eleusine coracana L. [16,17].
Currently, the latest information regarding the occurrence and infestation of Ae. tauschii in China is not well known. It is necessary to comprehensively understand its genetic diversity and population structure. The aims of this study were to (i) ascertain the occurrence state and infestation of Ae. tauschii in wheat fields in China, (ii) assess its genetic diversity and population structure and (iii) clarify the genetic relationships among different populations.

2. Materials and Methods

2.1. Aegilops tauschii Coss. Field Survey in China

The survey was conducted in 12 major wheat production provinces, municipalities and autonomous regions (Anhui, Beijing, Hebei, Henan, Hubei, Jiangsu, Shaanxi, Shandong, Shanxi, Sichuan, Tianjin, Xinjiang; hereafter referred to as “province”) during 2017–2019. The assessments in different provinces were carried out when wheat was at the ripening stage. Detailed survey time is shown in Table 1. County was considered as the basic survey unit, and all counties with wheat planting in each province were surveyed. The sampling locations were randomly selected within 10-km intervals, and within each location, three representative sites of 1 ha wheat field were identified. Sites were surveyed by two people walking in an inverted “W” pattern for approximately 200 m, and the presence or absence of Ae. tauschii was recorded. In addition, random countywide surveys were conducted by Plant Protection and Quarantine Stations of each county as supplement data of the local occurrence state of Ae. tauschii. The occurrence frequency of Ae. tauschii in each province = counties with Ae. tauschii infestation/the total counties surveyed in the province.

2.2. Collection of Aegilops tauschii Coss. Seeds

Above surveyed sites with serious Ae. tauschii infestation were selected to estimate spike density. On each selected site, five 1-m2 quadrats were randomly chosen in which to count the spike number. Sites with Ae. tauschii density over 100 spikes m−2 were determined as those from which to collect seeds, and the seeds were randomly collected from at least 500 individual plants and pooled as a population. In total, 192 Ae. tauschii populations were obtained (Table 1 and Table S1). In 2019, seeds of each population were planted in pots containing a 3:1 (v/v) mixture of soil and organic fertilizer. The pots were kept in the greenhouse (25/20 °C, day/night) with a 12-h photoperiod of 320 µmol m−2s−1 and watered as necessary to maintain the optimum soil moisture. Ten plants from each population were marked, and the leaf tissue of them were sampled and then stored at −80 °C.

2.3. DNA Extraction

One hundred milligrams of leaf tissue were ground into a fine powder in liquid nitrogen for each population. DNA was isolated using a Tiangen DNAsecure Plant Kit (catalogue no. DP 320; Tiangen Biotech Co., Ltd., Beijing, China). The quality of DNA was determined visually using 1% agarose gels. To ensure consistent quantities among the samples, DNA solution was diluted to 50 ng µL−1 after the concentration was measured, using a Nanodrop 2000 (Thermo Scientific, Waltham, MA, USA).

2.4. SSR Primer Pairs Screening

More than 60 microsatellite primers isolated and mapped from the bread wheat D genome [18,19] were used for PCR amplification. In total, 17 primer pairs with specific amplicons were selected as candidate primers (Table 2). The PCR mixture contained 50 ng genomic DNA, 0.5 μL forward primer and reverse primer (1.0 × 10⁻⁸ mol L−1), 12.5 μL 2× Taq PCR Master Mix (catalogue no. KT 201; Tiangen, Beijing, China) and 10.5 μL ddH2O to a total volume of 25 μL. Amplification began with a denaturation step for 4 min at 94 °C, followed by 32 cycles of 94 °C for 30 s, the annealing temperature of each primer for 30 s and 72 °C for 30 s and a final extension at 72 °C for 40 min. PCR products were evaluated with 1.8% agarose gels.

2.5. SSR Detection

The selected candidate primers were used for amplification of all samples for a second time. This time, each forward primer was modified with fluorophores (hex or fam) at the 5′ ends. PCR products with different fluorophores were mixed and analyzed by an ABI PRISM 3730xl DNA Sequencer with GS500 (Applied Biosystems, Foster city, USA) as an internal size standard. Alleles of each locus were determined by GeneMarker (version 2.2.0).

2.6. Data Analyses

To generate a binary data matrix for further analysis, each allele was scored as 0 when absent and 1 when present. The effective number of alleles (Ne), the observed number of alleles (Na), the observed heterozygosity (Ho), the expected heterozygosity (He), Shannon’s information index (I), the proportion of differentiation among populations (Fst), Nei’s gene diversity (H) [20], Wright’s fixation index (F = 1—Ho/He) and the gene flow (Nm = [(1/Fst)—1]/4) were calculated by the POPGENE 32-bit version program. Polymorphism information content (PIC) was calculated according to
PIC = 1 − ∑Pij2,
where Pij was the frequency of the jth genotype at the ith loci. Pairwise, genetic similarity among different populations was calculated based on the Dice similarity coefficient, and then a cluster was generated with the unweighted pair group method using arithmetic means (UPGMA) by NTsys 2.10e and MEGA 7.0 software (Tokyo, Japan). Under a Bayesian model, the analysis of population structure was carried out using STRUCTURE 2.3.4 [21]. The K value was set from 2 to 10. Under an admixture model using correlated allele frequencies, each K value was run ten times, independently. The iterations of a burn-in period and Markov chain Monte Carlo (MCMC) steps were set to 100,000 and 200,000, respectively. The most appropriate K value was determined with Structure Harvester. Analysis of molecular variance (AMOVA) was performed using GenAlex 6.1 to further investigate the population structure of Ae. tauschii. GenAlex 6.1 was also used to obtain, pairwise, Fst and Nm among different genetic groups based on the results of population structure analysis.

3. Results

3.1. The Distribution and Occurrence of Aegilops tauschii Coss. in China

Although all the surveyed provinces had Ae. tauschii infestations, the incidences were different among these provinces. Ae. tauschii was most commonly found in Henan, Hebei and Shandong provinces, with occurrence frequency over 70%. In Henan Province, Ae. tauschii occurred in all counties except eight counties in Xinyang. No Ae. tauschii plants were found in 19 counties belonging to Yantai, Qingdao, Weihai and Rizhao of Shandong Province. Except for 25 counties in Zhangjiakou, Chengde and Tangshan of Hebei Province, infestations of Ae. tauschii with wheat fields were observed in other counties. In addition, in Shaanxi Province, Ae. tauschii infested wheat fields in over half of counties (56.96%). However, Shanxi, Jiangsu, Beijing and Tianjin exhibited relatively low occurrence frequency of Ae. tauschii (10–40%). Among 16 surveyed districts in Beijing, Ae. tauschii was only found in Haidian, Tongzhou, Fangshan and Daxing. In Shanxi Province, the weed was mainly found in the counties located at the south of wheat planting, such as Hongtong, Huozhou and Linyi counties. By contrast, Hubei, Anhui, Sichuan and Xinjiang provinces showed very low infestations of Ae. tauschii (<10%). For example, in Hubei Province, Ae. tauschii was only found in Zaoyang and Xiangzhou counties among 63 surveyed counties (Table 1).

3.2. Polymorphism of the SSR Markers

In total, 80 polymorphic alleles were amplified using 17 SSR markers, with size varying from 98 bp to 277 bp (Table 2). Among 192 Ae. tauschii populations, the observed number of alleles (Na) in different loci ranged from 2 to 11, with an average of 4.706. The mean value of the effective number of alleles (Ne) was 1.684, varying from 1.011 to 3.534. The highest value of Shannon’s information index (I) was 0.032, and the lowest value was 1.385. The ranges of the expected heterozygosity (He) and observed heterozygosity (Ho) were from 0.010 to 0.719 (mean = 0.285) and 0 to 1 (mean = 0.181), respectively. The average of gene diversity based on Nei’s gene diversity (H) was 0.284, with a range from 0.010 to 0.717. Polymorphic information content (PIC), with a mean of 0.284, varied from 0.010 to 0.717 (Table 3).
Wright’s fixation index (F), a measure of heterozygotic deficiency or excess, varied between −0.560 and 1.000, with an average of 0.695 per marker. Two SSR loci (Xgwm383-3D and Xgwm469-6D, F < 0) demonstrated excess heterozygosity, while the other 15 loci (F > 0) displayed deficient heterozygosity, revealing deficient heterozygosity for the 17 SSR markers. The proportion of differentiation among populations (Fst) and gene flow (Nm) ranged from 0.220 to 1.000 (mean = 0.848) and 0.000 to 0.886 (mean = 0.117), respectively, indicating a high level of differentiation among populations and low gene flow in Ae tauschii (Table 3).

3.3. Comparative Genetic Diversity Analysis of Aegilops tauschii Coss. from Different Provinces

Ae. tauschii from different provinces displayed variable levels of genetic diversity (Figure 1). The Na varied from 1.118 to 3.059 and averaged 1.845, while the Ne ranged from 1.118 to 1.653, with a mean of 1.410. The PIC, Ho, He and I per province ranged from 0.059 to 0.276 (mean = 0.184), 0.118 to 0.294 (mean = 0.185), 0.078 to 0.294 (mean = 0.223) and 0.082 to 0.497 (mean = 0.303), respectively. The population differentiations in Henan, Shandong, Shaanxi and Hebei provinces were relatively high. Additionally, the lowest genetic diversity indexes (Na, Ne, Ho, He, I and PIC) were observed in Hubei Province, among the studied provinces.

3.4. Cluster Analysis

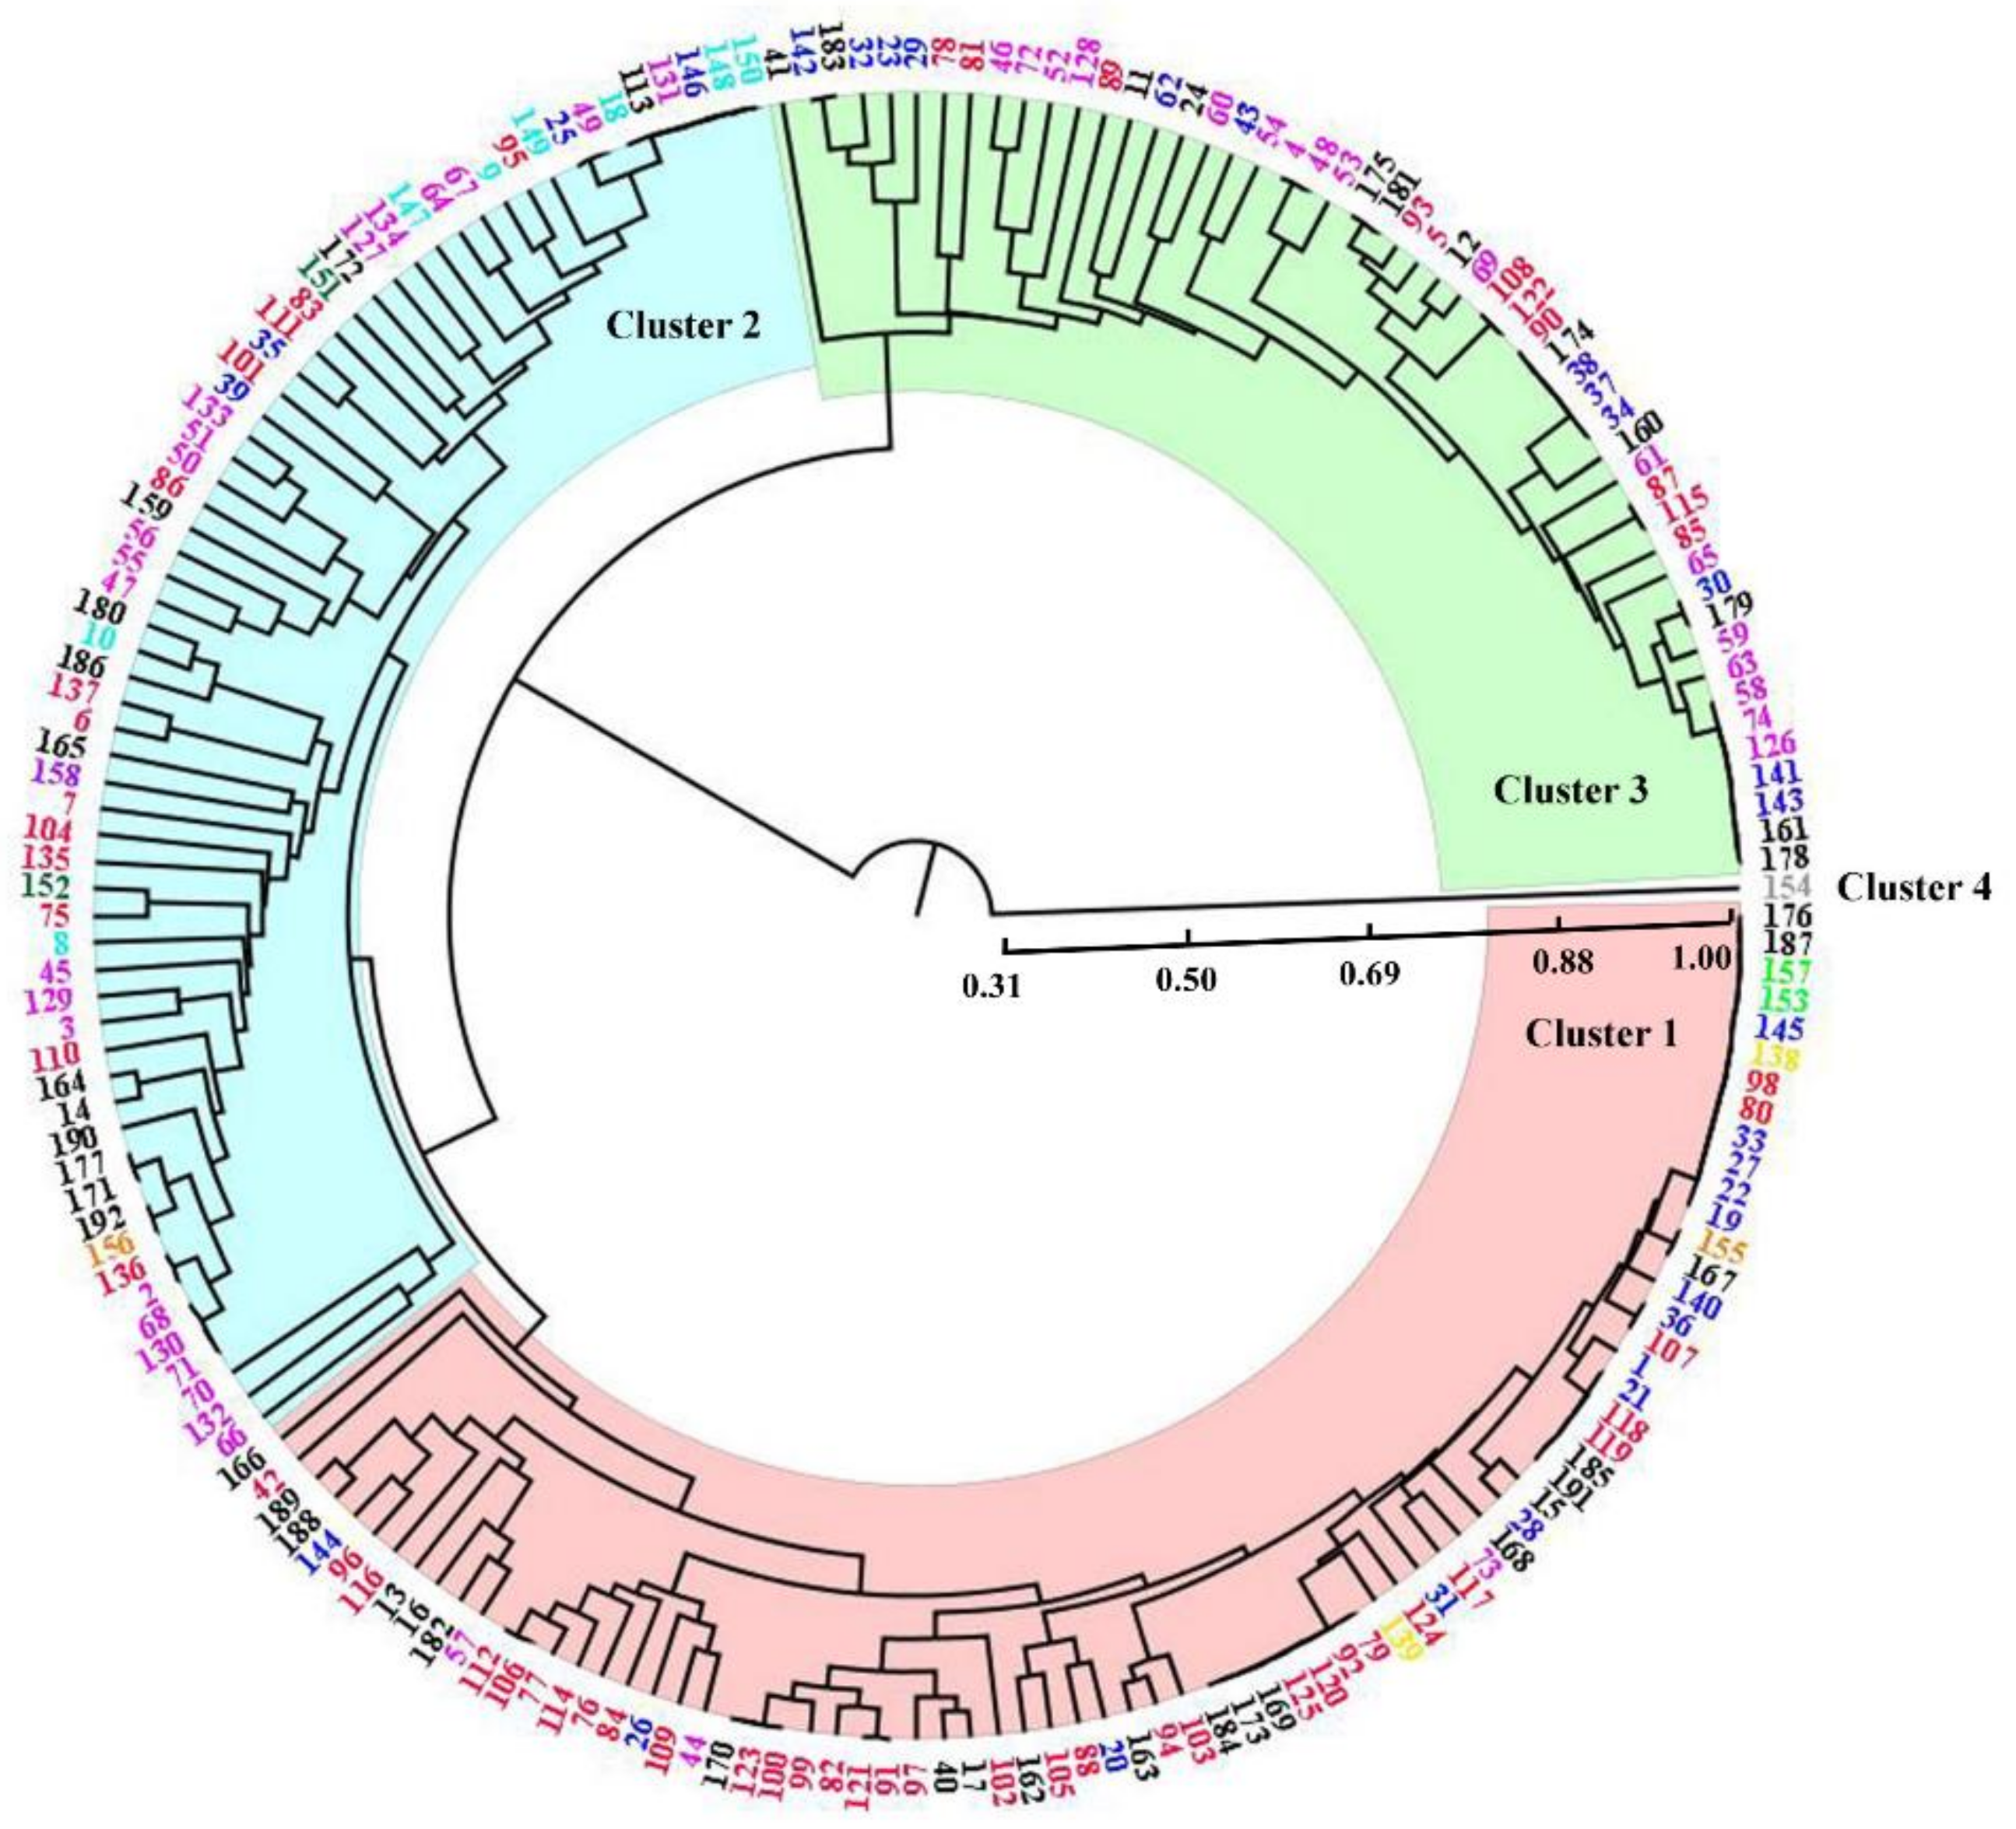
Based on the Dice similarity coefficient, a dendrogram was constructed with UPGMA (Figure 2). The value of the Dice similarity coefficient ranged from 0.31 to 1.00. When the Dice similarity coefficient was 0.75, 192 Ae. tauschii populations could be mainly divided into four clusters. Some clusters included populations from different provinces, while some populations from the same province were dispersed into different clusters. Cluster 1 contained most populations from Shandong and Hebei, approximately half of populations from Henan and very few populations from Shaanxi. Hubei and Tianjin populations were scattered into this cluster as well. Cluster 2 included Jiangsu and Shanxi populations, together with the majority of Shaanxi populations and a few populations from Shandong and Hebei. Very few populations from Henan were also dispersed into cluster 2. The remaining populations from Henan and Shaanxi, as well as a few populations from Shandong and Hebei, formed cluster 3, and cluster 4 only contained the Xinjiang population.

3.5. Population Structure Analysis

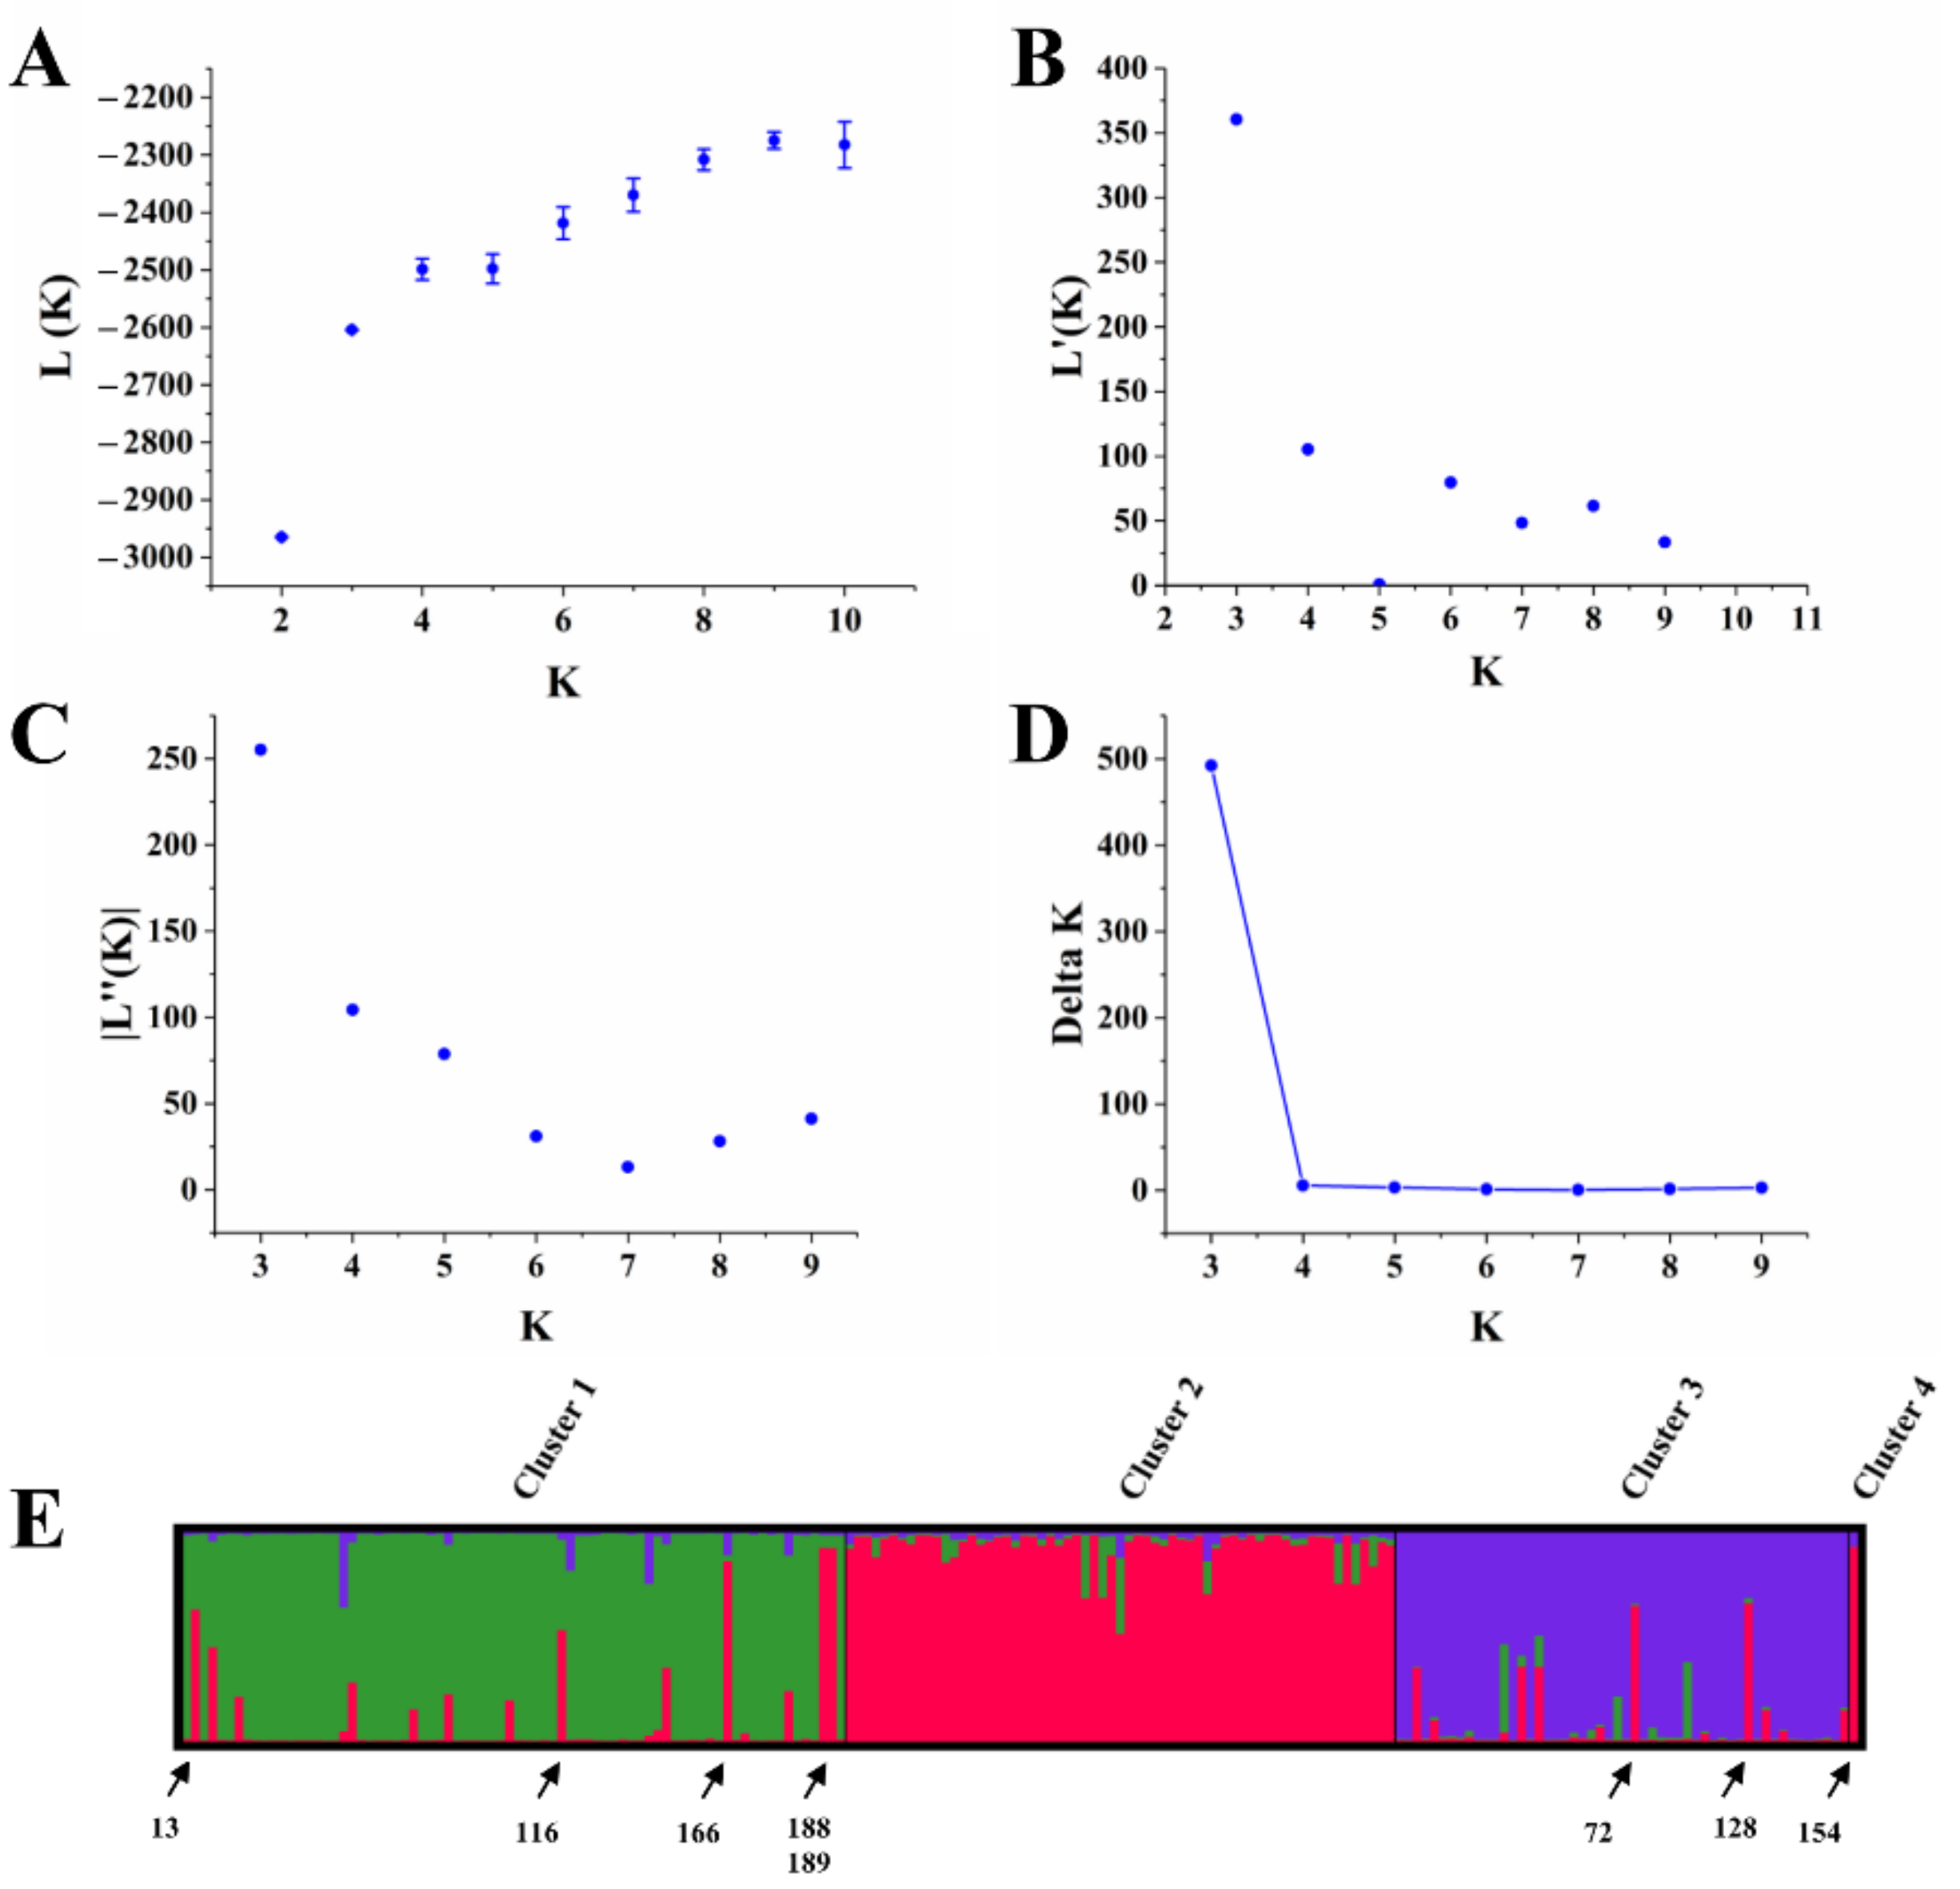
To illustrate the underlying population structure of the studied populations, the number of hypothetical groups for the 192 populations was evaluated by the Bayesian model-based clustering method. The structure simulation by Structure Harvester indicated that K = 3 is optimal (Figure 3A–D); in other words, it is rational to divide the given populations into three groups: group 1 (green), group 2 (red) and group 3 (purple) (Figure 3E). The result was supported by UPGMA analysis, except that populations 13, 116, 166, 188 and 189, belonging to cluster 1, and populations 72 and 128, belonging to cluster 3, were collected into group 2. Additionally, Xinjiang population belonging to cluster 4 was included in group 2 as well.
The AMOVA analysis showed that variance occurring among the three hypothetical groups accounted for 7% of the total variation. Majority variations (67%) occurred among different populations within same group, and 26% was attributed to variation within populations (Table 4). Additionally, the lowest mean value of Fst and highest mean value of Nm were detected between group 2 and group 3 (Table 5), indicating that there were markedly low genetic differentiation and high gene flow between group 2 and group 3. However, a reverse phenomenon was observed between group 1 and group 3.

4. Discussion

By 2007, it was reported that Ae. tauschii was mainly distributed in Hebei, Shanxi, Chongqing, Shandong, Jiangsu, Henan, Inner Mongolia and Shaanxi provinces in China [1]. Our filed survey showed that the grass weed further spread into Anhui, Sichuan, Hubei, Xinjiang, Beijing and Tianjin during recent years. The varied occurrence frequency of Ae. tauschii in the surveyed provinces indicated different infestation levels across wheat fields in China. Thus, effective control of Ae. tauschii is urgently needed. The survey was conducted during 2017–2019. Ae. tauschii is easily spread across wheat fields, due to the limited effective herbicides against it, extensive ecology adaptability and high propagation coefficient [3,22]. Therefore, the present occurrence frequency of Ae. tauschii may be higher than our survey results.
Given the expanding distribution ranges and serious infestations, the genetic diversity and population structure of Ae. tauschii from surveyed sites were studied to understand its population relationships and spreading across wheat fields in China. SSR markers are generally considered as effective tools to explain genetic diversity and population structure [16,17,23]. Among the strictly screened SSR markers, five markers were highly informative, with PIC > 0.5; three markers were reasonably informative, with 0.25 < PIC < 0.5; and nine markers were minimally informative, with PIC < 0.25, according to a criterion published previously [24]. The mean value of PIC per marker was between 0.25 and 0.5, indicating a reasonably discriminating and indicative property of the selected markers. Therefore, these markers are reliable in illuminating the population structure and assessing the genetic diversity of Ae. tauschii. In another study, however, the PIC value (0.55) for Ae. tauschii was higher than the present results, which may be explained by the different microsatellite markers and Ae. tauschii populations used in the two studies [10].
Eighty alleles were collectively identified by the 17 SSR markers, with a mean of 4.706 alleles per marker. This observation was largely similar to previous studies [25,26,27]. Beyond that, the mean values of H and I implied moderately high genetic diversity in Ae. tauschii, which was strongly supported by a high level of genetic variance detected in other research [9,10]. Genetic diversity plays an instrumental role in the capability to survive in different environments, as well as in the population evolution [16,28]. Unquestionably, the high genetic diversity of Ae. tauschii would intensify the difficulties of managing it. Furthermore, Hubei populations, with narrow genetic backgrounds, are closely related to each other. Genetic diversity partly depends on the species’ evolutionary history [28]. The invasion of Ae. tauschii to wheat fields in Hubei Province was reported recently [3]. Therefore, it was assumed that the low genetic diversity of Hubei populations was related with its short history of infestation; in contrast, fewer populations found from the province may also be responsible for this phenomenon.
In the dendrogram, genetic distance did not seem to be related to geographic distribution, since some populations, especially those collected from different regions of China, were not grouped in a way that exactly relied on geographic location in the cluster analysis. That may be attributed to the long-distance seed distribution mediated by harvesting activities [1].
Our findings demonstrated that Xinjiang populations showed a clear separation from Yellow River Basin populations (Henan and Shaanxi), which is consistent with previous studies [9,10,29,30]. Based on the cluster analysis, a closer genetic relationship was found among some Shandong, Hebei and Henan populations, which are adjacent provinces, geographically. Historically, Ae. tauschii was first found in Henan Province [8]. Given that, it was speculated that Shandong and Hebei populations were introduced from Henan. Fang et al. [31] reported that transregional operation (from the South to the North in China) of combine machines in harvesting could facilitate Ae. tauschii seed distribution among different provinces. In the future, more attention should be paid to the spread of Ae. tauschii across wheat fields. For example, combine machines in harvesting should be timely cleaned in case they carry Ae. tauschii seeds during wheat harvesting season. Generally, Shanxi and Shaanxi populations exhibited distant genetic relationship with populations from other provinces. This might be ascribed to a long-time evolution or genetic changes associated with native climate conditions. However, a few Shandong and Hebei populations were clustered together with the above populations, which is probably related with wheat seed exchange among these provinces or seeds dispersion by Yellow River to cities located downstream. Therefore, the quality of wheat variety and irrigation water should be monitored strictly. UPGMA and STRUCTURE analysis showed that Hubei and Tianjin populations were closely related with Shandong, Hebei and Henan populations. Ae. tauschii was found in wheat fields in Hubei and Tianjin, recently [3]. In view of geographical locations among these provinces, it was assumed that Tianjin and Hubei populations were introduced from Hebei and Henan provinces, respectively, suggesting that the infestation of Ae. tauschii was gradually expanded to the north and south in China.
Cluster and admixture analyses based on the Bayesian model were regarded as a method to clarify the species’ origin, to shed light on genetic relationships and to determine the gene flow among different populations [32,33]. STRUCTURE analysis suggested that the 192 Ae. tauschii populations in China could be divided into three groups, which was supported by UPGMA analysis. To some extent, most populations of Shandong and Hebei, which were mainly distributed in the east of Ae. tauschii-infested areas, were grouped together. Group 2 was mainly composed of Shanxi and Shaanxi populations spreading west of the Yellow River Basin. Group 3 was a mixture of Shandong, Henan, Hebei and Shaanxi populations. Based on that, future work to evaluate Ae. tauschii control strategies should be conducted in the sites representing the three groups in China. Some populations were composed of different colored segments, indicating that there was a certain degree of genetic admixture in the tested populations. This situation might be resulted from the gene flow among the populations. Human activity-mediated seed spread appeared to accelerate gene recombination and movement in different populations.

5. Conclusions

Presently, Ae. tauschii was found in all provinces surveyed. Shandong, Henan and Hebei provinces had very high infestations of the weed. A moderately high level of genetic diversity, high differentiation, deficient heterozygosity and limited gene flow were discovered in this species. Closer genetic relationships were found among some populations geographically located distantly, which is most likely implicated with long-distance seed distribution. The STRUCTURE and UPGMA analyses grouped the 192 populations into three main groups: Roughly, the first group was dominated by populations from the east of the Yellow River Basin, the second group involved populations mainly located at the west of the Yellow River Basin and the last group was a mixture of populations from Henan, Shaanxi, Hebei and Shandong. These results will be helpful for the selection of representative sites to evaluate and develop control techniques and to further establish diverse management strategies aimed at different geographic areas or genetic groups of Ae tauschii.

Supplementary Materials

The following are available online at https://www.mdpi.com/article/10.3390/agriculture11040311/s1, Table S1: The geographic locations of 192 Aegilops tauschii Coss. populations used in the genetic diversity analysis.

Author Contributions

Conceptualization, X.L.; Methodology, H.Y., J.Y. and H.C.; Software, H.Y., A.A. and S.W.; Writing—original draft, H.Y. and J.Y.; Writing—review & editing, X.L. All authors have read and agreed to the published version of the manuscript.

Funding

This research was funded by National Key Research and Development Program of China, grant number 2016YFD0300701.

Institutional Review Board Statement

Not applicable.

Informed Consent Statement

Not applicable.

Data Availability Statement

The data presented in this study are available in Table S1: Supplementary material.dotx.

Acknowledgments

We thank Plant Protection and Quarantine Stations of each county in Henan, Shandong, Hebei, Shaanxi, Shanxi, Hubei, Anhui, Jiangsu, Sichuan and Xinjiang provinces, as well as in Beijing and Tianjin for providing random countryside survey of Ae. tauschii.

Conflicts of Interest

The authors declare no conflict of interest.

References

  1. Zhang, C.X.; Li, X.J.; Huang, H.J.; Wei, S.H. Alert and prevention of the spreading of Aegilops tauschii, a worst weed in wheat field. Acta Phytophylacica Sin. 2007, 34, 103–106. [Google Scholar]
  2. Sohail, Q.; Shehzad, T.; Kilian, A.; Eltayeb, A.E.; Tanaka, H.; Tssujimoto, H. Development of diversity array technology (DArT) markers for assessment of population structure and diversity in Aegilops tauschii. Breed. Sci. 2012, 62, 38–45. [Google Scholar] [CrossRef] [Green Version]
  3. Yu, H.Y.; Li, X.J. Distribution of Aegilops tauschii Coss. China Res. Prog. J. Weed Sci. 2018, 36, 1–7. [Google Scholar]
  4. Fang, F.; Zhang, C.X.; Huang, H.J.; Li, M.; Gao, X.; Li, Y.; Wei, S.H. The occurrence of Tausch’s goatgrass (Aegilops tauschii Coss.) in wheat fields and its effect on wheat yield. Acta Ecol. Sin. 2014, 34, 3917–3923. [Google Scholar]
  5. Yang, J.; Yu, H.Y.; Li, X.J.; Dong, J.G. Genetic diversity and population structure of Commelina communis in China based on simple sequence repeat markers. J. Integr. Agr. 2018, 17, 2292–2301. [Google Scholar] [CrossRef]
  6. Zhao, S.Y.; Sun, S.G.; Dai, C.; Gituru, R.W.; Chen, J.M.; Wang, Q.F. Genetic variation and structure in native and incasive Solidago canadensis populations. Weed Res. 2015, 55, 163–172. [Google Scholar] [CrossRef]
  7. Matsuoka, Y.; Takumi, S.; Kawahara, T. Flowering time diversification and dispersal in central Eurasian wild wheat Aegilops tauschii Coss.: Genealogical and ecoligical framework. PLoS ONE 2008, 3, e3138. [Google Scholar] [CrossRef] [Green Version]
  8. Yan, J.; Yang, J.L.; Cui, N.R.; Zhong, J.P.; Dong, Y.C.; Sun, Y.Z.; Zhong, G.Y. The Aegilops tauschii Cosson from Yi-Li, Xinjiang, China. Acta Agron. Sin. 1984, 10, 1–8. [Google Scholar]
  9. Li, Y.G.; Sun, Y.Z.; Zhang, D.L.; Li, S.P. Genetic diversity of Aegilops tauschii accessions native to China revealed by ISSR markers. J. Triticeae Crop. 2017, 37, 30–39. [Google Scholar]
  10. Wei, H.; Li, J.; Peng, Z.; Lu, B.; Zhao, Z.; Yang, W. Relationships of Aegilops tauschii revealed by DNA fingerprints: The evidence for agriculture exchange between China and the West. Prog. Nat. Sci. 2008, 18, 1525–1531. [Google Scholar] [CrossRef]
  11. Staub, J.E.; Meglic, V. Molecular genetic markers and their legal relevance for cultivar discrimination: A case study in cucumber. HortTechnology 1993, 3, 291–300. [Google Scholar] [CrossRef] [Green Version]
  12. Liu, X.B.; Feng, B.; Li, J.; Yan, C.; Yang, Z.L. Genetic diversity and breeding history of Winter Mushroom (Flammulina velutipes) in China uncovered by genomic SSR markers. Gene 2016, 591, 227–235. [Google Scholar] [CrossRef] [PubMed]
  13. Zane, L.; Bargelloni, L.; Patarnello, T. Strategies for microsatellite isolation: A review. Mol. Ecol. 2002, 11, 1–16. [Google Scholar] [CrossRef] [PubMed]
  14. Selkoe, K.A.; Toonen, R.J. Microsatellites for ecologists: A practical guide to using and evaluating microsatellite markers. Ecol. Lett. 2006, 9, 615–629. [Google Scholar] [CrossRef]
  15. Luo, M.; Gu, Y.Q.; Puiu, D.; Wang, H.; Twardziok, S.O.; Deal, K.R.; Huo, N.; Zhu, T.; Wang, L.; Wang, Y.; et al. Genome sequence of the progenitor of the wheat D genome Aegilops tauschii. Nature 2017, 551, 498–502. [Google Scholar] [CrossRef] [PubMed]
  16. Pandian, S.; Satish, L.; Rameshkumar, R.; Muthuramalingam, P.; Rency, A.S.; Rathinapriya, P.; Ramesh, M. Analysis of population structure and genetic diversity in an exotic germplasm collection of Eleusine coracana (L.) Gaertn. using genic-SSR markers. Gene 2018, 653, 80–90. [Google Scholar] [CrossRef] [PubMed]
  17. Noormohammadi, Z.; Trujillo, I.; Belaj, A.; Ataei, S.; Hosseini-Mazinan, M. Genetic structure of Iranian olive cultivars and their relationship with Mediterranean’s cultivars revealed by SSR markers. Sci. Hortic. 2014, 178, 175–183. [Google Scholar] [CrossRef]
  18. Pestsova, E.; Ganal, M.W.; Röder, M.S. Isolation and mapping of microsatellite markers specific for the D genome of bread wheat. Genome 2000, 43, 689–697. [Google Scholar] [CrossRef]
  19. Röder, M.S.; Korzun, V.; Wendehake, K.; Plaschke, J.; Tixier, M.; Leroy, P.; Ganal, M.W. A microsatellite map of wheat. Genetics 1998, 149, 2007–2023. [Google Scholar]
  20. Nei, M. Analysis of gene diversity in subdivided population. Proc. Natl. Acad. Sci. USA 1973, 70, 3321–3323. [Google Scholar] [CrossRef] [Green Version]
  21. Pritchard, J.K.; Stephens, M.; Donnelly, P. Inference of population structure using multilocus genotype data. Genetics 2000, 155, 945–959. [Google Scholar]
  22. Yu, H.; Yang, J.; Cui, H.; Li, Z.; Jia, F.; Chen, J.; Li, X. Effects of plant density on tillering in the weed grass Aegilops tauschii Coss. and its phytohormonal regulation. Plant Physiol. Bioch. 2020, 157, 70–78. [Google Scholar] [CrossRef]
  23. Tang, X.T.; Tao, H.H.; Du, Y.Z. Microsatellite-based analysis of the genetic structure and diversity of Aleurocanthus spiniferus (Hemiptera: Aleyrodidae) from tea plants in China. Gene 2015, 560, 107–113. [Google Scholar] [CrossRef]
  24. Botstein, D.; White, R.L.; Skolnick, M.; Davis, R.W. Construction of a genetic linkage map in man using restriction fragment length polymorphisms. Am. J. Hum. Genet. 1980, 32, 314–331. [Google Scholar]
  25. Lelley, T.; Stachel, M.; Grausgruber, H.; Vollmann, J. Analysis of relationships between Aegilops tauschii and the D genome of wheat utilizing microsatellites. Genome 2000, 43, 661–668. [Google Scholar] [CrossRef] [PubMed]
  26. Naghavi, M.R.; Nardi, M.; Pirseyedi, S.M.; Kazemi, M.; Potki, P.; Ghaffari, M.R. Comparison of genetic variation among accessions of Aegilops tauschii using AFLP and SSR markers. Genet. Resour. Crop Evol. 2007, 54, 237–240. [Google Scholar] [CrossRef]
  27. Saeidi, H.; Rahiminejad, M.R.; Vallian, S.; Heslop-Harrison, J.S. Biodiversity of diploid D-genome Aegilops tauschii Coss. in Iran measured using microsatellites. Genet. Resour. Crop Evol. 2006, 53, 1477–1484. [Google Scholar] [CrossRef]
  28. Hamrick, J.L.; Didt, M.J.W. Effects of life history traits on gentic diversity in plant species. Philos. Trans. R. Soc. Lond. Ser. B 1996, 351, 1291–1298. [Google Scholar]
  29. Wang, J.R.; Luo, M.C.; Chen, Z.X.; You, F.M.; Wei, Y.M.; Zheng, Y.L.; Dvorak, J. Aegilops tauschii single nucleotide polymorphisms shed light on the origins of wheat D-genome genetic diversity and pinpoint the geographic origin of hexaploid wheat. New Phytol. 2013, 198, 925–937. [Google Scholar] [CrossRef]
  30. Lan, X.J.; Liu, D.C.; Wei, Y.M.; Yan, Z.H.; Zheng, Y.L. Diversity of esterase isozyme in Aegilops tauschii Cosson. Guihaia 2001, 21, 77–80. [Google Scholar]
  31. Fang, F.; Gao, X.X.; Wei, S.H.; Li, Y.; Li, M.; Zhang, C.X. Occurrence and effects of Aegilops tauschii in China. Acta Prataculturae Sin. 2015, 24, 194–201. [Google Scholar]
  32. Breton, C.; Pinatel, C.; Médail, F.; Bonhomme, F.; Bervillé, A. Comparison between classical and Bayesian methods to investigate the history of olive cultivars using SSR-polymorphisms. Plant Sci. 2008, 175, 524–532. [Google Scholar] [CrossRef]
  33. Belaj, A.; Muñoz-diez, C.; Baldoni, L.; Porceddu, A.; Barranco, D.; Satovic, Z. Genetic diversity and population structure of wild olives from the North-western Mediterranean assessed by SSR markers. Ann. Bot. 2007, 100, 449–458. [Google Scholar] [CrossRef] [PubMed] [Green Version]
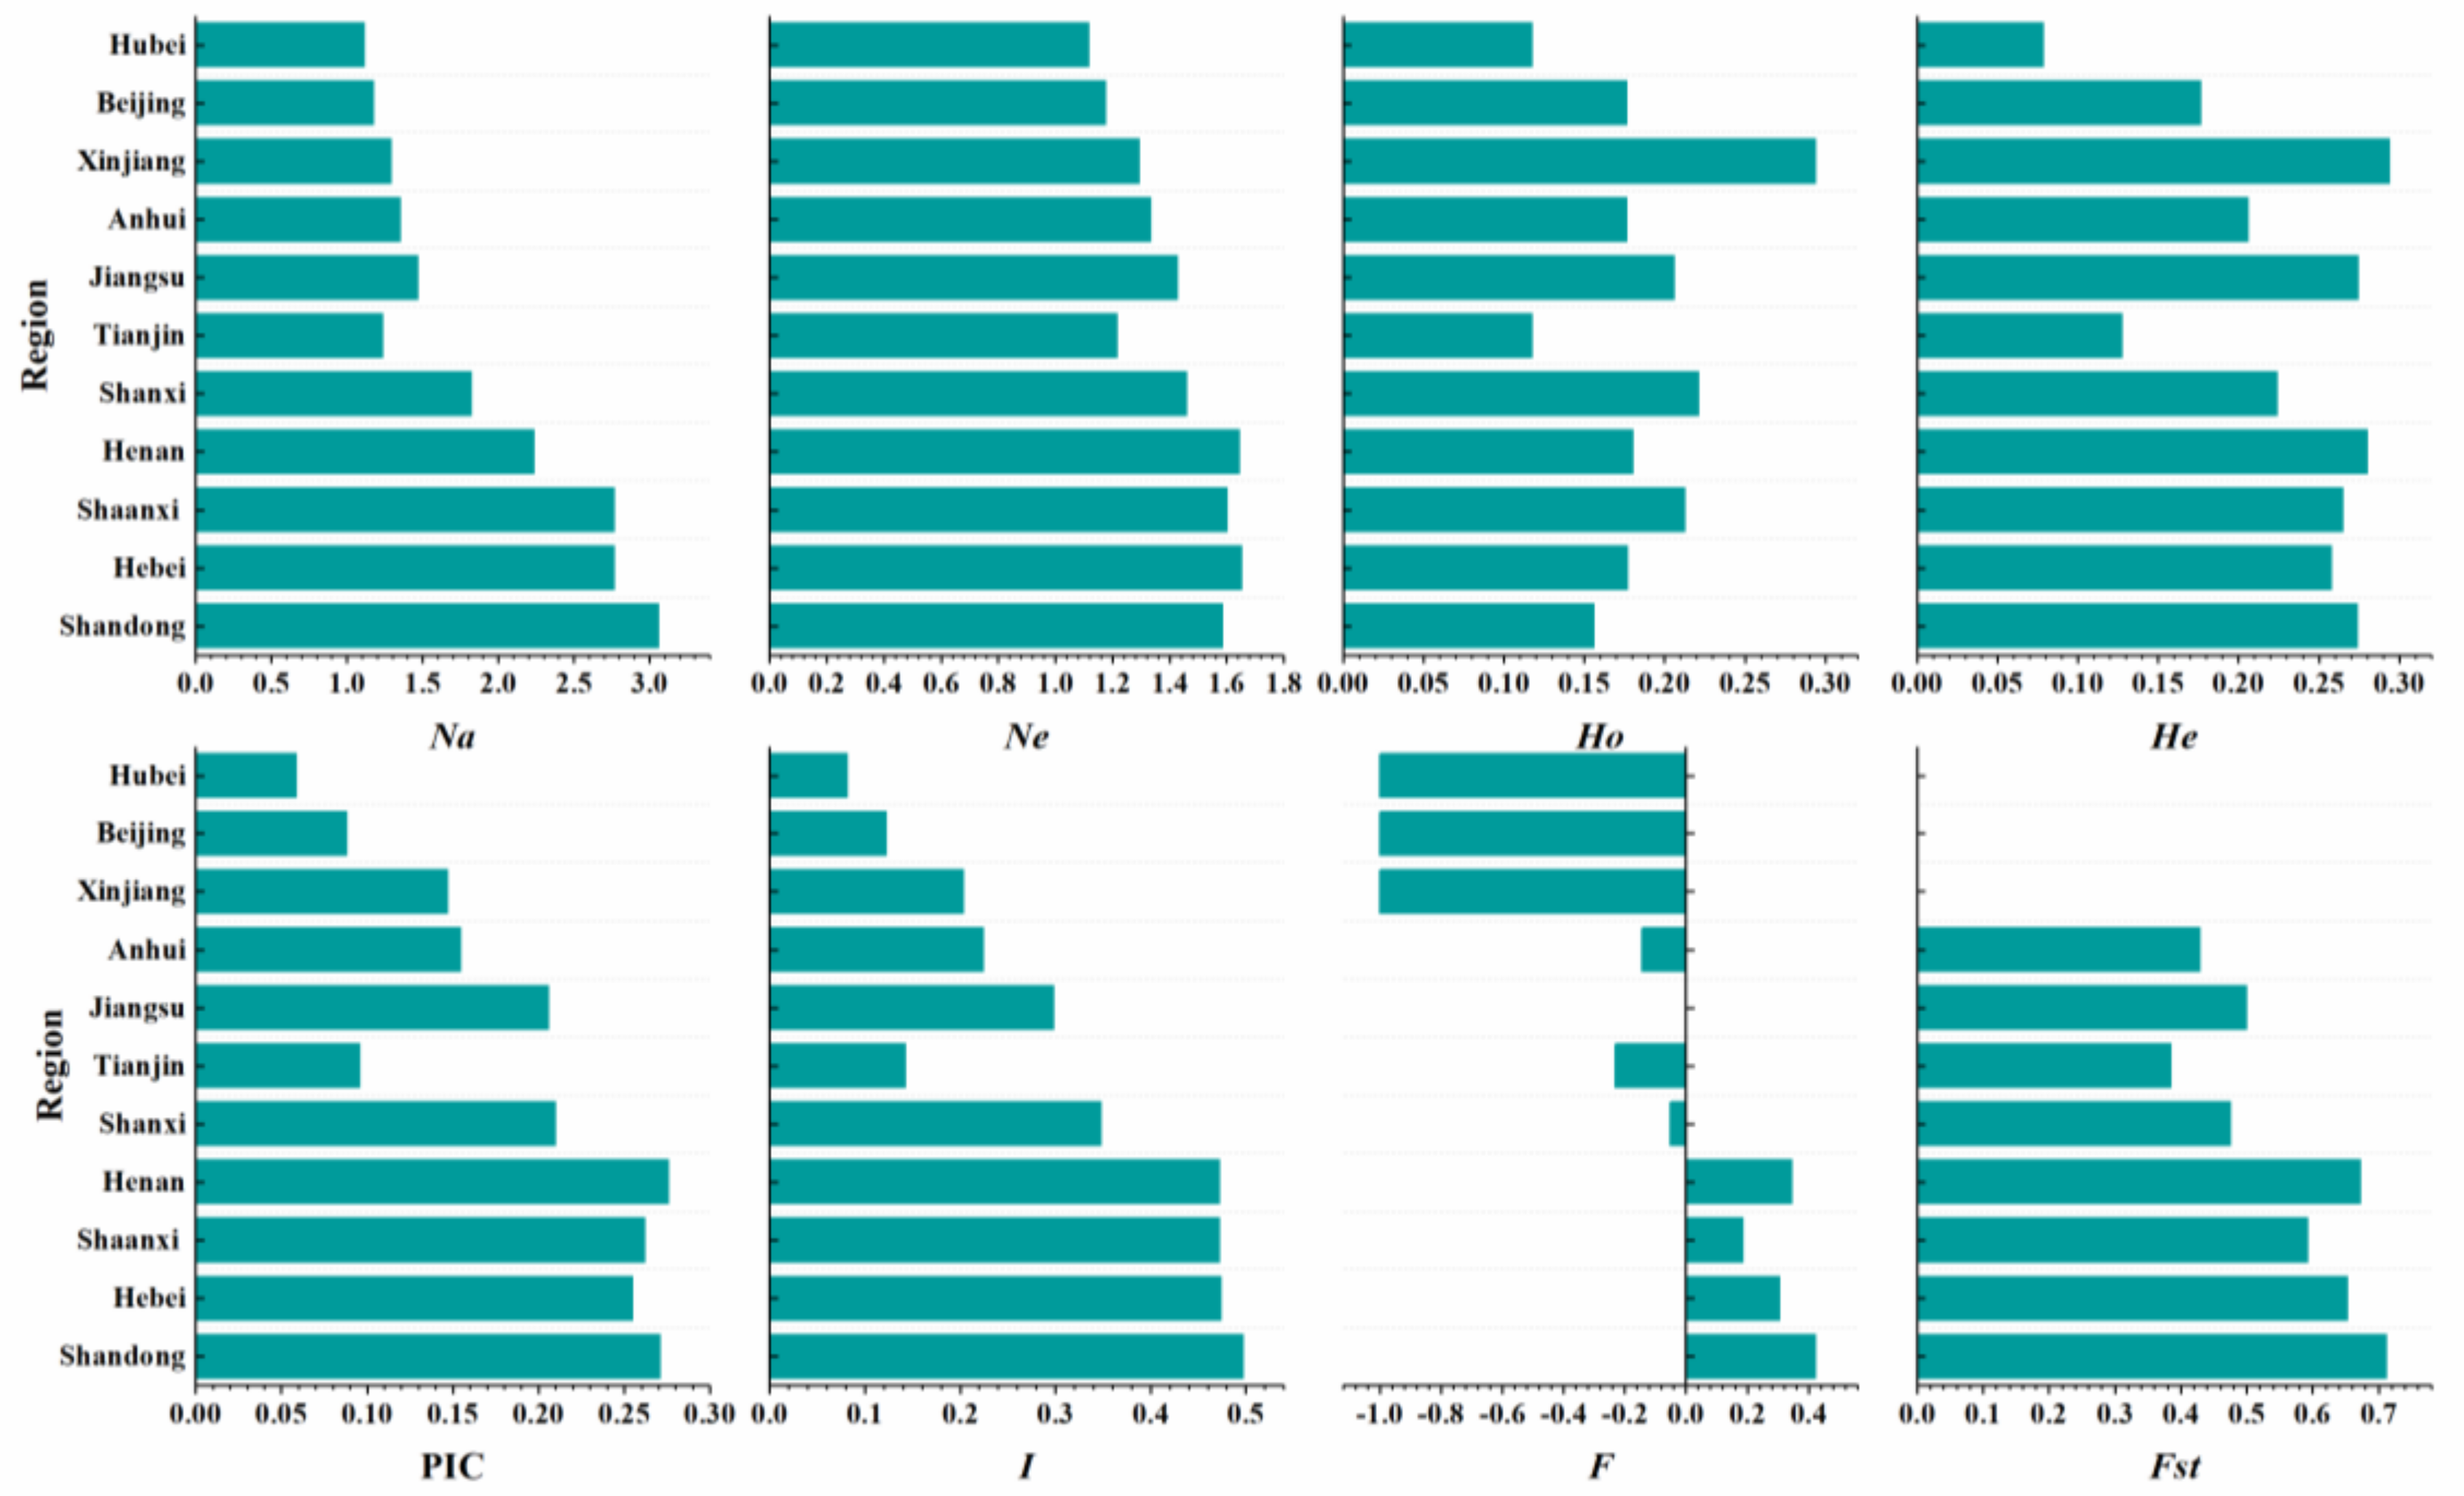
Figure 1. Comparative genetic diversity analysis of Aegilops tauschii Coss. from different provinces. Abbreviations are as shown in Table 3.
Agriculture 11 00311 g001
Figure 2. Dendrogram of the 192 Aegilops tauschii Coss. populations based on 17 SSR markers. The population codes are colored by geographic locations. The branches are colored by genetic distance. The population codes by province: Hebei, black; Shandong, red; Henan, blue; Shanxi, aqua; Shaanxi, fuchsia; Tianjin, yellow; Anhui, orange; Hubei, green; Jiangsu, dark green; Beijing, violet; Xinjiang, gray. The branches by genetic cluster: cluster 1, pink; cluster 2, aqua; cluster 3, green; cluster 4, white (population code referred to Table S1).
Agriculture 11 00311 g002
Figure 3. STRUCTURE analysis of the 192 Aegilops tauschii Coss. populations. (A) Plot of mean likelihood L (K) and variance per K value. (B) Plot of mean rate of change of the likelihood distribution L’(K) per K value. (C) Plot of absolute value of the second order rate of change of the likelihood distribution |L’’(K)| per K value. (D) Plot of Delta K value; Delta K = mean(|L’’(K)|)/sd (L(K)) per K value. (E) Genetic relationships of the 192 Ae. tauschii populations using STRUCTURE analysis. Each individual is represented by a thin vertical line, which is partitioned into K colored segments that represent the individuals’ estimated membership fractions in K clusters.
Agriculture 11 00311 g003
Table 1. The occurrence frequency of Aegilops tauschii Coss. and populations used for genetic diversity analysis in each province.
ProvinceYearMonthOccurrence Frequency (%)Number of Populations
Shaanxi20175–656.9643
Henan20175–692.8530
Anhui201758.572
Jiangsu2017514.002
Xinjiang201781.471
Hubei201753.172
Sichuan20174–50.910
Shandong2018687.0758
Hebei2018675.2443
Shanxi2018611.768
Beijing2019625.001
Tianjin2019612.502
Total——————192
Table 2. Characteristics of 17 Simple Sequence Repeat (SSR) markers used for evaluating genetic diversity of 192 Aegilops tauschii Coss. populations from China.
Primer NamePrimer Sequence (5′–3′) 1Tm (°C)5′ ModifyAllele Size (bp)
Xgdm153-5DF-TATAGGCAAATTAATTAAGACG50.3hex208–277
R-ATCTTTATGTGAGTACACTGC
Xgwm314-3DF-AGGAGCTCCTCTGTGCCAC61.1fam160–181
R-TTCGGGACTCTCTTCCCTG
Xgwm295-7DF-GTGAAGCAGACCCACAACAC60fam232–254
R-GACGGCTGCGACGTAGAG
Xgwm102-2DF-TCTCCCATCCAACGCCTC58hex138–147
R-TGTTGGTGGCTTGACTATTG
Xgdm111-1DF-CACTCACCCCAAACCAAAGT55.3fam186–193
R-GATGCAATCGGGTCGTTAGT
Xgdm129-4DF-GAGCAGGCAGCAGCTAGC60fam101–111
R-TGCATCATCATCGGTCAAGT
Xgwm165-4DF-TGCAGTGGTCAGAGTTTTCC55.3hex189–193
R-CTTTTCTTTCAGATTGCGCC
Xgwm157-2DF-GTCGTCGCGGTAAGCTTG56.7hex98–100
R-GAGTGAACACACGAGGCTTG
Xgwm383-3DF-ACGCCAGTTGATCCGTAAAC60hex215–230
R-GACATCAATAACCGTGGATGG
Xgdm33-1DF-GGCTCAATTCAACCGTTCTT60hex122–204
R-TACGTTCTGGTGGCTGCTC
Xgwm182-5DF-TGATGTAGTGAGCCCATAGGC58fam148–171
R-TTGCACACAGCCAAATAAGG
Xgwm539-2DF-CTGCTCTAAGATTCATGCAACC58.5fam98–106
R-GAGGCTTGTGCCCTCTGTAG
Xgwm469-6DF-CAACTCAGTGCTCACACAACG57hex151–205
R-CGATAACCACTCATCCACACC
Xgwm55-6DF-GCATCTGGTACACTAGCTGCC56.9hex124–136
R-TCATGGATGCATCACATCCT
Xgdm126-1DF-TCCATCATATCCGTAGCACA54.1fam178–216
R-CGTGGTTGATTTCAGGAGGT
Xgwm205-5DF-CGACCCGGTTCACTTCAG57.1fam126–138
R-AGTCGCCGTTGTATAGTGCC
Xgwm583-5DF-TTCACACCCAACCAATAGCA57.5hex138–166
R-TCTAGGCAGACACATGCCTG
1 F, the forward primer; R, the reverse primer.
Table 3. PCR amplification results and genetic parameters of microsatellite loci 1.
Primer NameNaNeHoHeHPICIFFstNm
Xgdm153-5D41.0210.0050.0210.0210.0210.0690.7480.8740.036
Xgwm314-3D73.5340.6090.7190.7170.7171.3850.1510.5750.185
Xgwm295-7D71.8510.0100.4610.4600.4600.8520.9770.9890.003
Xgwm102-2D31.3200.0050.2440.2430.2430.4600.9790.9890.003
Xgdm111-1D31.0420.0000.0410.0410.0410.1131.0001.0000.000
Xgdm129-4D31.0210.0000.0210.0210.0210.0651.0001.0000.000
Xgwm165-4D21.5870.0000.3710.3700.3600.5571.0001.0000.000
Xgwm157-2D21.0110.0000.0100.0100.0100.0331.0001.0000.000
Xgwm383-3D52.6560.9120.6250.6240.6231.102−0.4620.2690.679
Xgdm33-1D112.6410.0100.6230.6210.6211.2390.9830.9920.002
Xgwm182-5D51.3280.0000.2480.2470.2570.4871.0001.0000.000
Xgwm539-2D21.0110.0000.0100.0100.0100.0321.0001.0000.000
Xgwm469-6D102.7861.0000.6430.6410.6441.214−0.5600.2200.886
Xgwm55-6D62.5960.5050.6160.6150.6161.1180.1780.5890.174
Xgdm126-1D51.0940.0100.0860.0860.0860.2310.8790.9390.016
Xgwm205-5D21.0110.0000.0100.0100.0100.0331.0001.0000.000
Xgwm583-5D31.1050.0050.0950.0950.0950.2190.9450.9730.007
Mean4.7061.6830.1810.2850.2840.2840.5420.6950.8480.117
Total80——————————————————
1Na, Observed number of alleles; Ne, Effective number of alleles; Ho, Observed heterozygosity; He, Expected heterozygosity; H, Nei’s gene diversity; PIC, Polymorphism information content; I, Shannon’s information index; F, Wright’s fixation (F = 1—Ho/He); Fst, Proportion of differentiation among populations; Nm, Gene flow (Nm = [(1/Fst)—1]/4).
Table 4. Analysis of molecular variation (AMOVA) among Aegilops tauschii Coss. groups using 17 SSR primers.
Source of VariationDegree of Freedom (df)Sum of SquaresMean of SquaresEstimate Variance Percentage of Variation (%)
Among groups2130.46465.2320.4397
Among populations within groups1891832.1069.6944.07167
Within populations 1922981.5521.55226
Total3832260.576.0626.062100
Table 5. Pairwise proportion of differentiation among populations (Fst, below the diagonal) and gene flow (Nm, above the diagonal) of Aegilops tauschii Coss. among different groups.
Group123
102.7212.362
20.084 ** 108.264
30.096 **0.029 **0
1 **, Significant difference at 0.01 probability.
Publisher’s Note: MDPI stays neutral with regard to jurisdictional claims in published maps and institutional affiliations.