Article

Estimation of the Cooling Rate of Six Olive Cultivars Using Thermal Imaging

1
Department of Biochemistry and Molecular Biology of Plant Products (CSIC), Instituto de la Grasa, 41092 Seville, Spain
2
Department of Crystallography, Mineralogy and Agricultural Chemistry, University of Seville, 41089 Seville, Spain
3
Department of Mechanics, University of Córdoba, 14014 Córdoba, Spain
*
Author to whom correspondence should be addressed.
Agriculture 2021, 11(2), 164; https://doi.org/10.3390/agriculture11020164
Submission received: 31 December 2020 / Revised: 9 February 2021 / Accepted: 12 February 2021 / Published: 17 February 2021
(This article belongs to the Special Issue Postharvest Physiology and Technology of Horticultural Crops)

Abstract

:
Bringing the olive harvest period forward leads to storing fruit in field temperatures that risk jeopardizing its quality. Knowledge about the bio-thermal characteristics of olives is crucial when considering their cooling, although published research on the subject is limited. In this work, the cooling rate of the fruit of six olive cultivars has been empirically determined by measuring the evolution of their low temperature under controlled conditions by thermal imaging. Based on these data, the cooling time needed to cool the fruit to 22 °C was estimated, considering the biometric characteristics of the individual fruit, a field temperature from 26 to 42 °C, and a room cooling temperature from −8 to −20 °C. The results showed differences among the cultivars and the need to further investigate the specific heat requirements for small varieties and the impact of the conduction factor on the heavier ones. The simulation suggests that between 2 min (for the light Arbequina and Koroneiki cultivars) and 5 min (for the heavier Verdial and Gordal cultivars) suffice to cool the fruit to the desired temperature with a room temperature of −16 °C. These results show the feasibility of developing technological solutions for cooling olives before their industrial processing with industrial applications such as cooling tunnels on individual fruit.

1. Introduction

It can be expected that olive production will be confronted with profound major challenges with respect to climate change [1,2]. Some models predict that the expected substantial warming and decrease in precipitation will have a significant impact on growth and productivity of olive varieties in the next few decades [3,4]. The flowering of the olive trees and the ripening of their fruit are expected to advance, with phenologies occurring outside the usual dates that will advance the period of olive harvesting [5,6,7]. Therefore, harvesting will occur during warmer periods.
Spain is the world’s leading oil-producing country and, apart from its differences, has conditions which are similar to those of the main oil-producing countries in the Mediterranean basin. In these areas, the advancing of the harvest period is already taking place in olive grove systems which are highly mechanized due to the great possibilities of a fast and efficient harvesting [8,9]. In these orchards, the “Arbequina” cv. is the most established variety (90%) followed by the “Arbosana”, “Koroneiki” cvs, and the recently introduced “Sikitita” cv. [10,11]. These cultivars are characterized by an early ripening that starts in the first weeks of November. Given the preference to harvesting green olives to extract the more valued premium olive oil, the harvesting season often starts several weeks earlier than normal. As a consequence, harvesting is done in a period when temperatures during the day are well above 30 °C.
The expansion of early ripening cultivars, the tendency to bring forward the harvest and the increase in temperature may compromise the quality of olive oil extracted. When the olives arrive at the mill at temperatures well above 30 °C, and taking into account that the crushing itself contributes to a further increase of 4–6 °C, the quality of the oil produced is impaired [12]. Moreover, the bulk transport of picked olives, as well as their temporal storage at the mill at a high field temperature, can provoke anaerobic fermentation processes and the formation of intracellular alcohols, which in turn give rise to the formation of alcoholic esters during extraction and the presence of undesirable oil defects [13,14,15] which can be increased by defects produced by mechanized harvesting [16].
Processing olives below 27 °C (cold-pressing) is a key factor for producing oil of the best quality. The effect of cooling the olive fruit just before crushing modulates oil composition, organoleptic traits, and aroma profiles, reducing oil off flavors while enhancing green and fresh attributes [17]. On one hand, at the level of the mill, different investigations have been carried out to lower the fruit temperature such as the use of cold, climatic chambers or the use of dry ice, practices that are not easily adaptable to an industrial oil transformation process [18]. One the other hand, at the level of fruit storage, the effects of cooling and modified atmosphere on the fruit and the extracted oil has been extensively studied [19,20,21,22]. However, the thermodynamic characteristics of the fruit are largely out of sight of this line of research and specific data remains scarce in other studies.
Knowing the thermodynamic properties and the cooling curves of the fruits is fundamental for effective cooling of the olives and thus for mitigating the effects of the aforementioned heating. Determining the cooling time needed to reach the desired temperatures is the first necessary step in the design and/or implementation of any cooling system. Existing physical models have low applicability at the industrial level, since it is very difficult to take into account the physical and biochemical variability of the fruit with the parameters they contemplate. Therefore, an effective way to obtain information about the cooling process is by making physical measurements in a real process.
The thermodynamic parameters may be obtained by an empirical approximation through measuring the temperature change of individual fruit under controlled conditions. A continuous non-invasive, non-contact temperature measurement can be obtained using thermal imaging [23,24]. By measuring the temperatures inside the fruit over a selected time period and under different conditions, useful data can be obtained for an effective cooling of fruit after harvest and before processing.
The objective of this study is to empirically determine the cooling rate of individual olives, under room cooling conditions in order to relate the obtained results with their physical and geometrical characteristics. Then, it is intended to simulate the cooling process of the olive fruit by convection with a range of field temperatures and room cooling temperatures to estimate the time needed to bring the intact fruit of each cultivar to an acceptable temperature before further processing.

2. Material and Methods

2.1. Experimental Material

Six different samples of 1 kg olive fruit each were randomly harvested manually from olive orchards in Seville and Huelva in January 2018 and November 2019: Arbequina, Koroneiki, Picual, Hojiblanca, Verdial, and Gordal. All the fruit were undamaged and in an advanced state of ripeness with maturity index of 5 [25] except the samples of Verdial and Gordal which were still green when picked with maturity index of 3 [25].
The experiments took place in the laboratories and the experimental milling installation of the Instituto de la Grasa in Seville. A heating chamber with a volume of 0.74 m3 (BINDER, FD720) was used to warm the olives to 36 °C, while a freezing chamber with a volume of 50 m³ at −17 °C (±1 °C) provided the necessary cold environment to obtain a high temperature differential between the fruit and the environment. Heat losses in the transposition between cameras were minimal as both cameras were located less than 4 m apart.
Twenty-five olives of each sample batch were placed on an insulation board (50 cm× 50 cm× 5 cm) provided with 25 notches (5 rows of 5, with a frame of 5 cm × 5 cm). The board with the olives was placed inside the heating chamber until its temperature reached 36 °C (controlled with an IR pyrometer). Then, the board was placed on the ground of the freezing chamber where a fan guaranteed that the air circulated well without generating a current very close to the samples. A frame with an IR-camera (FLIR, Vue Pro.) was placed 1 m above the ground (Figure 1) taking thermal pictures immediately after the freezer door was closed. The camera was controlled by an app outside the freezer and was programmed to take a picture every 10 s for 240 s. The temperature evolution of each olive throughout the time was obtained separately by using a software tool (Flir © Systems Inc., Version 6.4) which fixed a central area in each fruit that comprised 60 pixels, each representing a different measurement point (Figure 1).

2.2. Biometrical Data and Oil Content

The olives’ weight was measured with a precision balance (precision 0.01 g). The length and width were measured with a sliding adjuster (precision 0.1 mm). The surface area (S) and volume (V) of each olive was calculated, assuming that the shape of the olive resembled a prolate spheroid (Equations (1) and (2)). The specific surface area (SSA) was calculated using Equation (3).
S = 2 π a [ a + b e arcsin 1 b 2 a 2 ] ,
V = 4 3 π a 2 b ,
SSA =   Surface   mm 2 Weight   g ,
where “a” is half the length of the olive and “b” is half the width of the olive, the semi-axes, located on the longitudinal axis of the fruit.
After the experiment, each sample was crushed. The moisture content and oil content on dry and fresh weight were determined by Near-Infrared Spectroscopy.

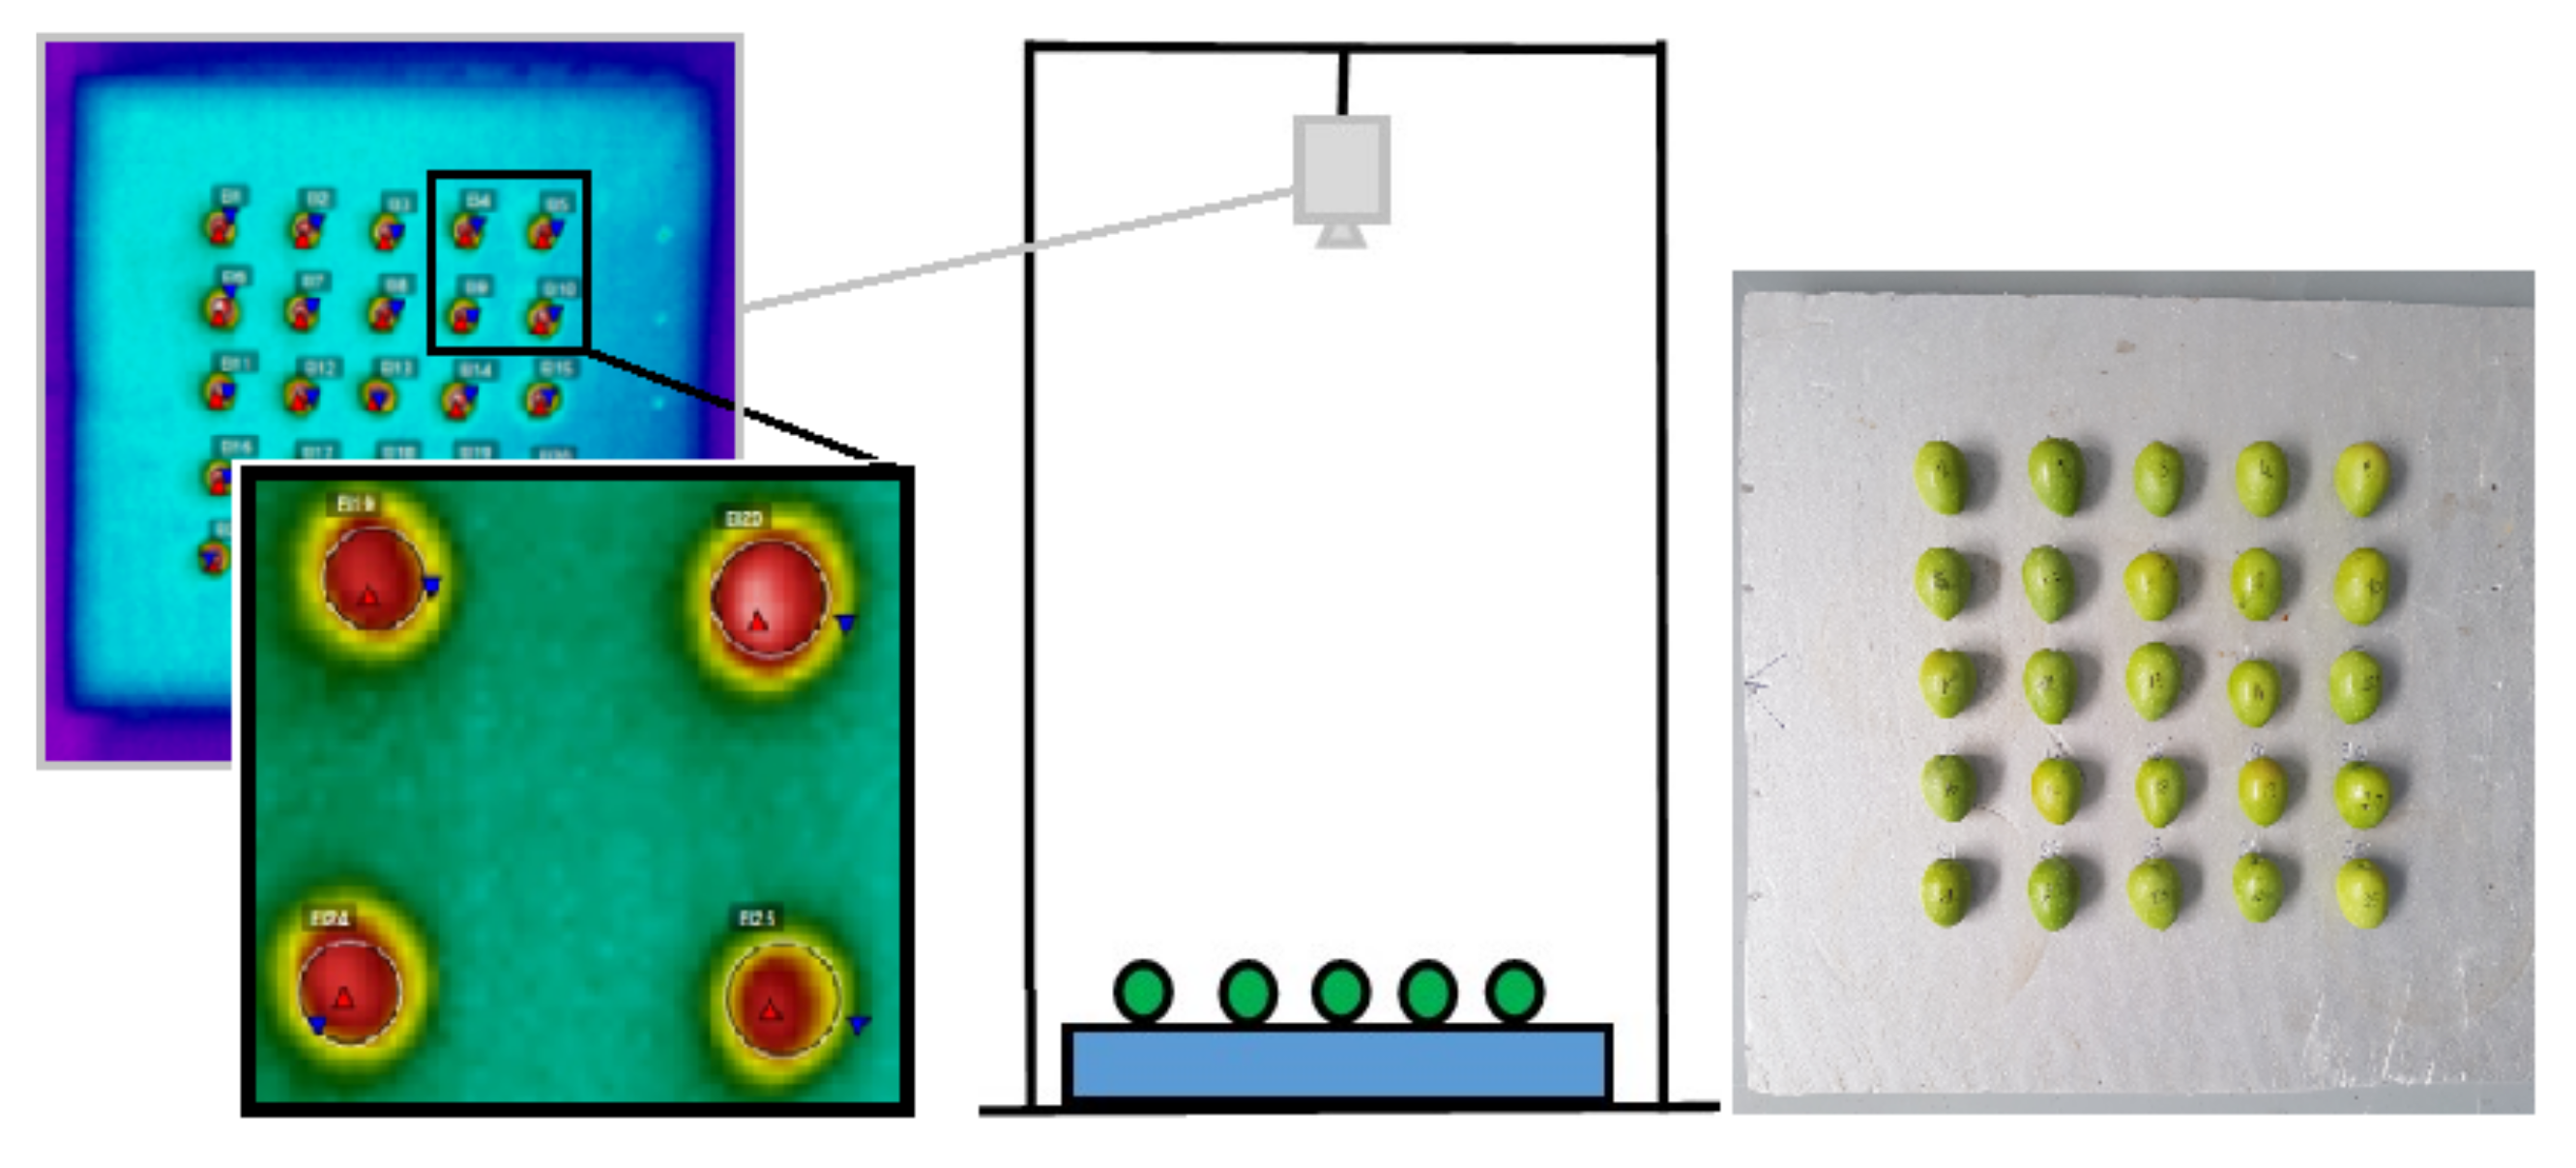
2.3. Biothermal Data and Mathematical Calcuation

The heat ( Q ) needed to cool an olive is proportional to its mass (m), its specific heat capacity ( C p ) and the initial T i and final or ambient temperature ( T a ) differential for a control volume with negligible changes in kinetic and potential energies (Equation (4)).
Q = m C p T i T a
This specific heat capacity can be calculated using either semi-theoretical equations that are based on the thermodynamic principles of freezing point depression or on empirical equations that are derived from regression analysis of experimental data. However, it can be determined directly by knowing the mass fraction of the solids [26]. As the moisture fraction of the samples (xs) was known through NIR spectroscopy, their specific heat (Cp) could be calculated as follows:
Cp (J/kg∙°C) = 4190 − 2300 xs − 630 xs³.
We also know that the rate of heat change or cooling (Equation (6)) is directly proportional to the fruit temperature ( T ) and the ambient temperature ( T a ) differential and inversely proportional to the heat transfer resistance (R).
dQ   dt =     T   T a R
Differentiating Equation (4) with respect to time and equating it with Equation (6) we get:
m C p T i T a dt =     T T a R
Reorganizing terms:
T i T a T T a = 1 m C p R   dt  
Integrating with respect to time between the time limits (t = 0 for the initial and t = t for the ambient temperature):
ln T i   T a ln   T   T a =   1 m C p R 0 t = >   ln   T i   T a T   T a   = 1 m C p R t
Finally:
T   T a T i   T a =   e 1 m C p R t
The negative slope of the obtained curve (Equation (10)) is called cooling rate (CR) and contains the resistance (R) and the properties of the produce such as its mass and heat capacity.
In this work, we are going to determine experimentally the cooling rate of each variety studied by monitoring the temperatures of the experiment. Then, plotting the logarithm of the temperature ratio versus time will give a straight line and its slope (CR). The desired time to cool a fruit from an interval of temperatures T   T a will be calculated with different initial temperatures by:
t   = CR 1   ln   T i   T a T   T a
One the other hand, half the cooling time (z) can be defined as the time interval from the temperature difference existing at any time (t) to a time at which the temperature difference reduces to one half of that at time t [26]. This cooling time can be calculated with Equation (12) by cooling coefficient (C) (Equation (13)), which reveals the difference in the fractional unaccomplished temperature change as a percentage of the total cooling possible in the system, or cooling ratio (Y) [26].
z   =   ln ½ C ,
C =   ln Y 1   ln Y 2 t 1   t 2 ,
where Y =   T T a T i T a determined experimentally.
Finally, the convection heat transfer coefficient (h) is inversely direct to the resistance and the surface can be determined by the parameters calculated:
h =   1 R S = CR   m   C p S   =   CR   C p SSA

2.4. Data Analysis

The array of data served to create a cooling curve for each olive and to calculate empirically the cooling rate of each cultivar. Subsequently, the relationship between the biometrical characteristics (weight, surface, specific surface area) of each olive fruit was related to the obtained cooling rate(s). Finally, the data were used to calculate the cooling time for each olive to obtain a temperature of 22 °C as a function of its thermodynamic properties, supposing a given initial temperature and ambient temperature. The simulation served to appreciate the time needed to bring the intact fruit of each cultivar to an acceptable temperature before its further processing.
Data organizing and statistical data analysis were performed using Microsoft Excel 365, and PASW Statistics 18.0 (SPSS). The ANOVA test determined the effect of the cultivar on the different biometrical data. When a significant effect was detected, the Tamhane test was applied to differentiate mean values. Curve fitting was done with Origin (Pro).

3. Results and Discussion

3.1. Biometrical Data, Moisture and Oil Content in the Fruit
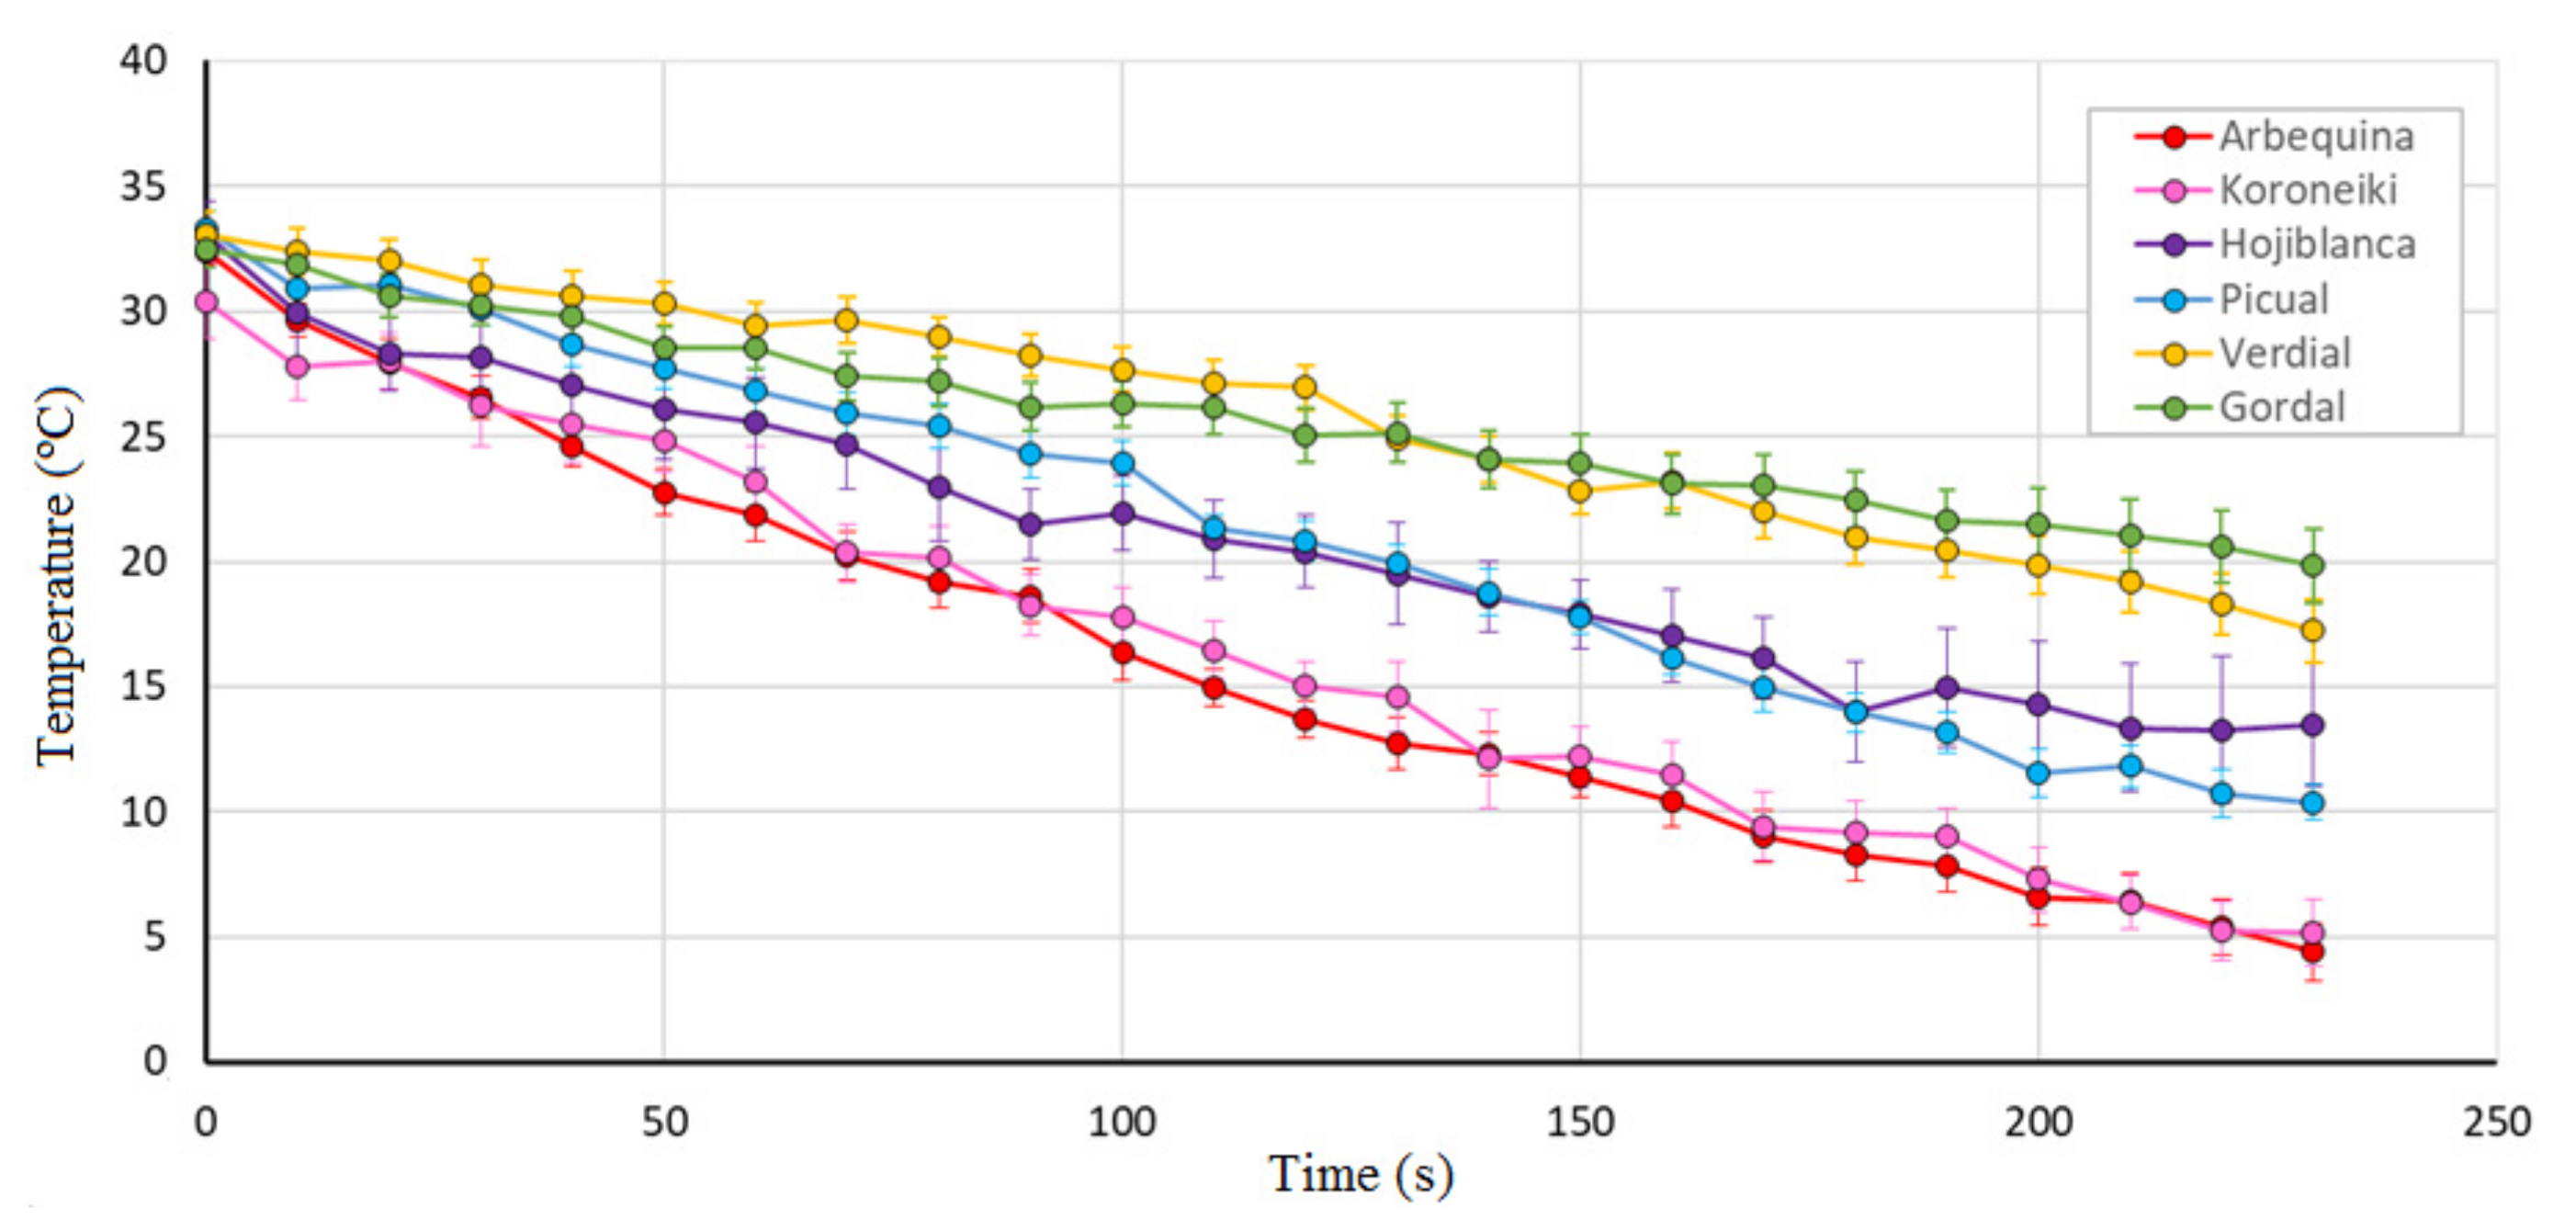
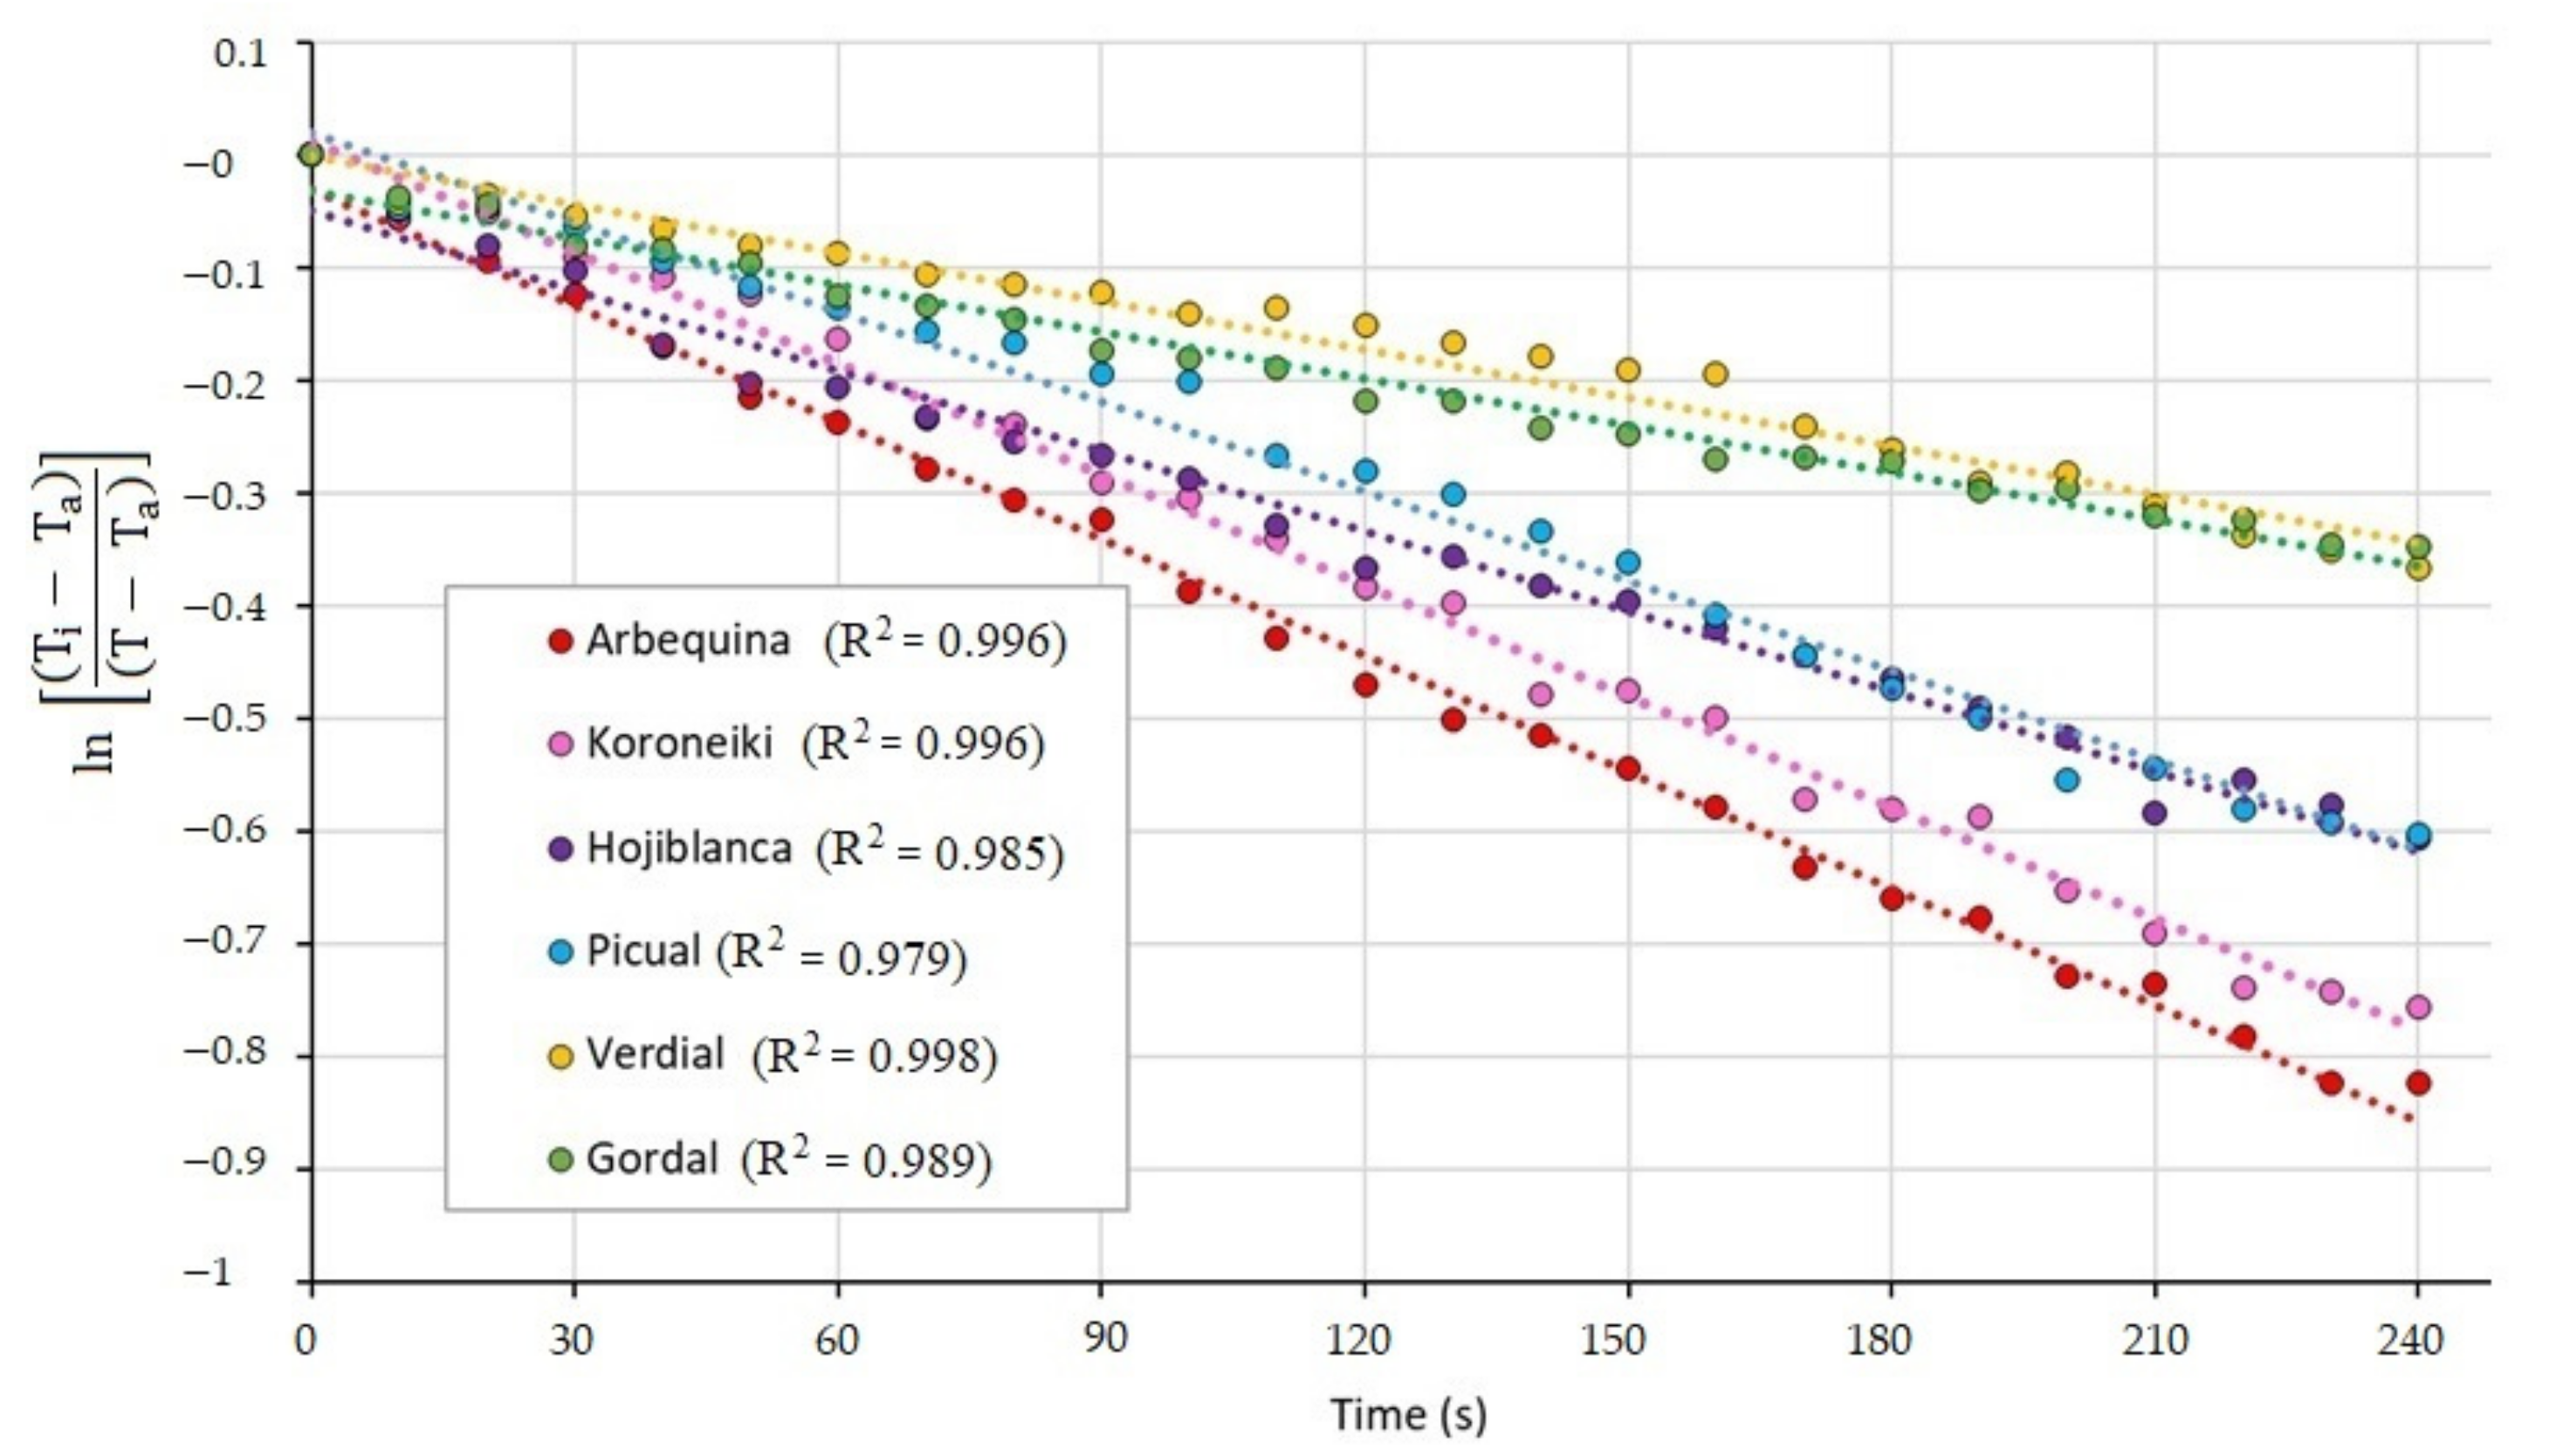
The biometrical data of the 6 samples were compared and showed to be significantly different in various parameters (Table 1). There were significant differences between the weight of each variety and the average weight of the Gordal variety which is markedly greater than the range of the other 5 cultivars. Within this overall range, the majority of the most popular Spanish cultivars can be situated according to published data [27]. The Specific Surface Area confirms the non-linear decrease in weight (or volume) with respect to surface area. When comparing the two lightest cultivars (Koroneiki and Arbequina) a mean weight of 0.88 g corresponded to a difference in SSA of 88.6 mm²/g. While the difference of 7.08 g between the two heaviest ones (Gordal and Hojiblanca) resulted in a difference in SSA of 85.2 mm²/g. The moisture and oil contents in the Picual and Verdial samples showed higher levels in fat content (both in fresh and dry material) and lower levels of moisture when compared to the other cultivar samples.
The calculated values for specific heat for each of the samples fell in a rage of 2.875 J/kg∙°C (Verdial) to 3.356 J/kg∙°C (Koroneiki). These values, based on the mass fraction of solids, were slightly lower than the mean value of 3608 J/kg∙°C, published by [28,29] published data on the thermal conductivity (k) and specific heat (Cp) of olive fruit but did not take into account the geometrical variability that exists among varieties and used simplified mathematical equations to calculate the constants.

3.2. Cooling Curves

The temperatures obtained through the thermographic measurement throughout time, T(t), or in a simple manner, T are shown in Figure 2. The initial temperature (Ti) is shown to vary between 30 and 33 °C due to the loss in heat during the transport, the time to position the olives and the delay in activating the thermographic camera. The increase in the standard deviation over time can be attributed to the variance in the biometrical differences that exist within each sample. As the cooling time becomes longer, the influence of the physical characteristics of each olive became more manifested on the measured temperature. This can be seen in the decreases in temperature suffered by the smaller varieties, Arbequina and Koroneki, (25 °C approx.) compared to those of the larger varieties, Gordal and Verdial (15 °C approx.), within the 4 min studied.
To quantify the different cooling curves, the residual temperature ratio was calculated for each of the olives at a given time. The mean values for each batch of olives at each of the different registration moments were used to create the semi-logarithmic cooling rate curve for each cultivar (Figure 3). According to Equation (10), the cooling rate (CR) is the negative slope of the linear curve that best fits the obtained points for each batch of olives (Table 2). The correlation coefficient of the different curves attainted values above 0.98. The graph demonstrated the differences between cooling rates among cultivars and the mean values of the cooling rate permitted to appreciate quantitatively the differences among cultivars. The smallest cultivars, Arbequina and Koroneiki, did present mean values that are more than 2.5 times higher than Gordal.

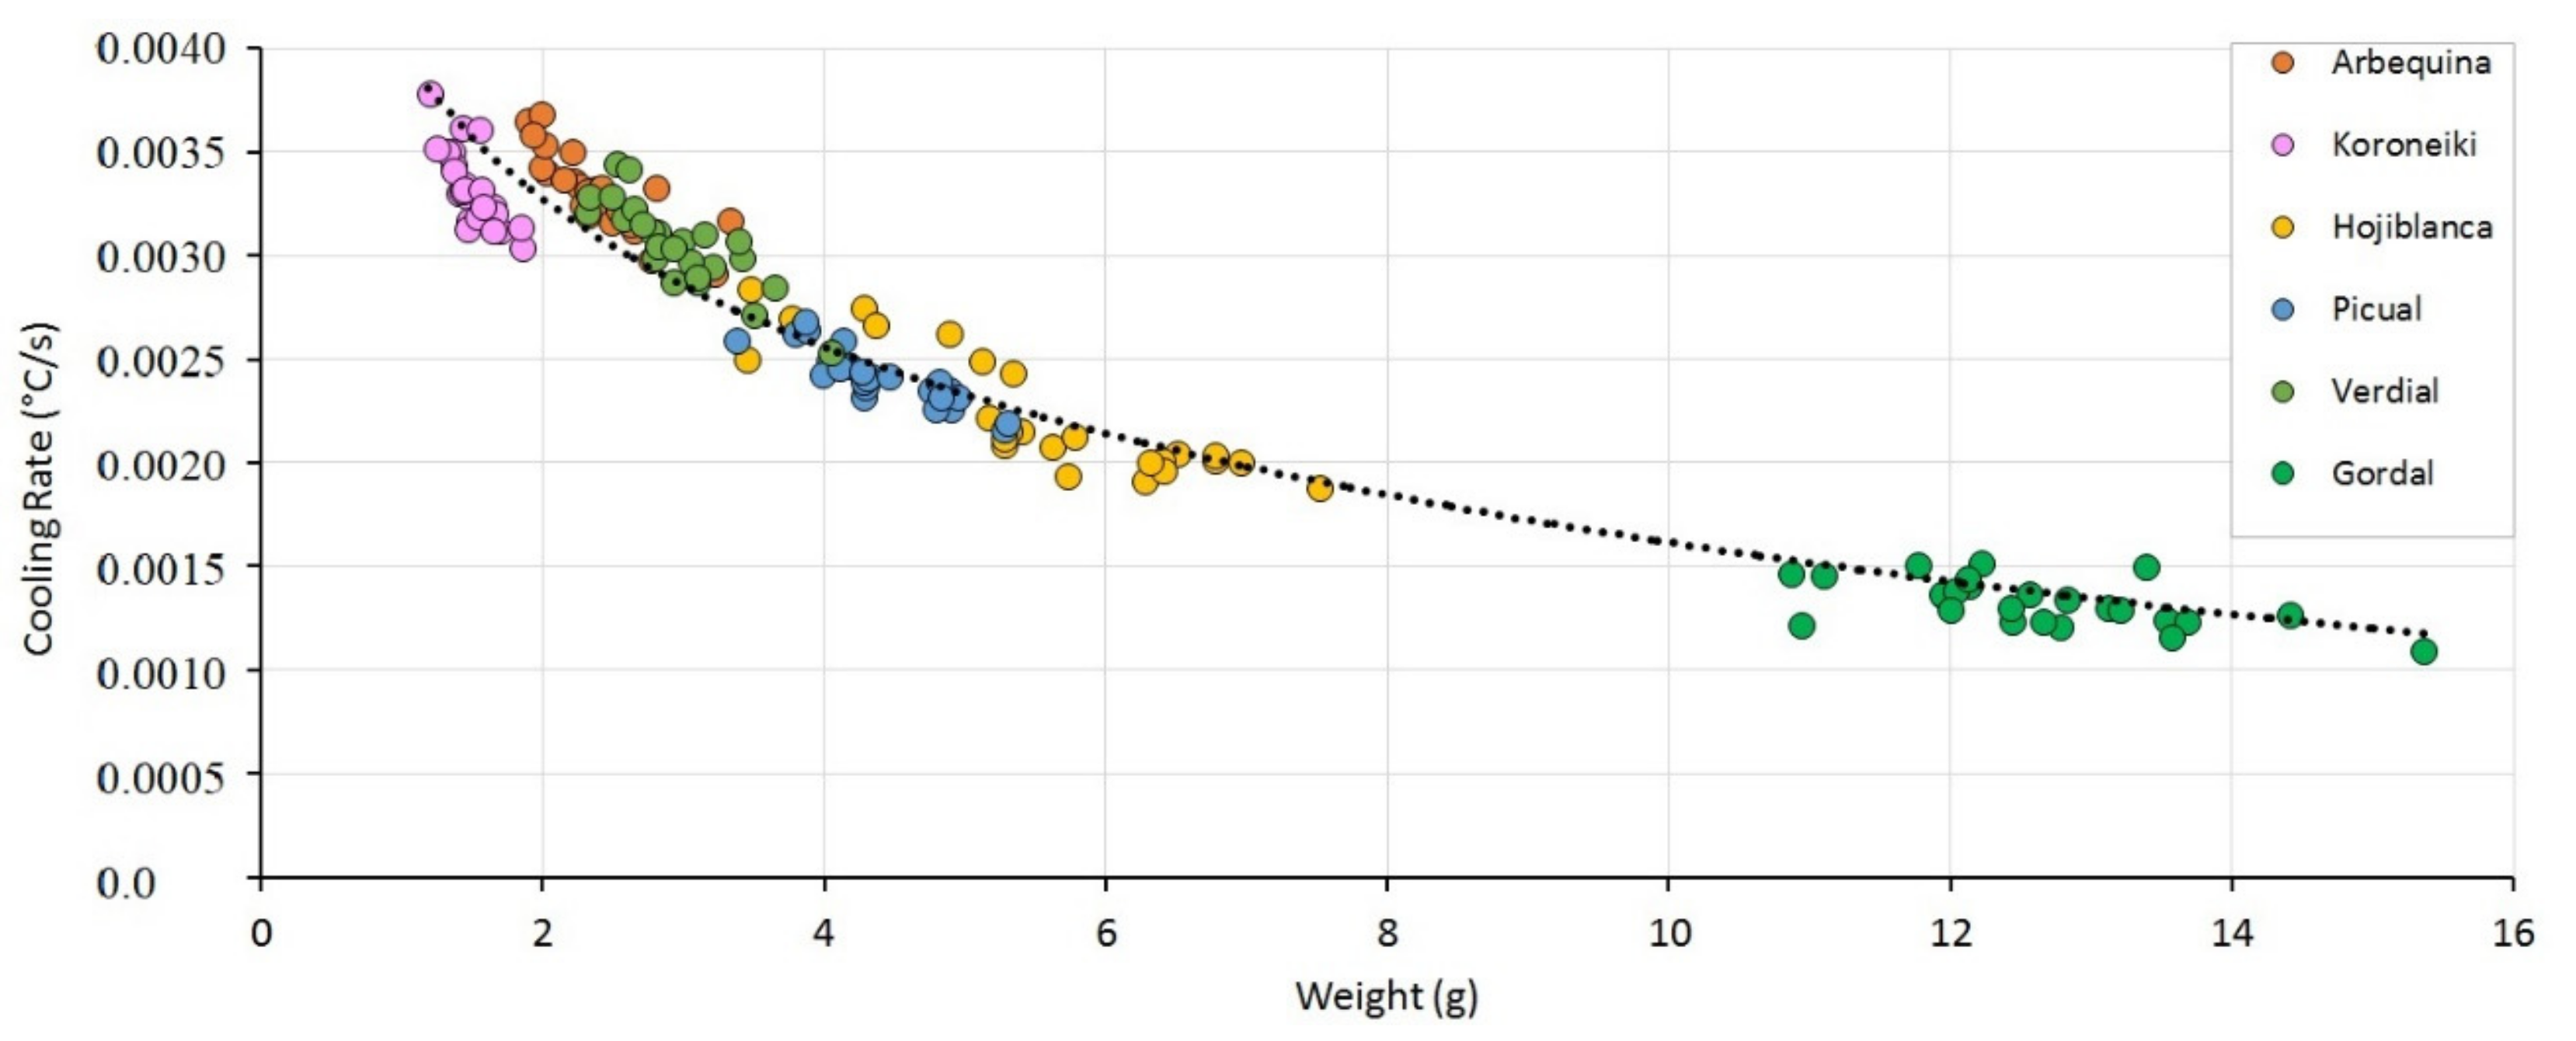
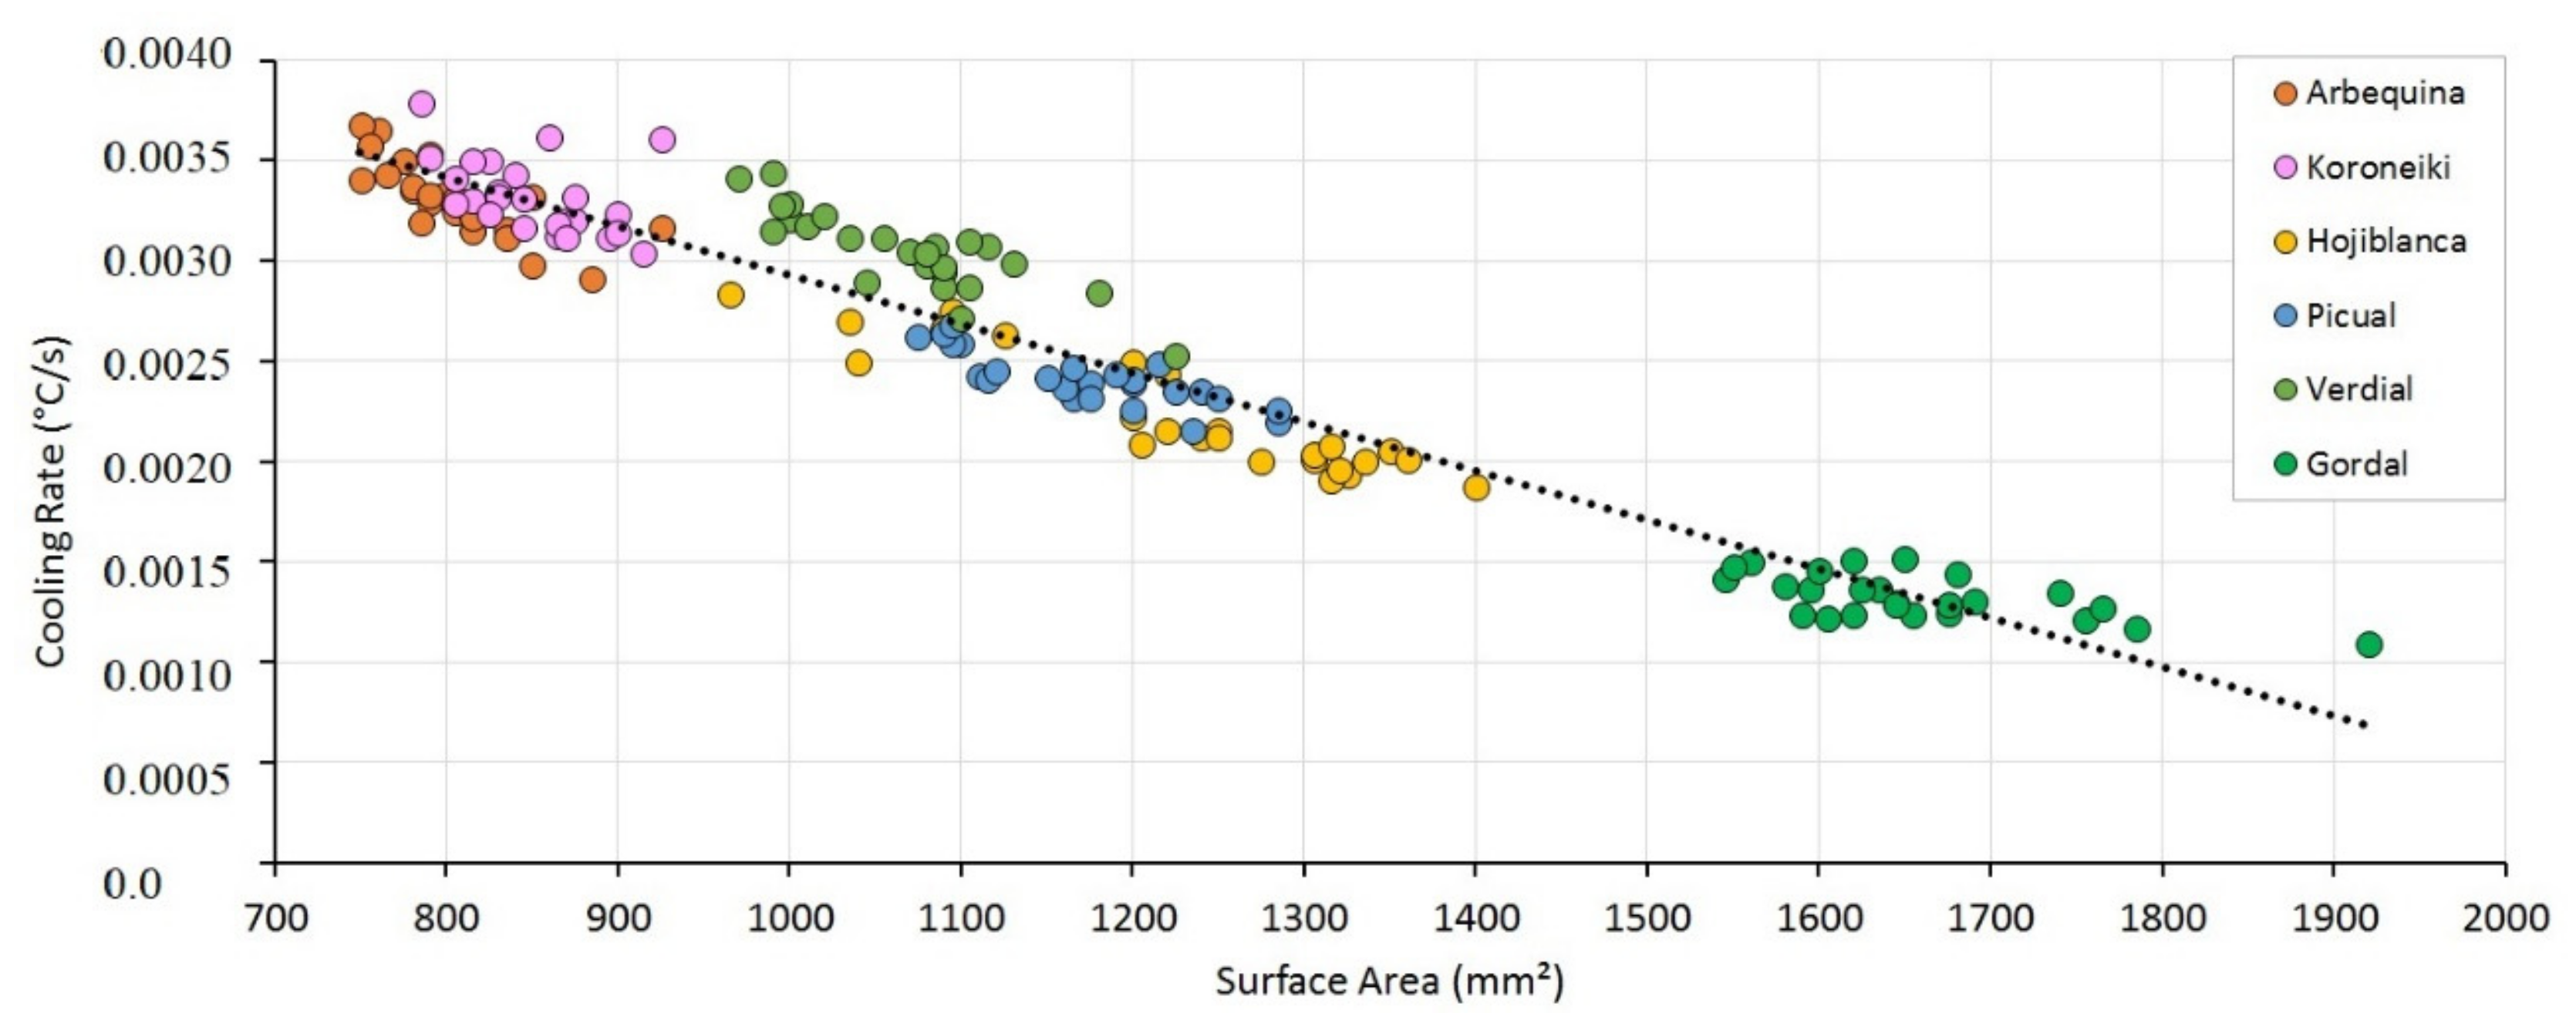
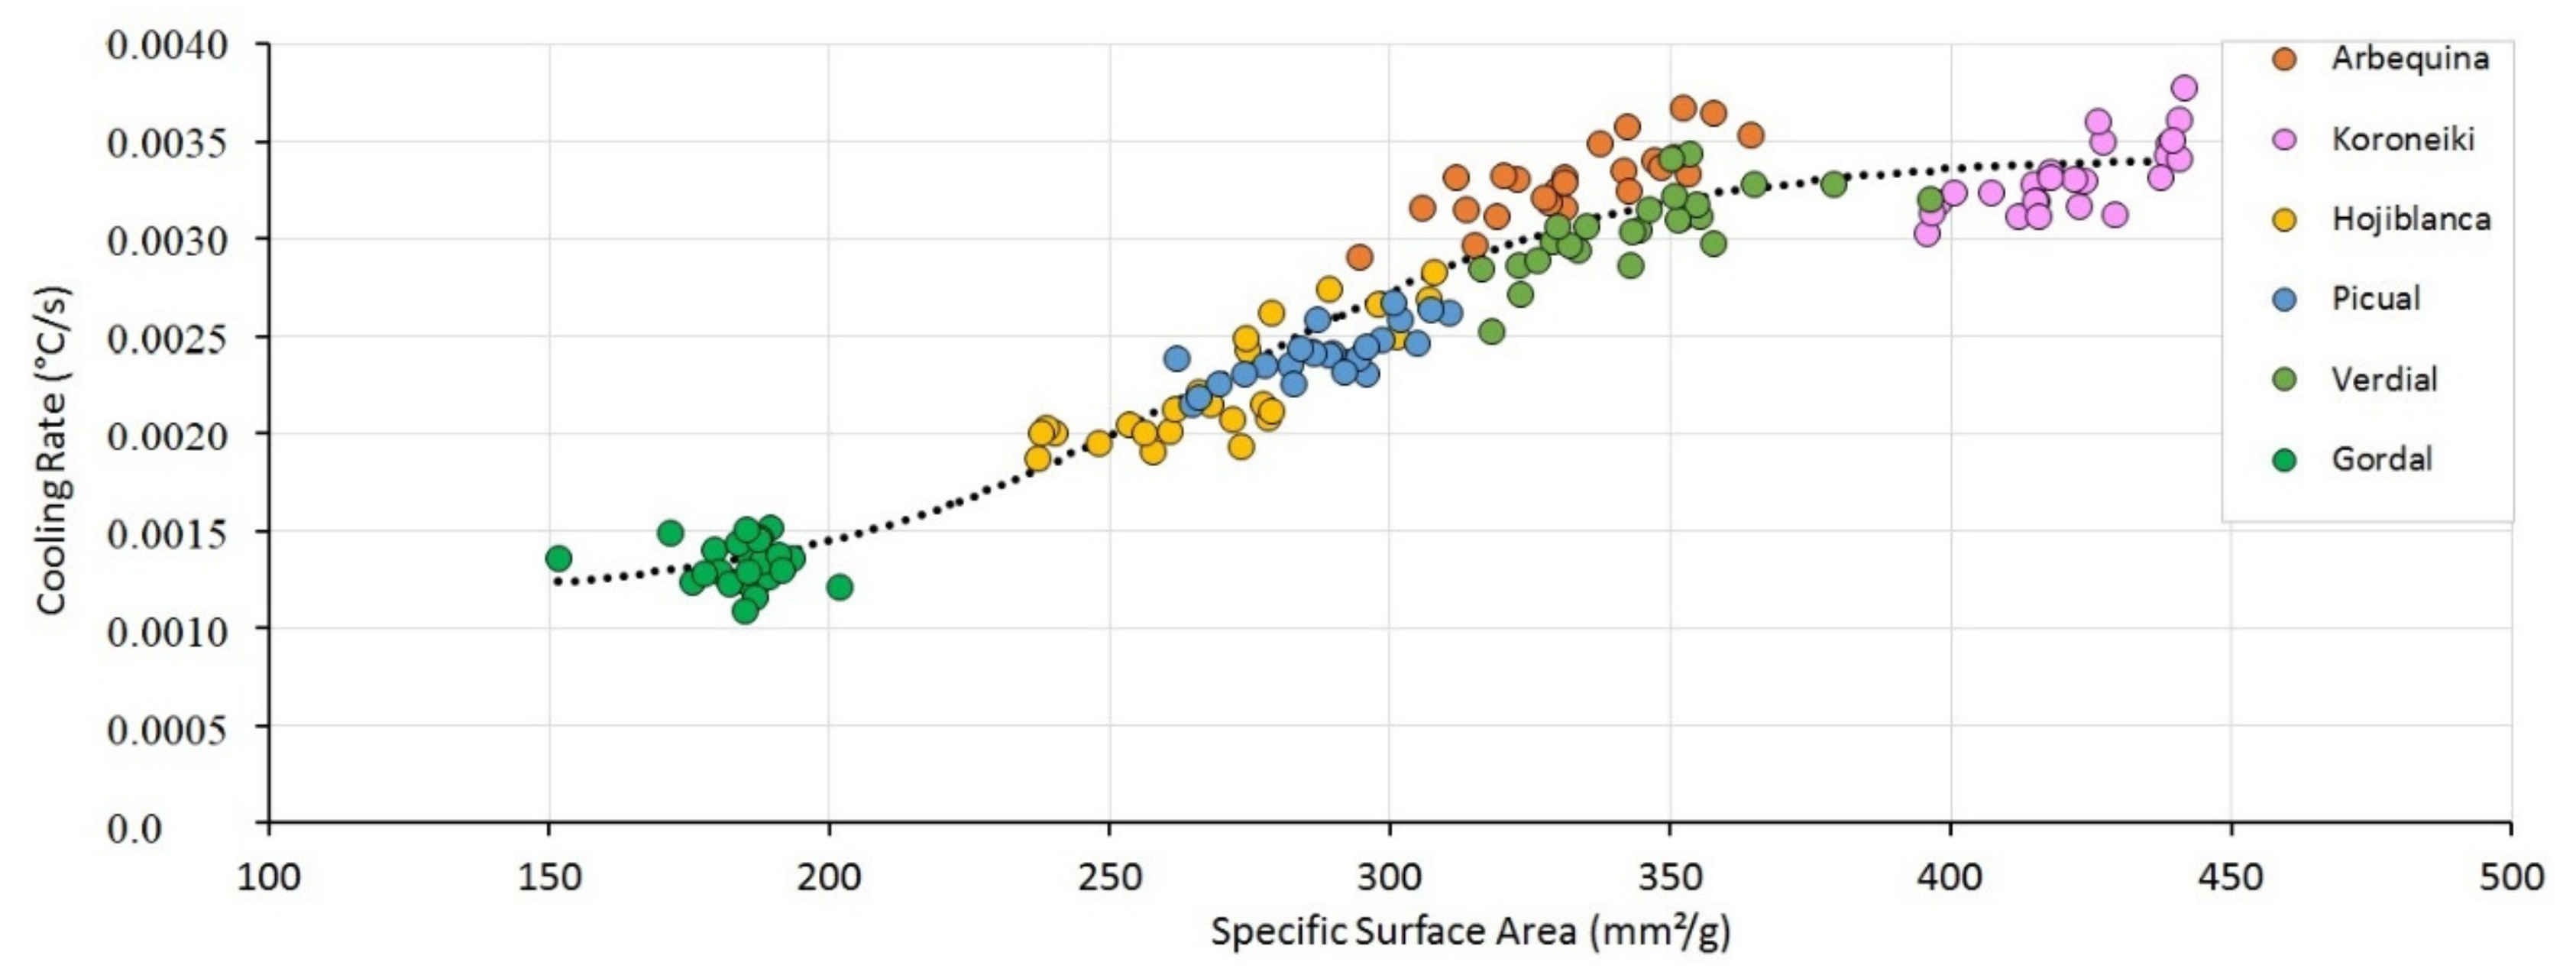
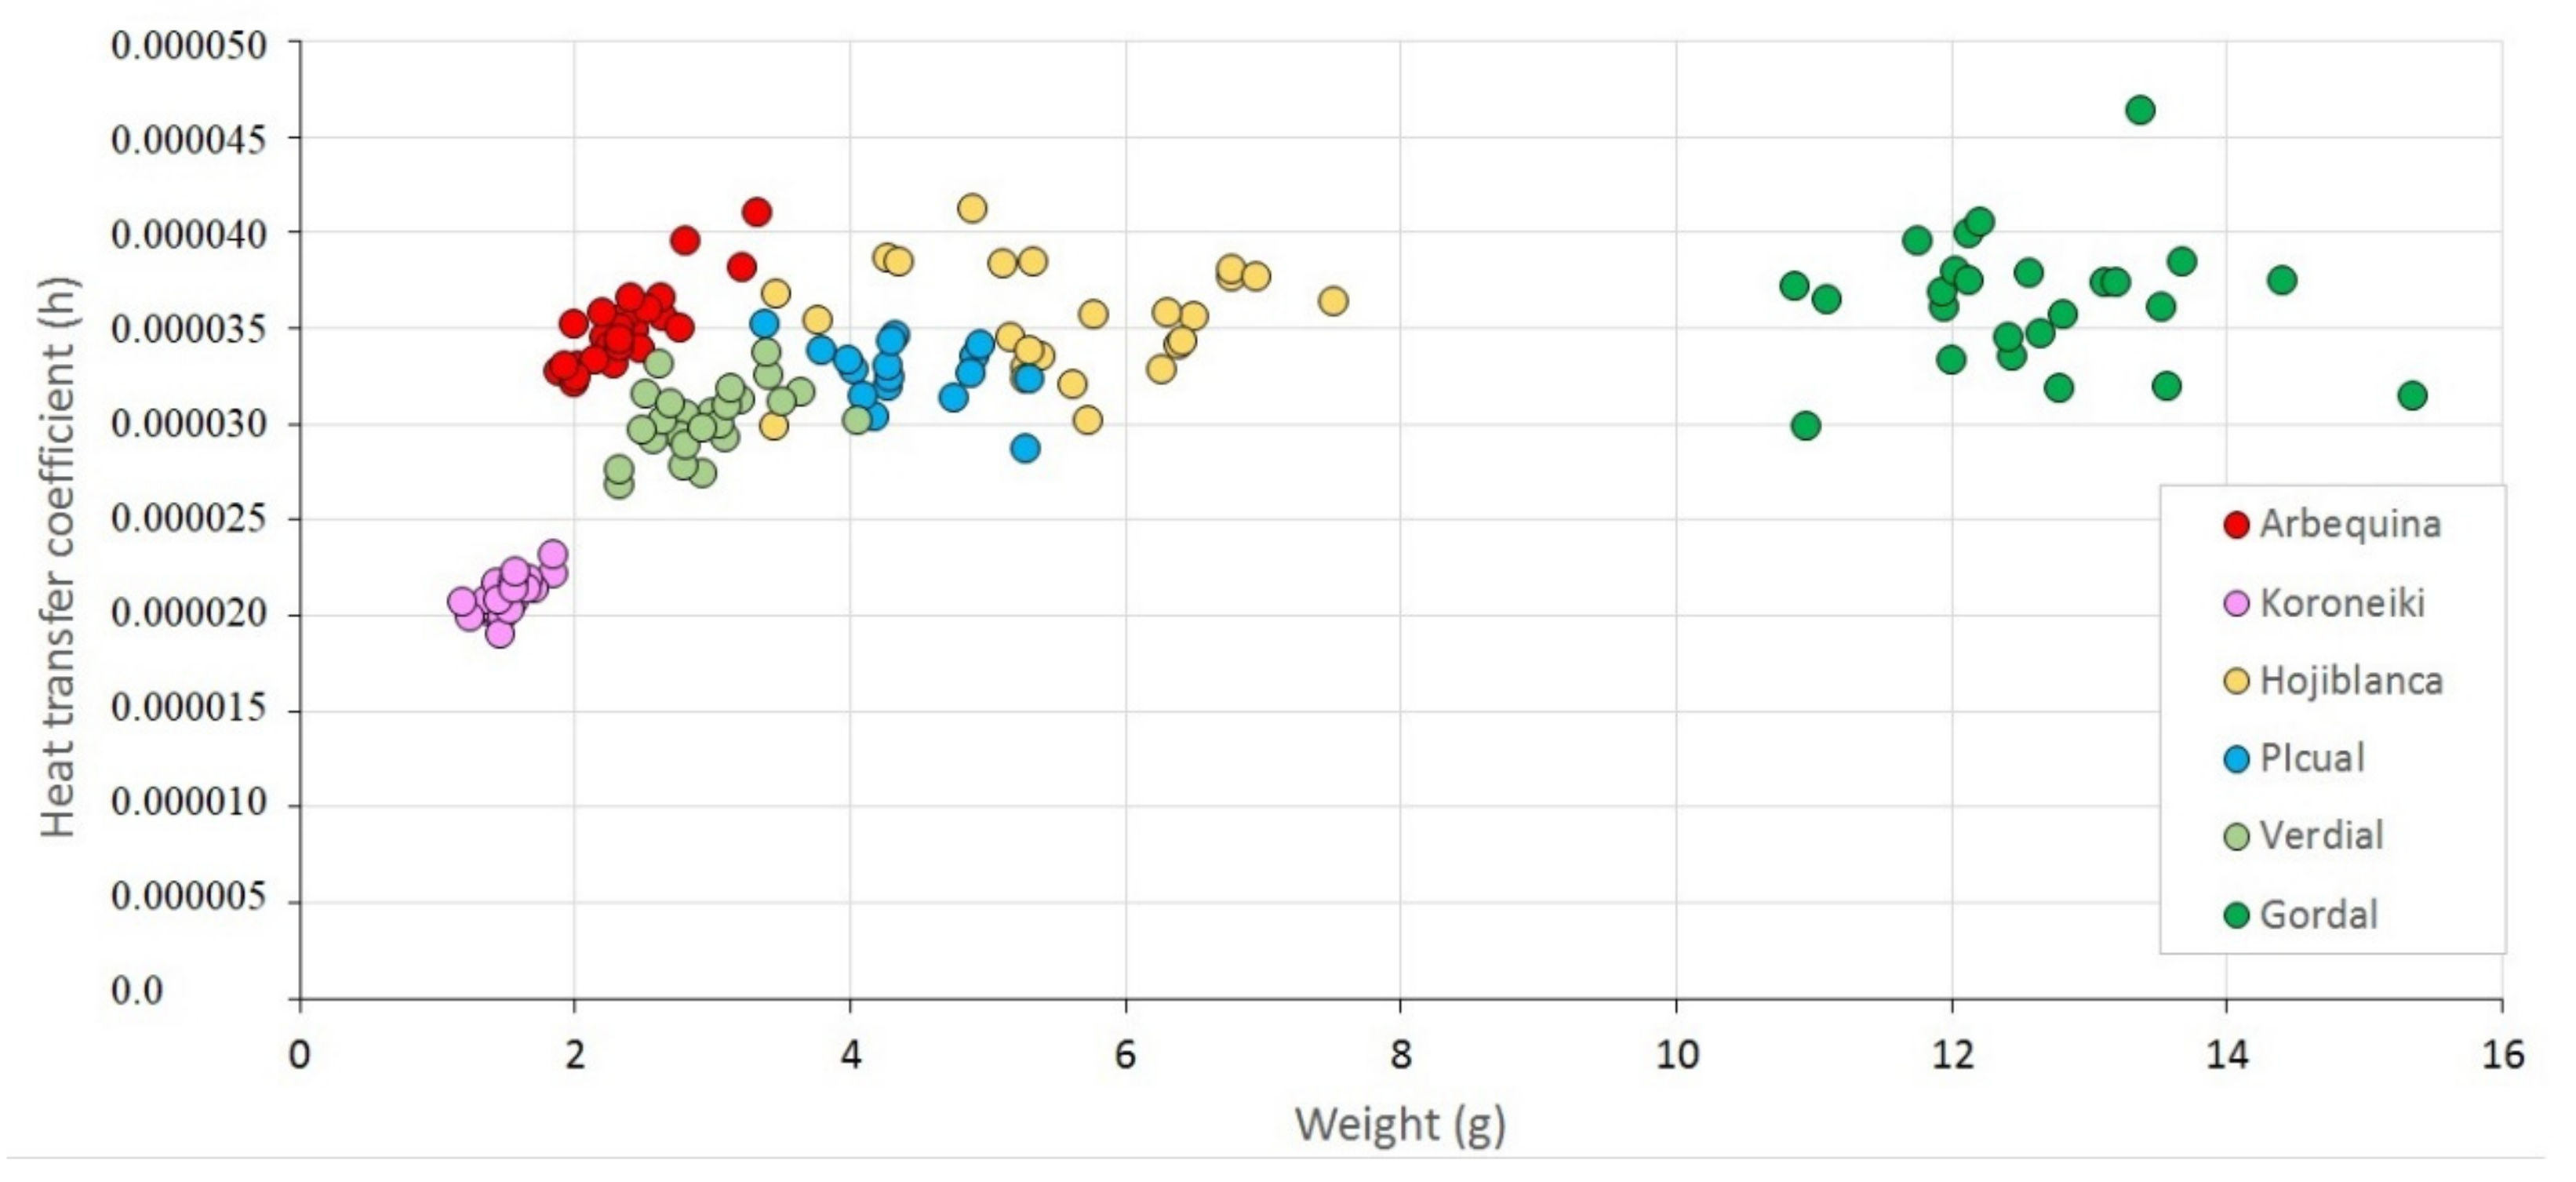
3.3. Influence of Cooling Rate with the Biometrical Data

Plotting the weight of each olive against its corresponding calculated cooling rate showed the nonlinear relationship between both parameters (Figure 4). The best fit curve (n = 150) was a logarithmic relationship (Equation (15)) with a R² of 0.93. The plotting of the absolute values of the CR revealed that the difference between the extreme values of the calculated CR mounted to almost four-fold. The dispersion of the weights of the Gordal cultivar, situated between 10.9 and 15.4 g did not lead to a great variation in CR, in a range between 0.00010 and 0.00015 °C/°C s. The batch of the Koroneiki cultivar, with weights within the range of 1.2 and 1.8 g all fell between a CR range of 0.00030 and 0.00038 °C/°C s.
CR   = 0.001   ln   weight + 0.004
The relationship between the surface area (S) and the CR was linear (Equation (16)) (R² = 0.93) (Figure 5). As can be observed, the steady increase in the calculated surface area went along with a steady decrease in CR. The difference of 14 mm2 within the batch of Koroneiki cv corresponded to a variation in the CR of 0.0005 °C/°C s; while in the case of the Gordal cv, the surface area span amounted to 37.5 mm² and a variation of 0.0008 °C/°C s.
CR   = 0.000002   Surface + 0.0054
When the SSA was plotted against the CR, the distribution followed a sigmoidal function (Figure 6). The best fit curve turned out to be a Boltzmann curve with a high correlation (R² = 0.92). The values for the Gordal and Koroneiki cvs came forward as the horizontal maximum and minimum asymptotes, respectively. While the rest of the studied samples were situated in the incrementing part of the curve, the values for Gordal were situated at the lower end of the curve, and the ones of the Koroneiki cv at the upper end. It was also remarkable that the values for the Arbequina and Verdial batches greatly overlapped each other for SSA, although the mean CR of the former was significantly higher (Table 2).
The flattening of the curve on both extremes indicated that the obtained CR values on these ends were stabilizing and that more extreme values on both sides were expected to result in a CR within the observed range. To explain this flattening, the influence of the heat transfer coefficient (h) was observed (Equation (14)), where the CR only remained constant with a lower SSA and a lower calculated h when the Cp was equally lower. In the case of the Koroneiki, the lightest fruit, it was assumed that the specific stone/flesh ratio directly influenced the Cp of the individual fruit. The calculated Cp of the fruit was based on its chemical composition and was the average of the flesh and stone fraction. However, the chemical composition of a pit is different from its flesh composition and more equivalent to hardwood with a prominence of cellulose and lignin. When the Cp for nuts is taken as a reference, it can be assumed that the Cp for the pit will be around 2.2 kJ/kg °C, clearly far below the calculated Cp for olive fruit, at 3.6 kJ/kg °C. The results did not differ from those calculated for other varieties [29]. In the case of small fruits, as the Koroneiki cultivar, the lowering of the SSA coincided with a higher weight for pit fraction in the overall Cp, resulting in a lower final value and a stabilized CR.
The Biot number expresses the ratio of the internal resistance of conduction to the external resistance of convection. In the case of the heavier cultivar Gordal, it can be hypothesized that the CR was no longer determined only through convection (assuming an equal temperature distribution within the fruit and a consequential low Biot number) but that the internal conduction heat flow became more prominent as a supplementary resistance. The more this conduction resistance increases, the slower the increase in the overall CR will become, even when the value of h remains the same. It thus seems more than plausible that an increase in the Biot number (Figure 7) did explain the flattening of the CR-curve when the weight of the fruit increased (Figure 4) and the SSA decreased (Figure 6).
Ref. [28] calculated a Biot number of 4.43 using water as the transfer medium for an olive that weighed 10.44 g, which is an extreme weight for olive fruit. When Biot number is less than 0.1, the internal resistance is considered to be negligible in comparison to the surface resistance and it is assumed that the material or produce heats or cools down uniformly. As the values for h are medium-dependent, the obtained Biot number is not valid when considering a pre-cooling treatment with cooled air [30]. Submerging picked olives into a cooled solution of diluted lye is a recognized treatment to avoid bruise damage for table olives, but when dealing with fruit for oil extraction, contact with water before storage is not recommended as it prompts deterioration and even fermentation processes [31].

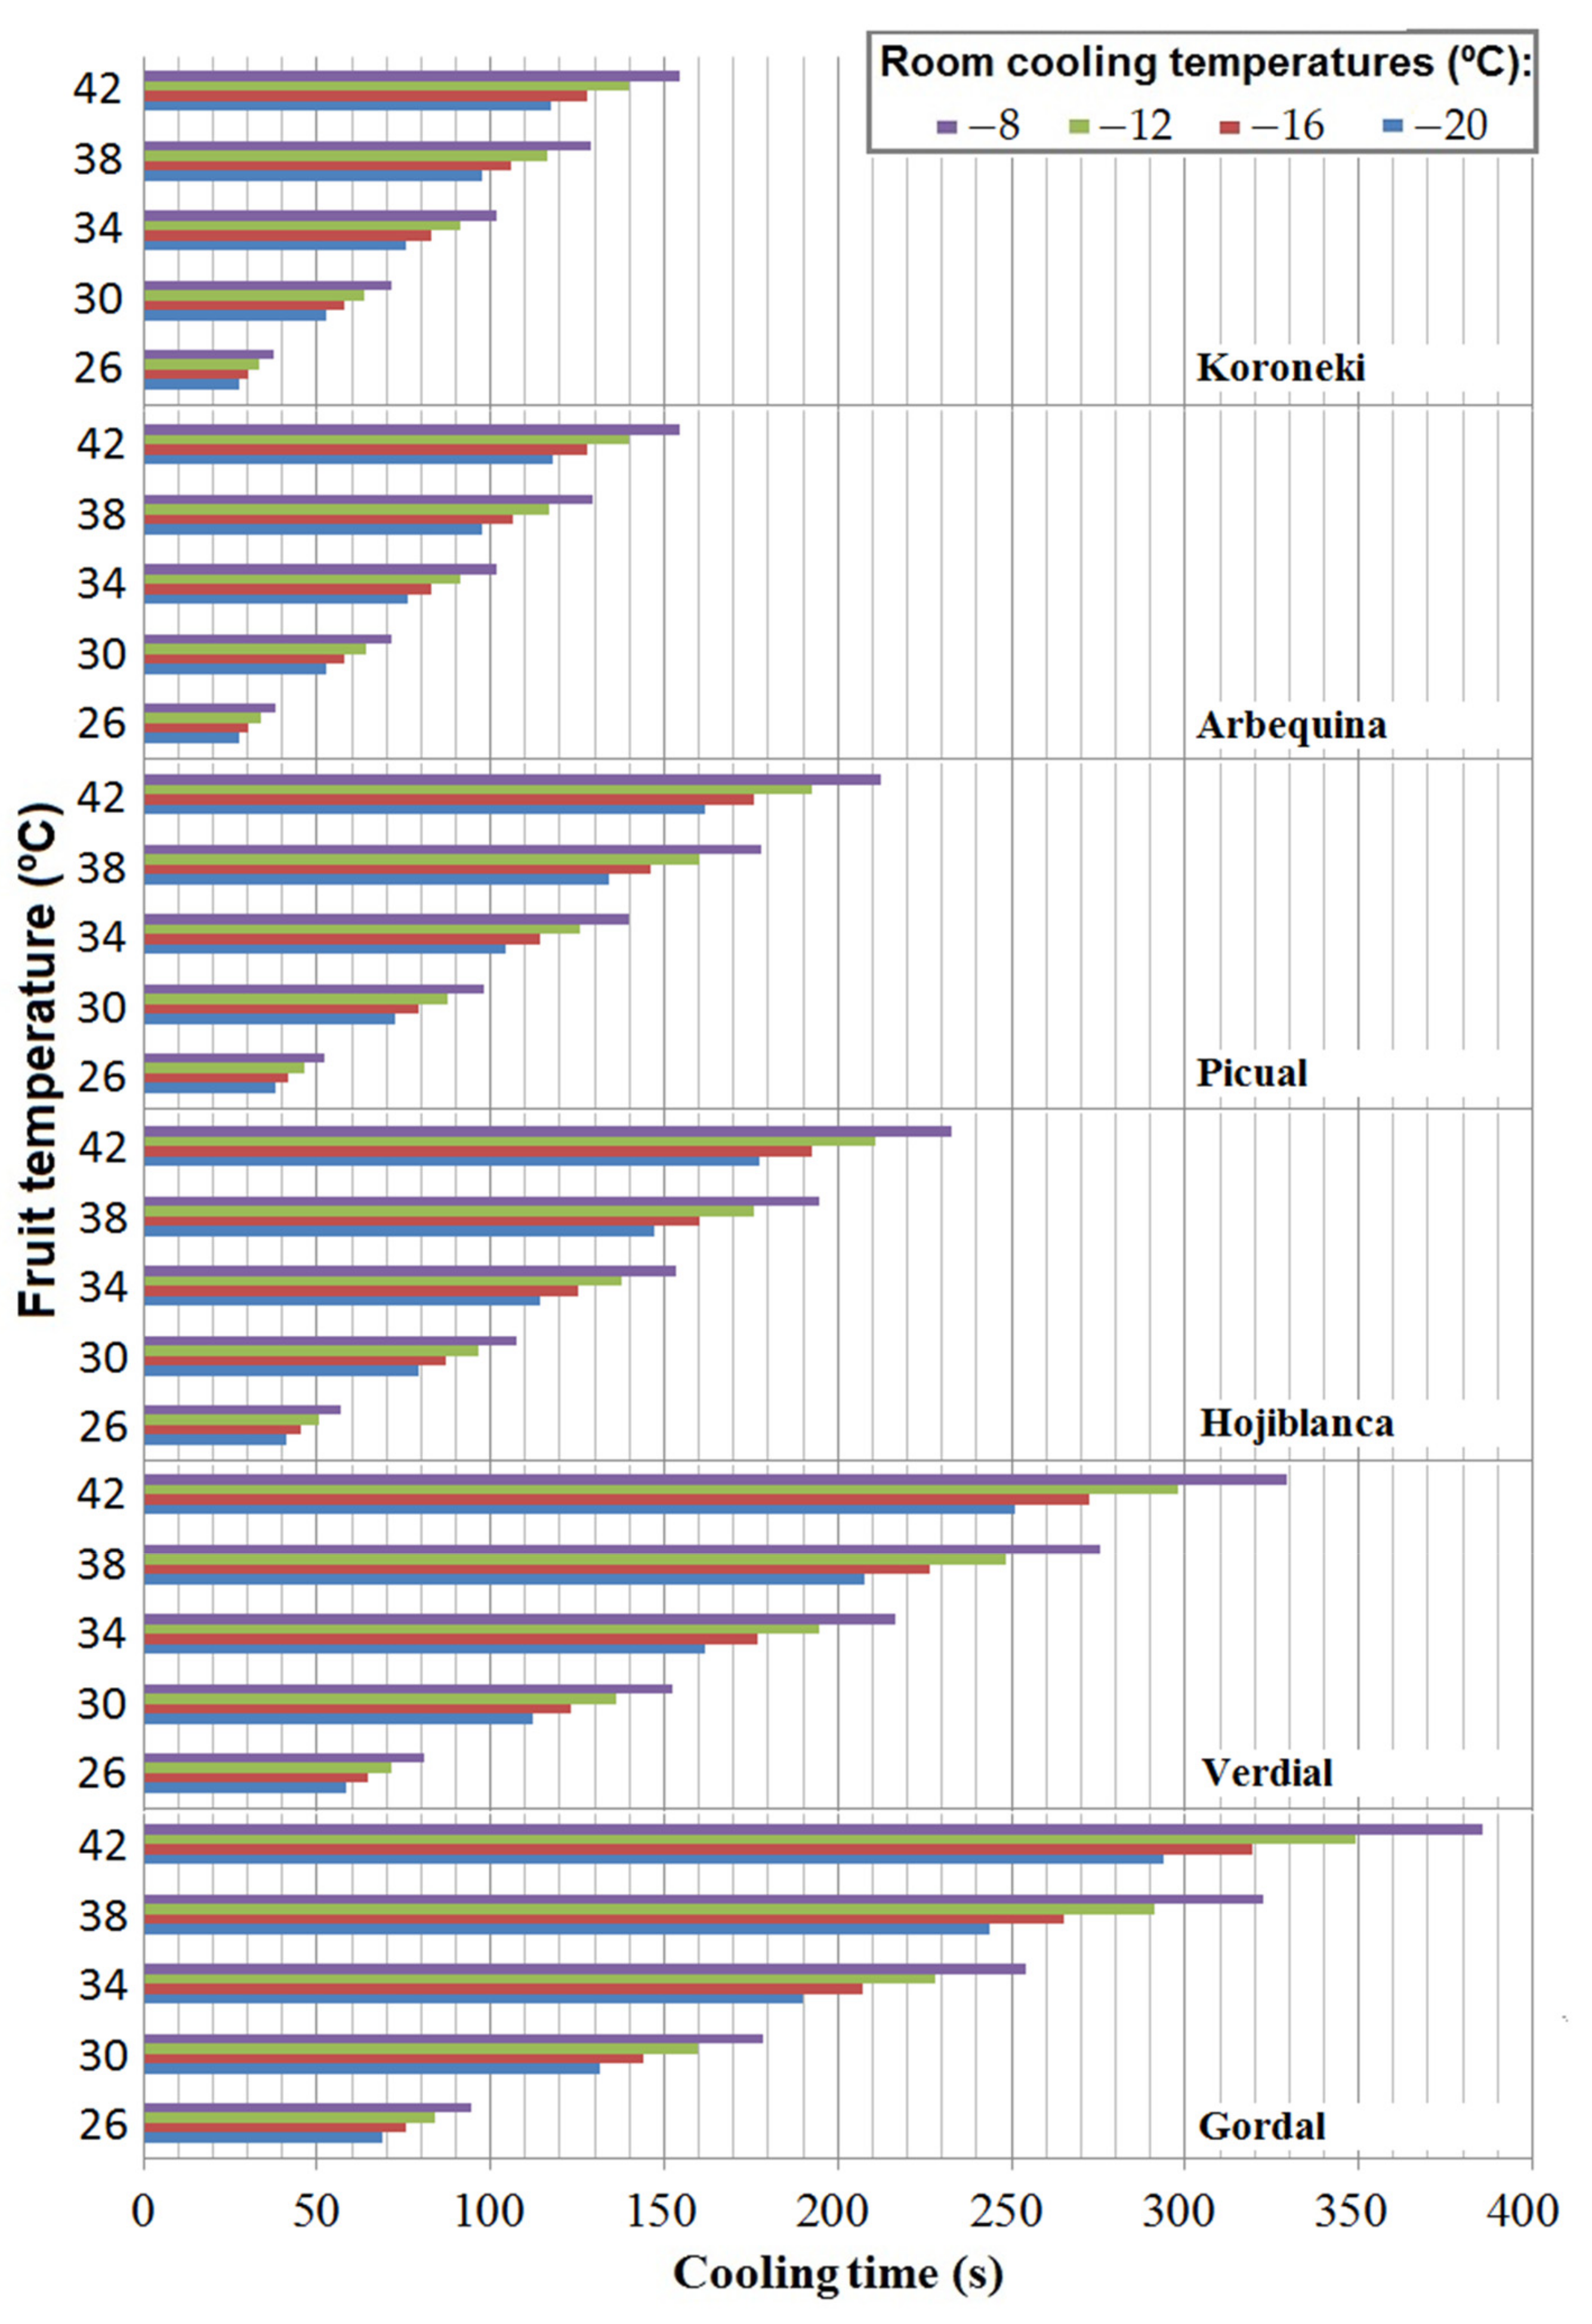
3.4. Simulation of Cooling Time

The obtained results served to calculate half the cooling time (z) of the olives of each of the different cultivars (Table 2). The mean values for the studied cultivars ranged between 198 s (Arbequina) and 571 s (Gordal) and divided them into three separate groups in the same way as the case for the calculated cooling rate. Figure 8 shows the time estimated by Equation (11) to cool the individual fruit to 22 °C in different simulated conditions of initial temperature and room temperatures. The results illustrated the differences within and between the different varieties. As expected, the cooling time increased as the difference between the initial fruit and the room temperature increased. The simulation further revealed that with higher fruit temperatures, the impact of room temperature on cooling time increased.
The results for the Arbequina and Koroneiki cultivars are similar and indicate that fruit with a field temperature of 38 °C would attain a temperature of 22 °C when kept in an environment of −12 °C for less than 2 min. In the case of Hojiblanca and Picual cvs., the cooling time under these conditions increased to less than 3 min. Finally, the heavier Verdial and Gordal varieties, needed up to 5 min to cool down to the desired temperature. The simulation indicated that a relatively short time of cooling sufficed to bring the olive fruit to the desired temperature. As the calculations were performed under room temperatures, the impact of forced air was not considered. The experiment of [32] indicated that applying forced air at 2 l∙s−1∙kg−1 in a vertically directed cooling reduced the half-cooling time by more than three-fold in the case of carrots and strawberries. It can thus be estimated that applying forced air to the olive fruit will significantly reduce the required cooling time.
The temperature increases which take place in the field due to climate change [33] can reduce fruit yield and affect other characteristics of the fruit, bringing forward the harvesting period by up to 30 days [34] with an increase in the temperature of harvested fruit. New strategies are introduced to bring the field heat within acceptable limits like nocturnal harvesting which are implemented on high density plantations. However, this solution does not solve the problem when the harvest continues during the day, and at the same time, it can have environmental side effects on fauna, which have already caused its official ban in several Spanish regions [35].
The results shown in Figure 8 demonstrate the technical feasibility to produce a pre-cooling of the individual fruit before its industrial processing to maintain high quality of the final product. The empirical study provided a result that is directly related to the systemic characteristics of the fruit and provides reliable upper and lower limits under realistic conditions. However, in this work the simulated conditions for cooling have been conducted on individual fruits, which represents a significant contribution to similar cooling, such as cold tunnels. Further studies should be done to study these effects in fruits stored in bulk, as it seems that the importance of mass transfer and relative humidity have more important effects on cooling than other parameters such as the skin transfer coefficient [36]. Knowing that an increase in air speed will reduce the cooling time, a cooling tunnel can be introduced as a viable solution to removing excess heat from the field quickly without compromising the quality of the fruit. The results obtained serve to design the operation of application type. In this or other cooling systems, a mechanism to monitor the desired final temperature would be the most appropriate solution, although it adds technical and economic complexity. A simple and useful alternative is to estimate the time needed for cooling, knowing the variety and initial temperature of the fruit.

4. Conclusions

The applied method made it possible to obtain reliable data which served to determine the cooling process of the fruit of six different olive cultivars. The empirical study exposed specific associations between the biometrical and biothermal characteristics of the fruit of the cultivars. The calculated cooling rates revealed a non-linear relationship between the specific surface area and the cooling rate of an olive, suggesting that underlying factors need to be taken into account when calculating the specific heat of the fruit. To explain the observed flattening on both sides of the curve, further research is needed to clarify the influence of the stone when dealing with a small olive fruit, as well as the increased Biot number for heavier olives. Based on the calculated cooling rates, several simulations were performed to simulate the time necessary to cool isolated olive fruit under well-defined conditions. It is reported that a relatively short time is needed to cool the fruit to a desirable temperature when placed in a cold air environment. Although further research is needed to discard negative impacts on the fruit, the obtained results are useful for the development and the introduction of new techniques based on cooled air. The results can be useful for developing a cooling application for individual fruits, such as a cooling tunnel, based on the knowledge of the fruit temperature and cv-dependent features.

Author Contributions

Conceptualization: E.P. and J.M.G.; Methodology: E.P., J.M.G., and M.C.F.: Formal Analysis: E.P. and R.R.S.-G.; Resources: J.M.G. and M.C.F.; Writing: E.P., J.M.G., M.C.F. and R.R.S.-G. All authors have read and agreed to the published version of the manuscript.

Funding

This research received no external funding.

Institutional Review Board Statement

Not applicable.

Informed Consent Statement

Not applicable.

Data Availability Statement

Not applicable.

Conflicts of Interest

The authors declare no conflict of interest.

References

  1. Fraga, H.; Pinto, J.G.; Santos, J.A. Climate change projections for chilling and heat forcing conditions in European vineyards and olive orchards: A multi-model assessment. Clim. Chang. 2019, 152, 179–193. [Google Scholar] [CrossRef]
  2. Mihailescu, E.; Soares, M.B. The Influence of Climate on Agricultural Decisions for Three European Crops: A Systematic Review. Front. Sustain. Food Syst. 2020, 4, 64. [Google Scholar] [CrossRef]
  3. Lorite, I.; Gabaldón-Leal, C.; Ruiz-Ramos, M.; Belaj, A.; De La Rosa, R.; León, L.; Santos, C. Evaluation of olive response and adaptation strategies to climate change under semi-arid conditions. Agric. Water Manag. 2018, 204, 247–261. [Google Scholar] [CrossRef]
  4. Cabezas, J.; Ruiz-Ramos, M.; Soriano, M.; Gabaldón-Leal, C.; Santos, C.; Lorite, I. Identifying adaptation strategies to climate change for Mediterranean olive orchards using impact response surfaces. Agric. Syst. 2020, 185, 102937. [Google Scholar] [CrossRef]
  5. Galán, C.; García-Mozo, H.; Vázquez, L.; Ruiz, L.; De La Guardia, C.D.; Trigo, M.M. Heat requirement for the onset of the Olea europaea L. pollen season in several sites in Andalusia and the effect of the expected future climate change. Int. J. Biometeorol. 2005, 49, 184–188. [Google Scholar] [CrossRef] [PubMed]
  6. Garcia-Mozo, H.; Oteros, J.; Galan, C. Phenological changes in olive (Ola europaea L.) reproductive cycle in southern Spain due to climate change. Ann. Agric. Environ. Med. 2015, 22, 421–428. [Google Scholar] [CrossRef] [Green Version]
  7. Gabaldón-Leal, C.; Ruiz-Ramos, M.; De La Rosa, R.; León, L.; Belaj, A.; Rodríguez, A.; Santos, C.; Lorite, I.J. Impact of changes in mean and extreme temperatures caused by climate change on olive flowering in southern Spain. Int. J. Climatol. 2017, 37, 940–957. [Google Scholar] [CrossRef]
  8. Sola-Guirado, R.R.; Ceular-Ortiz, D.; Gil-Ribes, J.A. Automated system for real time tree canopy contact with canopy shakers. Comput. Electron. Agric. 2017, 143, 139–148. [Google Scholar] [CrossRef]
  9. Sola-Guirado, R.R.; Aragon-Rodriguez, F.; Castro-Garcia, S.; Gil-Ribes, J. The vibration behaviour of hedgerow olive trees in response to mechanical harvesting with straddle harvester. Biosyst. Eng. 2019, 184, 81–89. [Google Scholar] [CrossRef]
  10. Connor, D.J.; Gómez-Del-Campo, M.; Rousseaux, M.C.; Searles, P.S. Structure, management and productivity of hedgerow olive orchards: A review. Sci. Hortic. 2014, 169, 71–93. [Google Scholar] [CrossRef]
  11. Rallo, L.; Barranco, D.; De La Rosa, R.; Leon, L. New olive cultivars and selections in Spain: Results after 25 years of breeding. Acta Hortic. 2018, 1199, 21–26. [Google Scholar] [CrossRef]
  12. Caponio, F.; Gomes, T.; Summo, C.; Pasqualone, A. Influence of the type of olive-crusher used on the quality of extra virgin olive oils. Eur. J. Lipid Sci. Technol. 2003, 105, 201–206. [Google Scholar] [CrossRef]
  13. Biedermann, M.; Bongartz, A.; Mariani, C.; Grob, K. Fatty acid methyl and ethyl esters as well as wax esters for evaluating the quality of olive oils. Eur. Food Res. Technol. 2008, 228, 65–74. [Google Scholar] [CrossRef]
  14. Jabeur, H.; Zribi, A.; Abdelhedi, R.; Bouaziz, M. Effect of olive storage conditions on Chemlali olive oil quality and the effective role of fatty acids alkyl esters in checking olive oils authenticity. Food Chem. 2015, 169, 289–296. [Google Scholar] [CrossRef] [PubMed]
  15. Di Serio, M.G.; Giansante, L.; Di Loreto, G.; Faberi, A.; Ricchetti, L.; Di Giacinto, L. Ethyl esters versus fermentative organoleptic defects in virgin olive oil. Food Chem. 2017, 219, 33–39. [Google Scholar] [CrossRef]
  16. Jiménez, M.R.; Casanova, L.; Suárez, M.P.; Rallo, P.; Morales-Sillero, A. Internal fruit damage in table olive cultivars under superhigh-density hedgerows. Postharvest Biol. Technol. 2017, 132, 130–137. [Google Scholar] [CrossRef]
  17. Dourou, A.-M.; Brizzolara, S.; Meoni, G.; Tenori, L.; Famiani, F.; Luchinat, C.; Tonutti, P. The inner temperature of the olives (cv. Leccino) before processing affects the volatile profile and the composition of the oil. Food Res. Int. 2020, 129, 108861. [Google Scholar] [CrossRef] [PubMed]
  18. Veneziani, G.; Esposto, S.; Taticchi, A.; Urbani, S.; Selvaggini, R.; Di Maio, I.; Sordini, B.; Servili, M. Cooling treatment of olive paste during the oil processing: Impact on the yield and extra virgin olive oil quality. Food Chem. 2017, 221, 107–113. [Google Scholar] [CrossRef]
  19. García, J.M.; Gutiérrez, F.; Barrera, M.J.; Albi, M.A. Storage of Mill Olives on an Industrial Scale. J. Agric. Food Chem. 1996, 44, 590–593. [Google Scholar] [CrossRef]
  20. Kiritsakis, A.; Nanos, G.D.; Polymenopulos, Z.; Thomai, T.; Sfakiotakis, E.M. Effect of fruit storage conditions on olive oil quality. J. Am. Oil Chem. Soc. 1998, 75, 721–724. [Google Scholar] [CrossRef]
  21. Clodoveo, M.; Delcuratolo, D.; Gomes, T.; Colelli, G. Effect of different temperatures and storage atmospheres on Coratina olive oil quality. Food Chem. 2006, 102, 571–576. [Google Scholar] [CrossRef]
  22. Kalua, C.M.; Bedgood, D.R.; Bishop, A.G.; Prenzler, P.D. Changes in Virgin Olive Oil Quality during Low-Temperature Fruit Storage. J. Agric. Food Chem. 2008, 56, 2415–2422. [Google Scholar] [CrossRef] [PubMed]
  23. Gowen, A.; Tiwari, B.; Cullen, P.; McDonnell, K.; O’Donnell, C. Applications of thermal imaging in food quality and safety assessment. Trends Food Sci. Technol. 2010, 21, 190–200. [Google Scholar] [CrossRef]
  24. Chen, Q.; Zhang, C.; Zhao, J.; Ouyang, Q. Recent advances in emerging imaging techniques for non-destructive detection of food quality and safety. TrAC Trends Anal. Chem. 2013, 52, 261–274. [Google Scholar] [CrossRef]
  25. Guzmán, E.; Baeten, V.; Pierna, J.A.F.; García-Mesa, J.A. Determination of the olive maturity index of intact fruits using image analysis. J. Food Sci. Technol. 2015, 52, 1462–1470. [Google Scholar] [CrossRef] [PubMed] [Green Version]
  26. ASHRAE. Chapter 9: Methods of Precooling Fruits and Vegetables. In American Society of Heating, Refrigeration and Air-Conditioning Engineers (ASHRAE) Handbook; ASHRAE Research: Peachtree Corners, GA, USA, 2006. [Google Scholar]
  27. Barranco, D.; Fernandez-Escobar, R.; Rallo, L. El Cultivo del Olivo, 6th ed.; Ediciones Mundi-Prensa: Madrid, Spain, 2008. [Google Scholar]
  28. Cuesta, F.; Alvarez, M. Mathematical modeling for heat conduction in stone fruits. Int. J. Refrig. 2017, 80, 120–129. [Google Scholar] [CrossRef]
  29. Al-Widyan, M.I.; Rababah, T.M.; Mayyas, A.; Al-Shbool, M.; Yang, W. Geometrical, thermal and mechanical properties of olive fruits. J. Food Process. Eng. 2010, 33, 257–271. [Google Scholar] [CrossRef]
  30. Wang, S.; Tang, J.; Cavalieri, R. Modeling fruit internal heating rates for hot air and hot water treatments. Postharvest Biol. Technol. 2001, 22, 257–270. [Google Scholar] [CrossRef]
  31. Vichi, S.; Boynuegri, P.; Caixach, J.; Romero, A. Quality losses in virgin olive oil due to washing and short-term storage before olive milling. Eur. J. Lipid Sci. Technol. 2015, 117, 2015–2022. [Google Scholar] [CrossRef]
  32. Edeogu, I.; Feddes, J.; Leonard, J. Comparison between vertical and horizontal air flow for fruit and vegetable precooling. Can. Agric. Eng. 1997, 39, 107–112. Available online: https://www1.agric.gov.ab.ca/$department/deptdocs.nsf/all/agdex3973/$FILE/736-14.pdf (accessed on 15 December 2020).
  33. Arenas-Castro, S.; Gonçalves, J.F.; Moreno, M.; Villar, R. Projected climate changes are expected to decrease the suitability and production of olive varieties in southern Spain. Sci. Total Environ. 2020, 709, 136161. [Google Scholar] [CrossRef] [PubMed]
  34. Benlloch-González, M.; Sánchez-Lucas, R.; Bejaoui, M.A.; Benlloch, M.; Fernández-Escobar, R. Global warming effects on yield and fruit maturation of olive trees growing under field conditions. Sci. Hortic. 2019, 249, 162–167. [Google Scholar] [CrossRef]
  35. Boletín Oficial de la Junta de Andalucía. Resolución de 15 de Junio de 2020, de la Dirección General de Medio Natural, Biodiversidad y Espacios Protegidos, por la que se Suspende en La Temporada 2020–2021 La Recogida Nocturna de Aceituna en Olivares Superintensivos. BOJA 2020, 123, 598–602. [Google Scholar]
  36. Becker, B.R.; Misra, A.; Fricke, B.A. Bulk refrigeration of fruits and vegetables. Part II: Computer algorithm for heat loads and moisture loss. Int. J. HVAC&R Res. 1996, 2, 215–230. [Google Scholar]
Figure 1. Thermographic camera located in the freezing chamber with a batch of 25 olives. Delineation of the olive measurement area.
Agriculture 11 00164 g001
Figure 2. Evolution of the fruit temperature of 6 samples of olive fruit (n = 25) placed in a freezing chamber at −17 °C (±1 °C). Vertical bars represent ± 1 SD of the mean values.
Agriculture 11 00164 g002
Figure 3. Semi-logarithmic cooling rate curve of 6 different samples of olives. Each point represents the mean of 25 residual temperature ratios.
Agriculture 11 00164 g003
Figure 4. Correlation between weight (g) and cooling rate (°C/s) of different olive cultivars (n = 150).
Agriculture 11 00164 g004
Figure 5. Correlation between surface area (mm) and cooling rate (°C/s) of different olive cultivars (n = 150).
Agriculture 11 00164 g005
Figure 6. Correlation between specific surface area (mm²/g) and cooling rate (°C/s) of different olive cultivars (n = 150).
Agriculture 11 00164 g006
Figure 7. Correlation between the weight (g) and the convection heat transfer coefficient (h) of different olive cultivars (n = 150).
Agriculture 11 00164 g007
Figure 8. Cooling time needed to bring the olive fruit of 6 different cultivars down to 22 °C, when cooled at different room cooling temperatures (−8, −12, −16, −20 °C) and at different initial temperatures (26, 30, 34, 38, 42 °C). Half the cooling time (z) is calculated from the empirically constructed cooling curves of 25 olives from each cultivar.
Agriculture 11 00164 g008
Table 1. Biometrical data, moisture and oil contents, and specific heat (Cp) of six different cultivars (n = 25) of olives.
CultivarWeight
(g)
Height
(mm)
Width
(mm)
Surface
(mm²)
Specific Surf.
Area
(mm²/g)
Moisture Content (%)Oil
Content
(%) *
Specific Heat
(J/kg °C)
Arbequina2.38 ± 0.37 e*16.0 ± 0.8 e15.6 ± 0.8 b80.4 ± 4.2 e 332.6 ± 17.5 b 64.6 16.7 (47.2) 3.343
Koroneiki1.50 ± 0.16 f17.0 ± 0.8 e12.8 ± 0.6 85.1 ± 3.9 e 421.2 ± 14.7 a 65.1 15.7 (45.0) 3.356
Hojiblanca5.52 ± 1.09 b24.6 ± 2.3 bc20.1 ± 1.1 b123.0 ± 11.4 bc 269.2 ± 20.9 d 58.8 17.5 (42.5) 3.194
Picual4.40 ± 0.48 c23.5 ± 1.2 c18.3 ± 0.7 c117.3 ± 6.2 c 287.6 ± 13.3 c 58.3 21.8 (52.2) 3.181
Verdial2.95 ± 0.42 d21.3 ± 1.2 d16.2 ± 0.8 b106.7 ± 6.2 d 344.2 ± 18.8 b 47.1 25.8 (48.9) 2.875
Gordal12.60 ± 1.04 a33.1 ± 1.7 a24.7 ± 1.3 a165.6 ± 8.5 a 184.0 ± 9.1 e 63.1 16.5 (47.1) 3.306
Each value for biometrical data is the mean ± SD. Values followed by different letters are significantly different according to the post-hoc Tamhane test (p < 0.05). * Values for oil content are given for fresh fruit and dry material (between brackets).
Table 2. Cooling Rate (CR) and half cooling time (z) of six different samples of olives for different ambient temperatures (Ta) (freezing chamber average), and initial temperature of the fruit (Ti).
CultivarCooling Rate (°C/min)Half Cooling Time (s)
Arbequina0.19 ± 0.01 a198 ± 12 c
Koroneiki0.20 ± 0.01 a200 ± 19 c
Hojiblanca0.13 ± 0.02 b327 ± 43 b
Picual0.15 ± 0.01 b247 ± 18 b
Verdial0.18 ± 0.01 c481 ± 32 a
Gordal0.08 ± 0.01 c571 ± 56 a
Values are mean and SD. For each variable, values followed by different letters are significantly different according to the post-hoc Tamhane test (p < 0.05).
Publisher’s Note: MDPI stays neutral with regard to jurisdictional claims in published maps and institutional affiliations.

